")
Back to Journals » Cancer Management and Research » Volume 12
Effective Inhibition of MYC-Amplified Group 3 Medulloblastoma Through Targeting EIF4A1
Authors Zhao Y , Li T, Tian S, Meng W, Sui Y, Yang J, Wang B, Liang Z, Zhao H, Han Y, Tang Y , Zhang L , Ma J
Received 8 September 2020
Accepted for publication 10 November 2020
Published 3 December 2020 Volume 2020:12 Pages 12473—12485
DOI https://doi.org/10.2147/CMAR.S278844
Checked for plagiarism Yes
Review by Single anonymous peer review
Peer reviewer comments 3
Editor who approved publication: Dr Ahmet Emre Eşkazan
Yang Zhao,1,* Tiantian Li,2,* Shuaiwei Tian,1,* Wei Meng,1 Yi Sui,2 Jian Yang,1 Baocheng Wang,1 Zhuangzhuang Liang,1 Heng Zhao,1 Yipeng Han,1 Yujie Tang,1,2 Lei Zhang,2 Jie Ma1
1Department of Pediatric Neurosurgery, Xin Hua Hospital Affiliated to Shanghai Jiao Tong University School of Medicine, Shanghai, People’s Republic of China; 2Key Laboratory of Cell Differentiation and Apoptosis of the National Ministry of Education, Department of Pathophysiology, Shanghai Jiao Tong University School of Medicine, Shanghai, People’s Republic of China
*These authors contributed equally to this work
Correspondence: Jie Ma
Department of Pediatric Neurosurgery, Xin Hua Hospital Affiliated to Shanghai Jiao Tong University School of Medicine, 1665 Kongjiang Road, Yangpu District, Shanghai 200092, People’s Republic of China
Tel +86- 13818138498
Fax +86-21- 65795173
Email [email protected]
Lei Zhang
Key Laboratory of Cell Differentiation and Apoptosis of the National Ministry of Education, Department of Pathophysiology, Shanghai Jiao Tong University School of Medicine, 280 South Chongqing Road, Huangpu, Shanghai 200025, People’s Republic of China
Tel +86-13918539872
Fax +86-21-6415 4900
Email [email protected]
Purpose: In medulloblastoma (MB), group 3 (G3) patients with MYC amplification tend to exhibit worse prognosis, thus creating a need for novel effective therapies. As the driver and crucial dependency for MYC-amplified G3-MB, MYC has been proven to be a prospective therapeutic target. Here, we aimed to identify novel effective therapeutic strategies against MYC-amplified G3-MB via targeting MYC translation.
Materials and Methods: Major components of translation initiation complex eIF4F were subjected to MB tumor dataset analysis, and EIF4A1 was identified to be a potential therapeutic target of MYC-amplified G3-MB. Validation was performed through genetic or pharmacological approaches with multiple patient-derived tumor models of MYC-amplified G3-MB in vitro and in vivo. Underlying mechanisms were further explored by Western blot, quantitative real-time PCR and mass spectrometry (MS) analyses.
Results: MB tumor datasets analyses showed that EIF4A1 was significantly up-regulated in G3-MB patients relative to normal cerebella, positively correlated with MYC in G3-MB at transcriptional level and a crucial cancer dependency in MYC-amplified G3-MB cells. Targeting EIF4A1 with a CRISPR/Cas9 approach or small-molecule inhibitor silvestrol effectively attenuated growth in multiple preclinical models of MYC-amplified G3-MB via blocking proliferation and inducing apoptosis. Mechanistically, EIF4A1 inhibition effectively impeded MYC expression at translational level, and its potency was positively associated with MYC level. Whole-proteome MS analysis of silvestrol-treated cells further unveiled other biological functions and pathways influenced by EIF4A1 inhibition.
Conclusion: Our investigation shows that interrupting MYC translation by EIF4A1 inhibition could be a potential effective therapeutic approach when treating patients with MYC-amplified G3-MB.
Keywords: eIF4F complex, EIF4A1, MYC-amplified group 3 medulloblastoma, Silvestrol, translation inhibition
Introduction
Medulloblastoma (MB) is the most common malignant pediatric brain tumor. Current treatment of MB patients includes surgery, craniospinal radiation and high-dose chemotherapy. Despite these aggressive therapies, one-third of patients still succumb to their disease, and survivors suffer severe side effects, including cognitive deficits, endocrine disorders and increased incidence of secondary cancers later in life.1 Thus, more effective targeted therapy is imperative for MB.
Genomics-based tumor classification has been shown to help in predicting prognosis of MB and providing clues of candidate drivers and therapies.2 The current consensus is that there are four major subgroups of MB: WNT (Wingless type), SHH (Sonic hedgehog), group 3 (G3) and group 4 (G4).3 Among these, G3-MB patients with MYC amplification tend to exhibit the poorest prognosis.4,5 MYC has been demonstrated to be an oncogenic driver and essential cancer-dependent gene of MYC-amplified G3-MB,6,7 making it a promising therapeutic target. Pharmacologically targeting transcription factor MYC directly has been proven to be quite difficult. However, indirectly targeting MYC at transcription, translation or post-translation levels has recently shown promising efficacy against multiple MYC-driven tumor types including MYC-amplified G3-MB.8,9
Neoplasia often exhibits dysregulated mRNA translation. The eukaryotic translation initiation factor 4F (eIF4F) protein complex, which is composed of eIF4E, eIF4A and eIF4G, was found to be commonly dysregulated in many tumor types.10–14 Up-regulation of eIF4E is frequently involved in higher-grade tumor and poorer patient prognosis.15–17 Elevated eIF4A and eIF4G levels have been reported in hepatocellular and lung cancers, respectively.18–20 Overexpression of eIF4E could promote normal cell transformation into tumor cell, and forced expression of eIF4A accelerates tumor progression in an ALL (acute lymphocytic leukemia) mouse model.21,22
The eIF4F complex regulates cap-dependent mRNA translation initiation by assembling itself at the m7G cap structure of the messenger, with eIF4G serving as the scaffold, binding both cap-binding protein eIF4E and the RNA helicase eIF4A.13 The aberrant activity of the eIF4F complex in cancer often contributes to selective syntheses of proteins involved in tumor growth and metastasis.14 Therapeutic targeting of eIF4F complex has been widely studied in preclinical and clinical research,14 such as antisense oligonucleotides against eIF4E,23–25 inhibitors of interaction between eIF4E and 5′-mRNA-cap or eIF4G,26 and inhibitors against eIF4A.27,28 In particular, eIF4A inhibitors have displayed impressive anti-neoplastic effects, with efforts underway to improve their pharmacodynamics for clinical usage.13 Two molecules from the same class of flavaglines, silvestrol and rocaglamide have exhibited potent effects against eIF4A. Silvestrol binds free eIF4A protein, forms a stable ternary complex with sequence-specific mRNA and blocks the helicase activity of eIF4A, leaving an unchanged secondary structure behind and halting protein translation.22 Rocaglamide was reported to interrupt protein expression through clamping eIF4A onto polypurine sequences in mRNA without consuming ATP.29
Notably, MYC activation has been shown to be associated with deregulated eIF4F activity and its enhanced tumor dependency, making eIF4F inhibition a potential synthetic lethal therapeutic approach for MYC-activated cancer types.30 Moreover, MYC has been shown to be a critical target mediating the therapeutic effects of eIF4F inhibition against several cancer types.31,32 Thus, here we aimed to evaluate the potential of eIF4F inhibition in targeting MYC translation and treating MYC-amplified G3-MB.
Materials and Methods
Compounds and Cell Lines
Silvestrol (HY-13251) and rocaglamide (HY-19356) were purchased from MedChemExpress (MCE). D425, D458, MB002 and HD-MB03 cell lines were kindly provided by Professor Yoon-Jae Cho (Oregon Health & Science University). Human fetal neural stem cell line (hfNSC) was kindly provided by Dr. Michelle Monje (Stanford University, School of Medicine). Daoy was obtained from Cell Bank of Chinese Academy of Science (Shanghai, China). 293T was from our lab preservation. D425, D458, Daoy and 293T were cultured in Dulbecco’s modified Eagle’s medium/High glucose (DMEM, BI-01-052-1ACS, Biological Industries) supplemented with 10% FBS (fetal bovine serum, F2442, Sigma). MB002, HD-MB03 and hfNSC cell lines were cultured in Tumor Stem Media (TSM) comprising DMEM/F12 (11330032, Gibco), B27(-A) (12587010, Gibco), Neurobasal-A (10888022, Gibco), human EGF (20 ng/mL, 100–15, PeproTech, NJ, USA), human FGF-basic (20 ng/mL, 100–18B, PeproTech), human LIF (10 ng/mL, 300–05, PeproTech), 1 × Antibiotic-Antimycotic (15240062, Gibco) and 0.2% Heparin Solution (2 μg/mL, 07980, Stem Cell Technology).
Astrocytes were obtained from P1 neonatal mouse cortex. Tissue was dissociated into single cells by TrypLE (12604021, Gibco) at 37°C for 15 min. To remove the fibroblasts, cells were cultured in the uncoated dish for 30 min at 37°C, then astrocytes were transferred from the supernatant to a PDL-coated flask in DMEM supplemented with 1 × penicillin-streptomycin solution and 10% FBS. Granule neurons were obtained from the differentiated granule neuron precursors (GNPs). Cerebella from euthanized mice (P1) were dissociated into single cells by TrypLE for 15 min at 37°C. Then, 35%/65% gradient percoll solution was used to isolate GNPs. NB-B27 medium comprising 1 × B27 (-A), 1 mM sodium pyruvate, Neurobasal-A medium, 1% FBS, 1 × Antibiotic-Antimycotic, 1 mM glucose (Sigma), 1 mM KCl (Sigma) and 2 mM L-glutamine was used to induce GNPs to differentiate into granule neurons in the 0.1% matrigel-coated 96-well plate (354230, BD) for 3–5 days.
All cell lines used in this work have been approved by the ethics committee of the Shanghai Jiao Tong University School of Medicine; meanwhile, all MB cell lines used (D425/D458/MB002/Daoy/HD-MB03) have been proved by STR (Short Tandem Repeat) analyses (data not shown).
Datasets Analyses and Statistics
Gene dependencies of components of eIF4F complex in different G3-MB cell lines were denoted by corrected CERES (Computational correction of copy-number effect in CRISPR-Cas9 essentiality screens) score obtained from the DepMap project (https://figshare.com/articles/DepMap_Achilles_19Q1_Public/7655150). A smaller negative number implies more essential effect on cell survival.
All normal- or patient-derived microarray-based gene expression data from different publications (Pomeroy,4 U133P233–35 and Cavalli36) were obtained via R2 (Genomics Analysis and Visualization Platform, https://hgserver1.amc.nl/cgi-bin/r2/main.cgi). Among these, dataset U133P2 was directly merged with 3 datasets (Roth,33 Pfister,35 and Gilbertson4), which used the same testing flatform (U133P2) followed by the same normalization method (MAS5.0). Comparisons of single gene expression were carried out between normal cerebella and MB subgroups in Pomeroy and U133P2 datasets. Data from each group were firstly subjected to either Shapiro–Wilk test (3 ≤ n ≤ 50) or D’Agostino and Pearson test (50 < n ≤ 1000) for normality assessment. Significance of differentially expressed gene levels (log2 transformed) among normally distributed groups was evaluated by Brown–Forsythe and Welch ANOVA tests, followed by Dunnett’s T3 multiple comparisons tests (against the normal control). For comparisons between groups (at least one group did not pass Gaussian distribution test), either Mann–Whitney test or Kruskal–Wallis test followed by Dunn’s multiple comparisons test (against the normal control) was used.
Simple linear regression was employed to evaluate correlation coefficient between 2 genes’ expression within G3 subgroup from the Cavalli dataset (containing no normal control samples). The values of correlation coefficient R were obtained from the website of R2 directly on queries.
Other routine statistical analyses were performed as mentioned in figure legends. All statistical analyses were conducted via GraphPad Prism (Version 8; La Jolla, California).
Cell Proliferation, Apoptosis and Viability Assays
Cell proliferation was measured with the Click-iT EdU Alexa Fluor 647 Flow Cytometry Assay Kit (C10640, Invitrogen, CA, USA). Cells were treated with drug for 20 h and incubated with 10 μM EdU for 8 h. The positive degree of EdU represents the proliferating cell quantity.
Cell apoptosis was measured using the Annexin V-FITC Apoptosis Detection Kit I (556547, BD Biosciences, CA, USA). Cells were treated with drug for 48 h and exposed to 1 mg/mL DAPI (D9542, Sigma) and Annexin V. FACS analyses were performed by the BD Fortessa FACS machine (BD Biosciences, CA, USA), and collected data were processed by FlowJo software (FlowJo, LLC, OR, USA).
For cell viability assays, cells were plated in 96-well plates in triplicate (5000 cells/well). After drug treatment, cells were then subjected to Celltiter Glo assay (G7571, Promega, WI, USA) for cell viability measurement. A Synergy H4 Hybrid Reader (BioTek, Winooski, VT, USA) was used to collect the data.
Western Blot, RNA Extraction and Quantitative Real-Time PCR
Whole cell lysates were obtained from samples lysed with RIPA buffer (50 mM Tris, pH 7.5, 150 mM NaCl, 1% Nonidet P-40, 0.5% sodium deoxycholate and 0.1% sodium dodecyl sulfate) containing 1 μM protease inhibitor PMSF (93482, Sigma). Protein concentration was determined by Pierce™ Bicinchoninic Acid (BCA) Protein Assay Kit (23225, Thermo Fisher Scientific) according to the manufacturer’s protocol. Equal amounts of protein were loaded for Western blot analysis with the following primary antibodies: c-MYC (1:1000, 5605S, Cell Signaling Technology), OTX2 (1:1000, 13497-1-AP, ProteinTech), EIF4A1 (1:1000, 2490s, Cell Signaling Technology) and TUBB (1:5000, ab6046, Abcam).
Total RNA was extracted using TRI Reagent (TR118, MRC) according to the manufacturer’s instructions. Reverse transcription of total RNA was performed with High Capacity cDNA Reverse Transcription Kit (4368813, Thermo Fisher Scientific). Quantitative PCR analysis was performed on Fast Real-time PCR System (ABI, 7900HT) with FastStart Universal SYBR Green Master (ROX) (04913850001, Roche). The qPCR primers are listed in supplementary Table 1.
Plasmid Construction, Lentivirus Preparation and Infection
MYC-expressing plasmid pCDH-CMV-cMYC-EF1-Puro and the corresponding empty vector were courtesy of Dr. Michelle Monje and Professor Jinke Cheng (Shanghai Jiao Tong University School of Medicine), respectively. Complementary oligo pairs containing shRNA seed sequences against MYC mRNA were annealed and cloned into TRC2-pLKO-puro vector (Sigma). Similarly, complementary oligo pairs containing sgRNA spacers against EIF4A1 were annealed and cloned into lentiCRISPR V2 vector (Plasmid #52961, Addgene). Lentivirus was produced by co-transfection of 293T cells with packaging vectors psPAX2 and pMD2.G. Lentiviral particles within culture medium were harvested, concentrated by PEG 6000, resuspended in PBS, then directly added into cell culture for infection. The shRNA- and sgRNA-related oligo sequences are listed in supplementary Table 1.
Patient-Derived Xenografts and Bioluminescence Imaging of Mice
In vivo experimental procedures were approved by the Experimental Animal Care Committee of Shanghai Jiao Tong University School of Medicine, following the guidelines provided in ‘Guide for the Care and Use of Laboratory Animals’ (National Academy Press, USA). D425 cells were infected with either sgEIF4A1 or sgCon lentivirus and stereotactically injected into the cerebella of nude mice (2 mm below the dura at a location 2 mm right of the midline and 2 mm posterior of the bregma). Three days after injection, tumor-bearing mice were prepared for bioluminescence imaging (BLI) and twice a week from that day on. For preparation, mice were intraperitoneally injected D-luciferin (40902ES01, YEASEN, Shanghai, China) and isoflurane-anesthetized for bioluminescence signal acquisition (Xenogen IVIS, PerkinElmer, Waltham, MA, USA).
Proteome Analysis
MS sample preparation, data acquisition, protein identification and quantitation were performed by Jingjie PTM BioLab (Hangzhou) Co. Ltd (China). Briefly, drug-treated cell pellets were sonicated in lysis buffer (8 M urea, 1% Protease Inhibitor Cocktail). Cleared supernatant was collected by centrifugation at 12,000g at 4°C for 10 min.
For digestion, the BCA-quantitated protein solution was reduced (5 mM dithiothreitol, 30 min at 56°C) and alkylated (11 mM iodoacetamide, 15 min at room temperature (RT)) in the dark. Then the protein sample was mixed with 100 mM triethylammonium bicarbonate (TEAB) to dilute urea (under 2 M). Trypsin was used at 1:50 and 1:100 (m/m, trypsin:protein) for overnight- and 4 h-digestion sequentially.
Peptide was then desalted (by Strata X C18 SPE column (Phenomenex)), vacuum-dried, dissolved in 0.5 M TEAB and labeled by TMT (Tandem Mass Tag) following manufacturer’s instruction. Peptide mixtures were incubated with TMT reagent (1 unit) in acetonitrile (2 h at RT), desalted, vacuum-centrifuge dried, dissolved in 0.1% formic acid and loaded onto a reverse-phase column (L/I.D.: 15 cm/75 μm). The subsequent HPLC and NSI-MS/MS acquisition and protein database searching procedures have been detailed previously.37 Related proteomic data in this work have been deposited in the Integrated Proteome Resources (iProX)38 with identifier IPX0002538000/PXD022014.
Protein quantitation data obtained from above were submitted to the R package named DEP39 (Differential Enrichment analysis of Proteomics data, v.1.10.0) installed in R (v.4.0.2) for differential analysis. All related R-based analyses were performed in an RStudio (v.1.3.959) environment. Briefly, expression data of proteins presented in at least one sample were kept for background correction and vsn (variance stabilizing transformation) normalization. Together with function MinProb-imputed missing values (q = 0.01), they underwent protein-wise linear models combined with empirical Bayes statistic test (by function test_diff using limma (https://www.bioconductor.org/packages/release/bioc/html/limma.html)). Heatmap of deregulated proteins (values of cutoff: absolute log2 (fold change) > 1.2, p < 0.01) in all four samples was plotted by the R package pheatmap (v.1.0.12) against normalized log2 intensity processed from above.
Gene symbols of these deregulated proteins were then sent to Molecular Signatures Database (https://www.gsea-msigdb.org/gsea/msigdb/annotate.jsp) for on-line Gene Sets analysis. Briefly, the gene symbol list of either down- or up-regulated proteins was used as input to compute GO biological process (BP)/canonical pathways (KEGG overlapping with REACTOME) gene sets enrichment with FDR q-value less than 0.05, respectively. Top-hit items were plotted against their negative log10 transformed FDR.
Results
Tumor Dataset Analyses Identify EIF4A1 as a Potential Therapeutic Target of MYC-Amplified G3-MB
MYC normally turns over rapidly via the ubiquitin-proteasome pathway. After phosphorylation by GSK3β, it is targeted by the E3 ubiquitin ligase SCF-FBXW7 for degradation.40 To measure the stability of MYC in MYC-amplified MB, three patient-derived MYC-amplified MB lines (D425, MB002 and HD-MB03) were treated with global translation inhibitor cycloheximide (CHX, 50 μg/mL) for different times (0/2/4/8/24 hours) and then subjected to immunoblot analysis. As shown in Figure 1A, MYC protein dropped to nearly undetectable within 2 hours of CHX exposure in all three lines, whereas OTX2, another hallmark transcription factor and oncogenic driver of MYC-amplified G3-MB,41 decreased much more slowly. These data confirmed the low stability of MYC protein and implied the therapeutic potential of targeting MYC translation in MYC-amplified MB. Next, we checked the cancer dependencies of EIF4E, EIF4A and EIF4G, the major components of eukaryotic translation initiation complex eIF4F, in publicly available whole-genome CRISPR/Cas9 functional genomic screening datasets of MYC-amplified or up-regulated G3-MB lines (D283, D341, D425 and D458).42 The corrected CERES scores of EIF4A1 were the lowest in all 4 MYC-amplified G3-MB cell lines presented in DepMap dataset (Version 19Q1), indicating this subunit of eIF4F complex exhibited strongest cancer dependency (Figure 1B). Moreover, we explored the differential expression of these genes and their correlations with MYC in publicly available MB tumor datasets, including in the Pomeroy dataset (Figure 1C, supplementary Figure 1A), U133P2 dataset (Figure 1D, supplementary Figure1B) and Cavalli dataset (Figure 1E, supplementary Figure 1D). Our results revealed that EIF4A1 was the only eIF4F component gene that exhibited not only significantly higher expression level in G3-MB compared to normal control (Figure 1C and D, supplementary Figure 1A–C) but also robust positive correlation with MYC in G3-MB (R = 0.614) (Figure 1E, supplementary Figure 1D). Kaplan–Meier analysis further showed that EIF4A1-high MB patients tended to exhibit worse prognosis compared to EIF4A1-low ones (Supplementary Figure 1E). Taken together, we hypothesized that EIF4A1 could be a promising therapeutic target for treating MYC-amplified G3-MB.
 |
Figure 1 MYC is highly correlated with EIF4A1 in G3-MB. (A) Western blots for MYC and OTX2 in G3-MB cell lines D425, MB002 and HD-MB03 treated with 50 μg/mL cycloheximide (CHX) for increasing time as denoted. TUBB was served as loading control. (B) The dependency showed by corrected CERES scores of genes constituting eIF4F complex in 4 G3-MB cell lines. The box plots showed the comparison of the log2 transformed mRNA expression levels of eIF4F complex major members between normal cerebella and different MB subtypes in dataset Pomeroy (n = 199) (C) or U133P2 (n = 305) (D). (E) Scatterplots for the expression correlation of MYC with different subunits of eIF4F complex of MB patients in Cavalli dataset (n = 763). ns, non-significant; *p < 0.05; **p < 0.01; ***p < 0.001; ****p < 0.0001. Statistical tests used here are detailed in Materials and Methods. |
Genetic Targeting of EIF4A1 Inhibits Growth of MYC-Amplified G3-MB in vitro and in vivo
To validate the above-mentioned hypothesis, we went on to test whether genetic targeting EIF4A1 could inhibit growth of preclinical tumor models of MYC-amplified G3-MB in vitro and in vivo. We targeted EIF4A1 by CRISPR-Cas9 approach in both D425 and D458 cells. Our results showed that knockout of EIF4A1 in both MYC-amplified MB lines significantly slowed down their growth in vitro (Figure 2A and B). Moreover, nude mice orthotopically xenografted with EIF4A1-knockout D425 cells showed significantly elongated survival (p = 0.0324) and reduced tumor sizes compared to the ones of sgCon group (Figure 2C–E). These data demonstrated the importance of EIF4A1 for growth of MYC-amplified MB in vitro and in vivo, confirming its potential as a therapeutic target.
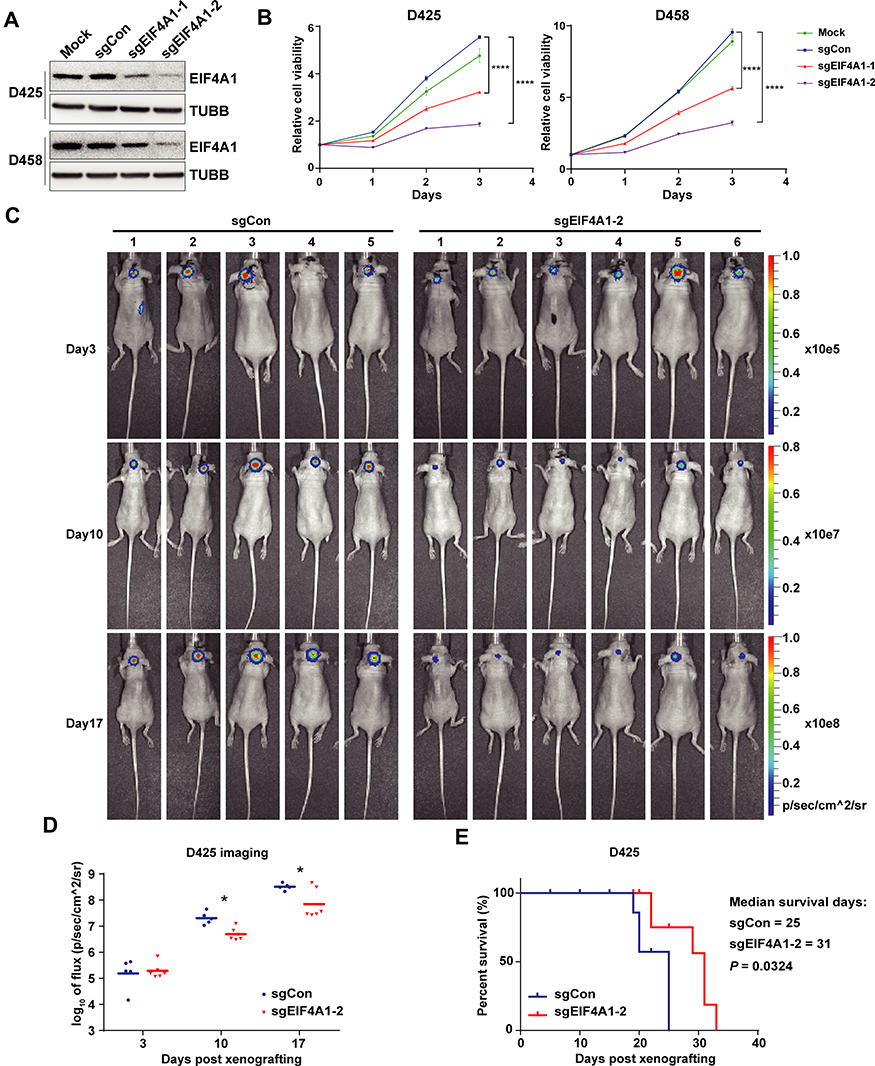 |
Figure 2 Knocking out EIF4A1 can inhibit MB cell proliferation in vitro and xenograft growth in vivo. (A and B) CRISPR/Cas9-mediated deletion of EIF4A1 inhibits growth of D425 or D458 cells in vitro. Western blot showed the knocking-out efficiencies of EIF4A1 with either sgRNA (A). Time course analyses were performed to detect the growth rates in both cell lines infected with different lentivirus as denoted (B). (C and D) sgCon- or sgEIF4A1-lentivirus-infected D425 cells were orthotopically inoculated into the cerebella of nude mice. BLI images of photon fluxes of brain tumors at different times are shown (C). The quantification of fluorescence fluxes in B was compared (D). The survival curves of tumor-bearing mice are shown (E). Mice implanted with sgEIF4A1-D425 displayed longer survival time with no effect on weight. Two-way ANOVA followed by Sidak’s multiple comparisons against sgCon was used to test the differential significance from cells harboring either sgEIF4A1 within 3 days. Family-wise significance and confidence level was set at 0.05 (95% confidence interval). Asterisk marks the significance between data points of the last day as indicated. ****, adjusted P value < 0.0001. Two-tailed Student’s t test was used for bioluminescence comparison. *, p < 0.05. Gehan–Breslow–Wilcoxon test was used for survival comparison. |
EIF4A Inhibitor Silvestrol Attenuates Growth of MYC-Amplified G3-MB in vitro Through Blocking Proliferation and Inducing Apoptosis
To further demonstrate the therapeutic effect of targeting EIF4A1 in MYC-amplified G3-MB, we tried exposing MYC-amplified G3-MB (D425, D458, HD-MB03 or MB002) and control normal neural cell lines (hfNSC, astrocyte or granule neuron) to two similar anti-eIF4A small-molecule inhibitors, silvestrol and rocaglamide, which could enhance the binding between eIF4A and RNA and subsequently sequester and deplete eIF4A from translation initiation complex.14,43 We found that the MYC-amplified G3-MB lines were more sensitive to either of the eIF4A inhibitors compared to control lines (Figure 3A). The inhibition by targeting eIF4A took place in a time- and dose-dependent manner (Figure 3B). Moreover, FACS analyses showed that silvestrol significantly induced cell apoptosis and suppressed cell proliferation when treating MYC-amplified G3-MB lines (Figure 3C and D). These results revealed that eIF4A inhibitor could effectively suppress growth of MYC-amplified G3-MB in vitro, supporting its potential therapeutic efficacy.
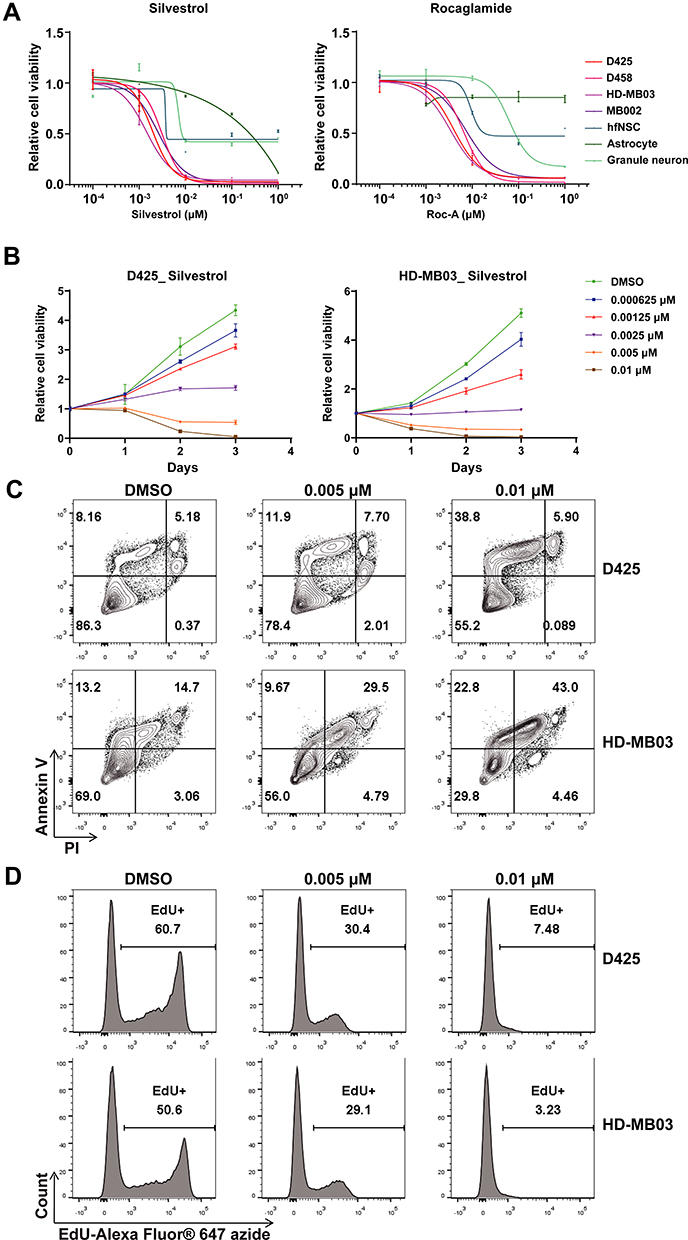 |
Figure 3 Validation of the inhibitory effects of eIF4A inhibitor silvestrol in MYC-amplified MB. (A) Dosage curves of different types of cells including normal cells and G3-MB cell lines treated with increasing doses of each eIF4A inhibitors. (B) Cell viability of D425 (left) or HD-MB03 (right) was detected after treating with different doses of eIF4A inhibitor silvestrol for indicated times. Apoptosis (C) and proliferation (D) of silvestrol-treated (0.005 or 0.01 µM) D425 or HD-MB03 cells were measured by FACS. All experiments were performed in triplicate and repeated at least three times. |
Silvestrol Effectively Inhibits MYC Translation, and MYC Amplification Contributes to Its Sensitivity
To explore the therapeutic mechanism of eIF4A inhibition against MYC-amplified G3-MB, we firstly measured the time-dependent changes of MYC protein levels of MYC-amplified G3-MB cells in response to CHX (20 μg/mL) or silvestrol (0.01 μM) within 24 hours. OTX2 and EIF4A1 were also tested in parallel as controls. Our results showed that only MYC was drastically down-regulated by silvestrol in all tested lines within 4 hours, and its inhibitory effects were nearly comparable to that of CHX (Figure 4A and B, Supplementary Figure 2A). Moreover, rocaglamide (R, 0.05 μM) was tested in parallel with silvestrol (S, 0.01 μM), and they were shown to exhibit similar inhibitory effects and selectivity across multiple MYC-amplified G3-MB lines (Figure 4C). RT-qPCR analyses further revealed that MYC transcript was actually significantly up-regulated upon eIF4A inhibitor treatment, confirming that their inhibitory effects took place at the protein level (Figure 4D). Together, these results verified that eIF4A inhibition exhibited potent and selective translation inhibition on MYC in MYC-amplified G3-MB.
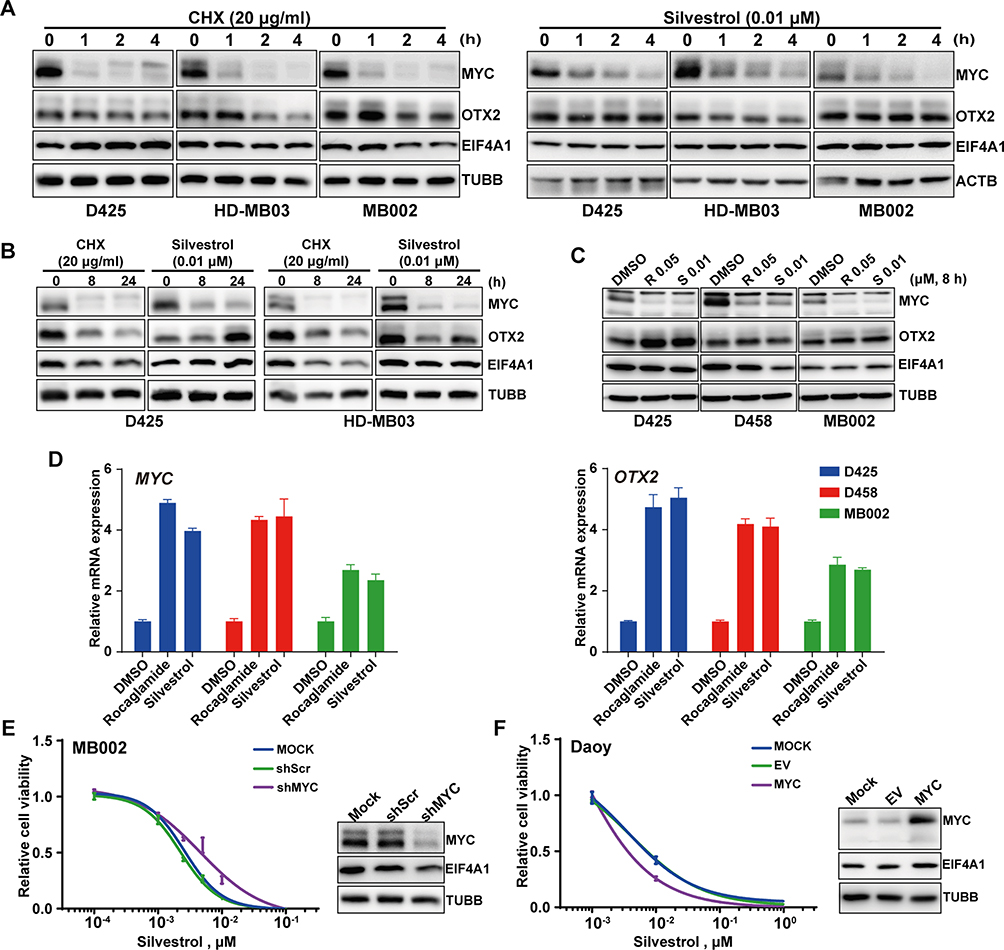 |
Figure 4 MYC plays an essential role in inhibition of MB treated with silvestrol. (A) Immunoblot was applied to detect the expression levels of MYC, OTX2 and EIF4A1 in D425, HD-MB03 and MB002 cells treated with silvestrol (0.01 µM) or CHX (20 µg/mL) for 0–4 h. (B) The same protein detection as in (A) was applied on D425 and HD-MB03 cells treated with the same drugs as in (A) for 0–24 h. (C) Immunoblot was applied to detect MYC, OTX2 and EIF4A1 expression in D425, D458 and MB002 cells treated with rocaglamide (R, 0.05 µM) or silvestrol (S, 0.01 µM). (D) Q-PCR for detecting mRNA levels of MYC in D425, D458 and MB002 cells treated with rocaglamide or silvestrol. Cell viability was detected in MB002 cells transfected with shMYC or scrambled shRNA (shScr) (E), or in Daoy cells overexpressing MYC or empty vector (EV) (F). Western blots for verification were present at the right, respectively. TUBB served as loading control in all above Western blotting experiments. |
To demonstrate the potential synthetic lethal relationship between MYC amplification and eIF4F dependency in MYC-amplified G3-MB, we tested the effect of modulating MYC expression levels on silvestrol sensitivity. MB002 cells transfected with shMYC or scrambled shRNA (shScr), or Daoy cells (a human MYC-low MB cell line) overexpressing MYC or empty vector (EV) were subjected to silvestrol dose–response measurements. The efficacy of MYC intervention in untreated MB002 or Daoy cells was presented (right panels, Figure 4E and F). Our results showed that knockdown of MYC in MB002 cells decreased its sensitivity to silvestrol (left panel, Figure 4E) whereas overexpression of MYC in Daoy cells had the opposite effect (left panel, Figure 4F), indicating that MYC activation contributed to the enhanced sensitivity of MYC-amplified G3-MB to eIF4A inhibition.
Whole-Proteome Analyses Identified Additional Biological Functions or Pathways Affected by EIF4A1 Inhibition in MYC-Amplified G3-MB Cells
To better understand the global response of MYC-amplified G3-MB to eIF4A inhibition, whole-cell lysates (WCL) of HD-MB03 cells treated with either DMSO or silvestrol (0.01 μM) for 20 h were subjected to proteomic-MS analyses (Figure 5A). As a quality control, part of the submitted WCLs of DMSO or silvestrol-treated HD-MB03 from 3 biological replicates was tested for protein levels of MYC, OTX2, EIF4A1 and TUBB, confirming the drug response (Figure 5B). As shown in Figure 5C, supplementary Table 2 and supplementary Table 3, proteomic analyses demonstrated a selective and potent inhibitory effect (220 significantly down-regulated proteins versus 77 significantly up-regulated proteins) of silvestrol on HD-MB03 proteome. When genes coding these significantly down-regulated proteins were evaluated in publicly available whole-genome CRISPR-Cas9 functional genomic screening datasets (from DepMap_19Q1) of MYC-amplified or up-regulated G3-MB lines, nearly 73% of them (160 out of 220) were found to be cancer-dependent genes (corrected CERES scores less than zero) in at least two out of four lines tested (Figure 5D, supplementary Table 4), suggesting their down-regulation could also mediate the therapeutic effects of silvestrol. We further performed gene ontology (GO) and pathway analyses of genes encoding the significantly down-regulated and up-regulated proteins respectively. The results showed that the enriched biological functions of down-regulated proteins were mostly related to cell cycle regulation, development, RNA polymerase II transcription, heat shock response and DNA repair (Figure 5E). Many of the down-regulated functions have been shown to be MYC targets in cancer, such as cell cycle control44 and transcriptional elongation during RNA polymerase II-directed transcription,45 suggesting the reduction of these proteins might result from the effective targeting of MYC via EIF4A1 inhibition. On the other hand, the enriched biological functions of up-regulated proteins were largely related to metabolism (branched-chain amino acids degradation, TCA cycle and fatty acid metabolism) and translation (Figure 5F). Many of these up-regulated biological processes have been shown to contribute to disease progression or drug resistance in other cancer types,14,46–50 suggesting that certain responsive compensation mechanisms might occur in response to eIF4A inhibition in MYC-amplified G3-MB.
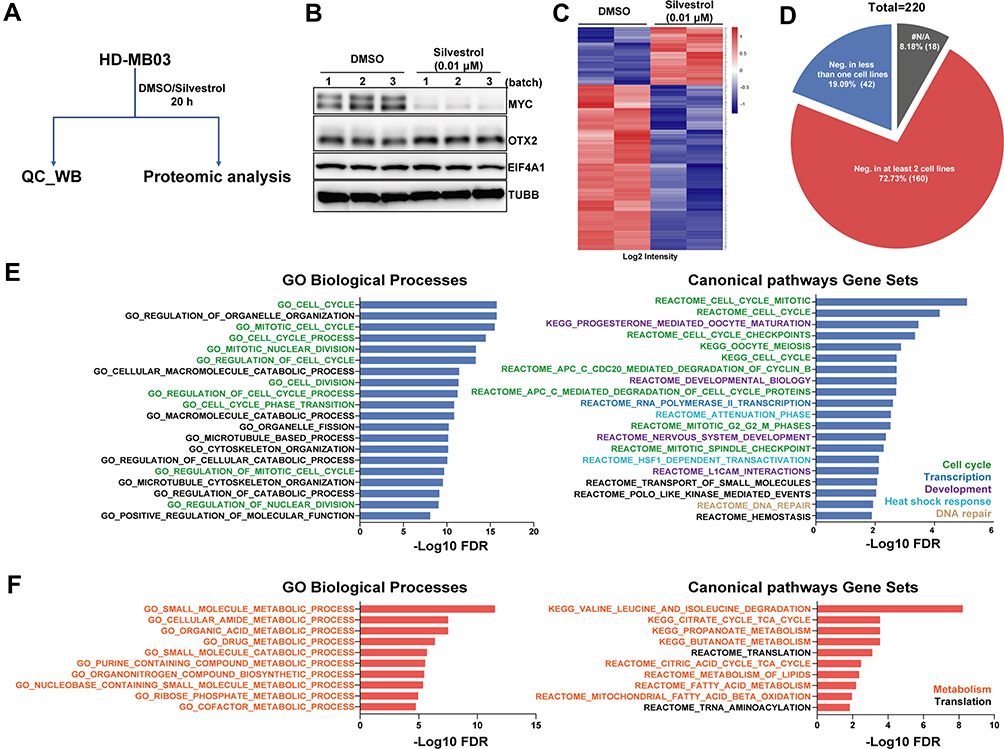 |
Figure 5 The proteome of G3-MB was modulated by treatment with silvestrol. (A) Working scheme: HD-MB03 cells treated with DMSO or silvestrol were sent for QC-WB or proteomic analysis simultaneously. (B) Western blot result of QC. (C) Heatmap of differentially expressed proteins obtained from proteomic analysis of HD-MB03 treated with silvestrol or its vehicle DMSO (log2FC > 1.2; p < 0.05). Corresponding corrected CERES scores (19Q1) of genes encoding those silvestrol-down-regulated proteins from four G3-MB cell lines (D283, D341, D425 and D458) were summarized in a pie chart as denoted (D), with negative score meaning essentiality or dependency on cell survival. #N/A, not applicable. The GO function analyses of genes down-regulated (E) or up-regulated (F) by silvestrol treatment were carried out in 3 categories titled above each of the panels. |
Discussion
MYC-amplified G3-MB represents the most aggressive form of MB and needs effective therapy most urgently. Targeting eIF4F translation initiation machinery has been shown as an effective therapeutic strategy against multiple MYC-activated tumor types, including lymphoma and colorectal cancer.30,31 In this study, we evaluated the therapeutic potential of eIF4F inhibition in treating MYC-amplified G3-MB. Our MB tumor dataset analyses and functional validation with CRISPR/Cas9 approach identified EIF4A1 as the most promising drug candidate among all the eIF4F complex subunits. Moreover, we showed that eIF4A inhibitors worked effectively on attenuating growth of multiple patient-derived tumor cell lines of MYC-amplified G3-MB via selectively blocking MYC translation. Thus, we demonstrated that targeting MYC translation by eIF4A inhibition could be an effective therapeutic strategy against MYC-amplified G3-MB. Unfortunately, the flavagline class of anti-EIF4A1 small-molecule inhibitors (silvestrol and rocaglamide) currently being widely used in research have not been convincingly proven to efficiently cross the blood–brain barrier (BBB). Therefore, strategies such as direct drug delivery into tumor regions with conventional-enhanced-delivery (CED) approach, molecule modification or reform of the current compounds are still needed to further translate our finding from bench-side to bedside.
In line with a previous study, whole-proteome analyses of silvestrol-treated MYC-amplified G3-MB cells found that targeting translation via eIF4A inhibitor could significantly down-regulate the transactivation activity of HSF1 and related heat shock response.51 Intriguingly, that study also showed that hyperactive translation in cancer cells could induce HSF1 transactivation to reprogram cancer transcriptome to support protein production in a positive feed-back way, including the modulation of cancer metabolism.51 Therefore, it would be interesting to further dissect the role of HSF1 in MYC-amplified G3-MB. Another attention-deserving pathway enriched in down-regulated proteins is DNA repair. Better outcome of treating MYC-amplified G3-MB might be achieved from combining usage of eIF4A inhibitor with radiotherapy and/or certain DNA-targeting chemotherapy. Even though neither EIF4A1 nor MYC was detected by TMT-labeled MS analyses, MAX and EIF4G1, the heterodimerizing partner of MYC during transcription activity52 and the scaffold molecule of eIF4F complex, were both found in significantly down-regulated proteins, further assuring the functional inhibition of MYC and eIF4F. Whole-proteome analyses also found that the top up-regulated functions by eIF4A inhibitor were BCAA metabolism, translation and fatty acid metabolism, which have been shown before to contribute to disease progression or drug resistance in other cancer types.14,46–50 Thus, combinatory targeting of eIF4A and one of the last two processes might work synergistically on treating MYC-amplified G3-MB.
A feed-forward regulatory loop leading to a synthetic lethal interaction has been proposed before to describe the relationship between MYC and the eIF4F complex in other tumor types.30 Similar results were obtained in our study. High MYC expression levels were found to contribute to the sensitivity of MB cells to eIF4A inhibitor (Figure 4F). Of note, the MYC gene family contains three members: MYC, MYCN and MYCL1. Activation of MYC gene family members via gene copy amplification or transcriptional up-regulation was commonly observed in MB.53 G3-MB is often associated with MYC amplification, and those ones without MYC amplification are often characterized by MYC up-regulation or MYCN amplification.54 SHH-MB and G4-MB are enriched with MYCN amplification, while MYCL1 amplification are only detected in a small number of SHH-MB patients.54 MYCN-amplification in SHH-MB often couples with TP53 mutation, and these patients had the worst prognosis in this subtype.53,54 Since MYC family members exhibit very similar characteristics, we speculate that eIF4A inhibition may also exhibit robust therapeutic effects on MB with MYCN or MYCL1 amplification. It would be interesting to test this hypothesis with appropriate patient-derived models of SHH-MB and G4-MB in future.
Acknowledgments
This study was supported by grants from the National Science Foundation of China (81702453 to Y.Z., 81702939 to Y.H., and 81572761, 81772655, 81972646 to Y.T.), Shanghai Science and Technology Committee (17411965700 to Y.Z., 17411951800 and 19411952100 to J.M.), Chinese Universities Scientific Fund, Shanghai Jiao Tong University (YG2015QN42 to Y.Z.), Shanghai “Rising Stars of Medical Talent“ Youth Development Program (HU Health Personnel [2019] No.72 to Y.Z.), Shanghai Shen Kang Hospital Development Center (16CR2031B to J.M.).
Disclosure
The authors declare that there are no conflicts of interest in this work.
References
1. Coluccia D, Figuereido C, Isik S, Smith C, Rutka JT. Medulloblastoma: tumor biology and relevance to treatment and prognosis paradigm. Curr Neurol Neurosci Rep. 2016;16(5):43. doi:10.1007/s11910-016-0644-7
2. Taylor MD, Northcott PA, Korshunov A, et al. Molecular subgroups of medulloblastoma: the current consensus. Acta Neuropathol. 2012;123(4):465–472. doi:10.1007/s00401-011-0922-z
3. Northcott PA, Korshunov A, Witt H, et al. Medulloblastoma comprises four distinct molecular variants. J Clin Oncol. 2011;29(11):1408–1414. doi:10.1200/JCO.2009.27.4324
4. Cho YJ, Tsherniak A, Tamayo P, et al. Integrative genomic analysis of medulloblastoma identifies a molecular subgroup that drives poor clinical outcome. J Clin Oncol. 2011;29(11):1424–1430. doi:10.1200/JCO.2010.28.5148
5. Grotzer MA, Hogarty MD, Janss AJ, et al. MYC messenger RNA expression predicts survival outcome in childhood primitive neuroectodermal tumor/medulloblastoma. Clin Cancer Res. 2001;7(8):2425–2433.
6. Pei Y, Moore CE, Wang J, et al. An animal model of MYC-driven medulloblastoma. Cancer Cell. 2012;21(2):155–167. doi:10.1016/j.ccr.2011.12.021
7. Kawauchi D, Robinson G, Uziel T, et al. A mouse model of the most aggressive subgroup of human medulloblastoma. Cancer Cell. 2012;21(2):168–180. doi:10.1016/j.ccr.2011.12.023
8. Mertz JA, Conery AR, Bryant BM, et al. Targeting MYC dependence in cancer by inhibiting BET bromodomains. Proc Natl Acad Sci U S A. 2011;108(40):16669–16674. doi:10.1073/pnas.1108190108
9. Bolin S, Borgenvik A, Persson CU, et al. Combined BET bromodomain and CDK2 inhibition in MYC-driven medulloblastoma. Oncogene. 2018;37(21):2850–2862. doi:10.1038/s41388-018-0135-1
10. Wang S, Darini C, Desaubry L, Koromilas AE. STAT1 promotes KRAS colon tumor growth and susceptibility to pharmacological inhibition of translation initiation factor eIF4A. Mol Cancer Ther. 2016;15(12):3055–3063. doi:10.1158/1535-7163.MCT-16-0416
11. Rivero-Hinojosa S, Lau LS, Stampar M, et al. Proteomic analysis of medulloblastoma reveals functional biology with translational potential. Acta Neuropathol Commun. 2018;6(1):48. doi:10.1186/s40478-018-0548-7
12. Oblinger JL, Burns SS, Huang J, et al. Overexpression of eIF4F components in meningiomas and suppression of meningioma cell growth by inhibiting translation initiation. Exp Neurol. 2018;299(Pt B):299–307.
13. Malka-Mahieu H, Newman M, Desaubry L, Robert C, Vagner S. Molecular pathways: the eIF4F translation initiation complex-new opportunities for cancer treatment. Clin Cancer Res. 2017;23(1):21–25. doi:10.1158/1078-0432.CCR-14-2362
14. Bhat M, Robichaud N, Hulea L, Sonenberg N, Pelletier J, Topisirovic I. Targeting the translation machinery in cancer. Nat Rev Drug Discov. 2015;14(4):261–278.
15. Li BD, Liu L, Dawson M, De Benedetti A. Overexpression of eukaryotic initiation factor 4E (eIF4E) in breast carcinoma. Cancer. 1997;79(12):2385–2390. doi:10.1002/(SICI)1097-0142(19970615)79:12<2385::AID-CNCR13>3.0.CO;2-N
16. Berkel HJ, Turbat-Herrera EA, Shi R, de Benedetti A. Expression of the translation initiation factor eIF4E in the polyp-cancer sequence in the colon. Cancer Epidemiol Biomarkers Prev. 2001;10(6):663–666.
17. Li Y, Fan S, Koo J, et al. Elevated expression of eukaryotic translation initiation factor 4E is associated with proliferation, invasion and acquired resistance to erlotinib in lung cancer. Cancer Biol Ther. 2012;13(5):272–280. doi:10.4161/cbt.18923
18. Shuda M, Kondoh N, Tanaka K, et al. Enhanced expression of translation factor mRNAs in hepatocellular carcinoma. Anticancer Res. 2000;20(4):2489–2494.
19. Bauer C, Diesinger I, Brass N, Steinhart H, Iro H, Meese EU. Translation initiation factor eIF-4G is immunogenic, overexpressed, and amplified in patients with squamous cell lung carcinoma. Cancer. 2001;92(4):822–829.
20. Comtesse N, Keller A, Diesinger I, et al. Frequent overexpression of the genes FXR1, CLAPM1 and EIF4G located on amplicon 3q26-27 in squamous cell carcinoma of the lung. Int J Cancer. 2007;120(12):2538–2544. doi:10.1002/ijc.22585
21. Lazaris-Karatzas A, Montine KS, Sonenberg N. Malignant transformation by a eukaryotic initiation factor subunit that binds to mRNA 5ʹ cap. Nature. 1990;345(6275):544–547. doi:10.1038/345544a0
22. Wolfe AL, Singh K, Zhong Y, et al. RNA G-quadruplexes cause eIF4A-dependent oncogene translation in cancer. Nature. 2014;513(7516):65–70. doi:10.1038/nature13485
23. Rinker-Schaeffer CW, Graff JR, De Benedetti A, Zimmer SG, Rhoads RE. Decreasing the level of translation initiation factor 4E with antisense RNA causes reversal of ras-mediated transformation and tumorigenesis of cloned rat embryo fibroblasts. Int J Cancer. 1993;55(5):841–847.
24. De Benedetti A, Joshi-Barve S, Rinker-Schaeffer C, Rhoads RE. Expression of antisense RNA against initiation factor eIF-4E mRNA in HeLa cells results in lengthened cell division times, diminished translation rates, and reduced levels of both eIF-4E and the p220 component of eIF-4F. Mol Cell Biol. 1991;11(11):5435–5445. doi:10.1128/MCB.11.11.5435
25. DeFatta RJ, Nathan CO, De Benedetti A. Antisense RNA to eIF4E suppresses oncogenic properties of a head and neck squamous cell carcinoma cell line. Laryngoscope. 2000;110(6):928–933. doi:10.1097/00005537-200006000-00007
26. Zochowska M, Piguet AC, Jemielity J, et al. Virus-like particle-mediated intracellular delivery of mRNA cap analog with in vivo activity against hepatocellular carcinoma. Nanomedicine. 2015;11(1):67–76. doi:10.1016/j.nano.2014.07.009
27. Malina A, Mills JR, Pelletier J. Emerging therapeutics targeting mRNA translation. Cold Spring Harb Perspect Biol. 2012;4(4):a012377. doi:10.1101/cshperspect.a012377
28. Bordeleau ME, Mori A, Oberer M, et al. Functional characterization of IRESes by an inhibitor of the RNA helicase eIF4A. Nat Chem Biol. 2006;2(4):213–220.
29. Iwasaki S, Floor SN, Ingolia NT. Rocaglates convert DEAD-box protein eIF4A into a sequence-selective translational repressor. Nature. 2016;534(7608):558–561. doi:10.1038/nature17978
30. Lin CJ, Nasr Z, Premsrirut PK, et al. Targeting synthetic lethal interactions between Myc and the eIF4F complex impedes tumorigenesis. Cell Rep. 2012;1(4):325–333. doi:10.1016/j.celrep.2012.02.010
31. Wiegering A, Uthe FW, Jamieson T, et al. Targeting translation initiation bypasses signaling crosstalk mechanisms that maintain high MYC levels in colorectal cancer. Cancer Discov. 2015;5(7):768–781. doi:10.1158/2159-8290.CD-14-1040
32. Pelletier J, Graff J, Ruggero D, Sonenberg N. Targeting the eIF4F translation initiation complex: a critical nexus for cancer development. Cancer Res. 2015;75(2):250–263. doi:10.1158/0008-5472.CAN-14-2789
33. Roth RB, Hevezi P, Lee J, et al. Gene expression analyses reveal molecular relationships among 20 regions of the human CNS. Neurogenetics. 2006;7(2):67–80. doi:10.1007/s10048-006-0032-6
34. Robinson G, Parker M, Kranenburg TA, et al. Novel mutations target distinct subgroups of medulloblastoma. Nature. 2012;488(7409):43–48. doi:10.1038/nature11213
35. Northcott PA, Buchhalter I, Morrissy AS, et al. The whole-genome landscape of medulloblastoma subtypes. Nature. 2017;547(7663):311–317. doi:10.1038/nature22973
36. Cavalli FMG, Remke M, Rampasek L, et al. Intertumoral heterogeneity within medulloblastoma subgroups. Cancer Cell. 2017;31(6):737–754. doi:10.1016/j.ccell.2017.05.005
37. Liang S, Xie M, Tang J, Wang M, Zhang D, Hou S. Proteomics reveals the effect of type I interferon on the pathogenicity of duck hepatitis A virus genotype 3 in Pekin ducks. Vet Microbiol. 2020;248:108813. doi:10.1016/j.vetmic.2020.108813
38. Ma J, Chen T, Wu S, et al. iProX: an integrated proteome resource. Nucleic Acids Res. 2019;47(D1):D1211–D1217.
39. Zhang X, Smits AH, van Tilburg GB, Ovaa H, Huber W, Vermeulen M. Proteome-wide identification of ubiquitin interactions using UbIA-MS. Nat Protoc. 2018;13(3):530–550. doi:10.1038/nprot.2017.147
40. Castell A, Larsson LG. Targeting MYC translation in colorectal cancer. Cancer Discov. 2015;5(7):701–703. doi:10.1158/2159-8290.CD-15-0660
41. Lu Y, Labak CM, Jain N, et al. OTX2 expression contributes to proliferation and progression in Myc-amplified medulloblastoma. Am J Cancer Res. 2017;7(3):647–656.
42. Meyers RM, Bryan JG, McFarland JM, et al. Computational correction of copy number effect improves specificity of CRISPR-Cas9 essentiality screens in cancer cells. Nat Genet. 2017;49(12):1779–1784. doi:10.1038/ng.3984
43. Bordeleau ME, Robert F, Gerard B, et al. Therapeutic suppression of translation initiation modulates chemosensitivity in a mouse lymphoma model. J Clin Invest. 2008;118(7):2651–2660.
44. Bretones G, Delgado MD, Leon J. Myc and cell cycle control. Biochim Biophys Acta. 2015;1849(5):506–516. doi:10.1016/j.bbagrm.2014.03.013
45. Dang CV. MYC on the path to cancer. Cell. 2012;149(1):22–35. doi:10.1016/j.cell.2012.03.003
46. Sharon D, Cathelin S, Mirali S, et al. Inhibition of mitochondrial translation overcomes venetoclax resistance in AML through activation of the integrated stress response. Sci Transl Med. 2019;11(516):eaax2863. doi:10.1126/scitranslmed.aax2863
47. Dong Z, Abbas MN, Kausar S, et al. Biological functions and molecular mechanisms of antibiotic tigecycline in the treatment of cancers. Int J Mol Sci. 2019;20(14):3577. doi:10.3390/ijms20143577
48. Iwamoto H, Abe M, Yang Y, et al. Cancer lipid metabolism confers antiangiogenic drug resistance. Cell Metab. 2018;28(1):104–117 e105. doi:10.1016/j.cmet.2018.05.005
49. Cao Y. Adipocyte and lipid metabolism in cancer drug resistance. J Clin Invest. 2019;129(8):3006–3017.
50. Hattori A, Tsunoda M, Konuma T, et al. Cancer progression by reprogrammed BCAA metabolism in myeloid leukaemia. Nature. 2017;545(7655):500–504. doi:10.1038/nature22314
51. Santagata S, Mendillo ML, Tang YC, et al. Tight coordination of protein translation and HSF1 activation supports the anabolic malignant state. Science. 2013;341(6143):1238303. doi:10.1126/science.1238303
52. Blackwood EM, Eisenman RN. Max: a helix-loop-helix zipper protein that forms a sequence-specific DNA-binding complex with Myc. Science. 1991;251(4998):1211–1217.
53. Northcott PA, Shih DJ, Peacock J, et al. Subgroup-specific structural variation across 1,000 medulloblastoma genomes. Nature. 2012;488(7409):49–56. doi:10.1038/nature11327
54. Bandopadhayay P, Bergthold G, Nguyen B, et al. BET bromodomain inhibition of MYC-amplified medulloblastoma. Clin Cancer Res. 2014;20(4):912–925. doi:10.1158/1078-0432.CCR-13-2281
 © 2020 The Author(s). This work is published and licensed by Dove Medical Press Limited. The full terms of this license are available at https://www.dovepress.com/terms.php and incorporate the Creative Commons Attribution - Non Commercial (unported, v3.0) License.
By accessing the work you hereby accept the Terms. Non-commercial uses of the work are permitted without any further permission from Dove Medical Press Limited, provided the work is properly attributed. For permission for commercial use of this work, please see paragraphs 4.2 and 5 of our Terms.
© 2020 The Author(s). This work is published and licensed by Dove Medical Press Limited. The full terms of this license are available at https://www.dovepress.com/terms.php and incorporate the Creative Commons Attribution - Non Commercial (unported, v3.0) License.
By accessing the work you hereby accept the Terms. Non-commercial uses of the work are permitted without any further permission from Dove Medical Press Limited, provided the work is properly attributed. For permission for commercial use of this work, please see paragraphs 4.2 and 5 of our Terms.