")
Back to Journals » International Journal of Nanomedicine » Volume 11
Effective combination treatment of lung cancer cells by single vehicular delivery of siRNA and different kinds of anticancer drugs
Authors Li J, Wang Y, Xue S, Sun J, Zhang W, Hu P, Ji L, Mao Z
Received 27 February 2016
Accepted for publication 23 May 2016
Published 13 September 2016 Volume 2016:11 Pages 4609—4624
DOI https://doi.org/10.2147/IJN.S107345
Checked for plagiarism Yes
Review by Single anonymous peer review
Peer reviewer comments 3
Editor who approved publication: Professor Lei Yang
Jinming Li,* Yuanyuan Wang,* Shanshan Xue, Jinghua Sun, Wei Zhang, Ping Hu, Liangnian Ji, Zongwan Mao
MOE Key Laboratory of Bioinorganic and Synthetic Chemistry, School of Chemistry and Chemical Engineering, Sun Yat-sen University, Guangzhou, People’s Republic of China
*These authors contributed equally to this work
Abstract: In recent years, lung cancer has become one of the fastest growing cancers in the world. Thus, the development of efficient combination therapy to treat lung cancer has attracted significant attention in the cancer therapy field. In this article, we developed a single vehicle drug delivery system, based on quantum dot (QD) nanoparticles, to deliver small interfering RNA (siRNA; target Bcl-2) and different anticancer drugs (carboplatin, paclitaxel, and doxorubicin) simultaneously for treating A549 lung cancer cells efficiently by combination therapy. The QD nanoparticles were conjugated with L-arginine (L-Arg) and different kinds of hydroxypropyl-cyclodextrins (HP-α-CDs, HP-β-CDs, and HP-γ-CDs) on the surface to form the delivery nanocarriers (QD nanocarriers). They were able to not only bind and transport the siRNA through electrostatic interactions with L-Arg residues but also accommodate various disparate anticancer drugs using different HP-CD modifications. Compared with free drug treatments, the use of QD nanocarriers to deliver Bcl-2 siRNA and different anticancer drugs simultaneously exerted a threefold to fourfold increase in cytotoxicity in A549 cells, which greatly improved the treatment efficacy through combined action. Furthermore, the QD nanocarriers could be used as a probe for real-time imaging of the drug delivery and release because of their strong fluorescence properties. These findings indicate that multifunctional QD nanocarriers hold great promise as a powerful tool for combination therapy for lung cancer.
Keywords: combination therapy, lung cancer cells, Bcl-2 siRNA, anticancer drugs, quantum dot nanocarriers
Introduction
Lung cancer is one of the most rapidly growing malignant tumors; it has the fastest growth rate and mortality and has posed the greatest threat to the health and life of the general population in recent years.1 Systemic toxicity, lack of tumor specificity, and emergence of multidrug resistance (MDR) remain serious problems that limit the extensive applications of targeted chemotherapy in clinical practice.2 To date, chemotherapy drugs have been most effective when given in combination (combination chemotherapy).3,4 The rationale for combination chemotherapy is to use drugs that work by different mechanisms, thereby decreasing the likelihood that resistant cancer cells will develop. When drugs with different effects are combined, each drug can be used at its optimal dose, without intolerable side effects. Thus, anticancer drugs such as carboplatin (Carbo), paclitaxel (Tax), and doxorubicin (Dox) have often been used in combination in cancer research or therapy.5–7 Meanwhile, the combination of traditional anticancer drugs with newly emerging RNA interference (RNAi)-based therapy has attracted more and more attention. For example, Chen et al reported that co-delivery of Dox and Bcl-2 small interfering RNA (siRNA) by mesoporous silica nanoparticles could enhance chemotherapy in MDR cancer cells,8 because the main mechanism of MDR is the activation of the cellular antiapoptotic defense, mainly by the Bcl-2 protein.9 Therefore, to efficiently suppress MDR in chemotherapy, it is essential to simultaneously inhibit the mechanism of cellular resistance by targeting intracellular molecular targets, such as Bcl-2.
In addition, the nanoparticle-based drug delivery system (NDDS) has emerged as a promising approach, improving the efficacy of existing drugs and enabling the development of new therapies.10–14 In particular, there is growing interest in developing multi-agent co-delivery NDDSs that can encapsulate various payloads (nucleic acids and small molecule drugs) and simultaneously deliver them to disease target sites in a specific and controlled manner for the combination treatment of cancer.15–19 These multi-agent NDDSs take advantage of the synergetic effect of different treatment mechanisms to dramatically improve the overall treatment effect. For example, it has been demonstrated that combining a chemotherapeutic agent with siRNA in a co-delivery nanocarrier can significantly enhance therapeutic efficacy.20–23
In the past few decades, many efforts have been made to improve the solubility, stability, and pharmacokinetics of small molecule organic drugs with the aid of cyclodextrins (CDs) and their derivatives. The hydrophobic internal cavity of CDs endows them with the capability to form inclusion complexes with organic drugs, and their hydrophilic exterior (due to the presence of hydroxyl radicals) guarantees good water solubility of the complexes. Thus, a CD-based drug delivery system is attractive for simultaneous delivery of siRNA and anticancer drugs because it offers good biocompatibility and efficient drug delivery.24–27
However, current reports still focus on co-delivery of siRNA and one kind of anticancer drug (eg, Carbo, Tax, or Dox). The simultaneous delivery of multiple anticancer drugs and siRNA by a single vehicle to improve therapeutic efficacy by targeting different mechanisms for the combination treatment of cancer is still lacking. Moreover, clinical trials on nanocarriers for cancer therapy also require a thorough understanding of how the properties of the nanoparticles influence their fate in biological systems in vitro and in vivo. In this context, quantum dots (QDs) offer great potential due to their small size and versatile surface chemistry, which allow their incorporation with almost any nanocarrier with minimal effects on overall characteristics. They also offer superb optical properties for real-time (RT) monitoring of nanocarrier transport and drug release at both the cellular and systemic levels.28–32
In our earlier work, we synthesized a series of CD/amino-acid-modified QDs and used them to deliver siRNA for cancer therapy.33–35 However, a systemic study of the delivery capability of such QD nanocarriers is still necessary for studying the combination treatment of gene drugs and different anticancer drugs with different pharmacological mechanisms. For this purpose, a series of hydroxypropyl (HP)-CD/L-arginine ligands (HP-α-CD-(L-Arg)2, HP-β-CD-(L-Arg)2, and HP-γ-CD-(L-Arg)2) were synthesized to conjugate with CdSe/ZnSe QDs on the surface to form nanocarriers. These QD nanocarriers (HP-α-CD-(L-Arg)2-QDs (α-QDs), HP-β-CD-(L-Arg)2-QDs (β-QDs), HP-γ-CD-(L-Arg)2-QDs (γ-QDs), HP-α/β-CD-(L-Arg)2-QDs (α/β-QDs), HP-α/γ-CD-(L-Arg)2-QDs (α/γ-QDs), and HP-β/γ-CD-(L-Arg)2-QDs (β/γ-QDs)) could simultaneously and efficiently deliver siRNA (target Bcl-2), through the l-Arg modification, and two kinds of anticancer drugs by different HP-CD conjugation mechanisms (Figure 1). They were used for studying the combination therapeutic efficacy of drugs with different mechanisms in A549 lung cancer cells. These QD nanocarriers showed good fluorescent properties, biocompatibility, and low cytotoxicity. The cell viability experiments demonstrated that the apoptosis rate of A549 cells was increased threefold when using the QD nanocarriers to deliver siRNA and different anticancer drugs simultaneously, compared to treatment with free drugs. Furthermore, the fluorescence of the QD nanocarriers would be favorable in an in-depth study of NDDS interactions with biological systems, since it offers the possibility of monitoring, in real time, the fate of the nanoparticles, including their biodistribution, intracellular uptake, and drug release. It is expected that these QD nanocarriers can significantly enhance therapeutic efficacy by combining chemotherapy with siRNA-mediated gene silencing in the combination treatment of lung cancer.
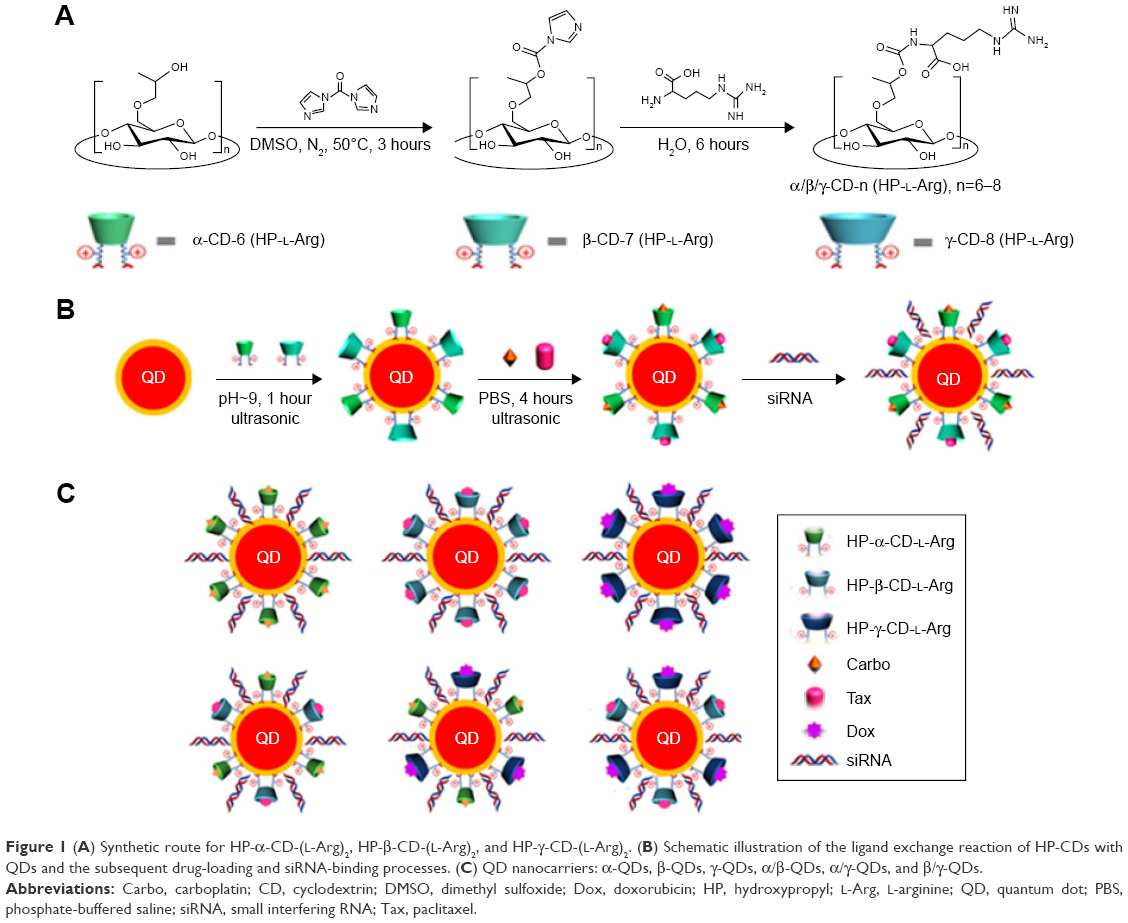 | Figure 1 (A) Synthetic route for HP-α-CD-(L-Arg)2, HP-β-CD-(L-Arg)2, and HP-γ-CD-(L-Arg)2. (B) Schematic illustration of the ligand exchange reaction of HP-CDs with QDs and the subsequent drug-loading and siRNA-binding processes. (C) QD nanocarriers: α-QDs, β-QDs, γ-QDs, α/β-QDs, α/γ-QDs, and β/γ-QDs. |
Results and discussion
Preparation of HP-CD-(l-Arg)2 ligands
In this study, L-Arg was successfully coupled to HP-α-CD, HP-β-CD, and HP-γ-CD to form ligands via the facile synthetic route as shown in Figure 1A.36 We chose the HP-CDs to form part of the ligand, because they offered the advantages of excellent water solubility, biocompatibility, and low cytotoxicity. The chemical structure of the obtained products was characterized by mass spectrometry, 1H nuclear magnetic resonance (NMR), and Fourier transform infrared (FT-IR) spectroscopy. As shown in Supplementary Materials; Figure S1B, the peaks of the mass spectrum of the ligand synthesized from HP-α-CD were assigned to the m/z [M–H] of HP-α-CD-(L-Arg)2. As a comparison, the mass spectrum of HP-α-CD at the same m/z region is shown in Figure S1A. The widespread molecular weight distribution in Figure S1B was attributed to the different degrees of hydroxypropylation and various numbers of (L-Arg)2 coupled to the HP-α-CD. Similarly, the m/z [M–H] of HP-β-CD-(L-Arg)2 and HP-γ-CD-(L-Arg)2 is shown in Figure S1D and F, respectively, and for comparison, the m/z [M–H] of HP-β-CD and HP-γ-CD is shown in Figure S1C and E, respectively. Theoretical values of molecular weights of HP-α-CD and HP-α-CD-(L-Arg)2 were calculated and are shown in Table S1. Table S1 shows that the molecular weight of the product detected by mass spectrometry was in good agreement with the calculated theoretical value of two L-Arg residues coupled to one HP-CD. Similar results were obtained for HP-β-CD-(L-Arg)2 and HP-γ-CD-(L-Arg)2 from data analysis (Tables S2 and S3).
The chemical structure of HP-CD-(L-Arg)2 was confirmed by 1H NMR. Figure S2 shows the 1H NMR spectra in D2O of L-Arg (Figure S2A), HP-α-CD (Figure S2B), HP-α-CD- (L-Arg)2 (Figure S2C), HP-β-CD (Figure S2D), HP-β-CD-(L-Arg)2 (Figure S2E), HP-γ-CD (Figure S2F), and HP-γ-CD-(L-Arg)2 (Figure S2G). In comparison with that of HP-α-CD, new chemical shift peaks appeared in the spectrum of HP-α-CD-(L-Arg)2 at δ=1.55 ppm, δ=1.76 ppm, δ=2.61 ppm, and δ=3.11 ppm after the reaction of L-Arg with HP-α-CD. Among those peaks, δ1.55 ppm and δ1.76 ppm could be respectively assigned to –HCCH2CH2CH2NH– and –HCCH2CH2CH2NH– groups of the Arg residues. δ2.61 ppm was attributed to the –CONHCH– group of HP-α-CD-(L-Arg)2 and protons next to the amine group contributed to the chemical shift at 3.11 ppm. Such explanations were also applicable to HP-β-CD-(L-Arg)2 and HP-γ-CD-(L-Arg)2, which indicated that L-Arg coupled to HP-CD instead of forming a physical mixture.
Figure S3 shows the FT-IR spectra of L-Arg, HP-CD, and HP-CD-(L-Arg)2 ligands. For HP-α-CD, the wide peak at 3,403.0 cm−1 was assigned to the –OH group. Compared to this spectrum of HP-α-CD, new absorption peaks for HP-α-CD-(L-Arg)2 appeared at 1,643.2 cm−1, 1,593.6 cm−1, and 1,293.1 cm−1, indicating the formation of –CONH–, which resulted from the cross-linking of L-Arg to HP-α-CD (Figure S3A). The same alterations in the IR spectra were observed in Figure S3B and C, which were strongly indicative of the formation of HP-β-CD-(L-Arg)2 and HP-γ-CD-(L-Arg)2.
Preparation of QD nanocarriers
After the synthesis of HP-CD-(L-Arg)2 ligands, the QD nanocarriers with water solubility and biocompatibility were prepared through ligand exchange reactions (Figure 1B). Phase transfer of QDs from the hexane layer to the aqueous layer triggered by sonic agitation could be visually observed (Figure 2A). To explore the extent of the reaction of the QDs with two kinds of HP-CD-coupled L-Arg ligands in the preparation of multiple CD-derivative-coated QDs, an ultracentrifuge tube was used to filter the aqueous mixture after sonication. Then, the filter liquid was collected for mass spectrometry. As shown in Figure S4, after the ligand exchange reaction, only triethanolamine was detected by mass spectrometry in the liquor (Figure S4A: α/β-QDs; Figure S4B: α/γ-QDs; and Figure S4C: β/γ-QDs). This result demonstrated that mixtures of two kinds of HP-CD-(L-Arg)2 ligands had been linked to QDs in a 1:1 ratio. Furthermore, in the FT-IR spectrum in trioctylphosphine oxide (Figure 2E), the stretching vibration peaks of –CH2 and –CH3 groups at ~2,900 cm−1 and ~2,800 cm−1, respectively, for QD nanocarriers were significantly weakened in comparison to those for the original unmodified QDs, verifying the occurrence of the ligand exchange reaction. It was demonstrated by transmission electron microscopy (TEM) that the size of the QD nanocarriers was ~5 nm and that they were monodispersed spheres (Figure 2B). We then tested the zeta potential of the QD nanocarriers. As shown in Table S4, only the zeta potentials of β/γ-QDs and γ-QDs were below 20 mV. The steric effect of the CD residues of larger size might block the hydrolysis of guanidine to cause the decrease in zeta potential. Next, we tested the ultraviolet (UV) absorption and fluorescence of the QD nanocarriers. As shown in Figure 2C and D (black line: α-QDs; red line: β-QDs; blue line: γ-QDs; green line: α/β-QDs; purple line: α/γ-QDs; clay line: β/γ-QDs), the positions and widths of the maximum absorbance peaks and the maximum fluorescence emission peaks (585 nm) of the QD nanocarriers were similar in the modified QDs compared to those in the original QDs. This result indicated that the HP-CD-(L-Arg)2 modification did not alter the optical properties of the QDs. Furthermore, to quantify the cytotoxicity of the QD nanocarriers, an MTT assay was performed. As shown in Figure 2F, the MTT result indicated that the cytotoxicity of the modified QD nanocarriers is remarkably low in A549 cells; the cell viability is >80% when the concentration of the QDs is 2 μM. This low cytotoxicity of the modified QD nanocarriers might be attributed to the strong interaction of the multiple –COOH groups of L-Args on the single CD ring with the QDs, which could result in decreased release of free Cd2+ from the QDs.
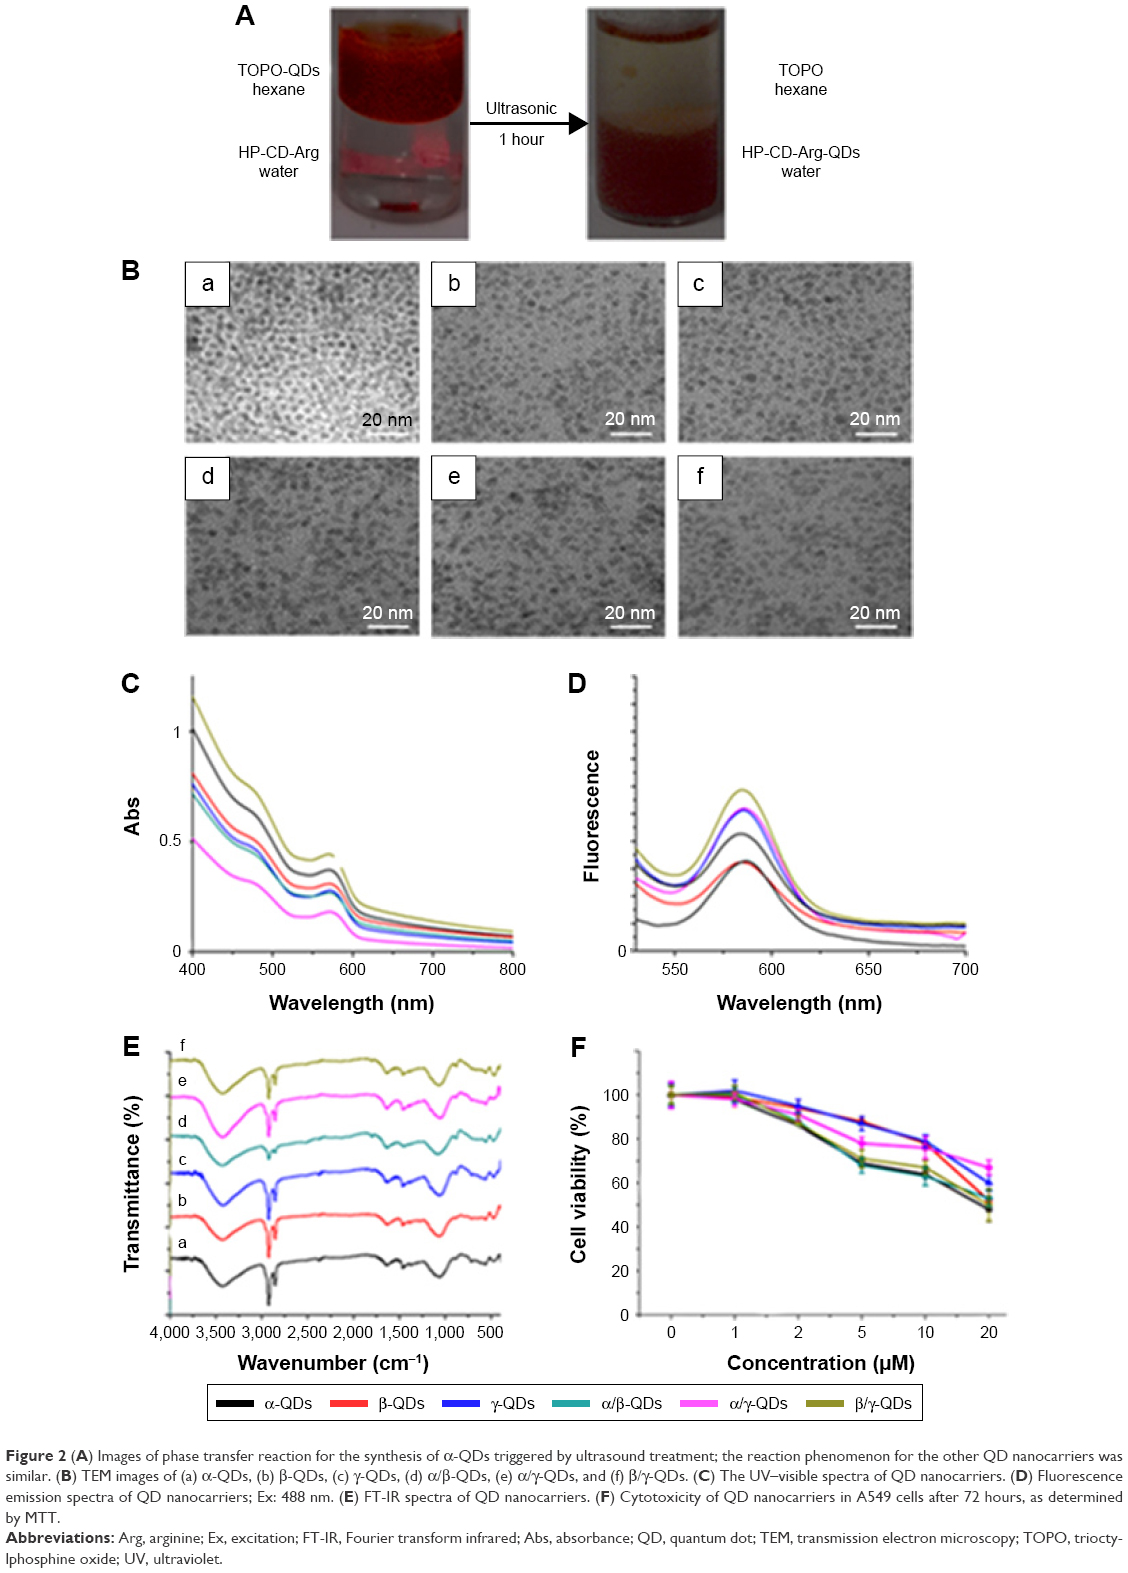 | Figure 2 (A) Images of phase transfer reaction for the synthesis of α-QDs triggered by ultrasound treatment; the reaction phenomenon for the other QD nanocarriers was similar. (B) TEM images of (a) α-QDs, (b) β-QDs, (c) γ-QDs, (d) α/β-QDs, (e) α/γ-QDs, and (f) β/γ-QDs. (C) The UV–visible spectra of QD nanocarriers. (D) Fluorescence emission spectra of QD nanocarriers; Ex: 488 nm. (E) FT-IR spectra of QD nanocarriers. (F) Cytotoxicity of QD nanocarriers in A549 cells after 72 hours, as determined by MTT. |
QD nanocarrier: cell uptake study
Because QDs have strong fluorescence, they are considered to be an important probe for cell and tissue imaging. As shown in Figure 3A, the QD nanocarriers could be observed by confocal laser scanning microscopy after incubation with A549 cells for 3 hours, and they were located in the cytoplasm. The confocal imaging result showed that the QD nanocarriers could enter A549 cells and display strong red fluorescence. These advantages make QD nanocarriers an effective probe for RT imaging and monitoring of cell transfection and drug release. Furthermore, we used bio-TEM to observe the process of entry of the QD nanocarriers into A549 cells. As shown in Figure 3B, we observed that the QD nanocarriers were in the lysosomes of A549 cells after 1-hour incubation and were aggregated at the edge of the lysosomal vesicles. When the incubation time was increased to 3 hours, the QD nanocarriers escaped from the lysosomes and were distributed to the cytoplasm under the acidic pH in the lysosomes, which was possibly due to the positive l-Arg modification.
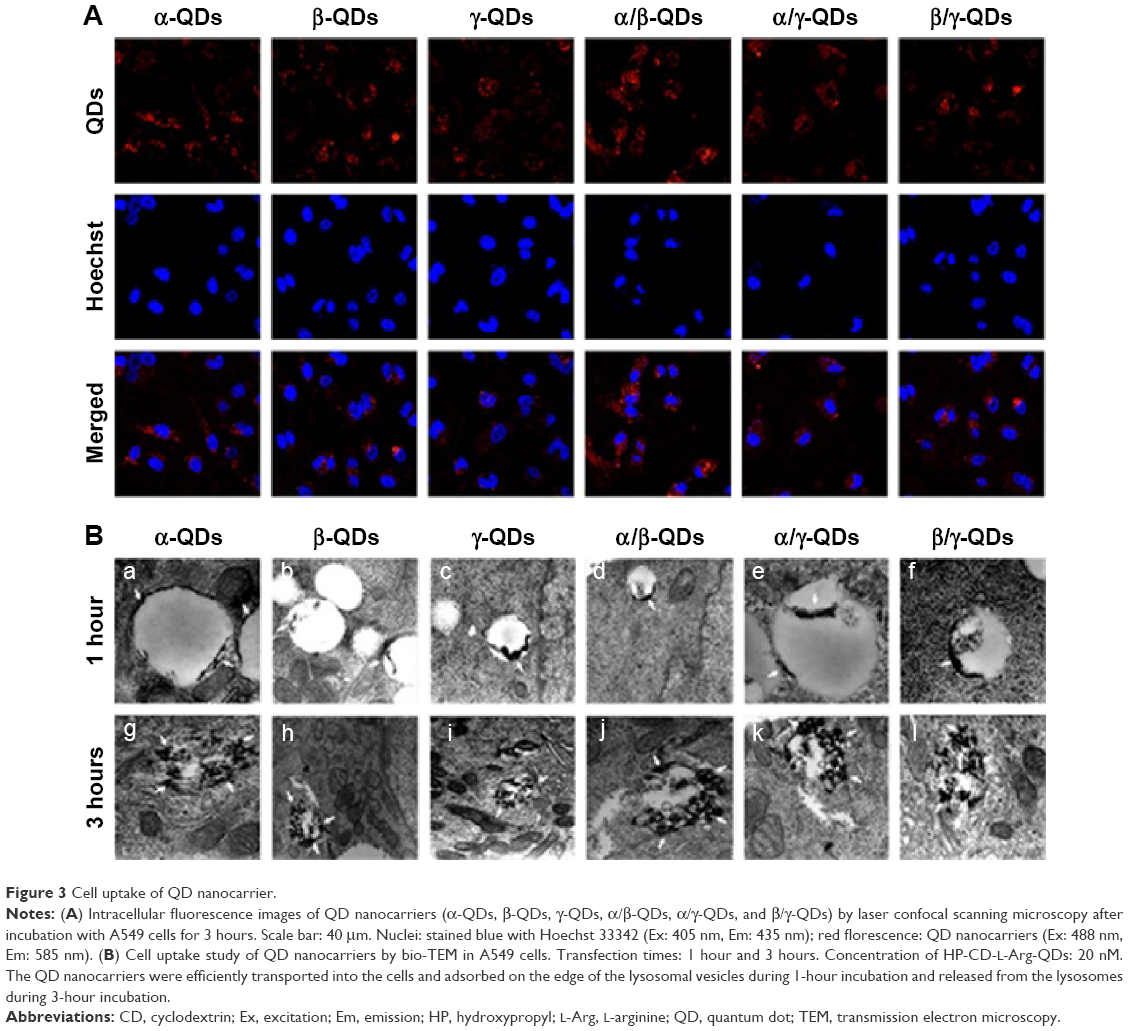 | Figure 3 Cell uptake of QD nanocarrier. |
siRNA binding with QD nanocarriers
To bind siRNA, the QD nanocarriers were mixed with siRNA at different molar ratios (200, 100, 50, 25, 10, 5, 2 siRNA:QDs) and loaded on 2% agarose gels for electrophoresis. As shown in Figure 4, with the increase in the amount of QD nanocarriers (ie, the decrease in the siRNA:QD ratio), siRNA completely combined with the QD nanocarriers, resulting in a zeta potential rise and the detainment of the siRNA in the sampling holes. The molar ratio at which negatively charged siRNA did not move in the direction of the positive electrode indicated the loading capacity of the QD nanocarriers. The gel results show that the ability of α-QDs to bind siRNA was better than that of the other QD nanocarriers (compare Figure 4A with Figure B–F), due to its higher zeta potential (26.9 mV; Table S4) and smaller steric hindrance, which are both favorable for siRNA binding. To ensure the complete binding of siRNA to the QD nanocarriers and unify the molar ratio of siRNA:QDs, we proceeded with an siRNA:QD ratio of 1:1 for the following experiments.
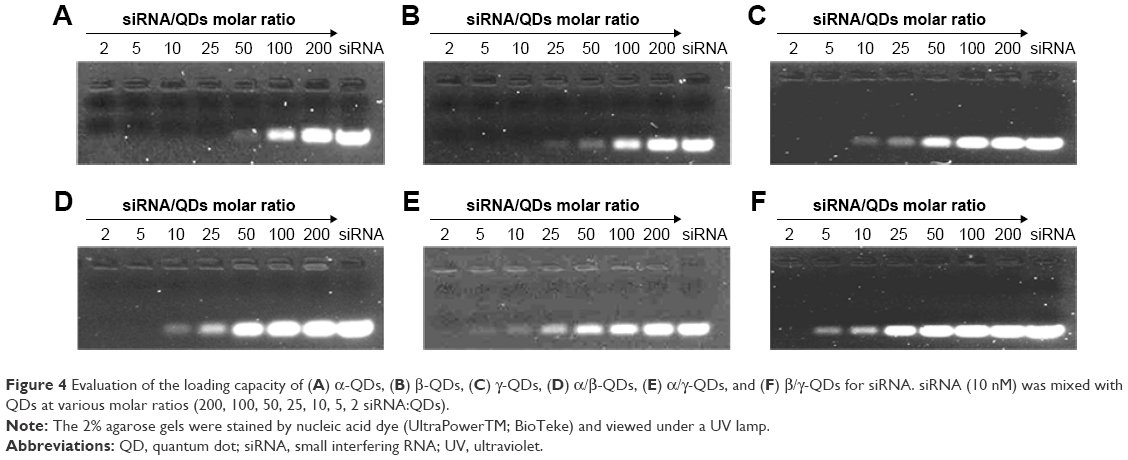 | Figure 4 Evaluation of the loading capacity of (A) α-QDs, (B) β-QDs, (C) γ-QDs, (D) α/β-QDs, (E) α/γ-QDs, and (F) β/γ-QDs for siRNA. siRNA (10 nM) was mixed with QDs at various molar ratios (200, 100, 50, 25, 10, 5, 2 siRNA:QDs). |
Delivery of siRNA by QD nanocarriers
After the formation of QD/siRNA complexes with the optimized ratio, we used the QD nanocarriers to deliver siRNA into A549 cells. It is difficult for naked siRNA to enter the cells directly because of its negative charge. This weakness limits the application of siRNA in the treatment of disease, and therefore it is necessary to develop an siRNA delivery system for RNAi therapy. In Figure 5A, the confocal imaging shows that QD nanocarriers could efficiently deliver siRNA into A549 cells after 3-hour incubation. The observation of intracellular fluorescence for siRNAFAM (FAM-conjugated siRNA, green fluorescence) in the confocal images was attributed to transportation by the positively charged QD nanocarriers (red); the green siRNA and the red QD nanocarriers were colocalized and uniformly distributed in the cytoplasm of A549 cells.
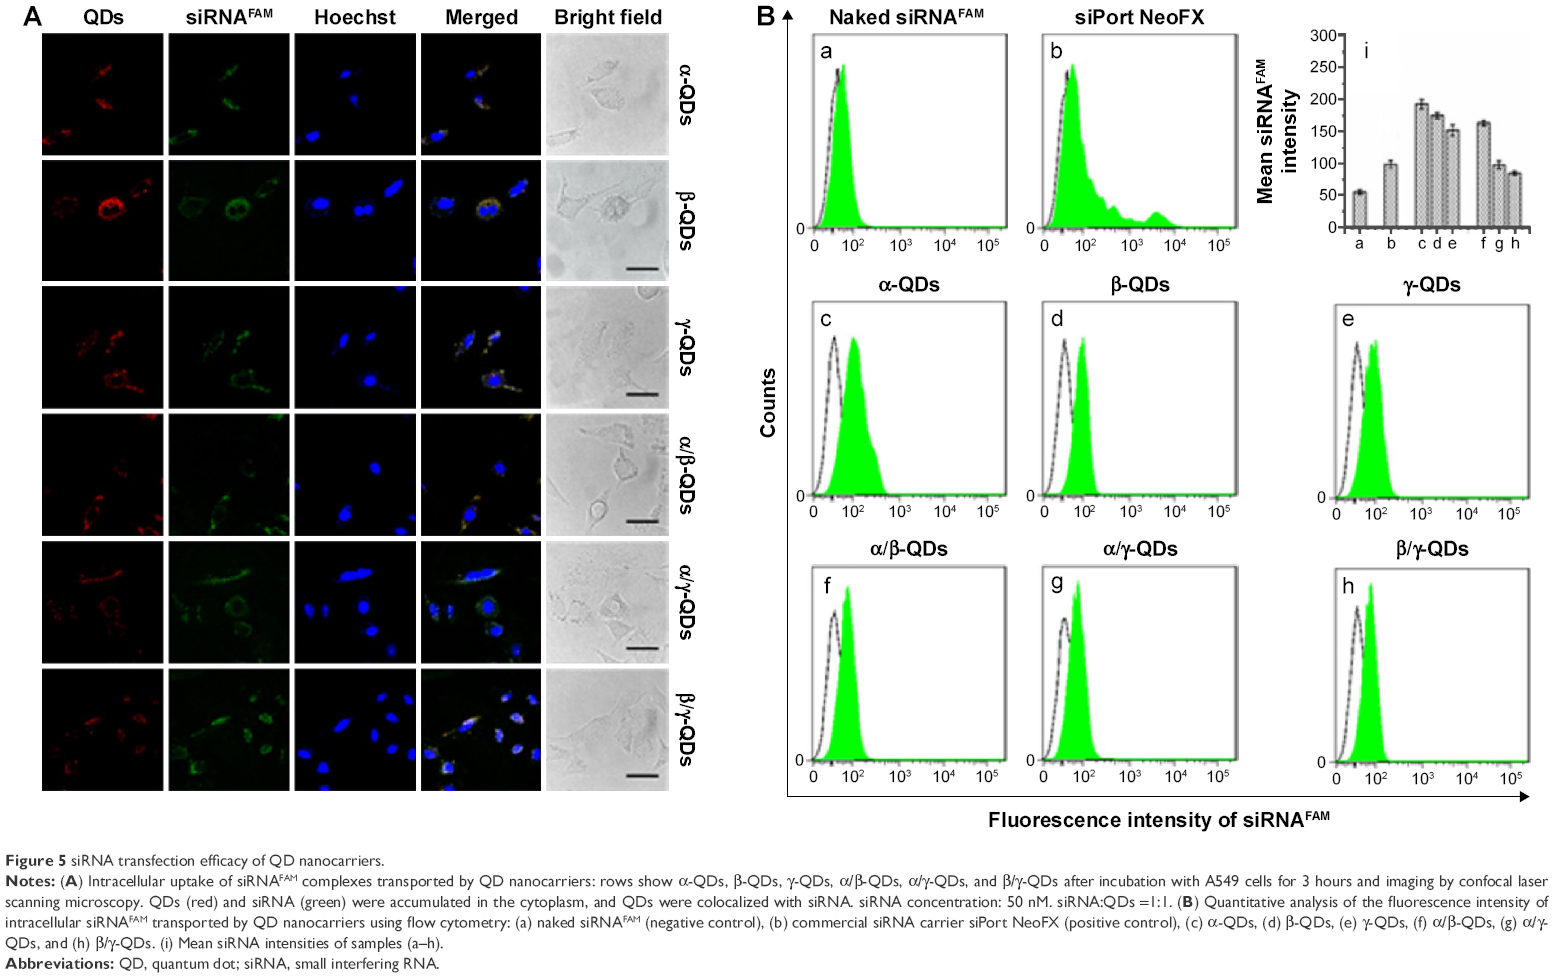 | Figure 5 siRNA transfection efficacy of QD nanocarriers. |
Furthermore, to quantitatively characterize the ability of the modified QDs to deliver siRNA, flow cytometric analysis was performed after incubation of the QD nanocarrier/siRNAFAM complexes with A549 cells for 3 hours. In Figure 5B, we can observe that without QD nanocarriers, the naked siRNA could not enter A549 cells, showing no fluorescence in the flow cytometry result (Figure 5B[a]). The intracellular fluorescence intensity of siRNA, when transfected by siPort NeoFX (siRNA transfection agent), was stronger than that of naked siRNA (Figure 5B[b]), but still weak because of the low transfection efficiency of siRNA. In comparison, siRNA transported by the QD nanocarriers showed strong intracellular fluorescence intensity (Figure 5B[c–h]). Those QDs modified with one kind of HP-CD-coupled L-Arg (α-QDs, β-QDs, and γ-QDs) had stronger intracellular fluorescence intensity than the QDs modified with two kinds of HP-CD-coupled L-Args (α/β-QDs, α/γ-QDs, and β/γ-QDs), indicating that they offered the better siRNA transfection in A549 cells (Figure 5B[i]). For example, the siRNA delivery efficacy of γ-QDs was better than that of β/γ-QDs, even though the zeta potential of the former QDs was lower and the steric hindrance was more significant than that of the latter. This result goes against the theory that a high zeta potential and small steric hindrance of carriers are favorable for transfecting siRNA. Such results might be ascribed to the inhomogeneous exterior surface of the modified QDs, which would probably result in a decrease in the stability of QD/siRNA complexes under physiological conditions. However, the results were in accordance with those obtained by the agarose gel electrophoresis experiment. Therefore, the loading capacity and transfection efficiency appeared to be related not only to the zeta potential and steric hindrance of the delivery systems but also to their surface uniformity.
Loading anticancer drugs onto QD nanocarriers
We synthesized three HP-CD-coupled L-Args (HP-α-CD-(L-Arg)2, HP-β-CD-(L-Arg)2, and HP-γ-CD-(L-Arg)2) to fabricate multifunctional QD delivery systems for the three commonly used anticancer agents: Carbo, Tax, and Dox. However, the optimal HP-CD-(L-Arg)2 for each drug was uncertain. Hence, UV spectroscopic titration was used to evaluate the stability of the nine inclusion complexes created by using each of the three drugs separately with each of the three kinds of HP-CD-(L-Arg)2. The curves showing the change in absorbance with concentration of HP-CD-(L-Arg)2 at a fixed amount of each drug are shown in Figure S5. The existence of a linear relationship between the two parameters indicates the formation of 1:1 inclusion complexes of the drugs with HP-CD-(L-Arg)2, and the stability constants calculated from these curves are listed in Table S5. The results show that 1) Carbo can form 1:1 inclusion complexes with HP-α-CD-(L-Arg)2, HP-β-CD-(L-Arg)2, and HP-γ-CD-(L-Arg)2 (Figure S5A–C) and that Carbo/HP-α-CD-(L-Arg)2 showed the greatest stability constant of the three (Ka=1.05×10³ M−1); 2) as a result of the bigger molecular size of Tax, it was only encapsulated by HP-β-CD-(L-Arg)2 and HP-γ-CD-(L-Arg)2, forming the more stable complexes with HP-β-CD-(L-Arg)2 (Figure S5D–F); and 3) Dox formed its most stable 1:1 complex (Ka=0.76×10³ M−1) with HP-γ-CD-(L-Arg)2 which has the largest hydrophobic cavity (Figure S5G–I). Dox’s hydrophobic anthracene ring may facilitate its entry into this CD cavity.
After determination of the optimum HP-CD-(L-Arg)2 complex for each drug using UV, FT-IR spectroscopy of the free drugs and their most stable inclusion complexes was carried out, as shown in Figure S6. This study further verified the formation of inclusion complexes. The characteristic absorption peaks for Carbo, such as the asymmetric stretching vibration of –NH2 at 3,100–3,300 cm−1, which were marked in the spectrum of the free drug (Figure S6A[a]), were significantly weakened and many peaks were slightly shifted in the spectrum of Carbo/HP-α-CD-(L-Arg)2 (Figure S6A[b]). The alterations of the spectra of Tax and Dox after forming inclusion complexes with HP-β-CD-(L-Arg)2 and HP-γ-CD-(L-Arg)2, respectively, were similar (Figure S6B and C), which strongly indicated the formation of inclusion complexes. In addition, after the preparation of the drug-loaded QD nanocarriers, namely Carbo/α-QDs, Tax/β-QDs, Dox/γ-QDs, Carbo/Tax/α/β-QDs, Carbo/Dox/α/γ-QDs, and Tax/Dox/β/γ-QDs, we measured the changes of characteristic absorption peaks in the IR spectra of the drugs and observed a similar phenomenon (Figure S7). This provided further definite proof of the formation of the drug/QD complexes.
Studies in A549 cells of Bcl-2 gene silencing by RT-polymerase chain reaction, and Bcl-2 protein suppression by Western blot
Next, we used QD nanocarriers to deliver siBcl-2 into A549 cells to silence Bcl-2. Because this gene is one of the highly expressed genes in cancer cells and damage to the Bcl-2 gene has been identified as a cause of a number of cancers, anti-Bcl-2 has been considered as a new candidate for cancer therapy.37 A549 cells were transfected with siBcl-2/QD nanocarriers, with or without anticancer drugs, and investigated by quantitative RT polymerase chain reaction (qRT-PCR; Figure 6A) and Western blot (Figure 6B). QD nanocarriers delivering siBcl-2 with or without anticancer drugs showed higher gene silencing efficacy than the siPort NeoFX siRNA-positive control. mRNA expression levels of the Bcl-2 gene after the transfection of siBcl-2 with the modified QD nanocarriers alone were 36%±1.7%, 37%±1.6%, 40%±2.7%, 34%±1.3%, 33%±2.2%, 36%±0.7% for α-QDs, β-QDs, γ-QDs, α/β-QDs, α/γ-QDs, and β/γ-QDs, respectively (Figure 6A[a–f]). The negative control (naked siRNA) was set as the 100% expression level and the siPort NeoFX (positive control) gave 48%±2.1% expression. Interestingly, the gene silencing efficacy was similar when using one kind of HP-CD-coupled L-Arg-modified QDs (α-QDs, β-QDs, or γ-QDs) or two kinds of HP-CD-coupled L-Arg-modified QDs (α/β-QDs, α/γ-QDs, or β/γ-QDs) to deliver siBcl-2 for Bcl-2 silencing in A549 cells. Furthermore, we used the QD nanocarriers to deliver siBcl-2 into A549 cells after loading the QDs with anticancer drugs first, and we achieved better Bcl-2 gene suppression, as shown in Figure 6A(g–l). When we used one kind of HP-CD-coupled L-Arg-modified QD to load one kind of anticancer drug or two kinds of HP-CD-coupled L-Arg-modified QDs to load two kinds of anticancer drugs for siBcl-2 delivery, we achieved >80% Bcl-2 gene suppression: mRNA levels were 25%±1.1%, 31%±1.3%, 27%±1.2%, 15%±0.9%, 17%±1.1%, and 29%±2.2% for Carbo/α-QDs, Tax/β-QDs, Dox/γ-QDs, Carbo/Tax/α/β-QDs, Carbo/Dox/α/γ-QDs, and Tax/Dox/β/γ-QDs, respectively. Thus, instead of decreasing the silencing efficiency through hindering siRNA binding, we believe that the loading of the anticancer drugs on the QD nanocarriers contributed to quicker siRNA release from the QD nanocarriers and led to higher gene silencing because the anticancer drugs could also be released from the CDs due to the low pH in the lysosomes of A549 cells. At the same time, the anticancer drugs, which have an effect on cancer cells, may improve the silence efficacy of RNAi when they are released from the QD nanocarriers and induce early apoptosis. We obtained similar results in Western blot experiments (Figure 6B).
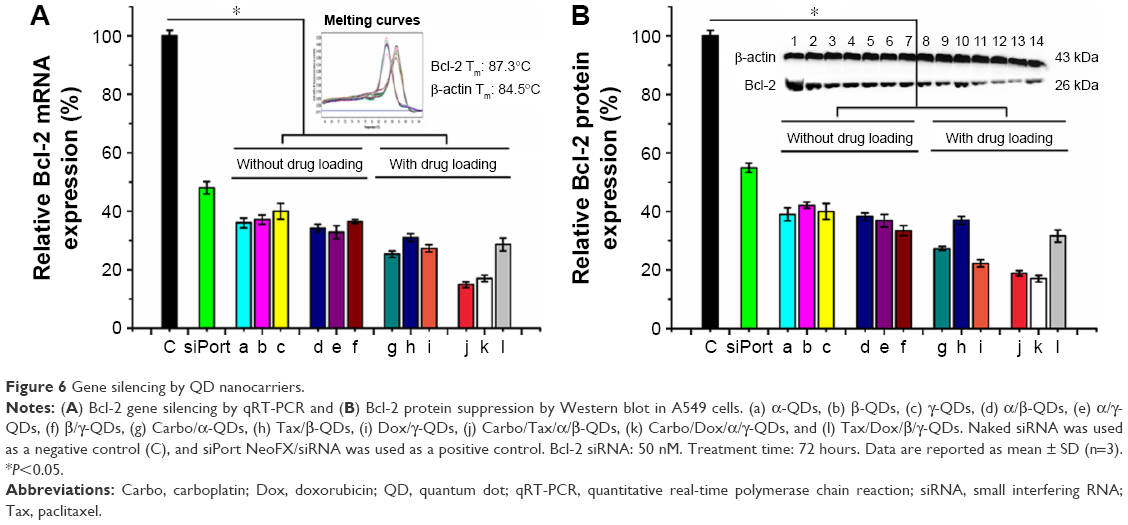 | Figure 6 Gene silencing by QD nanocarriers. |
Variation of cell cycle arrest induced by siRNA/anticancer drug delivery
The impact of drugs on the distribution of A549 cell cycle populations after being delivered by QD nanocarriers in the presence and absence of siBcl-2 was studied (Figure 7). In contrast to untreated cells, those cells incubated with free drugs (Carbo: 500 nM; Tax: 0.03 nM; Dox: 32 nM) for 24 hours displayed arrest in the G2/M phase (Figure 7A–D). Drug delivery with QD nanocarriers slightly enhanced G2/M phase cell cycle arrest (Figure 7E–G). Furthermore, the loading of two anticancer drugs onto the QD nanocarriers (Carbo/Tax/α/β-QDs, Carbo/Dox/α/γ-QDs, and Tax/Dox/β/γ-QDs; Figure 7K–M) showed an obvious elevation of the cell cycle population arrested in the G2/M phase in A549 cells, indicating that the delivery of two anticancer drugs with a single vehicle improves the treatment of A549 cells by combination chemotherapy. More importantly, co-delivery of siBcl-2 and anticancer drugs with QD nanocarriers induced the arrest of still larger cell populations in the G2/M phase, indicating that Bcl-2 siRNA can function in coordination with chemotherapeutics to enhance the cell cycle arrest (Figure 7H–J and N–P). A549 cells treated by simultaneously delivering Bcl-2 siRNA and anticancer drugs with QD nanocarriers almost totally arrested in the G2/M phase. Figure 7Q shows the statistical data for all of the treatment groups to enable comparison of the proportion of A549 cells arrested in the G2/M phase. Such a notable enhancement in cell cycle arrest enabled by our multifunctional delivery systems shows their potential in combination therapies.
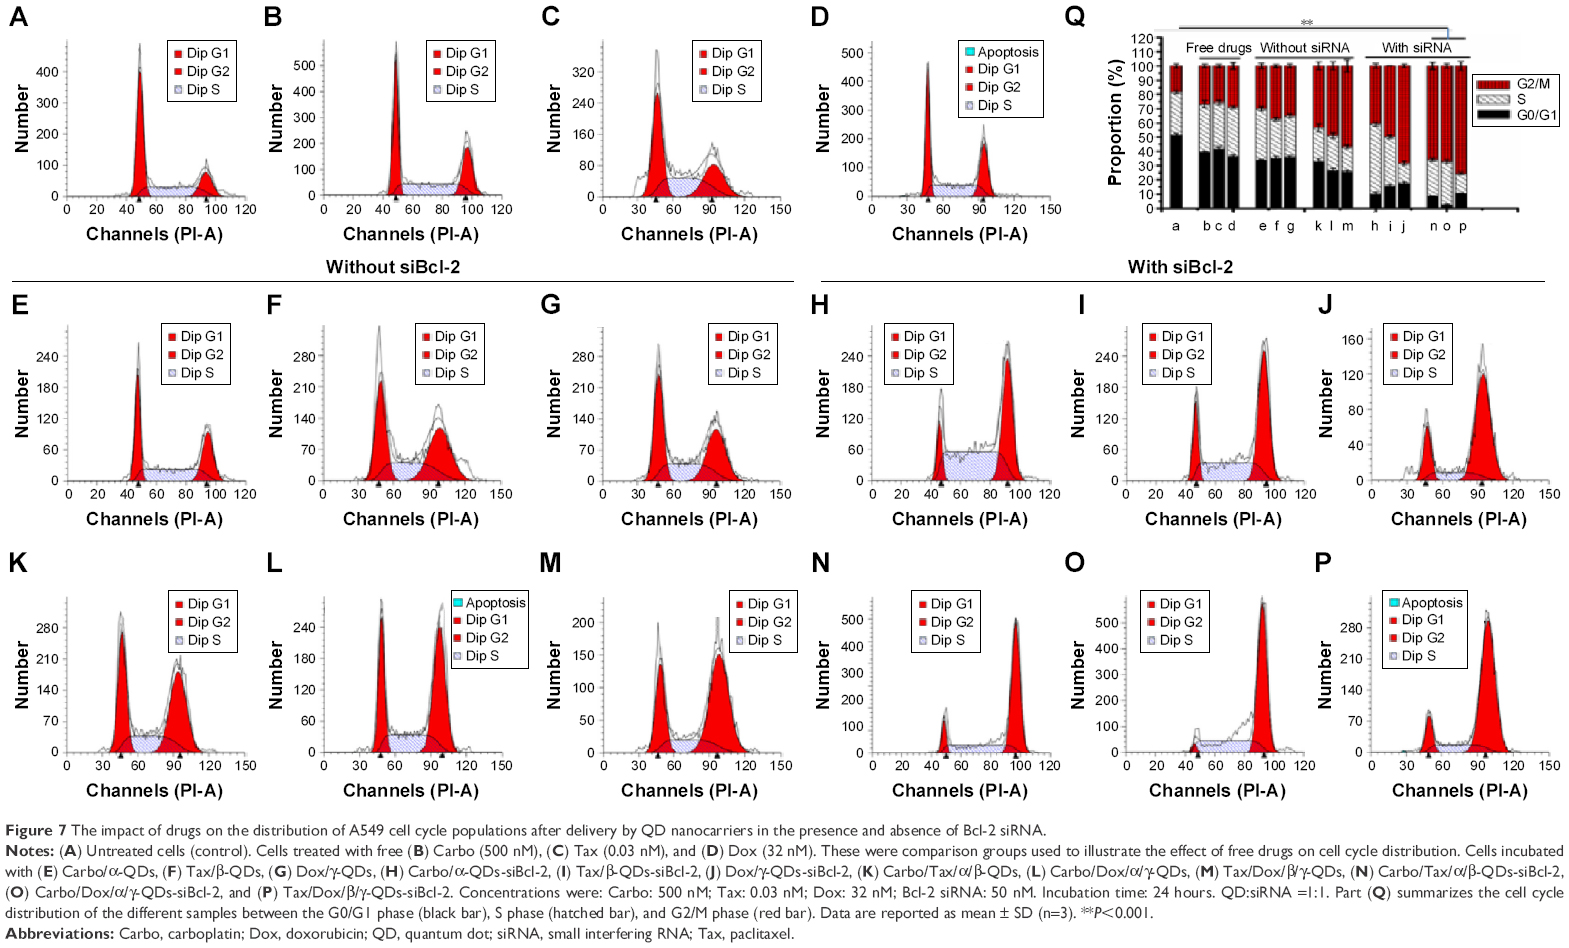 | Figure 7 The impact of drugs on the distribution of A549 cell cycle populations after delivery by QD nanocarriers in the presence and absence of Bcl-2 siRNA. |
In vitro cell viability assays by flow cytometry
After exposure for 72 hours to drug-loaded QD nanocarrier complexes (Carbo: 500 nM; Tax: 0.03 nM; Dox: 32 nM) with or without siRNA binding, A549 cells were stained with Annexin-V-Alexa Fluor® 488 and propidium iodide (PI) for cytotoxicity analysis by flow cytometry. As shown in Figure 8, the apoptosis of A549 cells was not obvious after the treatment with free drugs, either alone (Figure 8A–C) or in combination with naked Bcl-2 siRNA (Figure 8D–F). The apoptosis of A549 cells was enhanced when using the QD nanocarriers to load and deliver the anticancer drugs (Figure 8G–I) and was more pronounced when we co-delivered anticancer drugs and Bcl-2 siRNA by the QD nanocarriers (Figure 8J–L). Interestingly, using mixtures of different QD nanocarriers to deliver different anticancer drugs further enhanced the apoptosis of A549 cells (Figure 8M–O), particularly in the presence of Bcl-2 siRNA (Figure 8P–R), indicating that chemotherapy of anticancer drugs can be more effective when given in combination and that the Bcl-2 gene can improve the drug sensitivity of cancer cells. Delivery of two kinds of anticancer drugs by one type of QD nanocarrier (Carbo/Tax/α/β-QDs, Carbo/Dox/α/γ-QDs, or Tax/Dox/β/γ-QDs) showed the highest levels of cell apoptosis (Figure 8S–X). Notably, a combination of different chemotherapeutics with the gene therapy agent Bcl-2 siRNA by a single QD nanocarrier achieved nearly 80% cell apoptosis, indicating that the combination chemotherapy of different anticancer drugs and siRNA can provide the maximum increase in the pharmacological function of the drugs for the treatment of cancer cells (Figure 8V–X). Figure 8Z summarizes the statistical data of cell viability from the flow cytometry results; we achieved similar results by MTT assay (Figure S8).
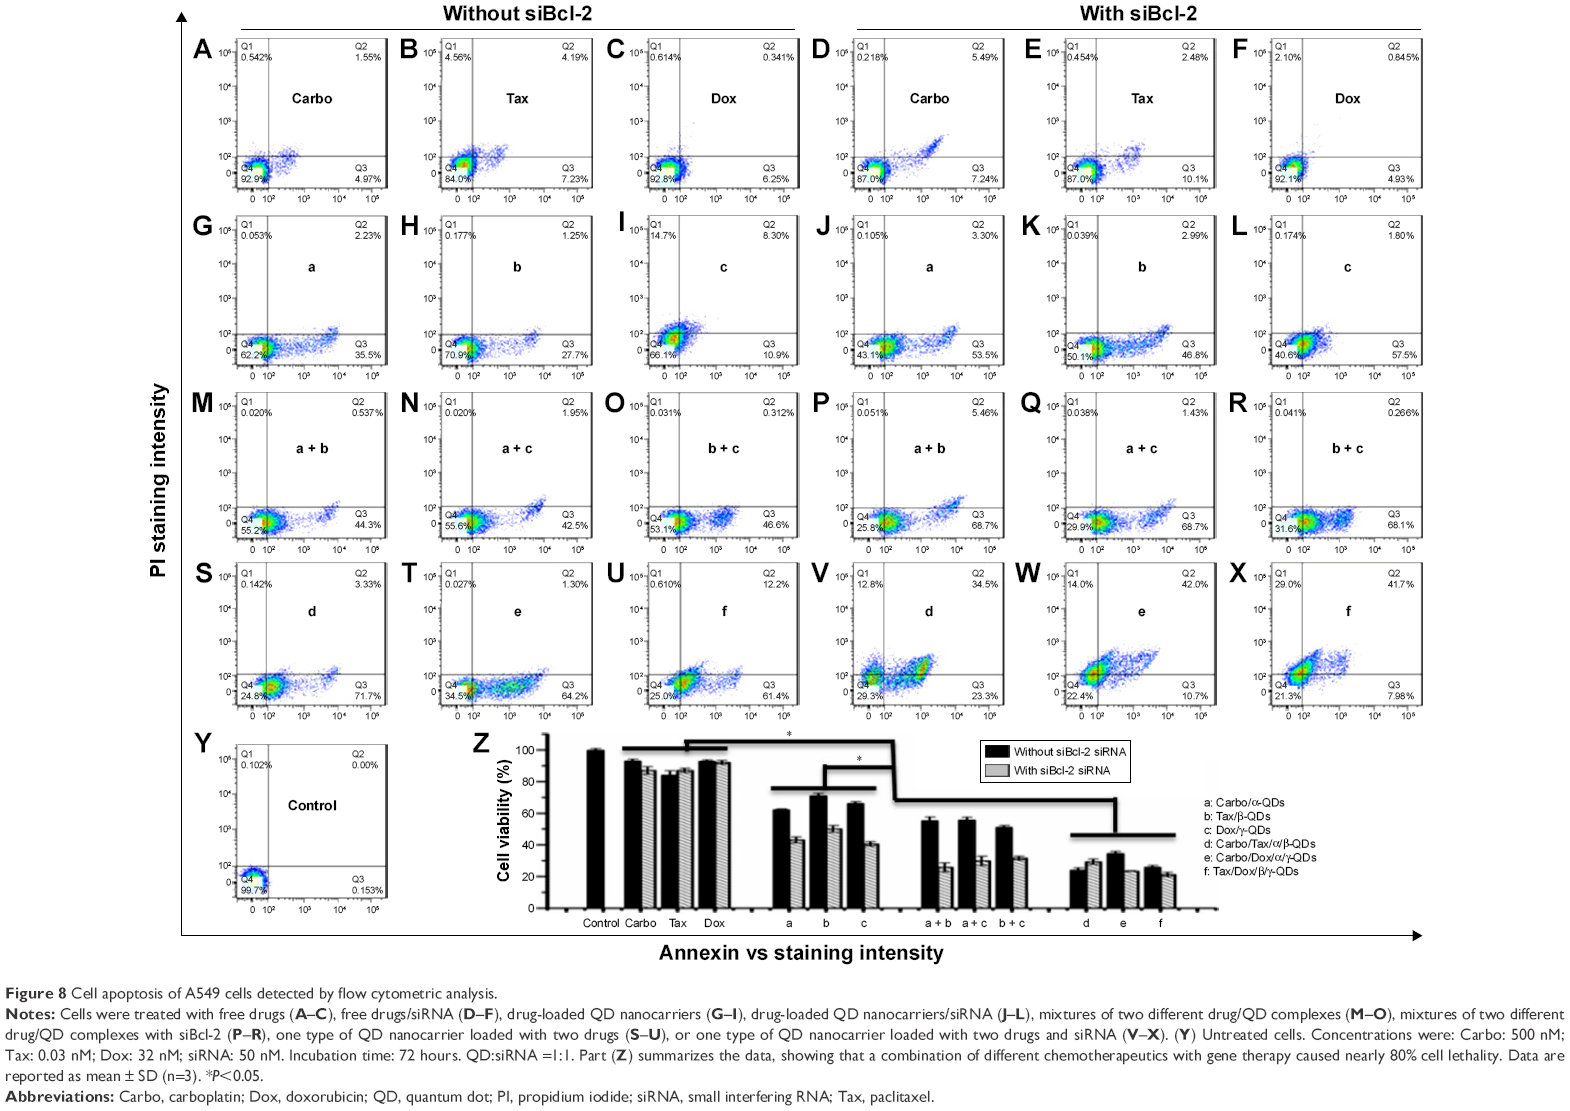 | Figure 8 Cell apoptosis of A549 cells detected by flow cytometric analysis. |
Conclusion
In this study, we developed several kinds of QD nanocarriers for use as multifunctional delivery systems for the simultaneous delivery of siRNA and chemotherapy agents to A549 cells. The QD nanocarriers showed good biocompatibility and low cytotoxicity due to their modification with HP-CD-(L-Arg)2 ligands. Furthermore, the ligand modifications allowed not only the QD nanocarriers to transfect A549 cells efficiently and act as fluorescent probes but also the modified nanocarriers to bind siRNA through their L-Arg residues and to load different kinds of anticancer drugs through the different kinds of HP-CDs. With the simultaneous delivery of siRNA and different kinds of anticancer drugs by QD nanocarriers, we achieved high Bcl-2 gene silencing and induced obvious apoptosis of A549 cells. This showed the high cytotoxicity resulting from the combination treatment of gene therapy and chemotherapy. This finding illustrates the tremendous potential of the QD nanocarriers as multifunctional delivery systems; they have the potential for effective simultaneous delivery of multiple therapy agents to realize combination therapy and further enhance the synergistic effect of those combination therapy regimens for lung cancer therapy.
Materials and methods
All reagents were purchased from Sigma-Aldrich Co. (St Louis, MO, USA) unless otherwise stated. The 1,1-carbonyldiimidazole (CDI) was obtained from Merck & Co., Inc. (Whitehouse Station, NJ, USA). Dulbecco’s Modified Eagle’s Medium (DMEM), fetal bovine serum (FBS), and penicillin–streptomycin were obtained from HyClone Inc. (South Logan, UT, USA). SiRNA-FAM and siRNA against the Bcl-2 gene (siBcl-2, sense 5′-GGGAGAUAGUGAUGAAGUATT-3′, antisense 5′-UACUUCAUCACUAUCUCCCTT-3′) was ordered from Gene Pharma (Shanghai, People’s Republic of China).
Cell culture
The A549 lung cancer cell line was obtained from the Experimental Animal Center at Sun Yat-sen University, and the cells were routinely maintained at 37°C in a 90% humidified atmosphere with 5% CO2. Culture medium (DMEM) was supplemented with 10% heat-inactivated FBS and penicillin (100 U/mL)/streptomycin (100 mg/mL).
Synthesis of HP-CD-coupled L-Args
HP-CD-coupled L-Arg ligands (HP-CD-(L-Arg)2) were synthesized by reference to the earlier method with some modifications.36 HP-α-CD (0.4 mmol), HP-β-CD (0.4 mmol), and HP-γ-CD (0.4 mmol) each dissolved in 6 mL anhydrous dimethyl sulfoxide (DMSO) were mixed with 6 mL DMSO containing 2.4 mmol, 2.8 mmol, and 3.2 mmol CDI and 0.1 mL triethylamine (Et3N). Each mixture was stirred at 50°C for 3 hours under nitrogen and protected from light. Then, 2.4 mmol, 2.8 mmol, and 3.2 mmol L-Arg dissolved in water were added dropwise over 1 hour, with additional stirring over 6 hours. The reaction mixtures were dialyzed in dialysis bags (MW=1,500) in running water for 2 days. Afterward, the aqueous products inside the dialysis bags were lyophilized for 3 days to obtain the solid products. The white, water-soluble solids were named HP-α-CD-(L-Arg)2, HP-β-CD-(L-Arg)2, and HP-γ-CD-(L-Arg)2. Mass spectra were used to detect the molecular weight distribution of the raw materials and the products, and the theoretical values of molecular weight for reactants and products were calculated for comparison to the experimental values (Table S1). 1H NMR spectra of HP-CDs and HP-CD-(L-Arg)2 (15 mg dissolved in 0.7 mL D2O) were measured using a 300 MHz spectrometer (Varian, Palo Alto, CA, USA) with 64 scans at room temperature to ascertain the chemical structures. FT-IR spectroscopy was conducted to confirm the structures of the obtained products after dispersing the samples in KBr and compressing the mixtures to form disks.
Synthesis of HP-CD-(L-Arg)2-QD nanocarriers
The synthesis of CdSe/ZnSe core/shell QDs was conducted on the basis of our earlier work.35 The HP-CD-(L-Arg)2-QD nanocarriers were prepared by ultrasound. In brief, a mixture of 20 nmol QDs diluted in hexane and 4 μmol HP-α-CD-(L-Arg)2, HP-β-CD-(L-Arg)2, or HP-γ-CD-(L-Arg)2 diluted in water was sonicated for 1 hour at pH 9–10 with the addition of triethanolamine. At the end of the sonication, the colorless hexane layer was discarded and the aqueous phase containing HP-CD-(L-Arg)2-coated QDs, unreacted HP-CD-(L-Arg)2, and triethanolamine was ultrafiltrated using an ultracentrifuge tube (MW=10,000) at 5,000 rpm for 30 minutes to purify the modified QDs and obtain α-QDs, β-QDs, and γ-QDs.
To deliver multiple drugs with one delivery system, we also synthesized QDs coated with different kinds of HP-CD-coupled L-Arg ligands, namely α/β-QDs, α/γ-QDs, and β/γ-QDs, as illustrated in Figure 1. The molar ratio of QDs to each HP-CD-L-Args in the surface exchange reaction was 1:100. Mass spectra of the filter liquors after the ultracentrifuge process were measured to confirm the ratio of two HP-CD-(L-Arg)2 coupled to each QD. The characteristics of the QD nanocarriers were verified by UV–visible, fluorescence, and FT-IR spectroscopy. The particle sizes and zeta potentials were determined by TEM and a zeta potential analyzer (Beckman Coulter Inc., Brea, CA, USA), respectively. The cytotoxicity of the coated QDs was estimated using the MTT assay, and the localization of the six modified QDs was viewed using confocal laser scanning microscopy.
Preparation of drug/HP-CD-(L-Arg)2 inclusion complexes
The most commonly used tumor therapy agents, Carbo, Tax and Dox, were selected as the target molecules for drug delivery. Various HP-CDs and their derivatives have been reported to form inclusion complexes with such antitumor agents.38–40 The three drugs, respectively, formed inclusion complexes with three HP-CD-(L-Arg)2 ligands in phosphate-buffered saline (PBS) solution under ultrasonic agitation for 4 hours. UV–visible spectroscopy was carried out to confirm whether such HP-CD-(L-Arg)2 ligands were able to encapsulate the abovementioned drugs to determine the stability constants of the inclusion complexes and to select the most suitable HP-CD-(L-Arg)2 for each drug. The change in absorption of Carbo, Tax, and Dox with increasing HP-CD-(L-Arg)2 concentration was calculated at 230 nm, 229 nm, and 479 nm, respectively, to subtract the effect of the HP-CD derivatives. FT-IR was used to characterize the most stable inclusion complex for each drug at a molar ratio of 1:1 to confirm the formation of drug inclusion complexes.
Preparation of drug/QD inclusion complexes
Drug/QD inclusion complexes were prepared as follows: Carbo and α-QDs were dissolved in PBS (n Carbo: n α-QDs =100:1) and subjected to ultrasonic agitation for 4 hours. Ultrafiltration was then performed to remove free drug, and the product was named Carbo/α-QDs. Tax/β-QDs and Dox/γ-QDs complexes were formed in the same manner and at the same ratio. For the process of loading α/β-QDs, α/γ-QDs, or β/γ-QDs with the two corresponding drugs, the drug that was to be encapsulated by the HP-CD-(L-Arg)2 with the larger sized cavity was added first and reacted for 4 hours, and then the second drug was added to the reaction for another 4 hours (drug 1: drug 2: QDs =100:100:1). The relevant products obtained were Carbo/Tax/α/β-QDs, Carbo/Dox/α/γ-QDs, and Tax/Dox/β/γ-QDs. FT-IR analysis was conducted to verify the formation of the drug/QD complexes.
Interaction of siRNA with QD nanocarriers
To confirm the ability of the QD nanocarriers to deliver siRNA, the same concentration of siRNA was permitted to interact with QD nanocarriers at different molar ratios (2, 5, 10, 25, 50, 100, 200 siRNA:QD). Samples were then loaded on 2% agarose gels for electrophoresis. Naked siRNA was set as the negative control. In addition, qualitative and quantitative in vitro experiments were conducted to authenticate the ability of such modified QDs to act as siRNA carriers. After incubation of naked siRNAFAM with modified QDs in PBS for 1 hour, the complexes were added to culture medium and incubated with A549 cells for 3 hours. Confocal laser scanning microscopy was used to directly view the localization of the siRNAFAM and QDs. Cells were harvested at the indicated time point to conduct flow cytometric analysis for quantitative detection of siRNA transferred into A549 cells by QDs. The transfection agent siPort NeoFX (Thermo Fisher Scientific, Waltham, MA, USA) served as the positive control.
Formulation of drug-loaded QD nanocarrier-siRNA complexes, and cellular uptake analysis by TEM
Drug-loaded and siRNA-bound QDs were prepared as follows: the six types of drug/QD inclusion complexes were individually incubated with siBcl-2 for 1 hour at room temperature to form drug-loaded QD nanocarrier-siBcl-2 complexes. They were: Carbo/α-QDs-siBcl-2, Tax/β-QDs-siBcl-2, Dox/γ-QDs-siBcl-2, Carbo/Tax/α/β-QDs-siBcl-2, Carbo/Dox/α/γ-QDs-siBcl-2, and Tax/Dox/β/γ-QDs-siBcl-2.
For the cellular uptake and release study, A549 cells were first incubated with the aforementioned QD complexes for 1 hour or 3 hours. They were then washed three times with PBS to thoroughly eliminate complexes that had not internalized after incubation. Cell processing was carried out in situ without displacement from the Petri dish. Cells were fixed in a 0.1 M PBS solution containing 2.5% glutaraldehyde and 4% paraformaldehyde for 1 hour, and then rinsed in 0.1 M PBS. The cells were postfixed in 1% osmium tetroxide solution for 1 hour, rinsed with distilled water, stained with 0.5% uranyl acetate for 1 hour, dehydrated in a graded series of ethanol washes (30%, 60%, 70%, 90%, and 100%), and embedded in epoxy resin. The resins were polymerized at 60°C for 48 hours. Ultrathin sections (50–75 nm) sliced with an ultramicrotome (LKB Bromma Ultrotome III - 8801A Ultramicrotome w/8802A) were stained with 2% aqueous uranyl acetate and 2% aqueous lead citrate for TEM observation.
Gene expression analysis by qRT-PCR and Western blot
The gene expression in A549 cells after treatment with QD-siBcl-2 complexes with or without drug encapsulation was evaluated by qRT-PCR and Western blot, at mRNA and at protein levels, respectively. A549 cells were seeded in six-well cell culture plates and allowed to attach overnight at 37°C in a 5% CO2 incubator. The cell culture medium was changed on the next day and 50 nM QD-siBcl-2 complexes with or without drug loading were added and incubated with A549 cells for 72 hours (Carbo: 500 nM; Tax: 0.03 nM; Dox: 32 nM). The siPort NeoFX commercial siRNA delivery system was used as the positive control. The cells were finally harvested and lysed to extract total RNA and protein separately for qRT-PCR and Western blot.
In the qRT-PCR analysis, reverse transcription was performed with 1 μg total RNA using a PrimeScript First Strand cDNA Synthesis Kit (Takara, Osaka, Japan) to synthesize cDNA. Then, 2 μL cDNA was used to conduct the PCR experiment using a One-Step SYBR PrimeScript RT-PCR Kit (Takara), according to the manufacturer’s protocol, and a Light Cycler 2.0 System (Hoffman-La Roche Ltd., Basel, Switzerland). The primers used in qRT-PCR were: Bcl-2 forward 5′-AACATCGCCCTGTGGATGAC-3′, Bcl-2 reverse 5′-AGAGTCTTCAGAGACAGCCAGGAG-3′. The amplification curves for all samples were obtained, and the relative amounts of Bcl-2 mRNA were normalized to β-actin mRNA. The specificity in the amplifications was confirmed by the melting curves.
In the Western blot analysis, the concentration of isolated total protein was detected using a BCA Protein Assay Kit (Thermo Fisher Scientific). Total protein (50 μg) was electrophoresed on a 12% polyacrylamide gel and transferred to a polyvinylidene difluoride membrane (EMD Millipore, Billerica, MA, USA). The membranes were blocked in Tris-buffered saline containing Tween 20 and 5% skimmed milk at room temperature. Afterward, the membranes were incubated with 5% milk-blocking buffer containing a 1:1,000 dilution of either anti-Bcl-2 monoclonal antibody or anti-β-actin monoclonal antibody (Santa Cruz Biotechnology Inc., Dallas, TX, USA) on a horizontal shaker at 4°C overnight. After incubation with goat anti-mouse IgG conjugated to horseradish peroxidase (1:2,000) for 1 hour and treatment with an enhanced chemiluminescence detection kit, bands were imaged using a FluorChem Q system (Hoffman-La Roche Ltd.). The intensity of the bands was quantified by Image J software.
Cell cycle analysis by flow cytometry
Flow cytometric analysis was performed to study the effect of various formulations of drug/QD complexes in the presence and absence of siBcl-2 (50 nM) on the cell cycle of A549 cancer cells. Free drugs at the same concentrations as the encapsulated drugs were used as controls to illustrate the effect of the delivery systems (Carbo: 500 nM; Tax: 0.03 nM; Dox: 32 nM). After treatment with drug/QD complexes for 24 hours, cells were washed with PBS, resuspended at 50 μg/mL in PBS solution containing 0.1 mg/mL RNase A and 0.05% Triton X-100, and incubated at 37°C for 30 minutes. Afterward, the samples were analyzed on a FACSCalibur Cell Analyzer (BD Biosciences, San Jose, CA, USA). Data analysis was conducted by ModFit LT 3.2 software.
Apoptosis assay by MTT and flow cytometry
The apoptosis of A549 lung cancer cells induced by free drugs and drug/QD complexes with or without siBcl-2 (50 nM) was assessed by both MTT assay and an Alexa Fluo® 488 Annexin V/PI Apoptosis Kit (Thermo Fisher Scientific). Untreated A549 cells served as the negative control, and cells treated with free drugs served as the positive control. After exposure to various drug formulations at equivalent concentrations (Carbo: 500 nM; Tax: 0.03 nM; Dox: 32 nM) for 72 hours, MTT solution was added to each well to detect cell viability based on the absorption of the formazan product dissolved in DMSO. Viability was calculated by comparison to the blank control using the formula, (test/control) ×100%. In addition, after 72-hour incubation with such QD complexes, cells were thoroughly washed with cold PBS and collected for treatment using Annexin V/PI Apoptosis Kits according to the manufacturer’s protocol. The fluorescence of stained cells was measured at 530 nm and 585 nm with 488 nm excitation, and FlowJo software was used to process the data.
Statistical analysis
All experiments were performed at least three times and results are given as mean ± standard deviation (n=3). The statistical analysis was conducted using a two-sided Student’s t-test or one-way ANOVA. The differences were considered statistically significant for P<0.05 and for P<0.01.
Acknowledgments
We thank the financial support from the National Natural Science Foundation of China (Nos. 21231007, 21572282), 973 Program (No. 2014CB845604), Guangdong Provincial Government (2013B051000047, 20130501c, 207999), and the Fundamental Research Funds for the Central Universities.
Disclosure
The authors report no conflicts of interest in this work.
References
Herbst RS, Heymach JV, Lippman SM. Molecular origins of cancer lung cancer. N Engl J Med. 2008;359:1367–1380. | ||
Gottesman MM, Fojo T, Bates SE. Multidrug resistance in cancer: role of ATP-dependent transporters. Nat Rev Cancer. 2002;2(1):48–58. | ||
Citron ML, Berry DA, Cirrincione C, et al. Randomized trial of dose-dense versus conventionally scheduled and sequential versus concurrent combination chemotherapy as postoperative adjuvant treatment of node-positive primary breast cancer: first report of intergroup trial C9741/cancer and leukemia group B trial 9741. J Clin Oncol. 2003;21(8):1431–1439. | ||
Yardley DA. Drug resistance and the role of combination chemotherapy in improving patient outcomes. Int J Breast Cancer. 2013;2013:137414. | ||
Dreicer R, Manola J, Roth BJ, et al. Phase III trial of methotrexate, vinblastine, doxorubicin, and cisplatin versus carboplatin and paclitaxel in patients with advanced carcinoma of the urothelium. Cancer. 2004;100(8):1639–1645. | ||
du Bois A, Lück HJ, Meier W, et al; Arbeitsgemeinschaft Gynäkologische Onkologie Ovarian Cancer Study Group. A randomized clinical trial of cisplatin/paclitaxel versus carboplatin/paclitaxel as first-line treatment of ovarian cancer. J Natl Cancer Inst. 2003;95(17):1320–1329. | ||
Pujade-Lauraine E, Wagner U, Aavall-Lundqvist E, et al. Pegylated liposomal doxorubicin and carboplatin compared with paclitaxel and carboplatin for patients with platinum-sensitive ovarian cancer in late relapse. J Clin Oncol. 2010;28(20):3323–3329. | ||
Chen AM, Zhang M, Wei D, et al. Co-delivery of doxorubicin and Bcl-2 siRNA by mesoporous silica nanoparticles enhances the efficacy of chemotherapy in multidrug-resistant cancer cells. Small. 2009;5(23):2673–2677. | ||
Nardone G, Rocco A, Vaira D, et al. Expression of COX-2, mPGE-synthase1, MDR-1 (P-gp), and Bcl-xL: a molecular pathway of H pylori-related gastric carcinogenesis. J Pathol. 2004;202(3):305–312. | ||
Davis ME, Chen ZG, Shin DM. Nanoparticle therapeutics: an emerging treatment modality for cancer. Nat Rev Drug Discov. 2008;7(9):771–782. | ||
Gamboa JM, Leong KW. In vitro and in vivo models for the study of oral delivery of nanoparticles. Adv Drug Deliv Rev. 2013;65(6):800–810. | ||
Petros RA, DeSimone JM. Strategies in the design of nanoparticles for therapeutic applications. Nat Rev Drug Discov. 2010;9(8):615–627. | ||
Saha K, Agasti SS, Kim C, Li X, Rotello VM. Gold nanoparticles in chemical and biological sensing. Chem Rev. 2012;112(5):2739–2779. | ||
Zhang Y, Chan HF, Leong KW. Advanced materials and processing for drug delivery: the past and the future. Adv Drug Deliv Rev. 2013;65(1):104–120. | ||
Hu CM, Aryal S, Zhang L. Nanoparticle-assisted combination therapies for effective cancer treatment. Ther Deliv. 2010;1(2):323–334. | ||
Khan M, Ong ZY, Wiradharma N, Attia AB, Yang YY. Advanced materials for co-delivery of drugs and genes in cancer therapy. Adv Healthc Mater. 2012;1(4):373–392. | ||
Lee JH, Nan A. Combination drug delivery approaches in metastatic breast cancer. J Drug Deliv. 2012;2012:915375. | ||
Minko T. Nanotechnology and drug resistance. Adv Drug Deliv Rev. 2013;65(13–14):1665–1666. | ||
Wang Y, Gao S, Ye WH, Yoon HS, Yang YY. Co-delivery of drugs and DNA from cationic core-shell nanoparticles self-assembled from a biodegradable copolymer. Nat Mater. 2006;5(10):791–796. | ||
Chen W, Yuan Y, Cheng D, Chen J, Wang L, Shuai X. Co-delivery of doxorubicin and siRNA with reduction and pH dually sensitive nanocarrier for synergistic cancer therapy. Small. 2014;10(13):2678–2687. | ||
Meng H, Liong M, Xia T, et al. Engineered design of mesoporous silica nanoparticles to deliver doxorubicin and P-glycoprotein siRNA to overcome drug resistance in a cancer cell line. ACS Nano. 2010;4(8): 4539–4550. | ||
Xiong XB, Lavasanifar A. Traceable multifunctional micellar nanocarriers for cancer-targeted co-delivery of MDR-1 siRNA and doxorubicin. ACS Nano. 2011;5(6):5202–5213. | ||
Zhu C, Jung S, Luo S, et al. Co-delivery of siRNA and paclitaxel into cancer cells by biodegradable cationic micelles based on PDMAEMA-PCL-PDMAEMA triblock copolymers. Biomaterials. 2010;31(8):2408–2416. | ||
Gidwani B, Vyas A. A comprehensive review on cyclodextrin-based carriers for delivery of chemotherapeutic cytotoxic anticancer drugs. Biomed Res Int. 2015;2015:198268. | ||
Mellet CO, Fernández JMG, Benito JM. Cyclodextrin-based gene delivery systems. Chem Soc Rev. 2011;40(3):1586–1608. | ||
O’Mahony AM, Ogier J, Darcy R, Cryan JF, O’Driscoll CM. Cationic and PEGylated amphiphilic cyclodextrins: co-formulation opportunities for neuronal siRNA delivery. PLoS One. 2013;8(6):e66413. | ||
Saad M, Garbuzenko OB, Minko T. Co-delivery of siRNA and an anticancer drug for treatment of multidrug-resistant cancer. Nanomedicine (Lond). 2008;3(6):761–776. | ||
Probst CE, Zrazhevskiy P, Bagalkot V, Gao X. Quantum dots as a platform for nanoparticle drug delivery vehicle design. Adv Drug Deliv Rev. 2013;65(5):703–718. | ||
Smith AM, Duan H, Mohs AM, Nie S. Bioconjugated quantum dots for in vivo molecular and cellular imaging. Adv Drug Deliv Rev. 2008;60(11):1226–1240. | ||
Biju V, Itoh T, Ishikawa M. Delivering quantum dots to cells: bioconjugated quantum dots for targeted and nonspecific extracellular and intracellular imaging. Chem Soc Rev. 2010;39(8):3031–3056. | ||
Zrazhevskiy P, Gao X. Multifunctional quantum dots for personalized medicine. Nano Today. 2009;4(5):414–428. | ||
Zrazhevskiy P, Sena M, Gao X. Designing multifunctional quantum dots for bioimaging, detection, and drug delivery. Chem Soc Rev. 2010;39(11):4326–4354. | ||
Li JM, Zhao MX, Su H, et al. Multifunctional quantum-dot-based siRNA delivery for HPV18 E6 gene silence and intracellular imaging. Biomaterials. 2011;32(31):7978–7987. | ||
Zhao MX, Li JM, Du L, et al. Targeted cellular uptake and siRNA silencing by quantum-dot nanoparticles coated with beta-cyclodextrin coupled to amino acids. Chemistry. 2011;17(18):5171–5179. | ||
Zhao MX, Xia Q, Feng XD, et al. Synthesis, biocompatibility and cell labeling of L-arginine-functional beta-cyclodextrin-modified quantum dot probes. Biomaterials. 2010;31(15):4401–4408. | ||
Huang H, Tang G, Wang Q, et al. Two novel non-viral gene delivery vectors: low molecular weight polyethylenimine cross-linked by (2-hydroxypropyl)-beta-cyclodextrin or (2-hydroxypropyl)-gamma-cyclodextrin. Chem Commun. 2006;(22):2382–2384. | ||
Ciardiello F. Inhibition of bcl-2 as cancer therapy. Ann Oncol. 2002;13(4):501–502. | ||
Agüeros M, Ruiz-Gatón L, Vauthier C, et al. Combined hydroxypropyl-beta-cyclodextrin and poly(anhydride) nanoparticles improve the oral permeability of paclitaxel. Eur J Pharm Sci. 2009;38(4):405–413. | ||
Monnaert V, Betbeder D, Fenart L, et al. Effects of gamma- and hydroxypropyl-gamma-cyclodextrins on the transport of doxorubicin across an in vitro model of blood-brain barrier. J Pharmacol Exp Ther. 2004;311(3):1115–1120. | ||
Utsuki T, Brema H, Pithab J, et al. Potentiation of anticancer effects of microencapsulated carboplatin by hydroxypropyl-α-cyclodextrin. J Control Release. 1996;40(3):251–260. |
 © 2016 The Author(s). This work is published and licensed by Dove Medical Press Limited. The full terms of this license are available at https://www.dovepress.com/terms.php and incorporate the Creative Commons Attribution - Non Commercial (unported, v3.0) License.
By accessing the work you hereby accept the Terms. Non-commercial uses of the work are permitted without any further permission from Dove Medical Press Limited, provided the work is properly attributed. For permission for commercial use of this work, please see paragraphs 4.2 and 5 of our Terms.
© 2016 The Author(s). This work is published and licensed by Dove Medical Press Limited. The full terms of this license are available at https://www.dovepress.com/terms.php and incorporate the Creative Commons Attribution - Non Commercial (unported, v3.0) License.
By accessing the work you hereby accept the Terms. Non-commercial uses of the work are permitted without any further permission from Dove Medical Press Limited, provided the work is properly attributed. For permission for commercial use of this work, please see paragraphs 4.2 and 5 of our Terms.