")
Back to Journals » Patient Preference and Adherence » Volume 15
Effective Analysis of Inpatient Satisfaction: The Random Forest Algorithm
Authors Li C , Liao C, Meng X, Chen H, Chen W, Wei B, Zhu P
Received 27 November 2020
Accepted for publication 10 March 2021
Published 7 April 2021 Volume 2021:15 Pages 691—703
DOI https://doi.org/10.2147/PPA.S294402
Checked for plagiarism Yes
Review by Single anonymous peer review
Peer reviewer comments 3
Editor who approved publication: Dr Naifeng Liu
Chengcheng Li,1 Conghui Liao,2 Xuehui Meng,3 Honghua Chen,4 Weiling Chen,4 Bo Wei,5 Pinghua Zhu1
1School of Humanities and Social Sciences, Guangxi Medical University, Nanning, 530021, People’s Republic of China; 2School of Public Health, Sun Yat-Sen University, Guangzhou, 510080, People’s Republic of China; 3Department of Health Service Management, Humanities and Management School, Zhejiang Chinese Medical University, Hangzhou, 310000, People’s Republic of China; 4School of Basic Medicine, Guangxi Medical University, Nanning, 530021, People’s Republic of China; 5School of Information and Management, Guangxi Medical University, Nanning, 530021, People’s Republic of China
Correspondence: Pinghua Zhu Email [email protected]
Purpose: To identify the factors influencing inpatient satisfaction by fitting the optimal discriminant model.
Patients and Methods: A cross-sectional survey of inpatient satisfaction was conducted with 3888 patients in 16 large public hospitals in Zhejiang Province. Independent variables were screened by single-factor analysis, and the importance of all variables was comprehensively evaluated. The relationship between patients’ overall satisfaction and influencing factors was established, the relative risk was evaluated by marginal benefit, and the optimal model was fitted using the receiver operating characteristic curve.
Results: Patients’ overall satisfaction was 79.73%. The five most influential factors on inpatient satisfaction, in this order, were: patients’ right to know, timely nursing response, satisfaction with medical staff service, integrity of medical staff, and accuracy of diagnosis. The prediction accuracy of the random forest model was higher than that of the multiple logistic regression and naive Bayesian models.
Conclusion: Inpatient satisfaction is related to healthcare quality, diagnosis, and treatment process. Rapid identification and active improvement of the factors affecting patient satisfaction can reduce public hospital operating costs and improve patient experiences and the efficiency of health resource allocation. Public hospitals should strengthen the exchange of medical information between doctors and patients, shorten waiting time, and improve the level of medical technology, service attitude, and transparency of information disclosure.
Keywords: random forest, inpatient satisfaction, public hospitals, key influencing factors
Introduction
The economic development history of many industrialized and post-industrialized countries reflects the rapid transformation of urban and rural structures.1 In 2000, patient satisfaction was first proposed by World Health Organization (WHO) as an important indicator to measure the quality of medical services in public hospitals.2,3 Good medical experience not only improves the quality of life of patients but also reduces the disagreements between doctors and patients, which has a positive impact on the whole medical ecology. The patient satisfaction of inpatients can directly reflect the medical technology standards and medical service quality of public hospitals in China.4 Therefore, it is vital to improve the quality of medical service and the utilization efficiency of health resources by exploring the risk factors of inpatient satisfaction in Chinese cities.5 Many theoretical model studies have assessed the association between a large number of independent variables and patient satisfaction through the use of different statistical methods, including naive Bayesian algorithm, support vector machine, logistic regression, decision tree, and other machine learning models.6–11 A study in 2019 examined the risk factors of patient satisfaction by using logistic regression analysis.12 Baek et al used a generalized ordered logistic regression model instead of performing a binary logistic regression analysis, which may yield incorrect results with fewer factors of patient satisfaction.13 Liu indicated that the deficiency of ordinal logistic regression in the study of ordered variables is based on the difficulty of analysis in the field of treatment methods.14 Nusinovici et al found that the predictive power of logistic regression and the machine learning model was consistent in the study of risk prediction and clinical predictors of common chronic diseases.15 Belciug explored the application of gene expression data sets in cancer research by embedding a logistic regression into relevant mathematical algorithms.16 Khani selected stable genes with high classification using logistic regression.17 However, the traditional multiple logistic regression has problems of low evaluation efficiency, multicollinearity, and overfitting. As a linear classifier, logistic regression model requires all features to be linear. When it comes to nonlinear features, it requires a complex transformation, which makes modeling difficult and affects performance. It cannot analyze large sample and multiclassification variables well. Meanwhile, naive Bayes classifier is a classic data mining algorithm, which has been widely used.18
Yue explored and improved the congenital defects of the naive Bayes classifier.19 However, the random forest algorithm can identify the hidden and complex endogeneity of original data more effectively than a traditional model. Some studies have shown that the prediction performance of a random forest is always better than that of traditional models, such as super vector machines and logistic models in the economic field.20,21 Based on its inherent advantages, the random forest model performs well in psychological research with topics such as customer loyalty and winning or losing probabilities.22,23 Random forest has been widely used in medicine in the last 10 years. It has demonstrated excellent performance in a large number of medical experiments with its high precision, tendency to avoid overfitting, and other advantages. It has gradually become one of the most popular frontier research methods in biomedicine and bioinformatics and has good application prospects. A series of studies by Chinese scholars on disease risk gene identification, risk single-nucleotide polymorphism recognition, protein interaction networks, and other topics have been internationally recognized due to their use of random forest.24–30 International scholars have also made great progress in gene, tumor, and medical impact research using random forest.31–34 Machine learning is becoming increasingly valuable and relevant in the field of healthcare.35 There are few studies that explore the impact of different variables on patient satisfaction and the most appropriate evaluation methods of patient satisfaction.
In this study, we introduce machine learning and use the random forest model with the most significant classification effect to predict the influencing factors of patient satisfaction more objectively. Compared with traditional evaluation methods, the random forest model not only has higher evaluation efficiency and accurate dimensionality reduction but also has better accuracy.36,37 At the same time, the random forest algorithm avoids the need for large sample size and the poor feature selection typical for decision trees by utilizing a double random sampling of samples and variables. At present, many scholars are committed to exploring a better classification method to study patient satisfaction in order to improve and standardize the medical quality control system.38
Therefore, this study attempts to construct an optimal prediction model of the influencing factors of inpatient satisfaction. The study is based on data of inpatient satisfaction of 16 provincial public hospitals in Zhejiang Province, a developed province on the east coast of China. The purpose of this study was to determine a scientific and reliable method of analysis regarding patient satisfaction, thus providing a reference for establishing a standard patient satisfaction evaluation system and improving the quality of medical services.
Patients and Methods
Ethics Statement
The survey content and scheme of this study were approved by Zhejiang Provincial Health Commission, which is the official health management organization in China. All 16 tertiary hospitals had been aware of the survey content and had agreed to participate in the project. The content of the survey does not involve any personal information, such as name, photo, or telephone number. All interviewed patients had given their consent before the start of the investigation and signed informed consent forms. The research process is consistent with the Helsinki Declaration of 2013.
Data Sources and Respondents
For this survey, we used information from 16 public hospitals in 4 categories in Zhejiang Province, including 7 general hospitals, 5 specialized hospitals, 2 traditional Chinese medicine hospitals, and 2 integrated Chinese and Western medicine hospitals. The survey was conducted from January to December 2017. Data of patients discharged in the previous month were collected every month. We collected 4320 questionnaires, and 3888 were completed in full, giving us an effective rate of 90%.
Patients met the inclusion criteria if they were aged 18–70 years, were receiving treatment in the designated hospitals and were hospitalized or had a nonphysical examination.
Method of Investigation
In this study, a questionnaire assessing patient satisfaction was used in a computer-assisted telephone survey. Based on the information of discharged patients, computer-assisted telephone interviews were conducted to ensure the authenticity and reliability of the data.39
The question “How satisfied are you with this hospitalization?” was the outcome variable for inpatient satisfaction and was scored on a 5-point Likert scale: 1 = “very dissatisfied,” 2 = “dissatisfied,” 3 = “neutral,” 4 = “relatively satisfied,” and 5 = “very satisfied.” The responses of “very satisfied” and “relatively satisfied” were defined as “good” (with a value of 1); other responses were defined as “poor” (with a value of 0). For explanatory variables, the response of “very satisfied” and “relatively satisfied” were defined as “good” (with a value of 1); other responses were defined as “poor” (with a value of 0).
Methods of Analysis
Epidata 4.6.0 was used to input and organize the data of the 3888 valid questionnaires. R3.6.1 was used for the data analysis.
Sample Quality Control
An attempt was made to estimate the number of samples required for this study. The sample size estimation formula is as follows:

Here, n is the sample size,  is the overall satisfaction rate, and
  is the desired level of precision. The overall satisfaction of our survey is 79.73% (n=3888). Meanwhile, we assume 95% confidence and 5% precision. Therefore, the sample size was:
 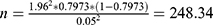 . The number of effective samples in this study is 3888, which is much higher than the minimum sample size 248.
Multiple Logistic Regression
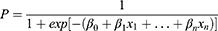
First, the patients were divided into two groups according to their satisfaction scores, and the explanatory variables were analyzed using single-factor analysis. Univariate analysis was used because of the number of variables; univariate analysis can effectively eliminate some confounding factors and ensure the reliability of the results in the population study. Then, according to the results of the single factor analysis, the influencing factors with statistical differences (P < 0.05) were included in the multiple logistic regression analysis. The basic expression of the logistic regression model is as follows:40

where P is the probability of good satisfaction with the overall evaluation of inpatient medical services, n is the total number of independent variables,  is the logistic regression correlation coefficient of each independent variable, and
  is an independent variable influencing the satisfaction of inpatients. Here, ε is a random perturbation term.
The probability of good satisfaction with the overall evaluation of inpatient medical services is p (binomial dependent variable y = 1), and the probability of poor satisfaction is 1-p (binomial dependent variable y = 0). The probability prediction model of satisfaction is obtained as follows:
Random Forest Model Construction
The differences in the importance of influencing factors were further explored through discriminant analysis. First, we divided the dataset into two parts: training set comprising 70% of the data (data for building the model) and test set comprising 30% (data for identifying the best model) to test the effect of the model and test the generalization ability of the model. This process is completed by bootstrap random sampling, in which the missing data are supplemented by the random forest interpolation method.41,42,43 We used the random forest classifier method to construct different training datasets and finally fit the multiple classifier combination model based on avoiding local maximum.43 The final classification results were defined as follows:
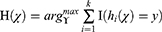
where  is the combined multi-classifier model, I (·) is the indicative function,
  is the input vector, y is the outcome variable,
  is the single decision tree model, and
  is the number of decision trees.
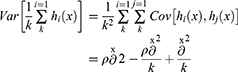
Second, the optimal combination of parameters is determined according to the mtry value when the model error rate is the lowest, and the ntree values range from 1 to 500. The mean square deviation of error rate with the number of decision trees was obtained by comparing and analyzing each outcome variable and comprehensive data in the dataset. The prediction error rate of random forest for out-of-bag samples is called out-of-bag error, and the optimal combination is when the out-of-bag error rate is the minimum41,43 (Figure 1). The mean square error is defined as
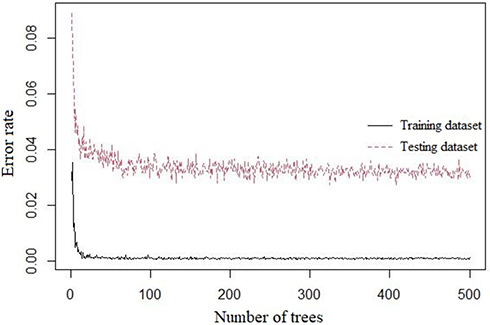 |
Figure 1 Tree values and error distribution. |
where ρ is the correlation coefficient of the population, and ð is the population standard deviation. It can be seen from the formula that the variance can be reduced by decreasing the ρ or increasing the k, and the variance can be reduced by making each decision tree more independent or increasing the number of decision trees in the forest.
Third, the Gini index method was used to measure the variable importance measurement of the adjusted random forest prediction model, and the satisfaction-related risk factors that significantly affected the satisfaction of inpatients were identified.43 A decrease in average Gini value indicates a decrease in average impurity at the variable partition node of all trees. The higher the value, the greater the importance of the variable. The Gini index can be expressed as follows:44
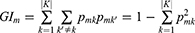
Here, k represents K categories, and  represents the proportion of category K in node M.
Naive Bayesian Analysis
Naive Bayes is a simple multi-class classification algorithm based on the assumption of independence between eigenvalues. In other words, in the one-time transfer of training data, the conditional probability distribution of each feature of a given tag is calculated, and then the conditional probability distribution of a given observation tag is calculated using the Bayesian theorem and used for prediction.45 The mathematical expressions are as follows:
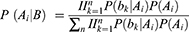

Suppose the characteristics of each dimension B1, B2 Bn-1, and Bn are independent of each other. The prior probability ( ) is calculated according to the training set data.
Identifying the Optimal Model
We attempted to determine the best prediction model through the mutual verification of the logistic regression model, the random forest model, and the naive Bayes model.
First, the prediction efficiency and accuracy of the prediction models were tested, and the accuracy was improved by adjusting the prediction model. Accuracy, classification error rate, precision, recall, and F1_score were the five indicators of score used to evaluate the classification performance. The formulas used were as follows:
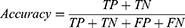

Here, TP (true positive) means that the model correctly judges a positive sample as a positive sample, FP (false positive) means that the model wrongly judges a counter sample as a positive sample, TN (true negative) means that the model correctly judges a counter sample as a positive sample, and FN (false negative) means that the model misjudges a positive example as a counterexample.1 Accuracy is the ratio of the correct number of predicted values to the total amount of data. Generally, the higher the accuracy of the model, the better its effect. Accuracy is the accuracy of prediction of 0, recall rate refers to the accuracy of true 0, and the harmonic average of accuracy and recall is the F1_ score. In the F1_ score calculation formula, precision is abbreviated as P, and recall is abbreviated as R. The F1_score value ranges from 0 to 1, with 1 indicating the best and 0 the worst.
The AUC is the probability that the positive prediction score is greater than the negative prediction score. In other words, it is the C-index (C statistic of Mann Whitney U-test). The receiver operating characteristic (ROC) curve was drawn according to the predicted model. A larger AUC area, which is defined by the ROC curve and the x-axis, means a better classification ability of the current model. The calculation formula is as follows:
where M is the number of positive samples, and N is the number of negative samples.
Finally, we analyzed the marginal impact of satisfaction risk factors on the overall satisfaction of inpatient medical services. Marginal influence refers to the influence of an independent variable on the dependent variable while ignoring all other independent variables. We analyzed the detailed relationship between the four most important independent variables and the outcome variables to make the results of this study more objective and complete. The patients were divided into two groups according to their satisfaction scores, and the explanatory variables were tested using single-factor analysis.
Results
Overall Description of the Analysis
The results showed that the overall satisfaction of hospitalized patients was 79.73%, and female patients reported higher overall satisfaction than male patients. The average age of hospitalized patients was 43 years. In terms of education, patients with undergraduate degrees accounted for the largest proportion (39.60%). The average annual family income level was low, showing a left-skewed distribution. Furthermore, the proportion of floating population (migrants who stay in a place without local household registration status) was close to half of the permanent population. In addition, patients’ satisfaction with medical services was low.
Single Factor Analysis Results
The results showed that most of the socio-demographic factors (such as sex, age, and education level) and patient satisfaction had no statistical differences (P > 0.05), which was significantly different from the factors influencing outpatient satisfaction.46 There were significant differences in medical insurance and related medical service factors during hospitalization (P < 0.05) as demonstrated in Table 1.
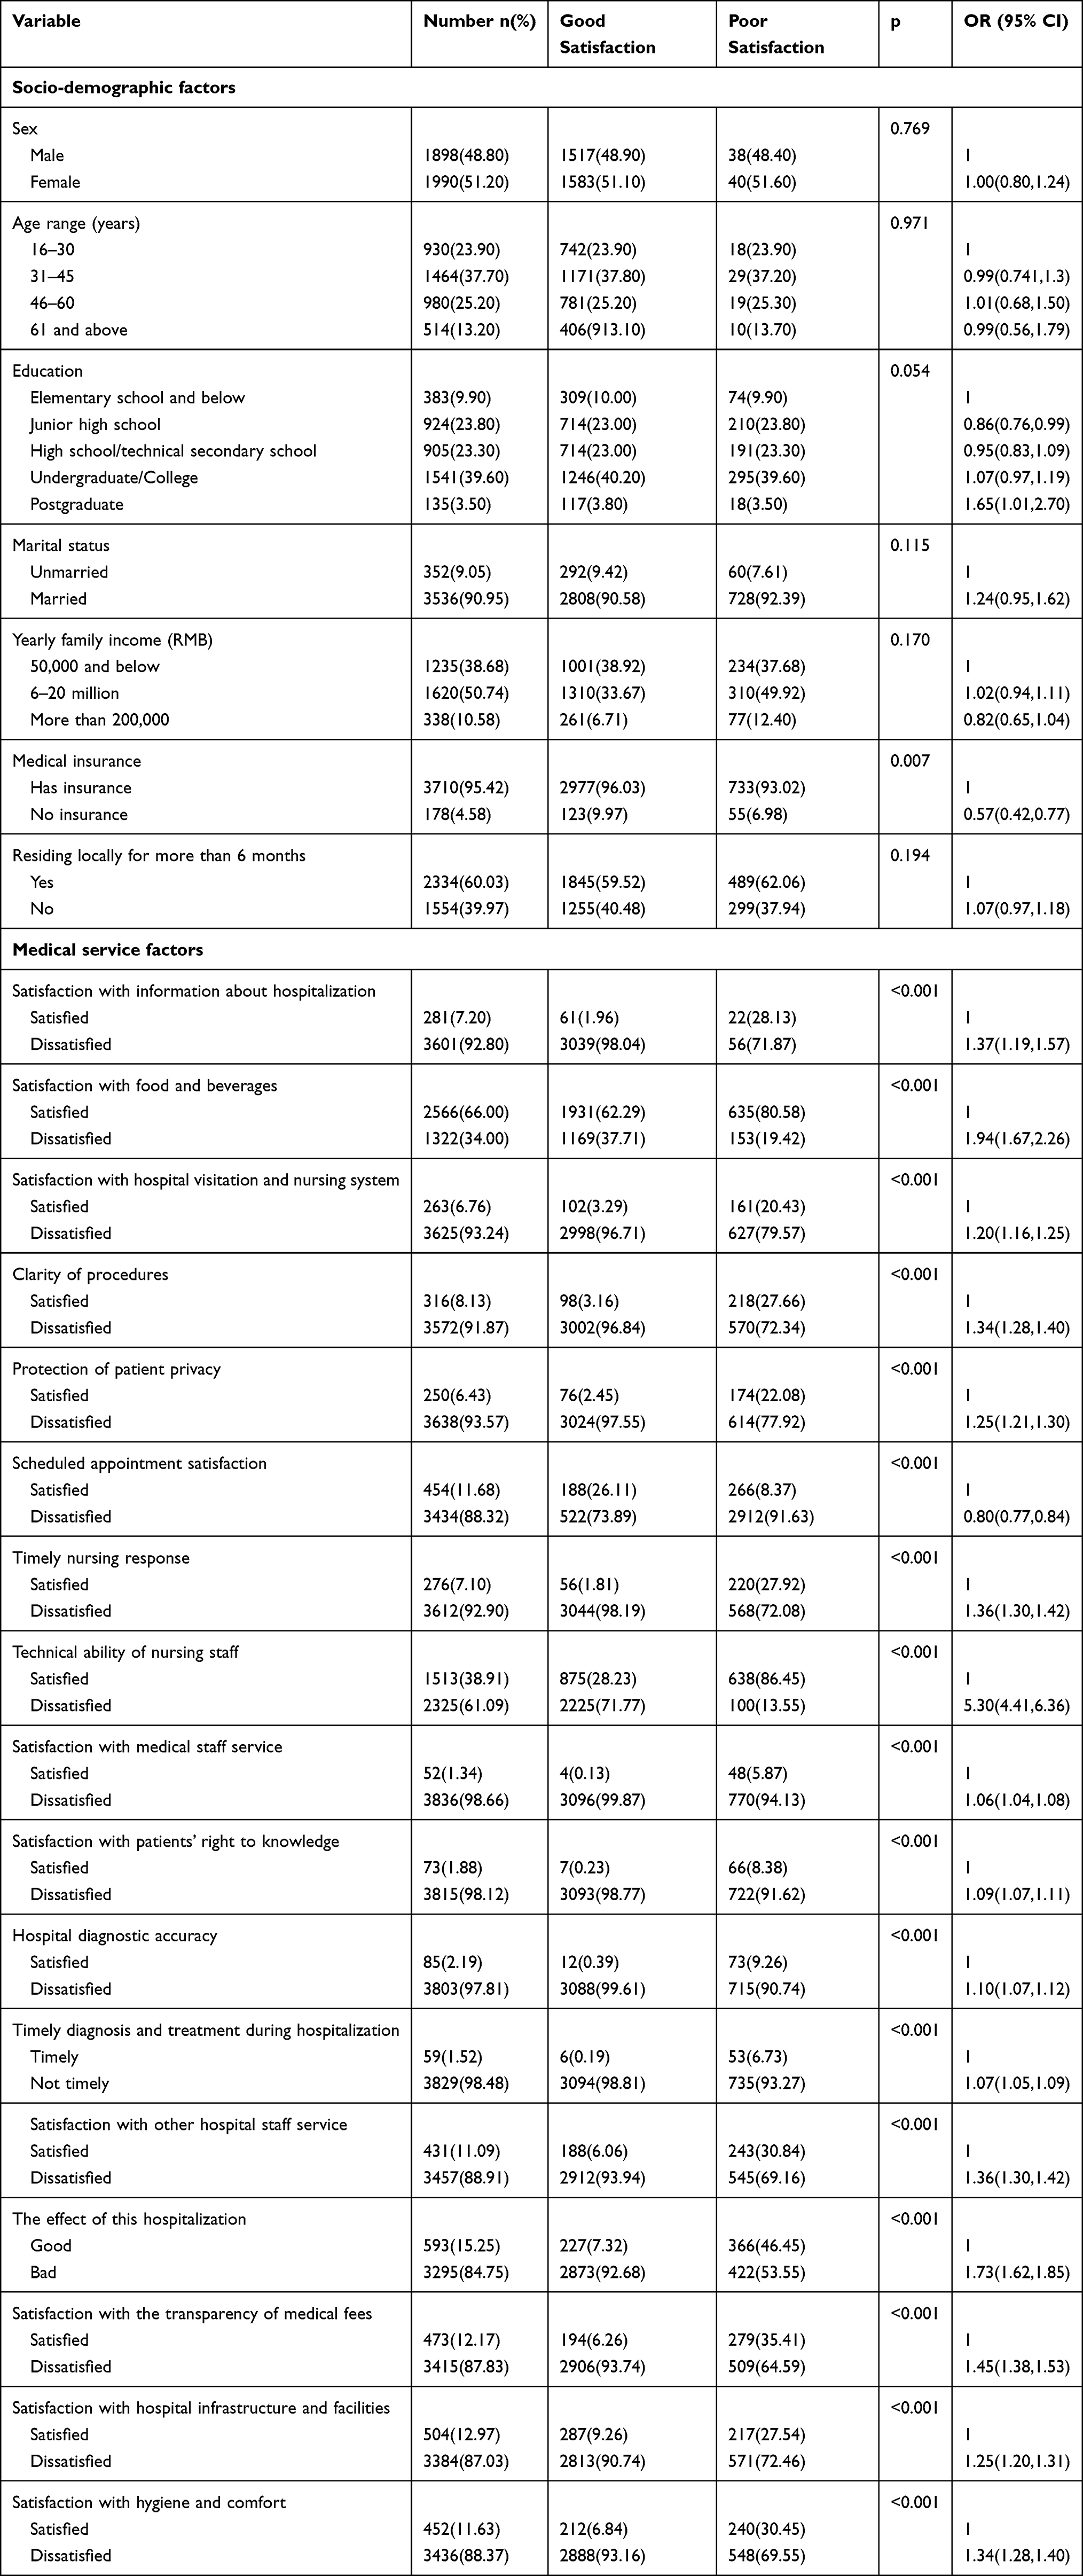 |
Table 1 Results of Univariate Analysis of Risk Factors of Inpatient Satisfaction |
Results of the Multivariate Analysis
The results of the multivariate logistic regression analysis of patient satisfaction and satisfaction risk factors were largely consistent with the overall trend of the random forest model. The results showed that information satisfaction, service satisfaction with medical staff, satisfaction of the right to know, and accuracy of hospital diagnosis were closely associated with the improvement of inpatient satisfaction (P < 0.05) as demonstrated in Table 2. In addition, there were differences in the individual types of medical insurance, and the results of social demographic factors were consistent with the results of the random forest analysis.
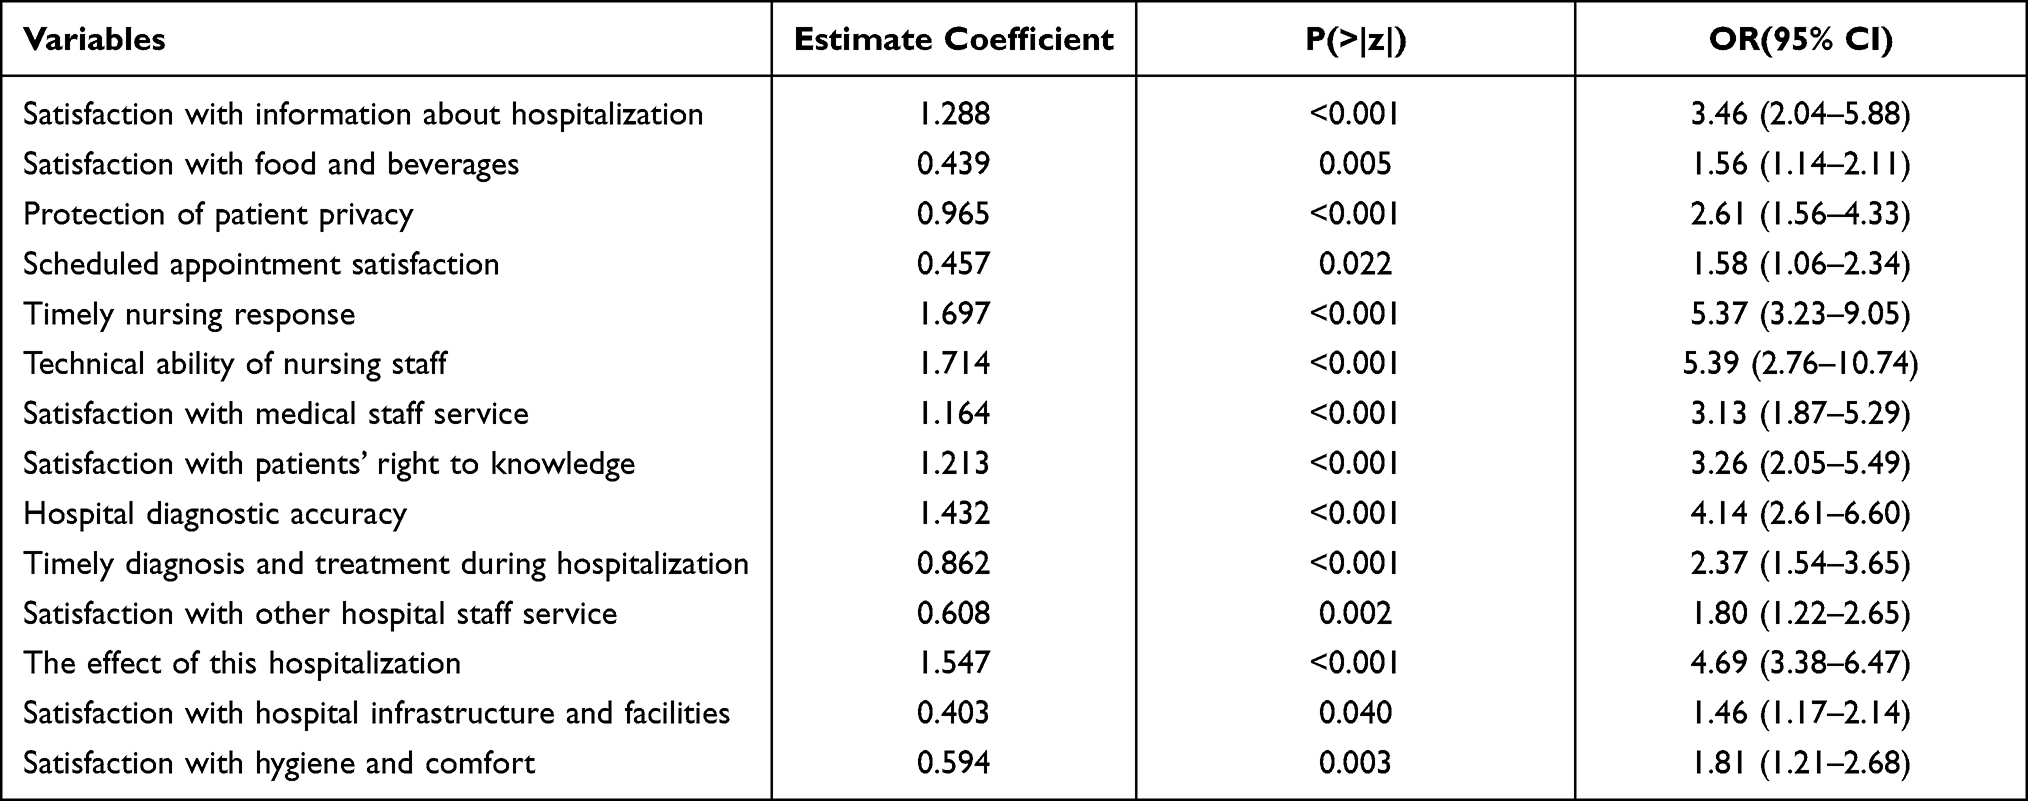 |
Table 2 Multi-Factor Logistic Regression Analysis Results That Affect Inpatient Satisfaction |
The Most Appropriate Model of Inpatient Satisfaction
A comparison of the ROC results shows that the prediction effect of the random forest method is the most accurate. The maximum ROC area was 0.932, and the result of the logistic regression (area 0.882) was better than that of the naive Bayes (area 0.836), indicating that the random forest model is better than the logistic regression and naive Bayes models. The ROC curves corresponding to each algorithm are shown in Figure 2.
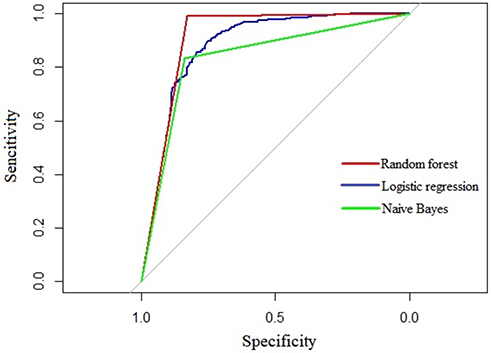 |
Figure 2 Receiver operating characteristic curves of random forest, logistic regression, and naive Bayes. |
Table 3 shows that all models achieved good results, but the random forest model is better than the logistic regression model and the naive Bayes classification model in each evaluation index. The classification accuracy of random forest model, logistic regression model, and naive Bayesian model were 96.57%, 89.71%, and 83.46%, respectively. In addition, the F1_score was 91.42%, 70.00%, and 65.72%, respectively. The evaluation effect of the random forest model is the highest.
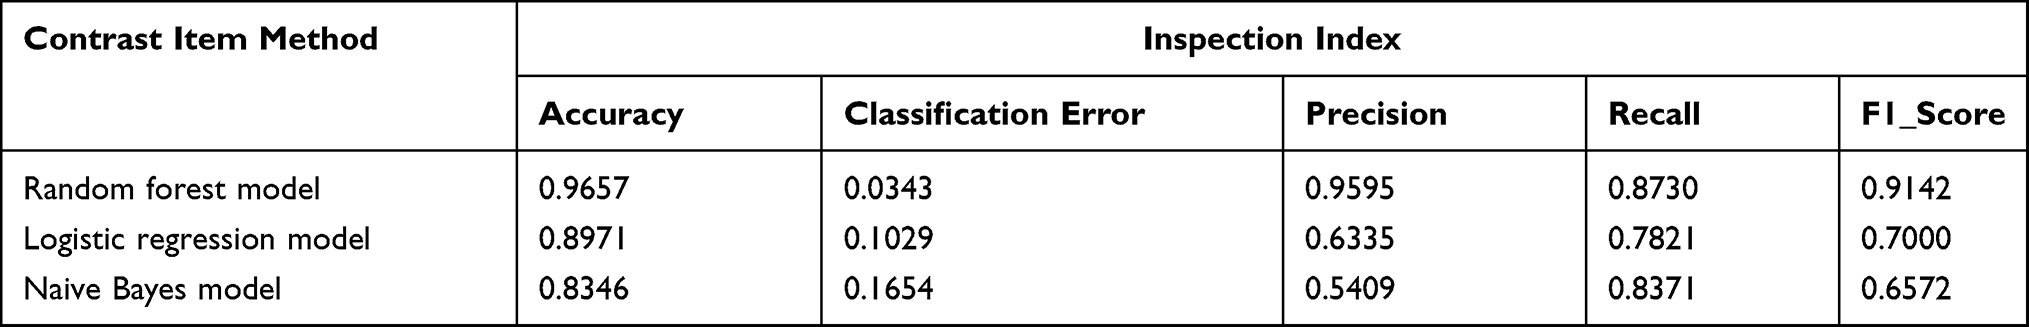 |
Table 3 Analysis and Comparison of Test Results of Random Forest Model, Logistic Regression Model, and Naive Bayes Classification Model |
The random forest model has better practicability and flexibility, and the performance effect is the best in this study. It can not only make high-precision classification decisions but also calculate the importance of each variable.47
Importance of Different Influencing Factors
We plotted the importance of risk factors for inpatient satisfaction through a random forest model. Figure 3 shows the top ten variables, with satisfaction with the right to know and timely nursing response in the top two and clarity of procedures in the 10th.
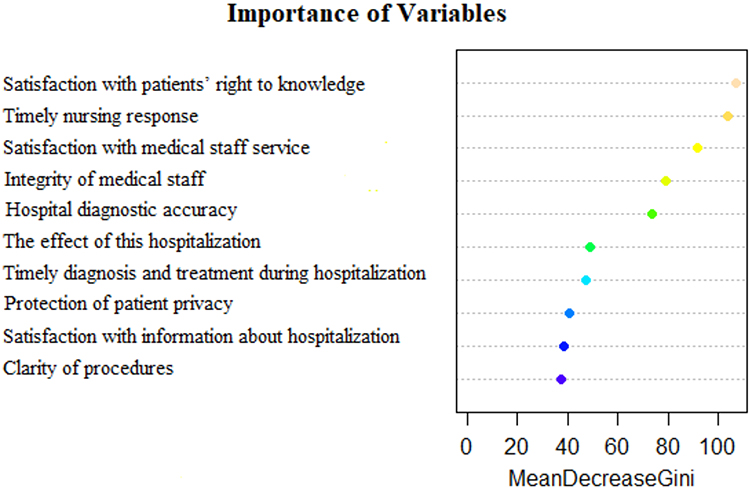 |
Figure 3 Importance ranking of risk factors of inpatient satisfaction in the random forest model. |
Discussion and Conclusion
This study attempts to construct an optimal discriminant model to explore the risk factors related to inpatient satisfaction in public hospitals in megacities of China, and further explore the importance of factors influencing patients. The random forest model is superior to logistic regression and naive Bayes classification models in each evaluation index, with the highest accuracy of 96.57%. This study found that socio-demographic factors had no significant effects on patient satisfaction in urban areas of China. This may be because hospitalized patients are more concerned about the positive role of medical service in improving the quality of life in general, owing to potentially having diseases that are serious. The first five variables (satisfaction with the right to knowledge, timely nursing response, satisfaction of medical staff service, integrity of medical staff, and accuracy of hospital diagnosis) were significantly important. The treatment cost of inpatients in China ranks low globally, indicating that a series of medical reform measures, such as drug “zero plus” policies, diagnosis-related group (DRG) system, use of micro-tools, have significantly reduced the economic burden of patients with major diseases.48 In particular, China’s unique social medical insurance provides universal insurance, which reduces treatment costs for critically ill inpatients; however, this is not related to outpatient satisfaction, as China’s social medical insurance does not yet cover outpatient medical expenses. The economic burden of hospitalized patients has been further reduced with the introduction of the Chinese version of DRG-grouping standards and the establishment of key clinical pathways.49,50 However, the expectation of patient satisfaction may lead to the breakdown of hospitalization system, which can accelerate the adverse selection of patients in public hospitals. Therefore, to improve their motivation at work, medical workers should improve the scale economic benefits of public hospitals by establishing corresponding incentive mechanisms in the implementation of various management tools. Finally, by covering patients’ treatment costs, commercial insurance can indirectly foster positive interactions between doctors and patients, thereby benefitting public hospitals, patients, and insurance companies.
The evaluation and prediction of patient satisfaction is important for many reasons and our study contributes in the following ways. First, modern medical care has been transformed into a social, psychological, physiological, and medical model, from the traditional biological, medical model based on the perspective of patients.51 Few studies have explored the difference in the importance of influencing factors for inpatient satisfaction, and we did this with an in-depth analysis. Patients’ right to knowledge was ranked first among the factors influencing satisfaction. In this study, as a basic right of patients in the process of disease diagnosis and treatment, we explored patient’s right to knowledge. Relevant research has found that improving patients’ right to knowledge is an effective measure for the rehabilitation of hospitalized patients.52 Moreover, further emotional communication and medical information exchange can also significantly improve patient satisfaction by reducing medical disputes. This plays the most important role in effective communication between medical workers and patients in dealing with medical complaints.53 Among the factors, the present role of medical workers needs to be further expanded indirectly. Few studies have explored the specific content of the patient’s right to knowledge, but those that do highlight the patients’ realization of their right to know. Therefore, it is effective to understand the actual needs of patients, improve communication skills, and increase professional training. This will increase the patient’s trust in doctors and nurses, improve treatment and nursing compliance, improve the treatment effect, and increase treatment satisfaction.
Second, the present study showed that the quality of life of patients was significantly improved with timely and effective medical services.54,55 There is a significant association between nurses’ bedside manner and patient satisfaction, and treatment time can affect patients’ satisfaction with medical experience.56–59 It is expected that more differentiated and humanized services will be implemented in the healthcare industry. Some exploratory measures have been gradually used in sample hospitals, such as setting up clear signs, simplifying the process of patient treatment, and using the Internet to make appointments, thus reducing patients’ waiting time. The principle of “patient first” is also helpful in improving the efficiency of day-to-day operations and the effectiveness of nursing work.
Third, the service quality of medical staff is facing higher challenges, and there is a continuous increase in patients’ awareness and healthcare demands. A small sample study conducted in Shanghai reported that the overall satisfaction of inpatients during hospitalization was most affected by nurses’ attitude, followed by doctors’ attitude, cost and environment, and patient sex, which is different from the results of this study.60 This may be because the best quality medical resources are located in Shanghai, as it is the most developed city in China, and the sample size was small. This indirectly reflects that fact that China’s rapid urbanization has exacerbated the imbalance of medical resources. In addition, the proportion of patients with higher education in large cities is increasing. Due to the internal population flow in China, the main workforce is gradually becoming highly educated and moving to large cities. The psychological satisfaction of highly educated patients is more complex. Regarding the processes of diagnosis and treatment, few large sample studies have explored the actual state of satisfaction with patient privacy. Most of the research on patient privacy is concentrated in special diseases or specific departments.61 There is still a lack of psychological professionals in China because the discipline started later than in much of the rest of the world. Therefore, public hospitals should strengthen humanistic care for patients by training psychological experts. Public hospitals should improve the sense of belonging of medical and technical personnel by building brand awareness and keeping up with Mayo Hospital.62,63
Fourth, the accuracy of hospital diagnosis ranked fifth in this study, as one of the key indicators to evaluate patients’ quality of life. This is because public hospitals have become the main places for the treatment of critically ill patients. In China, hospitals benefit from the standardized training of medical practitioners.64 China’s unique political system is extremely strict in monitoring the quality of medical services in public hospitals, so people have no doubt about the diagnostic accuracy of public hospitals in China.65,66 However, China’s health resources, especially doctors, are still scarce.67,68 Public hospitals undertake a large number of clinical operations but also need to take into account the task of medical technology innovation. Therefore, there is still a gap between China and other developed countries in terms of providing adequate follow-up care for discharged patients.69,70 China is actively exploring ways to overcome this issue by relaxing the restrictions of running medical services by social forces. It should be noted that the scarcity of human resources may indirectly breed corruption. Medical ethics and style are codes for the conduct of medical staff and the focus of hospital work. Good medical ethics can not only improve patients’ satisfaction but also enhance the understanding and trust between doctors and patients. Therefore, establishing an effective internal supervision mechanism needs more in-depth study.
Finally, although machine learning algorithms are widely used in the medical field, they provide a new research direction for studying patient satisfaction. Metabonomics and bioinformatics use stochastic forest models for disease classification and diagnosis. Many scholars also use machine learning models to screen and classify the risk of a single disease.71–74 Compared with the traditional multi-factor analysis, the stochastic forest model can avoid the problem of multicollinearity and is stable; thus, it can separate and deeply analyze the influencing factors. This study attempts to fit the optimal prediction model of inpatient satisfaction from the perspective of patients. The random forest model has the highest accuracy and the best prediction ability. In recent years, many scholars are committed to the application of machine learning model in the daily work of the hospital.75,76 It is based on large sample data in the study of patient satisfaction.51,56 Therefore, we suggest using the random forest method to explore the influencing factors in future satisfaction-related research.
Limitations of the Study
There are a few limitations of this study. First, the data were obtained from a cross-sectional survey, so it may be different from the real situation due to measurement error. Second, some influencing factors were not included in this study because they could not be measured, such as traffic and other variables. In future research, we will further quantify the indicators that cannot be measured at present and continuously optimize the model to improve the prediction accuracy, based on the current optimal prediction model.
Author Contributions
All authors made substantial contributions to conception and design, acquisition of data, or analysis and interpretation of data; took part in drafting the article or revising it critically for important intellectual content; agreed to submit to the current journal; gave final approval of the version to be published; and agree to be accountable for all aspects of the work.
Disclosure
The authors declare no conflicts of interest.
References
1. Hughes JCL. American Economic History. San Francisco: Addison Wesley; 2006.
2. Robbins A. The World Health Report 2000: health systems: improving performance. Public Health Rep. 2001;116(3):268–269.
3. Meng RT, Li JJ, Zhang YQ, et al. Evaluation of patient and medical staff satisfaction regarding healthcare services in Wuhan Public Hospitals. Int J Environ Res Public Health. 2018;15(4):769. doi:10.3390/ijerph15040769
4. Zhang J, Zhou F, Ge XX, et al. Reliability and validity of an indicator system used to evaluate outpatient and inpatient satisfaction in Chinese hospitals. Patient Prefer Adhere. 2018;12:2527–2536. doi:10.2147/PPA.S186722
5. Li M, Huang CY, Lu XC, Chen SY, Zhao P, Lu HZ. Evaluation of medical staff and patient satisfaction of Chinese hospitals and measures for improvement. Biosci Trends. 2015;9(3):182–189. doi:10.5582/bst.2015.01043
6. Farooq H, Deckard ER, Ziemba-Davis M, Madsen A, Meneghini RM. Predictors of patient satisfaction following primary total knee arthroplasty: results from a traditional statistical model and a machine learning algorithm. J Arthroplasty. 2020;35:3123–3130. doi:10.1016/j.arth.2020.05.077
7. Sanger PC, Simianu VV, Gaskill CE, et al. Diagnosing surgical site infection using wound photography: a scenario-based study. J Am Coll Surg. 2017;224(1):8–15. doi:10.1016/j.jamcollsurg.2016.10.027
8. Shen F, Larson DW, Naessens JM, Habermann EB, Liu H, Sohn S. Detection of surgical site infection utilizing automated feature generation in clinical notes. J Healthc Inform Res. 2018;3:267–282. doi:10.1007/s41666-018-0042-9
9. Hu Z, Simon GJ, Arsoniadis EG, Wang Y, Kwaan MR, Melton GB. Automated detection of postoperative surgical site infections using supervised methods with electronic health record data. Stud Health Technol Inform. 2015;216:706–710.
10. Soguero-Ruiz C, Fei WME, Jenssen R, Augestad KM, Skrvseth SO. Data-driven temporal prediction of surgical site infection. Amia Ann Symp Proc. 2015;2015:1164–1173.
11. Sohn S, Larson DW, Habermann EB, Naessens JM, Alabbad JY, Liu HF. Detection of clinically important colorectal surgical site infection using Bayesian network. J Surg Res. 2017;209:168–173. doi:10.1016/j.jss.2016.09.058
12. Hu LL, Ding H, Liu SY, Wang ZJ, Hu GY, Liu YL. Influence of patient and hospital characteristics on inpatient satisfaction in China’s tertiary hospitals: a cross-sectional study. Health Expect. 2020;23(1):115–124. doi:10.1111/hex.12974
13. Baek W, Jang Y, Park CG, Moon M. Factors influencing satisfaction with patient-controlled analgesia among postoperative patients using a generalized ordinal logistic regression model. Asian Nurs Res. 2020;14(2):73–81. doi:10.1016/j.anr.2020.03.001
14. Koirala HP. Ordinal regression analysis: using generalized ordinal logistic regression models to estimate educational data. JMASM. 2012.
15. Nusinovici S, Tham YC, Yan MYC, et al. Logistic regression was as good as machine learning for predicting major chronic diseases. J Clin Epidemiol. 2020;122:56–69. doi:10.1016/j.jclinepi.2020.03.002
16. Belciug S. Logistic regression paradigm for training a single-hidden layer feedforward neural network. Application to gene expression datasets for cancer research. J Biomed Inform. 2020;102:102. doi:10.1016/j.jbi.2019.103373
17. Mahmoodian EH, Mahmoodian H. Phase diagram and ridge logistic regression in stable gene selection. Biocybernet Biomed Eng. 2020;40(3):965–976. doi:10.1016/j.bbe.2020.04.003
18. Hui W, Fan Z, Yu-Jie LI. Semi-naive bayesian classifier research based on greedy choice algorithm. J Northeast Normal Univ. 2018.
19. Wang XG, Sun X. Ieee: an improved weighted naive Bayesian classification algorithm based on multivariable linear regression model. In:
20. Larivière B, Poel DVD. Predicting customer retention and profitability by using random forests and regression forests techniques. Expert Syst Appl. 2004;29(2):472–484. doi:10.1016/j.eswa.2005.04.043
21. Coussement K, Poel DVD. Churn prediction in subscription services: an application of support vector machines while comparing two parameter-selection techniques. Expert Syst Appl. 2008;34(1):313–327. doi:10.1016/j.eswa.2006.09.038
22. Buckinx W, Verstraeten G, Van den poel D. Predicting customer loyalty using the internal transactional database. Expert Syst Appl. 2007;32(1):125–134. doi:10.1016/j.eswa.2005.11.004
23. Lessmann S, Sung MC, Johnson JEV. Alternative methods of predicting competitive events: an application in horserace betting markets. Int J Forecast. 2010;26(3):518–536. doi:10.1016/j.ijforecast.2009.12.013
24. Liu YZ, Li BS, Tan RJ, Zhu XL, Wang YD. A gradient-boosting approach for filtering de novo mutations in parent-offspring trios. Bioinformatics. 2014;30(13):1830–1836. doi:10.1093/bioinformatics/btu141
25. Wu QY, Ye YM, Liu Y, Ng MK. SNP selection and classification of genome-wide SNP data using stratified sampling random forests. IEEE Trans Nanobioscience. 2012;11(3):216–227. doi:10.1109/TNB.2012.2214232
26. Du W, Sun Y, Wang Y, Cao Z, Zhang C, Liang Y. A novel multi-stage feature selection method for microarray expression data analysis. Int J Data Min Bioinform. 2013;7(1):58–77. doi:10.1504/IJDMB.2013.050977
27. Cao Z, Wang Y, Sun Y, Du W, Liang Y. A novel filter feature selection method for paired microarray expression data analysis. Int J Data Min Bioinform. 2015;12(4):363. doi:10.1504/IJDMB.2015.070071
28. Yungang X, Maozu G, Xiaoyan L, Chunyu W, Yang L. Inferring the soybean (Glycine max) microRNA functional network based on target gene network. Bioinformatics. 2014;30:(1):94–103.
29. Wang J, Li M, Chen J, Pan Y. A fast hierarchical clustering algorithm for functional modules discovery in protein interaction networks. IEEE/ACM Transact Comput Biol Bioinform. 2011;8(3):607–620. doi:10.1109/TCBB.2010.75
30. Wang J, Li M, Peng X, Pan Y. Identifying Protein Complexes from Protein–Protein Interaction Networks. John Wiley & Sons, Inc.; 2014.
31. De Lobel L, Geurts P, Baele G, Castro-Giner F, Kogevinas M, Van Steen K. A screening methodology based on Random Forests to improve the detection of gene-gene interactions. Eur J Human Genet. 2010;18(10):1127. doi:10.1038/ejhg.2010.48
32. Planque C, Kulasingam V, Smith CR, Reckamp K, Goodglick L, Diamandis EP. Identification of five candidate lung cancer biomarkers by proteomics analysis of conditioned media of four lung cancer cell lines. Mol Cell Proteom. 2009;8(12):2746–2758. doi:10.1074/mcp.M900134-MCP200
33. Cuingnet R, Prevost R, Lesage D, Cohen LD, Mory B, Ardon R. Automatic Detection and Segmentation of Kidneys in 3D CT Images Using Random Forests. Berlin Heidelberg: Springer; 2012.
34. Zhang N, Li BQ, Gao S, Ruan JS, Cai YD. Computational prediction and analysis of protein γ-carboxylation sites based on a random forest method. Mol Biosyst. 2012;8(11):2946–2955. doi:10.1039/c2mb25185j
35. Beam AL, Kohane IS. Big data and machine learning in health care. JAMA. 2018;319:1317. doi:10.1001/jama.2017.18391
36. Urden LD. Patient satisfaction measurement: current issues and implications. Outcomes Manag. 2002;7(5):125–131.
37. Chunhai T. Study on the measurement of patient satisfaction of medical service in China. J Appl Sci. 2013;13(20):4286–4292.
38. Zhang H, Wang W, Haggerty J, Schuster T. Predictors of patient satisfaction and outpatient health services in China: evidence from the WHO SAGE survey. Fam Pract. 2020;37(4):465–472. doi:10.1093/fampra/cmaa011
39. Churpek MM, Yuen TC, Winslow C, Meltzer DO, Edelson DP, Edelson DP. Multicenter comparison of machine learning methods and conventional regression for predicting clinical deterioration on the wards. Crit Care Med. 2016;44(2):368. doi:10.1097/CCM.0000000000001571
40. Wålinder A: Evaluation of logistic regression and random forest classification based on prediction accuracy and metadata analysis. 2014. Available from: http://www.dissertation.com/abstracts/1371437.
41. Crow R, Gage H, Hampson S, et al. The measurement of satisfaction with healthcare: implications for practice from a systematic review of the literature. Health Technol Assess (Rockv). 2001;6(32):1.
42. Rosales ER. Predicting patient satisfaction with ensemble methods. Masters Theses. 2015.
43. Bento AP, Gaulton A, Hersey A, et al. Classification and regression by randomForest. R News. 2002;23(23).
44. Chen CCM, Schwender H, Keith J, Nunkesser R, Mengersen K, Macrossan P. Methods for identifying SNP interactions: a review on variations of logic regression, random forest and bayesian logistic regression. IEEE/ACM Transact Comput Biol Bioinform. 2011;8(6):1580–1591. doi:10.1109/TCBB.2011.46
45. Bowers XZAJ, Zhou X. Receiver Operating Characteristic (ROC) Area Under the Curve (AUC): a diagnostic measure for evaluating the accuracy of predictors of education outcomes. J Educ Stud Placed Risk. 2019;24(1):20–46. doi:10.1080/10824669.2018.1523734
46. Zhang MM, Zhang CX, Sun QW, Cai QC, Yang H, Zhang YJ. Questionnaire survey about use of an online appointment booking system in one large tertiary public hospital outpatient service center in China. BMC Med Inform Decis Mak. 2014;14(1):49. doi:10.1186/1472-6947-14-49
47. Dong L, Li X, Xie G. Nonlinear methodologies for identifying seismic event and nuclear explosion using random forest, support vector machine, and naive bayes classification. Abstr Appl Anal. 2013.
48. Wei T, Jiangfan Y, Dong Y, Lanjing Z, Harry Z. Descriptive analysis on the impacts of universal zero-markup drug policy on a Chinese Urban Tertiary Hospital. PLoS One. 2016;11(9):e0162795. doi:10.1371/journal.pone.0162795
49. Yuan S, Liu W, Wei F, Zhang H, Ma J. Impacts of hospital payment based on Diagnosis Related Groups (DRGs) with global budget on resource use and quality of care: a case study in China. Iran J Public Health. 2019;48(2):238–246.
50. Xinqiang J, Yun F, Jing L. Performance assessment of the inpatient medical services of a clinical subspecialty. Medicine. 2018;97(24):e10855. doi:10.1097/MD.0000000000010855
51. Albert F, Tim R. The new old (and old new) medical model: four decades navigating the biomedical and psychosocial understandings of health and illness. Healthcare. 2017;5(4):88. doi:10.3390/healthcare5040088
52. Delaney MB. Right to know: reducing risks of fecal pathogen exposure for ED patients and staff. J Emerg Nurs. 2014;40(4):352–356. doi:10.1016/j.jen.2013.07.022
53. Schouten BC, Vinkesteijn FJM. [Complaints of patients concerning obligation to inform and consent requirements]. Ned Tijdschr Tandheelkd. 2002;109(12):481–484.
54. Rathert C, Brandt J, Williams ES. Putting the ‘patient’ in patient safety: a qualitative study of consumer experiences. Health Expect. 2012;15(3):327–336. doi:10.1111/j.1369-7625.2011.00685.x
55. Ahmed F, Burt J, Roland M. Measuring patient experience: concepts and methods. Patient. 2014;7(3):235–241. doi:10.1007/s40271-014-0060-5
56. Mcfarlan S, O’Brien D, Simmons E. Nurse-leader collaborative improvement project: improving patient experience in the emergency department. J Emerg Nurs. 2018;45:137–143. doi:10.1016/j.jen.2018.11.007
57. Skaggs MKD, Daniels JF, Hodge AJ, Decamp VL. Using the evidence-based practice service nursing bundle to increase patient satisfaction. J Emerg Nurs. 2017;44(1):37–45. doi:10.1016/j.jen.2017.10.011
58. Housel T, Kanevsky VA. Reengineering business processes: a complexity theory approach to value added. Info Syst Operation Res. 1995;33(4):248–262. doi:10.1080/03155986.1995.11732285
59. Li S, Liu N. Design of health service mode based on information reengineering of medical process. In:
60. Chen H, Li M, Wang J, et al. Factors influencing inpatients’ satisfaction with hospitalization service in public hospitals in Shanghai, People’s Republic of China. Patient Prefer Adherence. 2016;10(1):469–477.
61. Nayeri ND, Aghajani M. Patients’ privacy and satisfaction in the emergency department: a descriptive analytical study. Nurs Ethics. 2010;17(2):167. doi:10.1177/0969733009355377
62. Mueller JT, Thiemann KMB, Lessow C, et al. The mayo clinic hospital mortality reduction project: description and results. J Healthc Manag. 2020;65(2):122–132. doi:10.1097/JHM-D-19-00002
63. Iqbal S, Rahim AU, Hasan AA. Correction of hypoplastic mandible in non-syndromic temporomandibular joint ankylosis patients with distraction osteogenesis in Mayo Hospital Lahore: a descriptive study. J Pak Med Assoc. 2020;70(1):24–28. doi:10.5455/JPMA.297738
64. Jiang Y, Guan Y-J, Dai D-W, Huang W, Huang Z-Y. Prevalence of stress and its determinants among residents enrolled in China Standardized Training Program for Resident Doctor (C-STRD) program: a cross-sectional study. PLoS One. 2019;14(1).
65. Yu H. Universal health insurance coverage for 1.3 billion people: what accounts for China’s success? Health Policy (New York). 2015;119(9):1145–1152. doi:10.1016/j.healthpol.2015.07.008
66. Meng Q, Xu K. Progress and challenges of the rural cooperative medical scheme in China. Bull World Health Organ. 2014;92(6):447–451. doi:10.2471/BLT.13.131532
67. Hou J, Ke Y. Addressing the shortage of health professionals in rural China: issues and progress. Int J Health Policy Manag. 2015;4(5):327–328. doi:10.15171/ijhpm.2015.57
68. Zhu L, Zhong S, Tu W, et al. Assessing spatial accessibility to medical resources at the community level in Shenzhen, China. Int J Environ Res Public Health. 2019;16(2):242. doi:10.3390/ijerph16020242
69. Adib-Hajbaghery M, Maghaminejad F, Abbasi A. The role of continuous care in reducing readmission for patients with heart failure. J Caring Sci. 2013;2(4):255–267. doi:10.5681/jcs.2013.031
70. Conroy M, O’Flynn J, Marsh B. Mortality and long-term dialysis requirement among elderly continuous renal replacement therapy patients in a tertiary referral intensive care unit. J Intensive Care Soc. 2019;20(2):138–143. doi:10.1177/1751143718784868
71. Erickson BJ, Korfiatis P, Akkus Z, Kline TL. Machine learning for medical imaging. Radiographics. 2017;37(2):505–515. doi:10.1148/rg.2017160130
72. Ker J, Wang L, Rao J, Lim T. Deep learning applications in medical image analysis. Ieee Access. 2018;6:9375–9389. doi:10.1109/ACCESS.2017.2788044
73. Gianfrancesco MA, Tamang S, Yazdany J, Schmajuk G. Potential biases in machine learning algorithms using electronic health record data. JAMA Intern Med. 2018;178(11):1544–1547. doi:10.1001/jamainternmed.2018.3763
74. Subasi A, Kevric J, Canbaz MA. Epileptic seizure detection using hybrid machine learning methods. Neural Comput Appl. 2019;31(1):317–325. doi:10.1007/s00521-017-3003-y
75. Srinivas S, Salah H. Consultation length and no-show prediction for improving appointment scheduling efficiency at a cardiology clinic: a data analytics approach. Int J Med Inform. 2021;145:104–290. doi:10.1016/j.ijmedinf.2020.104290
76. Srinivas S. A machine learning-based approach for predicting patient punctuality in ambulatory care centers. Int J Environ Res Public Health. 2020;17(10):3703. doi:10.3390/ijerph17103703
 © 2021 The Author(s). This work is published and licensed by Dove Medical Press Limited. The full terms of this license are available at https://www.dovepress.com/terms.php and incorporate the Creative Commons Attribution - Non Commercial (unported, v3.0) License.
By accessing the work you hereby accept the Terms. Non-commercial uses of the work are permitted without any further permission from Dove Medical Press Limited, provided the work is properly attributed. For permission for commercial use of this work, please see paragraphs 4.2 and 5 of our Terms.
© 2021 The Author(s). This work is published and licensed by Dove Medical Press Limited. The full terms of this license are available at https://www.dovepress.com/terms.php and incorporate the Creative Commons Attribution - Non Commercial (unported, v3.0) License.
By accessing the work you hereby accept the Terms. Non-commercial uses of the work are permitted without any further permission from Dove Medical Press Limited, provided the work is properly attributed. For permission for commercial use of this work, please see paragraphs 4.2 and 5 of our Terms.