")
Back to Journals » International Journal of General Medicine » Volume 15
Effect of the COVID-19 Pandemic on Emergency Department Visits of Patients with an Emergent or Urgent Diagnosis
Authors Yeh CC, Chien CY , Lee TY, Liu CH
Received 17 February 2022
Accepted for publication 28 April 2022
Published 4 May 2022 Volume 2022:15 Pages 4657—4664
DOI https://doi.org/10.2147/IJGM.S362615
Checked for plagiarism Yes
Review by Single anonymous peer review
Peer reviewer comments 2
Editor who approved publication: Dr Scott Fraser
Chung-Cheng Yeh,1– 3 Cheng-Yu Chien,2,4,5 Ting-Yu Lee,3 Chun-Hao Liu3,6
1Department of Emergency Medicine, Keelung Chang Gung Memorial Hospital, Keelung, Taiwan; 2Department of Emergency Medicine, Chang Gung Memorial Hospital at Linkou, Taoyuan, Taiwan; 3College of Medicine, Chang Gung University, Taoyuan, Taiwan; 4Department of Emergency Medicine, Ton-Yen General Hospital, Hsinchu, Taiwan; 5Graduate Institute of Management, Chang Gung University, Taoyuan, Taiwan; 6Department of Child & Adolescent Psychiatry, Chang Gung Memorial Hospital at Linkou, Taoyuan, Taiwan
Correspondence: Chun-Hao Liu, Department of Child & Adolescent Psychiatry, Chang Gung Memorial Hospital at Linkou, No. 5, Fu-Hsin St., Gueshan District, Taoyuan City, 333, Taiwan, Tel +886-3-3281200 #2479, Email [email protected]
Purpose: During the coronavirus disease 2019 (COVID-19) pandemic, visits to emergency department (ED) have significantly declined worldwide. The purpose of this study was to identify the trend of visits to ED for different diseases at the peak and slack stages of the epidemic.
Patients and Methods: This was a retrospective observational study conducted in a tertiary referral medical center in northern Taiwan. We recorded weekly ED visits for myocardial infarction with or without ST-elevation (STEMI or NSTEMI), out-of-hospital cardiac arrest (OHCA), acute stroke, and congestive heart failure from 2016 to 2021. We compared the local epidemic peak periods (calendar weeks 4– 18, 2020 and calendar weeks 21– 31, 2021) and its corresponding slack periods (calendar weeks 4– 18, 2021 and calendar weeks 21– 31, 2020) with the baseline period (2016– 2019) using Mann–Whitney test to identify the difference.
Results: We observed a significant decline in ED visits (median [Q1, Q3]) during the epidemic for OHCA (6 [5, 7] and 5 [4, 6], p = 0.046, for baseline and peak period, respectively, in week 4– 18), acute stroke (41.5 [38, 47] and 35 [28, 39], p < 0.001, in week 4– 18, 40 [35, 45] and 35 [28, 40], p = 0.039, in week 21– 31) and CHF (28 [24.25, 33] and 19 [12, 23], p < 0.001, in week 4– 18, 18 [16, 23] and 13 [11, 16], p = 0.001, in week 21– 31). Significant difference was not observed in patients with NSTEMI and STEMI in both week 4– 18 and 21– 31, and cardiac arrest in week 21– 31. There was a rebound in ED visits in the slack period.
Conclusion: This study revealed that ED visits significantly declined during the COVID-19 epidemic and rebounded in the slack period. The trend was significant for acute stroke and heart failure but was relatively less prominent effect for emergent events such as cardiac arrest or myocardial infarction.
Keywords: cardiac arrest, congestive heart failure, emergency department, health seeking behavior, myocardial infarction, stroke
Introduction
Since 2020, the coronavirus disease 2019 (COVID-19) pandemic has changed our life drastically. In Taiwan, the first case of COVID-19 was detected on January 20, 2020, and led to few months of struggle at the beginning of 2020.1 However, Taiwan successfully contained the infection due to its containment strategy.2 On June 7, 2020, local restrictions were eased due to the absence of new local cases cluster for a long period until May, 2021.
The first local community infection in Taiwan was reported on April 20, 2021, and it soon progressed to a national level 3 epidemic alert on May 19, 2021.1 The alert persisted from May 19, 2021, to July 26, 2021, with regulations such as school closure, compulsory wearing of facial mask, and social gathering restriction.1 The pandemic and lockdown policy affected people’s health seeking behavior. According to a previous cross-sectional survey, a high prevalence of anxiety existed among 44.9–50.9% of the general population in different countries.3–5 Under such anxiety, people may fear to visit a hospital to seek help. A statistic report in the United States revealed a significant decline in emergency department (ED) visits during the pandemic.6 Moreover, this trend was observed in Korea,7 the Netherlands,8 and Canada.9 Furthermore, ED visits for some acute life-threatening events declined during the pandemic, such as myocardial infarction (23% decline) and stroke (20% decline).10 It may have been due to many factors, such as the fear of the pandemic, public policy of minimizing nonurgent health care, lockdown order, or collapse of the emergency medical system.10 Although still unclear, this phenomenon indicated that there may be an unmet gap between health-care utility and patient need.
Various studies have reported a decline in ED visits during the pandemic, but limited knowledge exists regarding how different stages of the pandemic affect this trend. Our hypothesis is that the number of ED visits would change depending on the pandemic stage. The aim of this study was to demonstrate changes in ED visits for life-threatening disease before the pandemic, during the local epidemic peak period, and after the pandemic subsided.
Patients and Methods
Study Design
This retrospective observational study was conducted in the largest referral medical center in northern Taiwan. Our study setting was a tertiary medical center with about 3500-bed and was the only referral hospital in the three nearby counties. The ED with a team of 46 attending physicians was open for all patients during the pandemic, irrespective of whether they had tested positive for COVID-19. All ED visits were recorded during the study period. This study was reviewed and approved by the Institutional Review Board of Chang Gung Memorial Hospital (No. 202101591B0). The study protocol was not involved in personal data collection and was conducted in compliance with the Declaration of Helsinki. Consent to participate was waived by the Institutional Review Board because no personal data was collected in our study.
Data Collection
We collected the diagnosis at ED visits in each week retrospectively from January 1, 2016 to August 31, 2021 based on International Statistical Classification of Diseases and Related Health Problems, 10th Revision (ICD-10) codes. We recorded the number of patients who were ≥18 years old and visited the ED during the study period with the main diagnosis of (1) myocardial infarction without ST-elevation (NSTEMI, I214, diagnosed on the basis of clinical manifestation and laboratory test), (2) myocardial infarction with ST-elevation (STEMI, I213, diagnosed on the basis of clinical manifestation and electrocardiogram), (3) OHCA (I469, admitting diagnosis, defined as out-of-hospital cardiac arrest due to any cause), (4) acute stroke (I6789, diagnosed on the basis of clinical manifestation and computer tomography), and (5) congestive heart failure (CHF, I509, diagnosed on the basis of clinical manifestation and laboratory test). All diagnoses were made and recorded by ED specialists, and they served as the basis for clinical practice in ED and for applying for the National Health Insurance payment. We collected the total and triage 1–2 ED visit during the study period as reference.
Definition of Different Pandemic Stages
We defined six periods to represent the different stages of the pandemic: (1) calendar weeks 4–18, 2016–2019: baseline period; (2) calendar weeks 21–31, 2016–2019: baseline period; (3) calendar weeks 4–18, 2020: first peak of the COVID-19 epidemic; (4) calendar weeks 21–31, 2020: slack period; (5) calendar weeks 4–18, 2021: slack period; and (6) calendar weeks 21–31, 2021: second peak of the epidemic with a national level 3 epidemic alert (Figure 1). The first peak of the epidemic (calendar weeks 4–18, 2020) was defined as the period from the detection date of the first COVID-19 case in Taiwan until 6 weeks before the easing of local restriction to avoid overlapping with other study periods. The second peak of the epidemic (calendar week 21–31, 2021) was defined as the period of national level 3 epidemic alert. The slack period was defined as the period after the COVID-19 pandemic but with no change in community infection in Taiwan (calendar weeks 21–31 in 2020 and calendar weeks 4–18 in 2021)”.
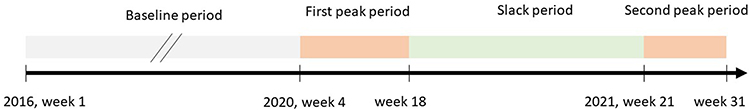 |
Figure 1 The definition of different pandemic stages. |
Statistical Analysis
The median, 25th (Q1) and 75th percentiles (Q3) of weekly ED visits, and change from baseline were calculated for each period. All the data of ED visits in 2020 and 2021 were compared with data of the corresponding period in 2016–2019 (baseline period). All variables were tested for normality by using the Shapiro–Wilk test. The ED visit numbers were compared with those of their corresponding periods by using the Mann–Whitney test. Statistical significance was defined as two-tailed p < 0.05. Statistical analysis was performed using PASW statistics, version 18 (SPSS Inc., Chicago, IL, USA).
Results
Compared to the baseline (the same period in 2016–2019), we observed a prominent decrease in total ED visits and triage 1–2 ED visits during the peaks of the epidemic (Table 1). The analysis of the mode of arrival and the referral of the patients is listed as Supplementary Table 1. However, the decline trend was significant for CVA and CHF, but not significant for myocardial infarction (STEMI and NSTEMI). In the case of OHCA, it declined significantly in the peak of 2020, but not significant in peak of 2021. The ED visits of all the diagnosis rebounded during the slack period.
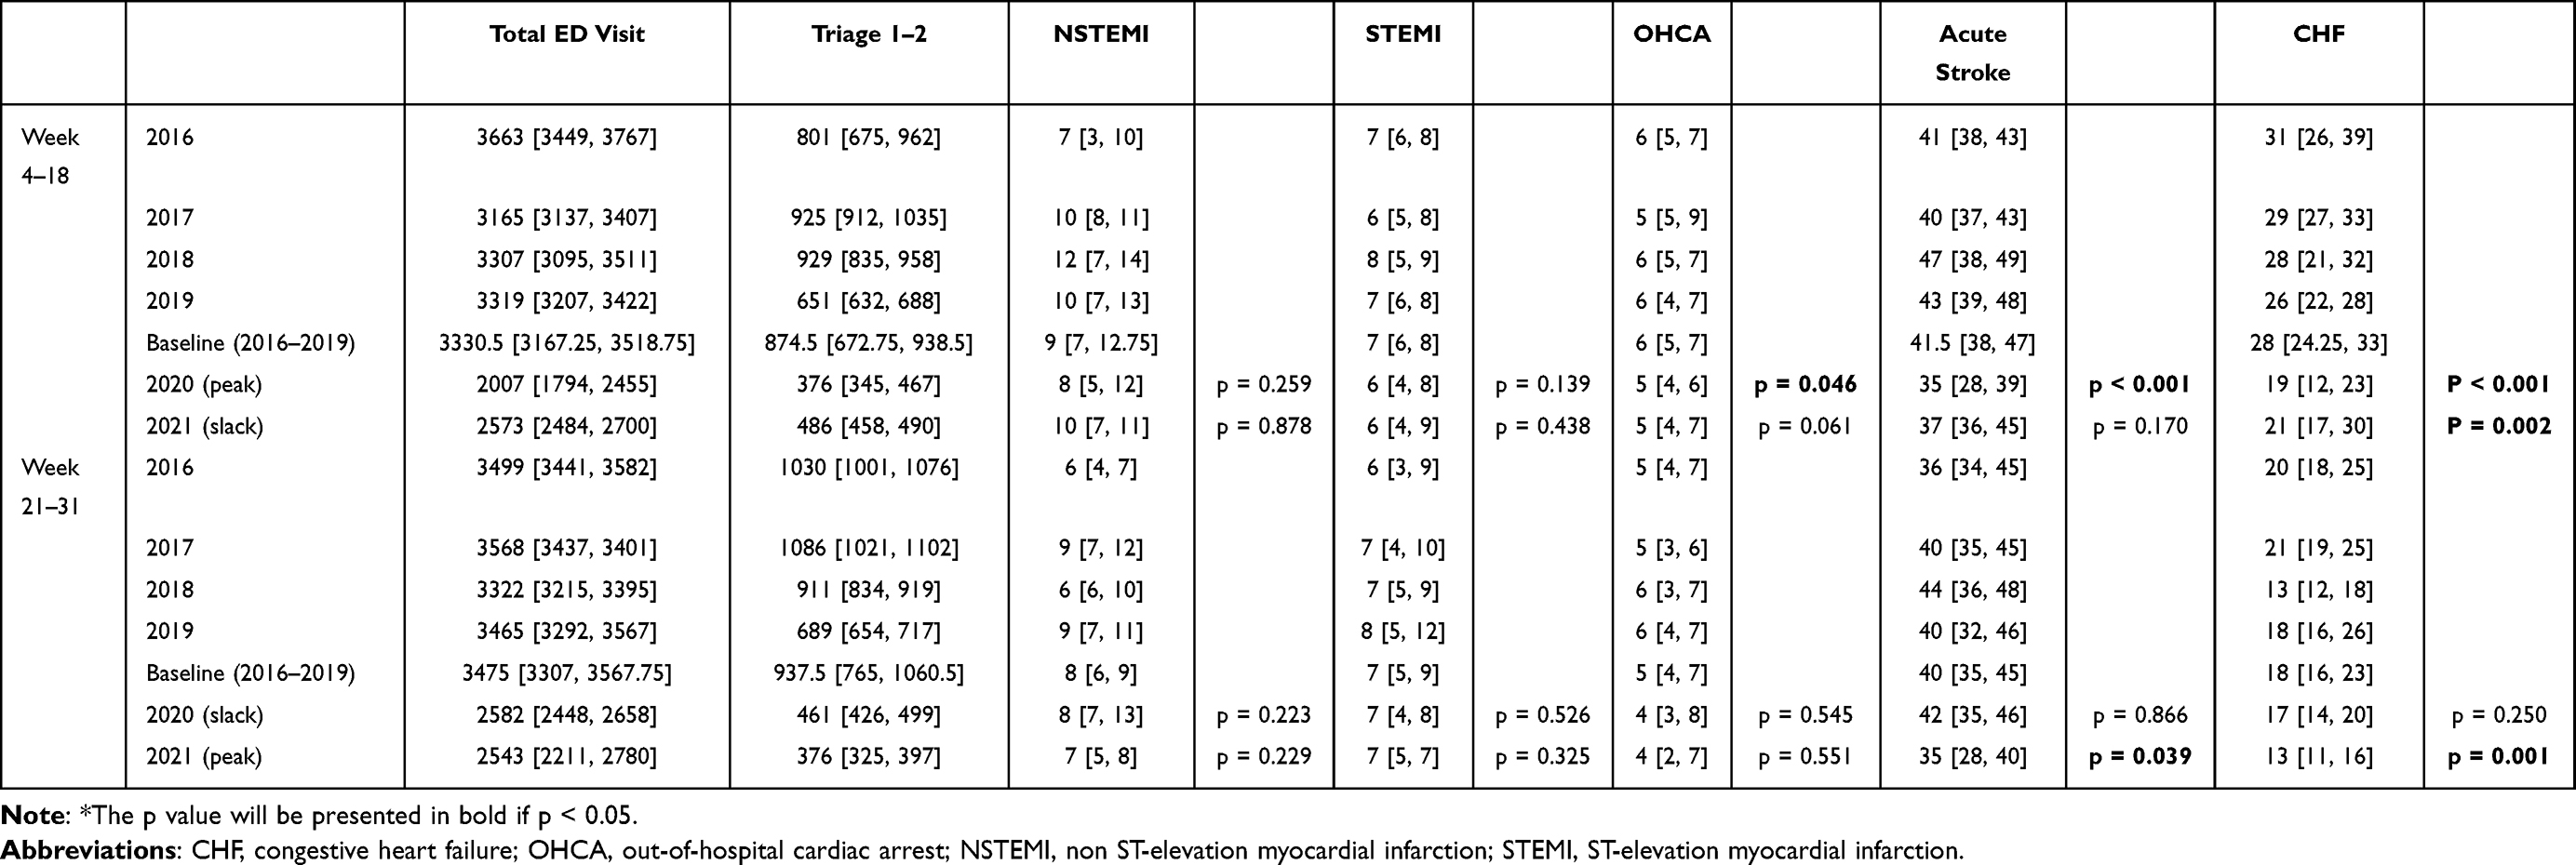 |
Table 1 Number of ED Visits at Different Stages of the Pandemic Presented by Median [Q1, Q3] |
Total ED Visits and Triage 1–2 ED Visits
We did not use the total ED visits as a denominator for several reasons (government policy of using ED as a COVID-19 quick survey site for the local population during the pandemic); however, it can be useful reference. During the baseline periods of weeks 4–18 from 2016 to 2019, a median [first and third quartiles] of 3330.5 [3165.25, 3518.75] and 847.5 [672.75, 938.5] visits per week were observed for the total ED visits and triage 1–2 ED visits, respectively. This decreased to 2007 [1794, 2455] and 376 [345, 467], and 2573 [2484, 2700] and 486 [458, 490] in 2020 (peak period) and 2021 (slack period), respectively.
During the baseline periods (2016–2019) of weeks 21–31, this was 3475 [3307, 3567.75] and 937.5 [765, 1060.5], respectively, decreased to 2582 [2448, 2658] and 461 [426, 499] and then further decreased to 2543 [2211, 2780] and 376 [325, 397] in 2020 (peak period) and 2021 (slack period), respectively.
NSTEMI and STEMI (ICD-10 Codes I214 and I213)
During calendar weeks 4–18, a median of 9 [7, 12.75] and 8 [5, 12], 10 [7, 11] and 7 [6, 8], and 6 [4, 8] and 6 [4, 9] visits per week were observed for NSTEMI and STEMI in 2016–2019 (baseline period), 2020 (first peak period), and 2021 (slack period), respectively (Figure 2A and B). During calendar weeks 21–31, 8 [6, 9] and 8 [7, 13], 7 [5, 8] and 7 [5, 9], and 7 [4, 8] and 7 [5, 7] visits per week were observed for NSTEMI and STEMI in 2019 (baseline period), 2020 (slack period), and 2021 (second peak period), respectively. All above lack statistical significance.
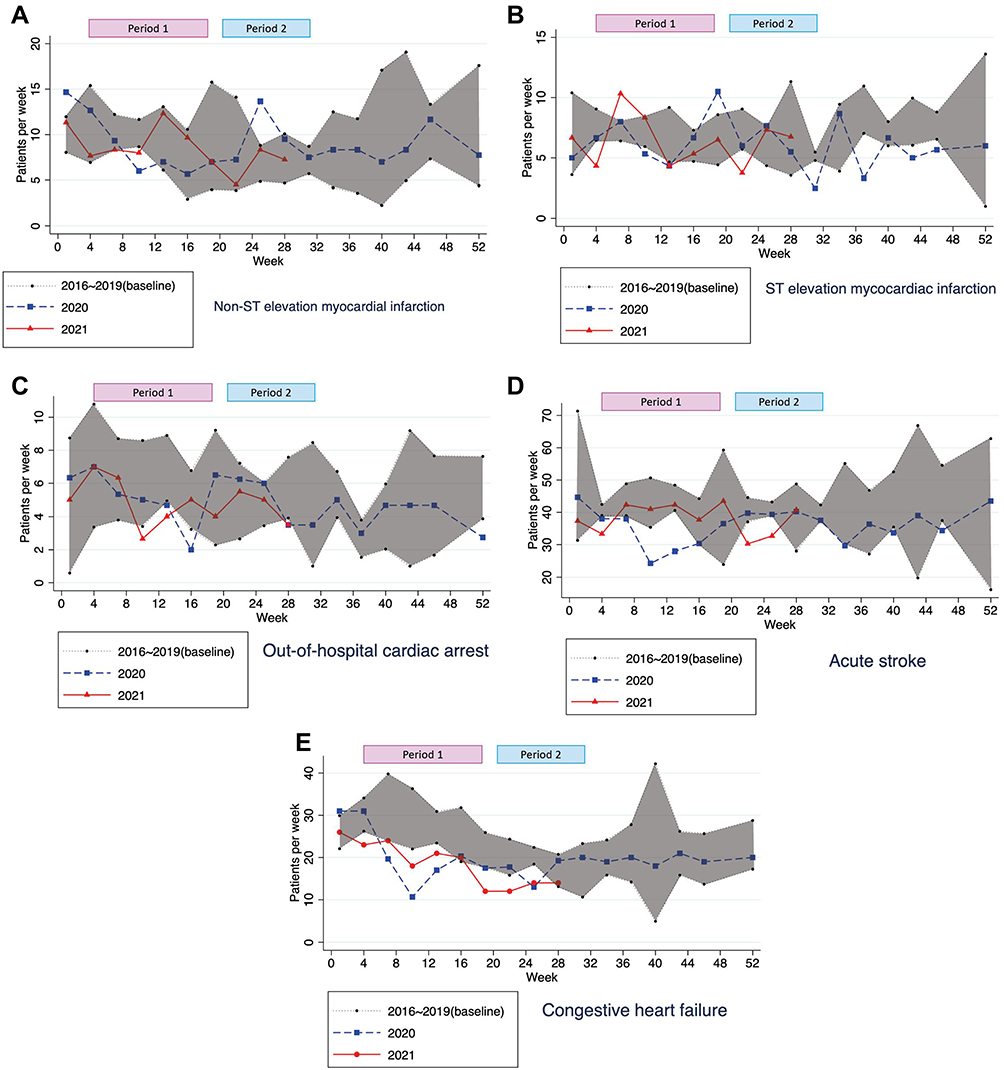 |
Figure 2 Trends of ED visits for different diagnoses: (A) NSTEMI, (B) STEMI, (C) OHCA, (D) acute stroke, (E) CHF. |
OHCA (ICD-10 Code I469)
During calendar weeks 4–18, a median of 6 [5, 7] visits per week due to OHCA were observed in 2019 (baseline period), then it dropped to 5 [4, 6], and 5 [4, 7] in 2020 (first peak period, p = 0.046) and 2021 (slack period, p = 0.061), respectively (Figure 2C). During calendar weeks 21–31, 5 [4, 7], 4 [3, 8], and 4 [2, 7] visits per week for OHCA were observed in 2019 (baseline period), 2020 (slack period), and 2021 (second peak period), respectively, without statistical significance.
Acute Stroke (ICD-10 Code I6789)
During calendar weeks 4–18, a median of 41.5 [38, 47] visits per week due to acute stroke was observed in 2019 (baseline period), then it significantly dropped to 35 [28, 39] visits per week in 2020 (first peak period, p < 0.001), then rebounded to 37 [36, 45] visits per week 2021 (slack period, p = 0.170, Figure 2D). During calendar weeks 21–31, 40 [35, 45] and 42 [35, 46] and visits per week was observed in 2019 (baseline period) and 2020 (slack period, p = 0.866), and it significantly dropped to 35 [28, 40] visits per week in 2021 (second peak period, p = 0.039).
Congestive Heart Failure (ICD-10 Code I509)
During calendar weeks 4–18, an average of 28 [24.25, 33] visits per week due to CHF was observed in 2019 (baseline period), then it significantly declined to 19 [12, 23] in 2020 (first peak epidemic period, p < 0.001), and backed to 21 [17, 30] in 2021 (slack period, p = 0.002, Figure 2E). During calendar weeks 21–31, 18 [16, 23] visits per week was observed in 2019 (baseline period), 17 [14, 20] in 2020 (slack period, p = 0.250), and significant decline to 13 [11, 16] in 2021 (second peak epidemic period, p = 0.001).
Discussion
In our study, we found a significant decline in ED visits for acute stroke and CHF during the two epidemic peaks and for OHCA during the first peak periods, but no significant decline was found for myocardial infarction (STEMI and NSTEMI). The gap was minimized during the slack period.
A significant decline in ED visits was observed during the pandemic almost worldwide, which may have caused a delay in necessary medical care. In the United States, >40% adults avoided medical care due to the fear of contracting COVID-19, including 12% for urgent/emergent care.11 The trend of ED visit decline was not only observed in high-prevalence countries but also in medium- or low-prevalence countries. In a relatively low-prevalence region in Australia, a 10.1% delay or avoidance of urgent/emergent care was noted.12 This phenomenon indicates that the avoidance of medical care may not directly result from a decrease in medical care accessibility during the pandemic but due to public fear of COVID-19.
In addition to the gross decline in the trend of ED visits, we found that the trends of ED visits were different among the diseases. In our study, ED visits due to OHCA significantly declined during the pandemic in 2020, which is different from the findings of most previous studies. A population-based study in France revealed a nearly doubled incidence of OHCA, long delay to intervention, and a reduction in survival rate after the lockdown period of Paris.13 Moreover, this trend was observed in Italy14 and other countries.15,16 In high-prevalence countries, such as Italy, an increase in OHCA was mostly related to COVID-19 infection.14 However, the trend of OHCA decreased, instead of increasing, in Taiwan even during the 2020 and 2021 local epidemic peak, although statistical significance is only present in the former. This difference may be a result of the good control of the COVID-19 local epidemic and partially because of the decrease in major trauma.17 Only 16,141 accumulated COVID-19 cases and 840 COVID-19-related deaths (until September 19, 2021) were recorded among approximately 23 million Taiwanese population. Under the relatively low COVID-19 disease burden, the medical system in Taiwan had the capacity to accommodate critically ill patients and thus could prevent their sudden death outside the hospital.
In our study, we found some urgent, but not acute life-threatening, conditions, such as acute stroke or CHF exacerbation, showed a significant decline during both of the epidemic peak periods. This decline was also reported in two Canadian studies, one of which found a 23% drop in the ED visit of strokes of 2020 compared to 2019,18 and another found a prominent (43.5%) decrease in ED visits related to acute decompensated heart failure during the pandemic.19 Additionally, an Indian study found a similar decline in CHF-related ED visits, and the reduction in the percentage was higher than for STEMI and NSTEMI.20 This difference may be related to its subacute nature of stroke and CHF, and the fear of COVID-19 infection in hospital. Like stroke and CHF, similar decline trends were observed during the local epidemic peak period for NSTEMI and STEMI although lack of significance. A possibility to explain this decline trend is that the fear of COVID-19 may have led to a delay in the treatment of such potentially lethal diseases.
Our study has some limitations. First, the study was conducted in a tertiary referral medical center near the epidemic area (northern Taiwan), which may not be representative of other areas with varying COVID-19 prevalence. Similarly, the result cannot be generalized to other regional or local hospitals. The single site observational study design may also result in a great variability of ED visits in each week. Second, we solely examined ED diagnosis data from electronic medical record and not further outcomes after hospitalization or discharge. Although ED diagnosis was made by an emergency medicine specialist and was the basis for clinical management in the ED, it may not be accurate. Patients’ mode of arrival (by their own or by the emergency medical service) and referral sheets were not analyzed because some of such data were missing in our ED medical record system. Third, this is a descriptive study, which cannot identify the direct cause of changes in ED visit numbers. We assumed that the incidence of diseases such as MI, CVA, and CHF during the COVID pandemic was similar to that before the COVID-19 pandemic. ED visits may be affected by changes in patient health-seeking behavior. However, in the current study, the reasons for changes in ED visit number cannot be identified. This phenomenon may be due to a change in disease prevalence, decline in the total number of ED visits, or change in health-seeking behavior. This is a preliminary study, and subsequent studies with a nation-wide population-based dataset are required to examine various diagnoses, regions, and hospital levels and to explore the basic data of patients who seek medical help at different stages of the pandemic.
Conclusion
In our study, we found a significant decline in ED visits for non-critical events such as acute stroke or heart failure, ED visits declined during the COVID-19 outbreak period and then rebounded after it subsided. However, the trend of critical events remained stable during the COVID-19 pandemic, such as NSTEMI and STEMI. Such changes may have resulted from public fear of COVID-19 and may be related to the delay in the provision of necessary medical intervention.
Acknowledgments
This manuscript was edited by Wallace Academic Editing. The authors also thank Miss Yi-Shan Lin and Miss Wei-Han Chang for their kind help on data collection.
Disclosure
The authors report no conflicts of interest in this work.
References
1. Centers for Disease Control. Ministry of health and welfare, Taiwan. Available from: https://www.cdc.gov.tw/.
2. Lin C, Braund WE, Auerbach J, et al. Policy decisions and use of information technology to fight COVID-19, Taiwan. Emerg Inf Dis. 2020;26(7):1506–1512. doi:10.3201/eid2607.200574
3. Bäuerle A, Teufel M, Musche V, et al. Increased generalized anxiety, depression and distress during the COVID-19 pandemic: a cross-sectional study in Germany. J Public Health. 2020;42(4):672–678. doi:10.1093/pubmed/fdaa106
4. Liu CH, Zhang E, Wong GTF, Hyun S, Hahm HC. Factors associated with depression, anxiety, and PTSD symptomatology during the COVID-19 pandemic: clinical implications for US young adult mental health. Psychiatry Res. 2020;290:113172. doi:10.1016/j.psychres.2020.113172
5. Shah SMA, Mohammad D, Qureshi MFH, Abbas MZ, Aleem S. Prevalence, psychological responses and associated correlates of depression, anxiety and stress in a global population, during the coronavirus disease (COVID-19) pandemic. Community Ment Health J. 2021;57(1):101–110. doi:10.1007/s10597-020-00728-y
6. Hartnett KP, Kite-Powell A, DeVies J, et al. Impact of the COVID-19 pandemic on emergency department visits - United States, January 1, 2019-May 30, 2020. MMWR. 2020;69(23):699–704. doi:10.15585/mmwr.mm6923e1
7. Kang S, Ahn TK, Seo YH, Suh YJ, Paik JH. Comparison of emergency department utilization trends between the COVID-19 pandemic and control period. Medicine. 2021;100(32):e26847. doi:10.1097/MD.0000000000026847
8. Barten DG, Latten GHP, van Osch FHM. Reduced emergency department utilization during the early phase of the COVID-19 pandemic: viral fear or lockdown effect? In: Disaster Medicine and Public Health Preparedness. Cambridge University Press; 2020:1–4.
9. Butt AA, Azad AM, Kartha AB, Masoodi NA, Bertollini R, Abou-Samra AB. Volume and acuity of emergency department visits prior to and after COVID-19. J Emerg Med. 2020;59(5):730–734. doi:10.1016/j.jemermed.2020.08.013
10. Lange SJ, Ritchey MD, Goodman AB, et al. Potential indirect effects of the COVID-19 pandemic on use of emergency departments for acute life-threatening conditions - United States, January–May 2020. MMWR. 2020;69(25):795–800. doi:10.15585/mmwr.mm6925e2
11. Czeisler M, Marynak K, Clarke KEN, et al. Delay or avoidance of medical care because of COVID-19-related concerns - United States, June 2020. MMWR. 2020;69(36):1250–1257. doi:10.15585/mmwr.mm6936a4
12. Czeisler M, Kennedy JL, Wiley JF, et al. Delay or avoidance of routine, urgent and emergency medical care due to concerns about COVID-19 in a region with low COVID-19 prevalence: Victoria, Australia. Respirology. 2021;26(7):707–712. doi:10.1111/resp.14094
13. Marijon E, Karam N, Jost D, et al. Out-of-hospital cardiac arrest during the COVID-19 pandemic in Paris, France: a population-based, observational study. Lancet Public Health. 2020;5(8):e437–e443. doi:10.1016/S2468-2667(20)30117-1
14. Baldi E, Sechi GM, Mare C, et al. Out-of-hospital cardiac arrest during the COVID-19 outbreak in Italy. N Engl J Med. 2020;383(5):496–498. doi:10.1056/NEJMc2010418
15. Scquizzato T, Landoni G, Paoli A, et al. Effects of COVID-19 pandemic on out-of-hospital cardiac arrests: a systematic review. Resuscitation. 2020;157:241–247. doi:10.1016/j.resuscitation.2020.10.020
16. Lim ZJ, Ponnapa Reddy M, Afroz A, Billah B, Shekar K, Subramaniam A. Incidence and outcome of out-of-hospital cardiac arrests in the COVID-19 era: a systematic review and meta-analysis. Resuscitation. 2020;157:248–258. doi:10.1016/j.resuscitation.2020.10.025
17. Walline JH, Hung KKC, Yeung JHH, Song PP, Cheung NK, Graham CA. The impact of SARS and COVID-19 on major trauma in Hong Kong. Am J Emerg Med. 2021;46:10–15. doi:10.1016/j.ajem.2021.02.030
18. Bres Bullrich M, Fridman S, Mandzia JL, et al. COVID-19: stroke admissions, emergency department visits, and prevention clinic referrals. Can J Neurol Sci. 2020;47(5):693–696. doi:10.1017/cjn.2020.101
19. Frankfurter C, Buchan TA, Kobulnik J, et al. Reduced rate of hospital presentations for heart failure during the COVID-19 pandemic in Toronto, Canada. Can J Cardiol. 2020;36(10):1680–1684. doi:10.1016/j.cjca.2020.07.006
20. Choudhary R, Gautam D, Mathur R, Choudhary D. Management of cardiovascular emergencies during the COVID-19 pandemic. Emerg Med J. 2020;37(12):778–780. doi:10.1136/emermed-2020-210231
 © 2022 The Author(s). This work is published and licensed by Dove Medical Press Limited. The full terms of this license are available at https://www.dovepress.com/terms.php and incorporate the Creative Commons Attribution - Non Commercial (unported, v3.0) License.
By accessing the work you hereby accept the Terms. Non-commercial uses of the work are permitted without any further permission from Dove Medical Press Limited, provided the work is properly attributed. For permission for commercial use of this work, please see paragraphs 4.2 and 5 of our Terms.
© 2022 The Author(s). This work is published and licensed by Dove Medical Press Limited. The full terms of this license are available at https://www.dovepress.com/terms.php and incorporate the Creative Commons Attribution - Non Commercial (unported, v3.0) License.
By accessing the work you hereby accept the Terms. Non-commercial uses of the work are permitted without any further permission from Dove Medical Press Limited, provided the work is properly attributed. For permission for commercial use of this work, please see paragraphs 4.2 and 5 of our Terms.