")
Back to Journals » International Journal of Nanomedicine » Volume 10 » Issue 1
Effect of silica and gold nanoparticles on macrophage proliferation, activation markers, cytokine production, and phagocytosis in vitro
Authors Bancos S, Stevens D, Tyner K
Received 12 August 2014
Accepted for publication 4 October 2014
Published 24 December 2014 Volume 2015:10(1) Pages 183—206
DOI https://doi.org/10.2147/IJN.S72580
Checked for plagiarism Yes
Review by Single anonymous peer review
Peer reviewer comments 6
Editor who approved publication: Dr Thomas Webster
Simona Bancos, David L Stevens, Katherine M Tyner
Center for Drug Evaluation and Research, Food and Drug Administration, Silver Spring, MD, USA
Abstract: The accumulation of durable nanoparticles (NPs) in macrophages following systemic administration is well described. The ultimate biological impact of this accumulation on macrophage function, however, is not fully understood. In this study, nontoxic doses of two durable NPs, SiO2 and Au, at particle sizes of ~10 nm and 300 nm were used to evaluate the effect of bioaccumulation on macrophage function in vitro using RAW 264.7 mouse macrophage-like cells as a model system. Cell proliferation, cell cycle, cytokine production, surface marker activation, and phagocytosis responses were evaluated through a panel of assays using flow cytometry and confocal microscopy. The most dramatic change in RAW 264.7 cell function was a reduction in phagocytosis as monitored by the uptake of Escherichia coli. Cells exposed to both 10 nm Au NPs and 10 nm SiO2 NPs showed ~50% decrease in phagocytosis, while the larger NPs caused a less dramatic reduction. In addition to modifying phagocytosis profiles, 10 nm SiO2 NPs caused changes in proliferation, cell cycle, and cell morphology. Au NPs had no effect on cell cycle, cytokine production, or surface markers and caused interference in phagocytosis in the form of quenching when the assay was performed via flow cytometry. Confocal microscopy analysis was used to minimize this interference and demonstrated that both sizes of Au NPs decreased the phagocytosis of E. coli. Overall, our results demonstrate that Au and SiO2 NP uptake by macrophages can influence macrophage phagocytosis in vitro without altering surface markers and cytokine production in vitro. While the biological impact of these findings remains unclear, our results indicate that bioaccumulation of durable NPs within the macrophages may lead to a suppression of bacterial uptake and possibly impair bactericidal activity.
Keywords: bioaccumulation, phagocytosis, gold nanoparticles, silica nanoparticles, macrophage function
Introduction
The use of nanotechnology is continuing to expand within the pharmaceutical industry, where some drug products containing nanomaterials are already approved and marketed in the USA. In addition to the already marketed drugs, novel drug products containing nanomaterials are undergoing development at an increasing pace.1–5
Although the “first-generation” drug products containing nanomaterials typically were reformulations of poorly water-soluble drugs either as nanomilled crystals or via liposome formulations, new formulations may also contain specifically designed durable (ie, nondegradable) nanoparticles (NPs) used for delivery or imaging.1,6,7 Durable NPs do not immediately dissolve into their molecular entities upon administration (in direct contrast to drug nanocrystals), or degrade through normal biodegradation mechanisms within the body (eg, liposomes). Rather, these NPs remain in the intact particulate state during administration, distribution, and accumulation.
Multiple in vivo studies have shown that durable NPs accumulate in organs of the mononuclear phagocytic system (MPS). In particular, macrophages such as Kupffer cells in the liver and marginal zone macrophages in the spleen show high particle accumulation, as would be expected for these cells.8 Liver and spleen macrophage localization seems to be independent of size, mode of administration, species tested, surface coating, NP core, single or multiple doses, or delivered drug.9–11 If the particles are not eliminated, then bioaccumulation and exposure may span years. Although standard toxicity testing will capture overt toxicity of this NP bioaccumulation, secondary effects (such as increased secondary infections and decreased ability for the body to respond to a challenge) may be overlooked or be acutely undetectable without challenge. Therefore, this study evaluated the impact on cellular function of durable NPs at nontoxic doses in an in vitro model.
While there is a large amount of data regarding NPs accumulation, distribution, metabolism, excretion, and toxicity, there are few data regarding NPs impact on macrophage function. Macrophages, among other threat clearance duties, constitute the first line of defense against microorganism invasion. Macrophages recognize, phagocytose, and synthesize mediators to fight infections and modulate immune responses. Once macrophages recognize a pathogen (eg, bacteria), they synthesize pro-inflammatory mediators and produce reactive oxygen and nitrogen intermediates required for bacterial killing. Macrophages have been used extensively both in vitro and ex vivo in phagocytosis and bacterial killing assays.12–14 There have been some studies that have indicated that NPs may have immunomodulatory properties. Aluminum NPs have been shown to impair phagocytosis and alter immune responses in alveolar cocultures; inhaled carbon NPs have been implicated in decreased bacterial clearance; mice that inhaled carbon nanotubes showed systemic suppression of immune function through activation of the cyclooxygenase pathway; systemic administration of durable carbon NPs (a fullerene derivative) led to enhanced tumor growth via immunosuppressive effects that were also seen with titanium dioxide NPs.15–19 The bio-persistence of NPs in macrophages of the MPS without accompanying macrophage functional studies raises questions regarding the effects of NPs-containing drugs.
In the standard battery of preclinical testing of drugs, immunotoxicity testing generally follows the ICH S8 Guidance for Industry, which notes “if the compound and/or its metabolites are retained at high concentrations in cells of the immune system, additional immunotoxicity testing should be considered.”20 This consideration would be triggered for the majority of durable NPs. ICH S8 specifies that in these cases, additional testing should be completed; which tests would be most appropriate, however, is neither standardized nor well defined.20 In an effort to delineate what types of testing would most benefit the understanding of durable NPs on macrophages, a series of functional assays were evaluated.
In order to evaluate the effect of NPs on macrophage function in vitro, RAW 264.7 cells were exposed to nontoxic doses of SiO2 NPs (~10 nm and 300 nm) or Au NPs (~10 nm and 300 nm) and their viability, proliferation, phagocytosis, cytokine production, and surface activation markers were evaluated. Results indicate that the phagocytosis of macrophages may be significantly impacted by pre-exposure to NPs.
Methods
Reagents
RAW 264.7 cells and Dulbecco’s Modified Eagle’s Medium culture media were purchased from American Type Culture Collection (ATCC); fetal bovine serum (FBS), penicillin/streptomycin, phosphate-buffered saline (PBS), propidium iodide (PI), calcein AM, 4′,6-diamidino-2-phenylindole (DAPI), SYTO® Green, Fluorescein isothiocyanate (FITC)-Escherichia coli, and the opsonization reagent were purchased from Invitrogen. SiO2 NPs (10 nm; Ludox, SM-30 colloidal silica, hydroxyl surface with Na+ stabilizing counterion) were purchased from Sigma Aldrich. Bacterial lipopolysaccharide (LPS) was purchased from Sigma Aldrich, stored at −20°C, and reconstituted as per vendor recommendations. SiO2 NPs (300 nm, hydroxyl surface) were purchased from Polysciences and citrate-coated Au NPs (10 nm and 300 nm) from SPI Supplies. 7-Aminoactinomycin D (7AAD), APC BrdU kit, streptavidin-APC-Cy7 antibody, and the antibodies against surface activator markers (CD80-PercP Cy5.5; CD86-Pe-Cy7) were purchased from BD Pharmingen. Tumor necrosis factor (TNF)-α, interleukin (IL)-6, and IL-10 enzyme-linked immunosorbent assay (ELISA) kit were purchased from eBioscience.
NPs characterization
Size, particle stability, and zeta potential of NPs were performed as previously described.21 Briefly, SiO2 NPs (10 nm) were sterilized by filtration (using a 0.1 μm Millex filter unit); Au NPs (10 nm) were concentrated and filtered as previously described;22 SiO2 NPs (300 nm) were used as provided by the vendor. Au NPs (300 nm) were concentrated by centrifuging at 500× g for 2 minutes and removing the supernatant liquid. The weight concentration in grams per liter for each lot of NP solutions was determined by thermal gravimetric analysis (TGA). For transmission electron microscopy (TEM) analysis, an aliquot of NPs was air dried on a holey carbon-coated copper grid (Quantifoil; Electon Mircroscopy Sciences, PA, USA) and analyzed on a JEOL 1400 TEM at 80 kV. At least five fields of view were imaged and between 25 and 63 NPs were measured for size analysis. Dynamic light scattering (DLS) and zeta potential of NPs were determined by diluting NPs in water or media at a final concentration of 0.5–40 g/L. Lack of endotoxin contamination was confirmed by limulus amebocyte lysate gel clot formation assay.
RAW 264.7 cell culture conditions
RAW 264.7 cells were purchased from American Type Culture Collection (ATCC® TIB-71™), propagated, and aliquots stored in liquid nitrogen. Cells were maintained as adherent cell cultures and passaged 3–25 times, after which a new frozen aliquot was used. Unless otherwise specified, NPs and LPS treatments were performed on RAW 264.7 cell cultures in cell suspensions. Cells were scraped off the culture flasks, counted, and plated in suspension at 105 cells/mL in 60 mm Petri plates containing Teflon® liners (Welch Fluorocarbon Inc). The cell density of 105 cells/mL was determined based on adherent cell culture conditions and titration studies. Culture plates were maintained at 37°C (5% CO2) with constant rotation (50 rpm). RAW 264.7 cells in suspension showed a heterogeneous population: some formed agglomerates, while others settled or were lightly attached to the Teflon liners. At the end of the culture time, cells were gently scraped off with a cell scraper and thoroughly resuspended to single cell suspension via pipetting.
Viability assays (PI and calcein AM)
RAW 264.7 cells exposed to increasing concentrations of NPs or LPS were harvested, washed, and stained with PI (0.05 μg/mL; 15 minutes, room temperature [RT]) or calcein AM (50 nM; 30 minutes, RT). NP concentrations ranged from 0.001 g/L to 1.0 g/L in cell culture media. Cells were thoroughly washed and analyzed on a FacsAria III using DIVA software. Viability is expressed as percentage of treated cells versus untreated cells. In order to detect possible interference of NPs with the assay, control cells were stained with PI or calcein AM in the presence of NPs simultaneously and the mean fluorescence intensity (MFI) arising from the macrophages co-incubated with dye and NPs was determined versus the stained, untreated control cells (ie, a spiked control). Acetaminophen was used as a positive control at a concentration of 25 mM. Experiments were repeated at least twice for an N=6.
Transmission electron microscopy
RAW 264.7 cells were grown in 12-well plates containing culture inserts (transwell inserts; 0.3×10⁴ cells/insert) for 2 days, after which cells were exposed to NPs (0.005 g/L or 0.01 g/L) for 24 hours. Cells were washed with PBS, fixed overnight with 2% glutaraldehyde in 0.1 M cacodylate buffer, and rinsed with 0.1 M cacodylate buffer for 24 hours. Inserts containing the adherent cells were sectioned into 1 mm2 pieces, after which the sections were dehydrated with a graded alcohol series, embedded in epoxy resin, and processed as previously described by Keene et al.23 Thin sections (90 nm) were placed onto copper grids and examined unstained on a JEOL 1400 TEM. Elemental analysis via energy dispersive X-ray analysis (EDS) was conducted in scanning transmission electron mode with an Oxford Instruments X-max detector.
Coulter counter measurements
RAW 264.7 cell number was determined using a BD Coulter counter (100 μm nozzle); cells with sizes between 6 μm and 30 μm were counted to avoid counting cell debris, high-order NP aggregates, and cell clusters.
Cell cycle assay
RAW 264.7 cells exposed to NPs or LPS for variable times were washed, counted, and plated in fresh media at 105 cells/mL. Cells were pulsed with BrdU (10 μM) for 4 hours, after which cells were processed as recommended by the vendor. Briefly, cells were fixed, permeabilized, and stained with APC-conjugated anti-BrdU antibody. Cell cycle status was determined by analyzing BrdU signal versus 7AAD or SYTO® Green (for Au NPs-treated cells) staining using DIVA software. Cell cycle status is expressed as cell percentage. In order to detect possible interference of NPs with the assay, control cells were exposed to BrdU and NPs simultaneously and their MFI compared to control cells only exposed to BrdU (ie, a spiked control).
ELISAs for cytokine detection
RAW 264.7 cells exposed to SiO2 NPs were harvested and supernatants collected and kept at −80°C. Supernatants harvested from control and LPS-treated cells were assayed. ELISA for TNF-α, IL-6, and IL-10 was performed as recommended by the vendor (eBioscience). Briefly, plates were coated with TNF-α, IL-6, or IL-10 coating antibody, blocked, and washed with washing buffer. Samples and standard curve samples were transferred to ELISA plates, incubated overnight at 4°C, washed, and exposed to capture and detection antibodies at RT (1 hour each). Cytokine levels were detected using a TMB (3,3’,5,5’-Tetramethylbenzidine) substrate and the reaction was stopped with 2 N H2SO4. Plates were read on a plate reader (A450 nm). In each experiment, blank samples and standard controls (seven standard controls with concentration between 1,000 pg/mL and 15.62 pg/mL) were used to determine the level of cytokines. In order to detect possible NPs interference with the assay, blank samples and standard dilutions were “spiked” with NPs (0.005 g/L or 0.01 g/L) and their absorbance measured.
Phagocytosis
RAW 264.7 cells exposed to NPs or LPS for variable times (between 3 hours and 48 hours) were washed, counted, and plated in fresh media at 105 cells/mL. FITC-E. coli bioparticles (Invitrogen) were opsonized at 37°C for 1 hour with opsonizing agent (Invitrogen) as recommended by vendor. Opsonized bioparticles were added to cells at a 1:5 ratio (cell to bacteria). Bacteria–RAW 264.7 cell mixture was incubated at 37°C for 30 minutes with constant rotation (50 rpm). Cells were gently scraped off the tissue culture plate, washed twice with PBS, and resuspended in PBS +2% FBS containing 0.01% Trypan blue (to quench FITC-E. coli attached to cells). Cells were immediately analyzed on FacsAria III using DIVA software. Results are expressed as fold change in MFI versus untreated cells in order to compare results across treatment groups. In order to detect possible interference of NPs with the assay, control cells were exposed to FITC-E. coli in the presence of NPs and MFI of the macrophages was determined versus the MFI of cells only exposed to FITC-E. coli.
Confocal microscopy
Intracellular uptake of FITC-E. coli bioparticles was confirmed by confocal microscopy. Following phagocytosis, RAW 264.7 cells were washed in PBS twice, resuspended in PBS +5% FBS, and 0.2×10⁵ cells were cytospun on glass slides. Mounting media containing DAPI was added and the cells covered with cover slips. Cells were analyzed on Olympus using FV100 software (Olympus). DAPI was detected in channel 1 (excitation: 405 nm/emission: 461 nm; photomultiplier tube (PMT): 620 V); FITC in channel 2 (excitation: 488 nm/emission 519 nm; PMT: 567 V); and light field was acquired in channel 3 (excitation 515 nm/emission 0 nm; PMT: 190 V). A series of zeta images were acquired using progressive slices of 0.1 μm.
Post-image analysis was performed using ImageJ to determine the percentage of cells that were able to phagocytose the bacteria. Five images were captured per slide and all cells in the field of view were analyzed (~400 cells/image). For these experiments, the confocal aperture was increased, and z stacks were not performed. To determine the percentage of cells that phagocytosed bioparticles, an overlay of the FITC channel (E. coli) and the whole cell was created in ImageJ. Cells exhibiting colocalization of the DAPI and FITC channels (indicates cells that phagocytosed bacteria) were counted using the “point” tool and the “region of interest” manager in ImageJ, and divided by the total number of cells in the image. In order to detect possible interference of NPs with the microscopy assay, control cells were co-incubated with the E. coli and NPs.
Surface markers
Treated or control RAW 264.7 cells were harvested, washed in PBS, and stained with antibodies against CD80 (0.4 μg/106 cells), CD86 (0.4 μg/106 cells), and CD40 (0.4 μg/106 cells) for 20 minutes at RT (antibody concentration was chosen based on a titration experiment). Following the cell washes, the streptavidin-conjugated APC-Cy7 secondary antibody was added to the cells (0.2 μg/106 cells) for 15 minutes at RT. Cells were washed and analyzed on FacsAria III using DIVA software. The concentration of antibodies used for surface staining was determined based on titration experiments using LPS-treated RAW 264.7 cells. Unstained, single-color controls and Fluorescence Minus One were used as compensation controls and controls, respectively. In order to detect possible interference of NPs with the assay, control cells were stained with antibodies against surface markers in the presence of NPs and the MFI arising from the treated macrophages was determined versus the control cells.
Animals
All experimental procedures were approved by the White Oak Institutional Animal Care and Use Committee and carried out in the White Oak Animal Facility of the US Food and Drug Administration (FDA) (Silver Spring, MD, USA) in accordance with the Guide for the Care and Use of Laboratory Animals.24 Female Balb/C mice were 8–10 weeks old and housed in groups under standard environmental conditions with free access to water and rodent chow.
Bone marrow-derived primary macrophage phagocytosis
Balb/C mice between 8 weeks and 10 weeks of age were used to harvest primary cells from bone marrow. Naïve mice were euthanized via exsanguination under isoflurane. Posterior legs were harvested; fur and some of the muscle tissues were removed after which legs were transferred into 50 mL tubes and kept on ice. Muscle and cartilage were scraped off the femur using a sterile blade. Femurs were cut open at both ends with sterile scissors and culture media containing FBS and penicillin/streptomycin was flushed through the femur using an insulin syringe into a well of six-well plate. The procedure was repeated from the other end of the femur. Plates were kept on ice packs. The cell suspensions were then mixed thoroughly and passed through a filter into a 50 mL conical flask. Cells were centrifuged the pellet resuspended in 1 mL culture media (containing 5 ng/mL macrophage colony-stimulating factor) and transferred into three wells of a 24-well plate containing sterile cover slips. Starting cell density was between 2×10⁶ cells/2 cm2 and 10×106 cells/2 cm2. Media was changed on days 1, 3, and 5 and adherent cells were washed which facilitated suspension cell removal. On day 7, adherent cells staining CD11b+ were ~80%–90% confluent. Cell density was between 400,000 cells/0.1 cm2 and 900,000 cells/0.1 cm2 as determined by counting the cells on the cover slips. Eight days after culture, cells were dosed with 10 nm SiO2 (0.005 g/L and 0.01 g/L) and LPS (50 ng/mL). A set of cells was also left untreated for the media control. Cells were incubated for 24 hours followed by transfer to new dishes. Cover slips were washed with pre-warmed media and cells were exposed to FITC-E. coli at 1:5 ratio (one cell to five bioparticles). Cells were mounted on glass slides with Vectashield and immediately examined using the confocal procedure outlined above. When cell density was sufficient, cells were also analyzed by flow cytometry using the procedure outlined earlier.
Statistical analyses
Statistical analyses were performed using two-way analysis of variance followed by Bonferroni’s multiple comparison tests.
Results
NPs characterization
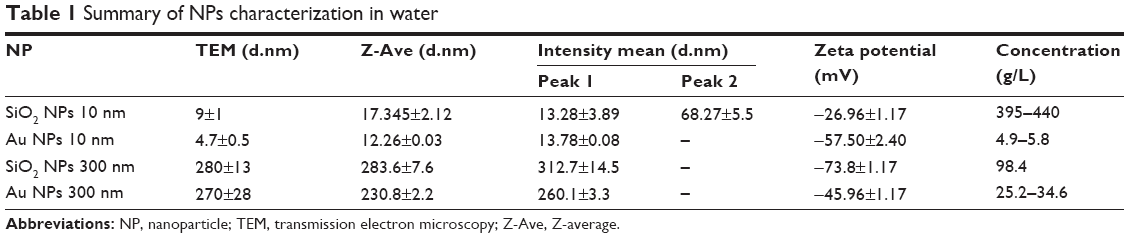
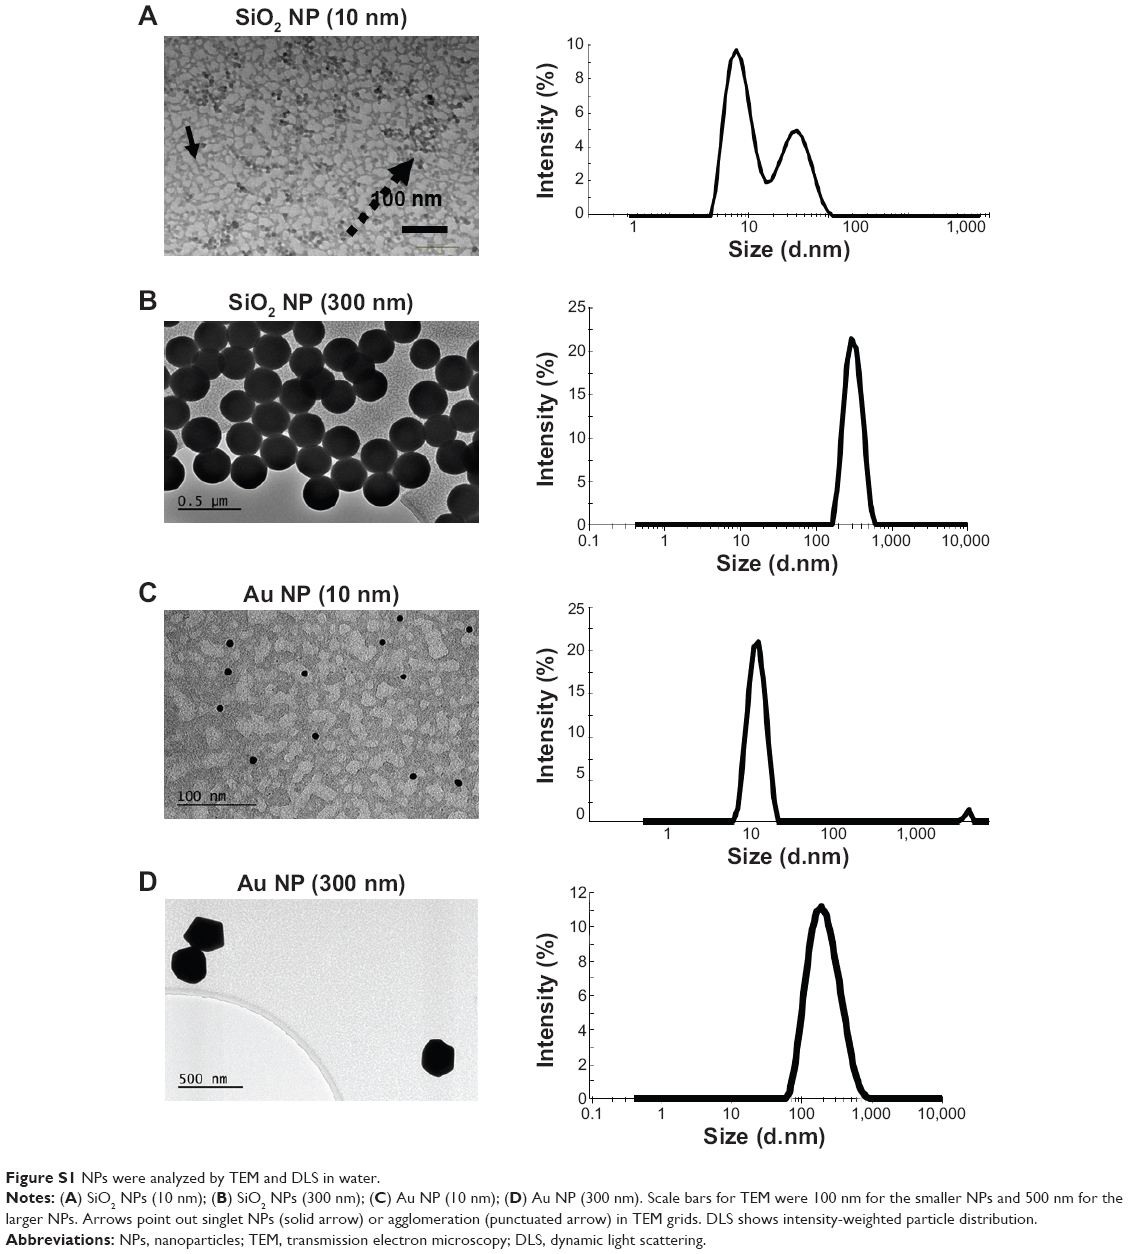
NPs were characterized for their size, size distribution, morphology, physical stability in culture media, zeta potential, and endotoxin burden. A summary of NP characteristics is provided in Table 1. Representative TEM images and DLS histograms may be found in Figure S1. NPs had primarily round morphologies, although Au NPs (300 nm) also exhibited triangular, hexagonal, and other morphologies. SiO2 NPs (10 nm) had small agglomerates that were visible in both TEM and DLS analysis. SiO2 NPs (10 nm) formed small agglomerates as shown by the intensity-weighted DLS analysis (Table 1; Figure S1A). Zeta potentials were between −74 mV (SiO2 NPs, 300 nm) and −30 mV (SiO2 NPs, 10 nm). NPs were opsonized by serum proteins and agglomerated over time when exposed to cell culture media.21,22 All NPs tested below the detection limit for endotoxin (0.25 EU/mL) for the concentrations used in this study.
|
Table 1 Summary of NPs characterization in water |
NPs are cytotoxic at high concentration (>0.1 g/L)
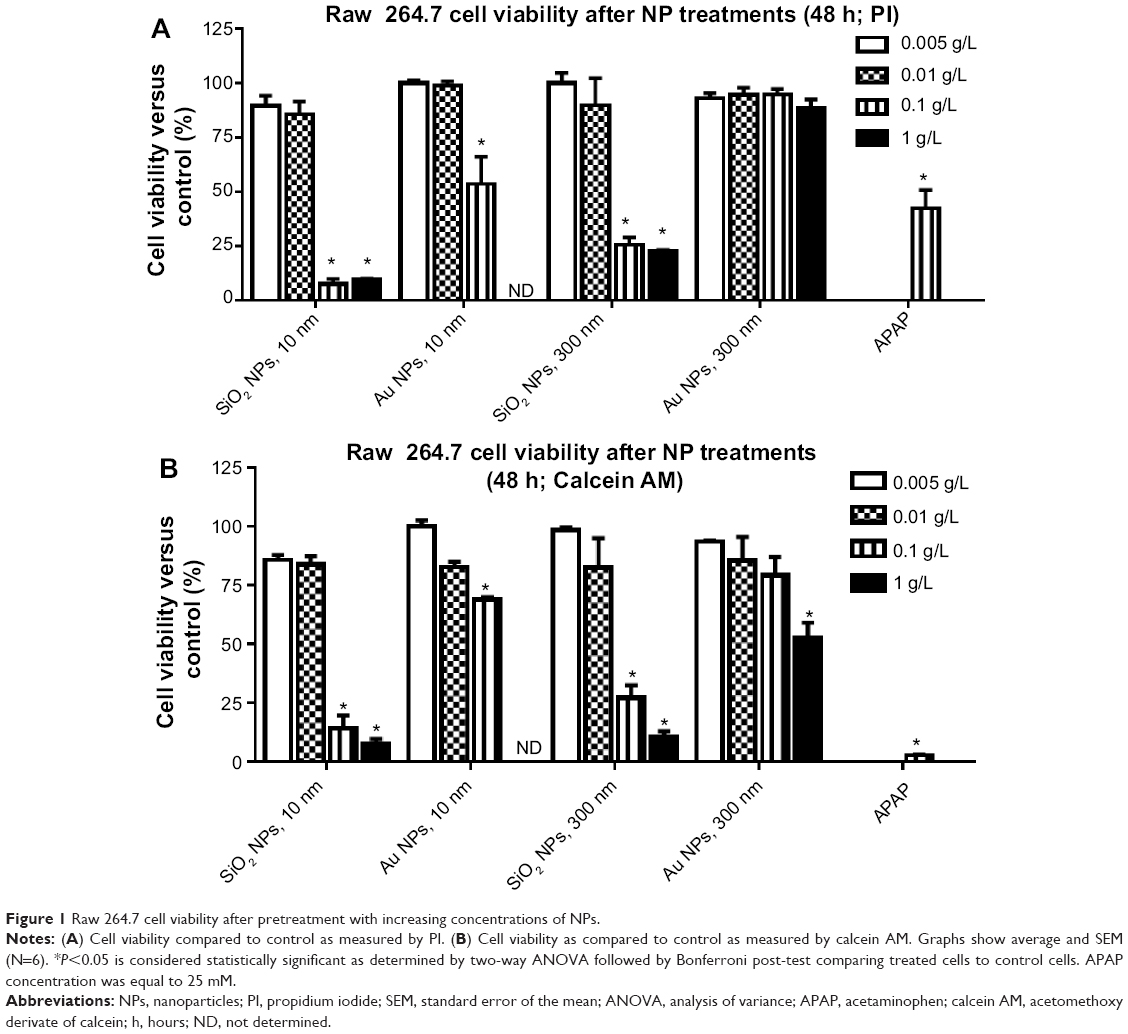
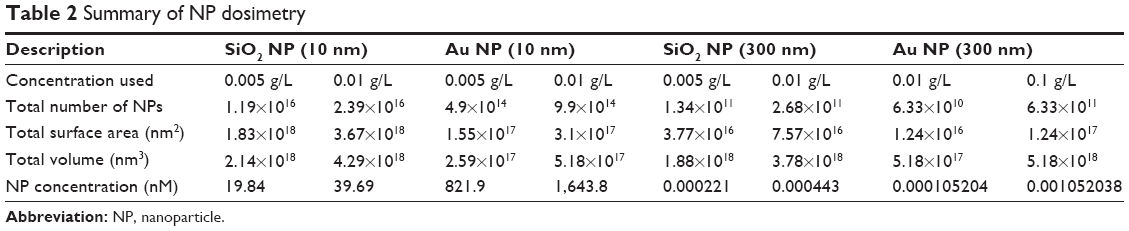
RAW 264.7 cells were cultured in suspension and exposed to increasing concentrations of the various NPs for 24 hours and 48 hours. Cell viability was determined by PI and calcein AM staining coupled with flow cytometry assays; PI penetrates the membrane of dead cells, whereas calcein AM fluoresces green in live cells. As shown in Figure 1, viability is similar in PI and calcein AM data. For the NPs used in the current study, concentrations between 0.001 g/L and 0.01 g/L are not toxic for RAW 264.7 cells. For functional studies, NPs at concentrations of 0.005 g/L and 0.01 g/L (and 0.1 g/L for Au NP 300 nm) were used, since these concentrations did not show a significant decrease in cell viability at 48 hours. In order to compare different dosimetry metrics, Table 2 presents the dosimetry of the NPs for the mass concentration, NP number concentration, total surface area, total volume, and molar concentration.
|
Figure 1 Raw 264.7 cell viability after pretreatment with increasing concentrations of NPs. |
|
Table 2 Summary of NP dosimetry |
Internalization of NPs in RAW 264.7 cells
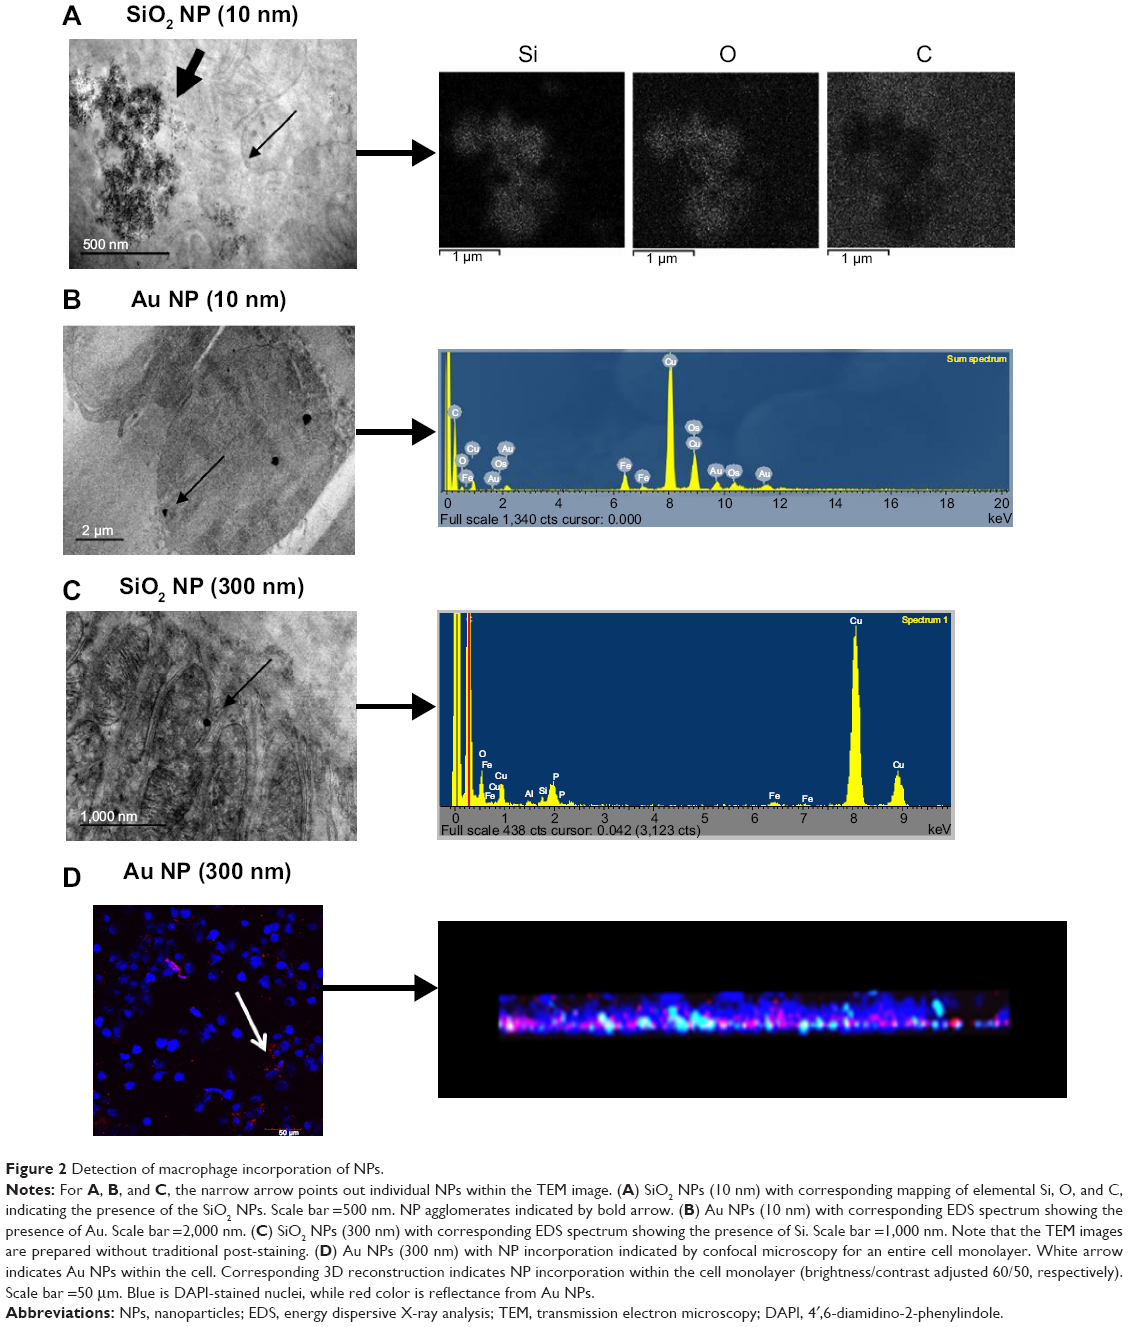
As this study was interested in determining macrophage function after NP accumulation, studies were conducted to verify NP incorporation into the cells. Figure 2 shows internalization of the NPs into cells after NP administration and was obtained via TEM/STEM/EDS and confocal microscopy analysis. NPs localized inside the cells as single NPs (indicated by the narrow arrows) or agglomerates (indicated by bold arrows). Particle composition was confirmed by EDS in either “mapping” or “point and shoot” mode. In some cases, 10 nm SiO2 NPs were found in high densities within the cells allowing for elemental mapping of Si and O, showing a high density of these elements compared to the surrounding area, and the absence of the cellular matrix (carbon signal). EDS spectra for all of the NPs showed the presence of the NPs (via Si or Au signals) as well as a host of other elements, which could be attributed to the fixing of the tissues (eg, Os, P) or the grid and instrument composition (eg, Fe, Cu). Note that the TEM images were taken with no post-staining performed on the tissue samples (eg, no staining with uranyl acetate or lead citrate). Although these stains do enhance the contrast in the tissues, making the subcellular structure more visible, the stains were not used in order to reduce background EDS signals. Despite the lack of contrast stains, subcellular features are still distinguishable in the images (eg, the mitochondria in 2C).
|
Figure 2 Detection of macrophage incorporation of NPs. |
The 10 nm NPs were easily found throughout the cells, whereas the 300 nm NPs, with ~105 less NPs (Table 2), were far less obvious. In an effort to confirm cellular incorporation, zeta stack analysis using confocal microscopy was used to demonstrate incorporation of these larger NPs. Figure 2D shows a representative confocal image midway through a cell monolayer preexposed to 300 nm Au NPs as well as the 3D reconstruction and cross section of the complete z stack. The cell layer may be monitored through the nuclear staining (blue), while the NPs are monitored through scattering signal (red). By evaluating the 3D reconstruction cross section of the cell monolayer, a more complete picture of the NP dosing is obtained. The Au NPs may be seen adhered to the bottom of the cover slip (due to sedimentation of the NPs over time) as well as dispersed throughout the cell layer, indicating NP incorporation.
NPs cause decreased proliferation in RAW 264.7 cells
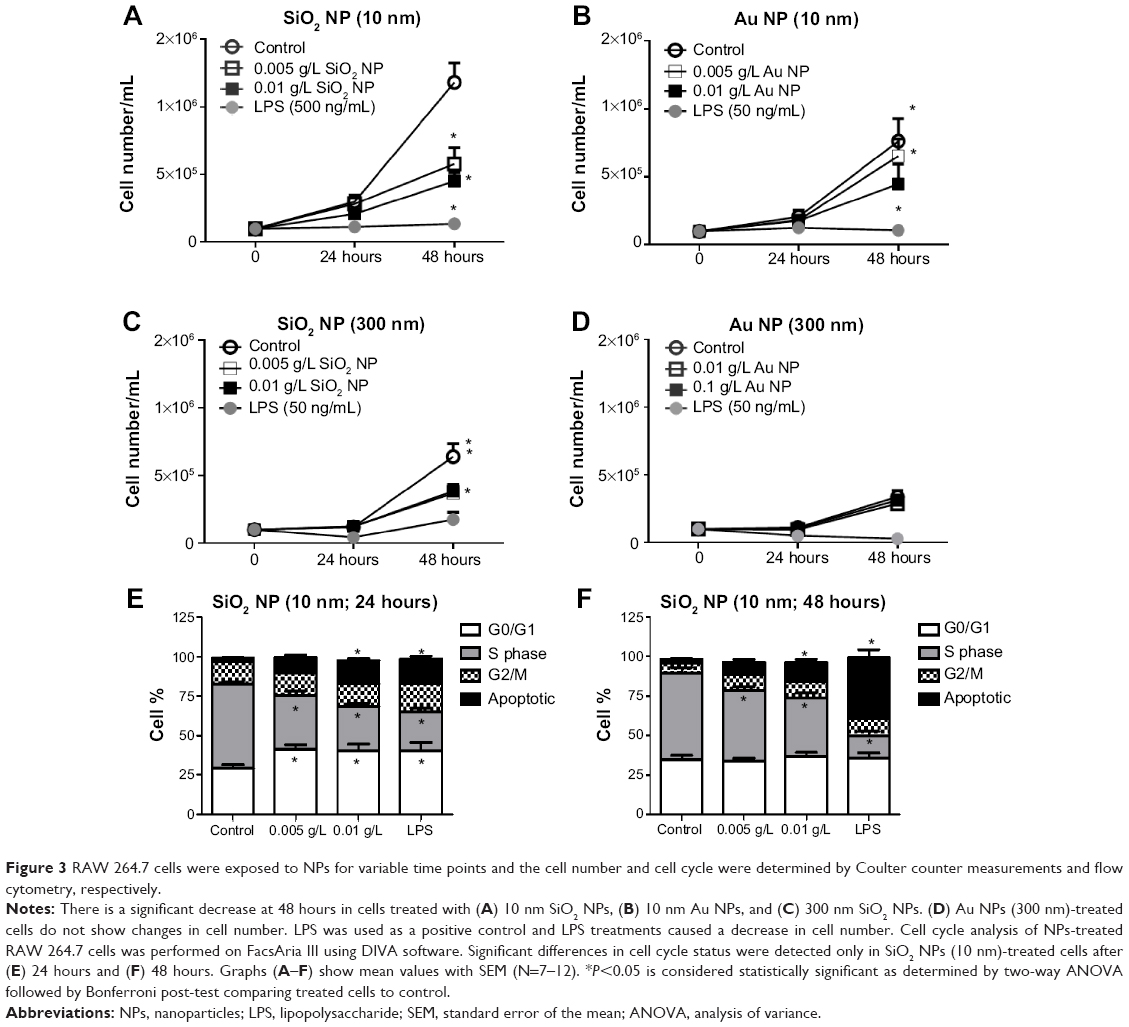
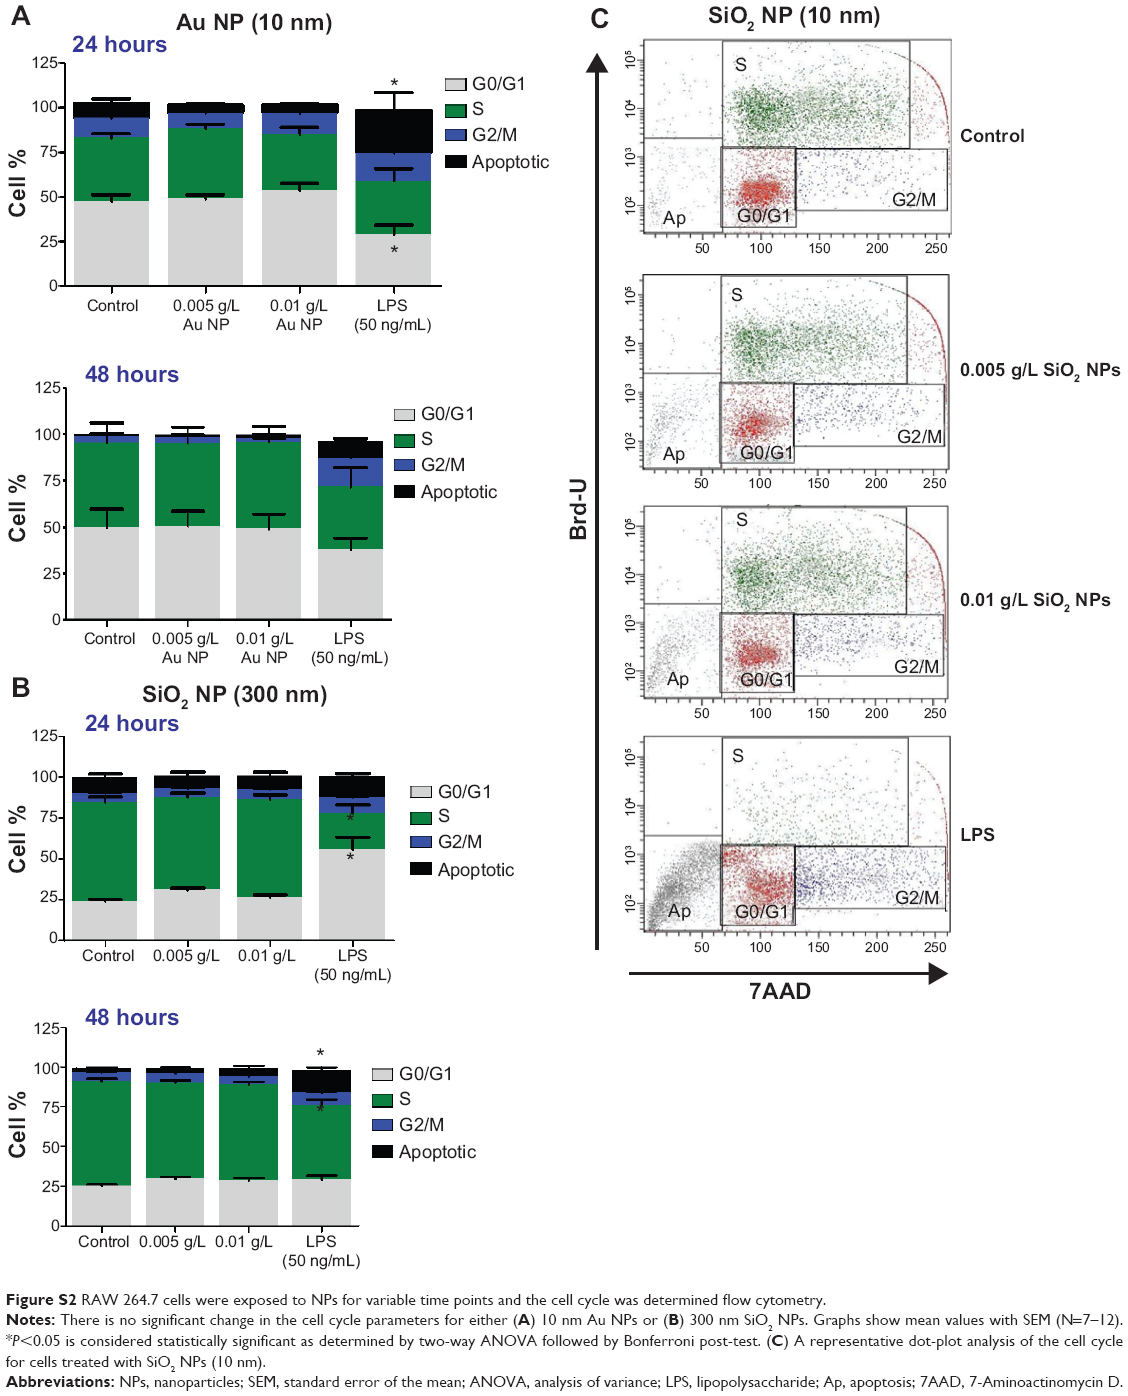
Cell number was determined by Coulter counter at different time points as shown in Figure 3A–D. Except for Au NPs (300 nm; Figure 3D), all cells showed a decrease in cell number at 48 hours. NP-treated cells showed approximately twofold decrease in total cell number over time compared to control cells. LPS-treated cells showed only a slight increase in total cell number. Since the decrease in cell number is not due to overt cytotoxicity (Figure 1), the cell cycle status of NPs-treated RAW 264.7 cells was analyzed. Treated and control cells were exposed to NPs for 24 hours and 48 hours after which their cell cycles were analyzed by flow cytometry. Figure 3E and F shows that SiO2 NPs (10 nm)-treated RAW 264.7 cells have a significant increase in G0/G1 (only at 24 hours) and a decrease in S phase (at 24 hours and 48 hours). Cells treated with 0.01 g/L SiO2 NPs (10 nm) show an increase in apoptotic cells indicating that although there was no decrease in cell viability (Figure 1), a subpopulation of cells (between 12% and 15%) underwent apoptosis both at 24 hours and 48 hours. The decrease in cell number in LPS-treated cells is due to an increase in apoptotic cells and a decrease in cells in S phase. Representative dot plot analysis of the cell cycle may be found in Figure S2. The cell cycle for RAW 264.7 cells exposed to either Au NPs 10 nm or SiO2 NPs 300 nm also showed a decrease in cell number. The cell cycle profile of these pretreated cells generally followed the profile generated by the 10 nm SiO2 NPs-treated RAW 264.7 cells (only the cells treated with 10 nm Au NPs did not show a decrease in the S phase), although these changes were not statically significant (Figure S2).
|
Figure 3 RAW 264.7 cells were exposed to NPs for variable time points and the cell number and cell cycle were determined by Coulter counter measurements and flow cytometry, respectively. |
SiO2 NPs (10 nm)-treated RAW 264.7 cells show increased TNF-α production
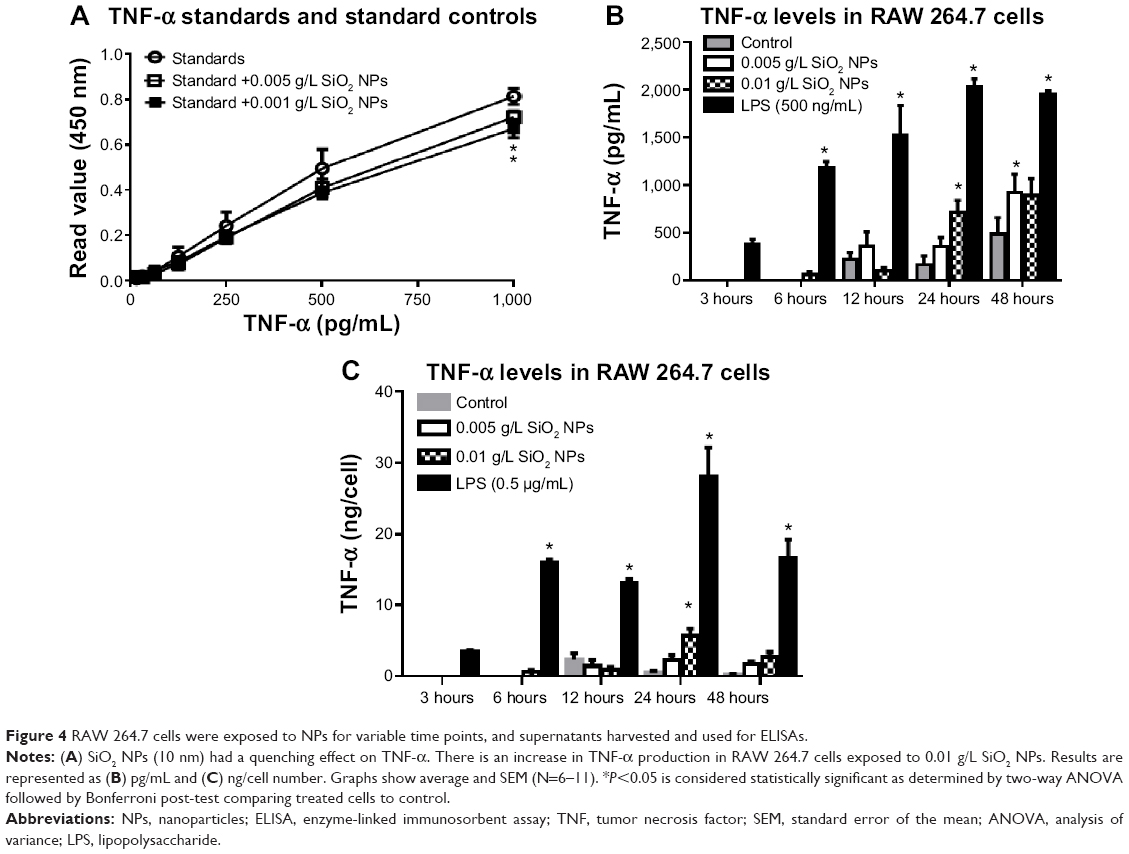
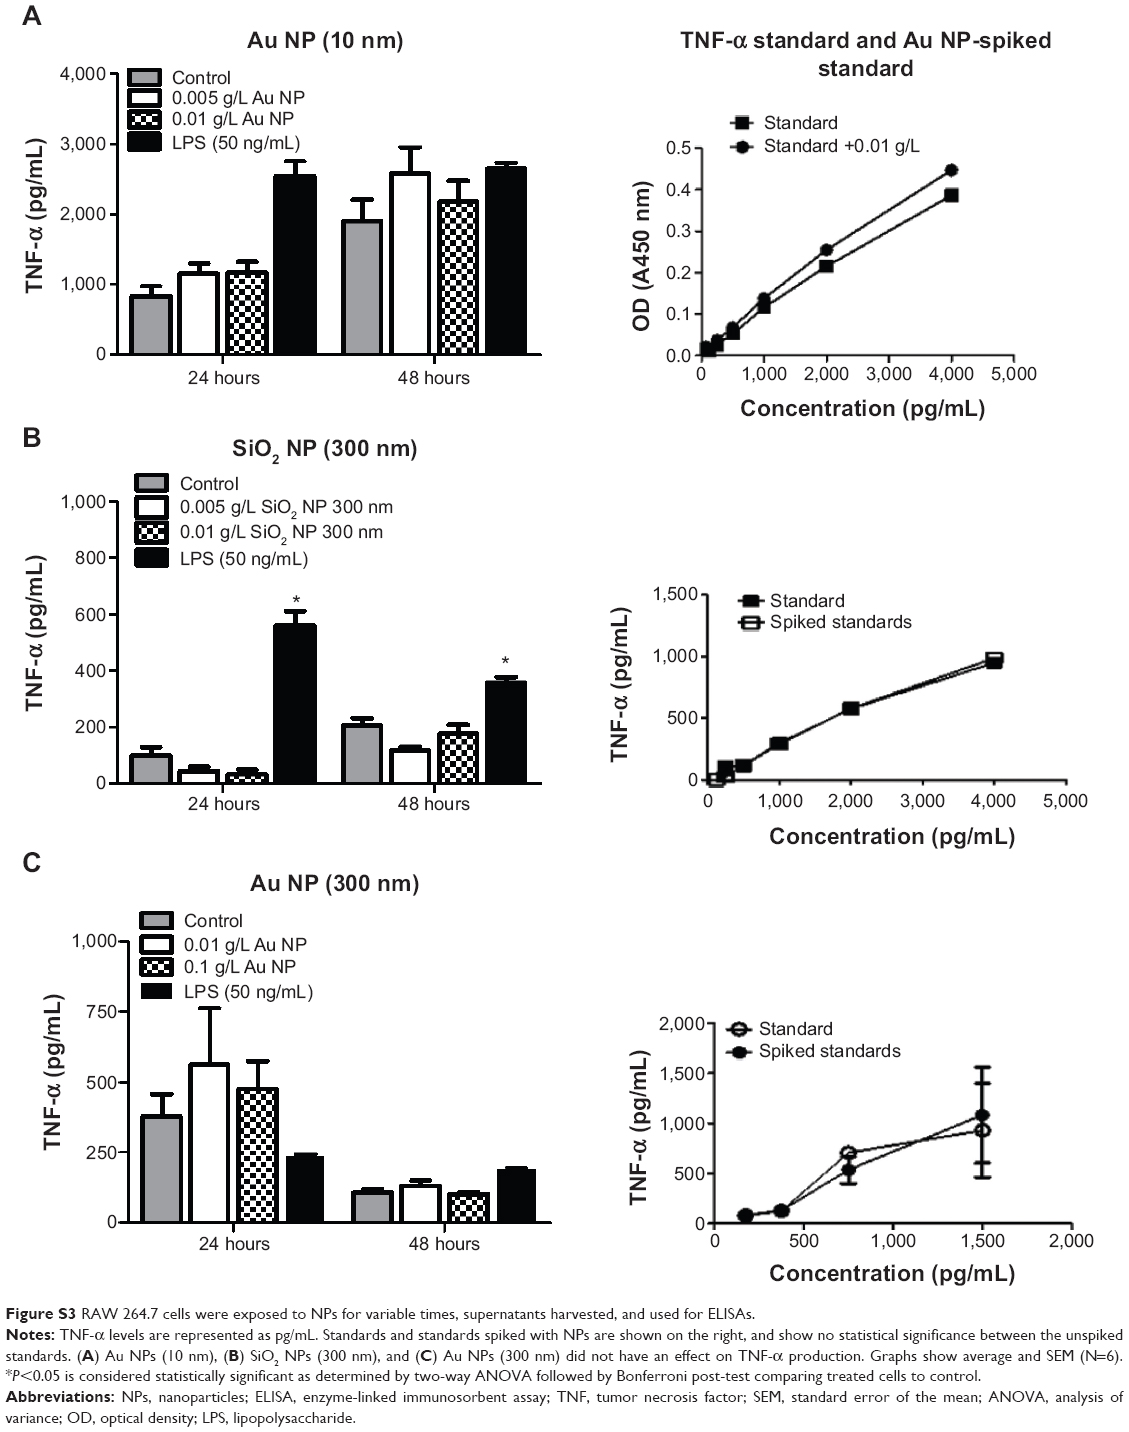
In order to detect the cytokine production in RAW 264.7 macrophages, cells were first exposed to media or LPS (50 ng/mL or 500 ng/mL) for variable time points (3–72 hours). Supernatants harvested from control and LPS-treated cells were assayed for TNF-α, IL-6, and IL-10. The cytokine production profile of NPs-treated cells was determined and an increase in TNF-α levels was detected only in RAW 264.7 cells exposed to 0.01 g/L SiO2 NPs (10 nm). However, since this concentration also determines a significant increase in apoptotic cells (Figure 3E and F), it is possible that the increase in TNF-α level is due to cell death rather than NPs exposure. A 1.12-fold and a 1.21-fold decrease (12.5%–17.6%) were detected in SiO2 NPs (10 nm)-spiked standards in the TNF-α ELISA, indicating the possibility for false negatives with this assay (Figure 4A). Despite the possible suppression of signal, SiO2 NPs (10 nm) caused a significant increase in TNF-α at both concentrations (Figure 4B). Since SiO2 NP treatments resulted in decreased cell number (Figure 3), TNF-α levels were normalized to cell number (as determined via Coulter counter). Figure 4B shows that there is a significant increase in TNF-α level in RAW 264.7 cells treated with SiO2 NPs (0.01 g/L) at 24 hours, after which the level decreases. When TNF-α levels are expressed as ng/cell, there is no significant increase in the cells treated with 0.005 g/L SiO2 NPs.
|
Figure 4 RAW 264.7 cells were exposed to NPs for variable time points, and supernatants harvested and used for ELISAs. |
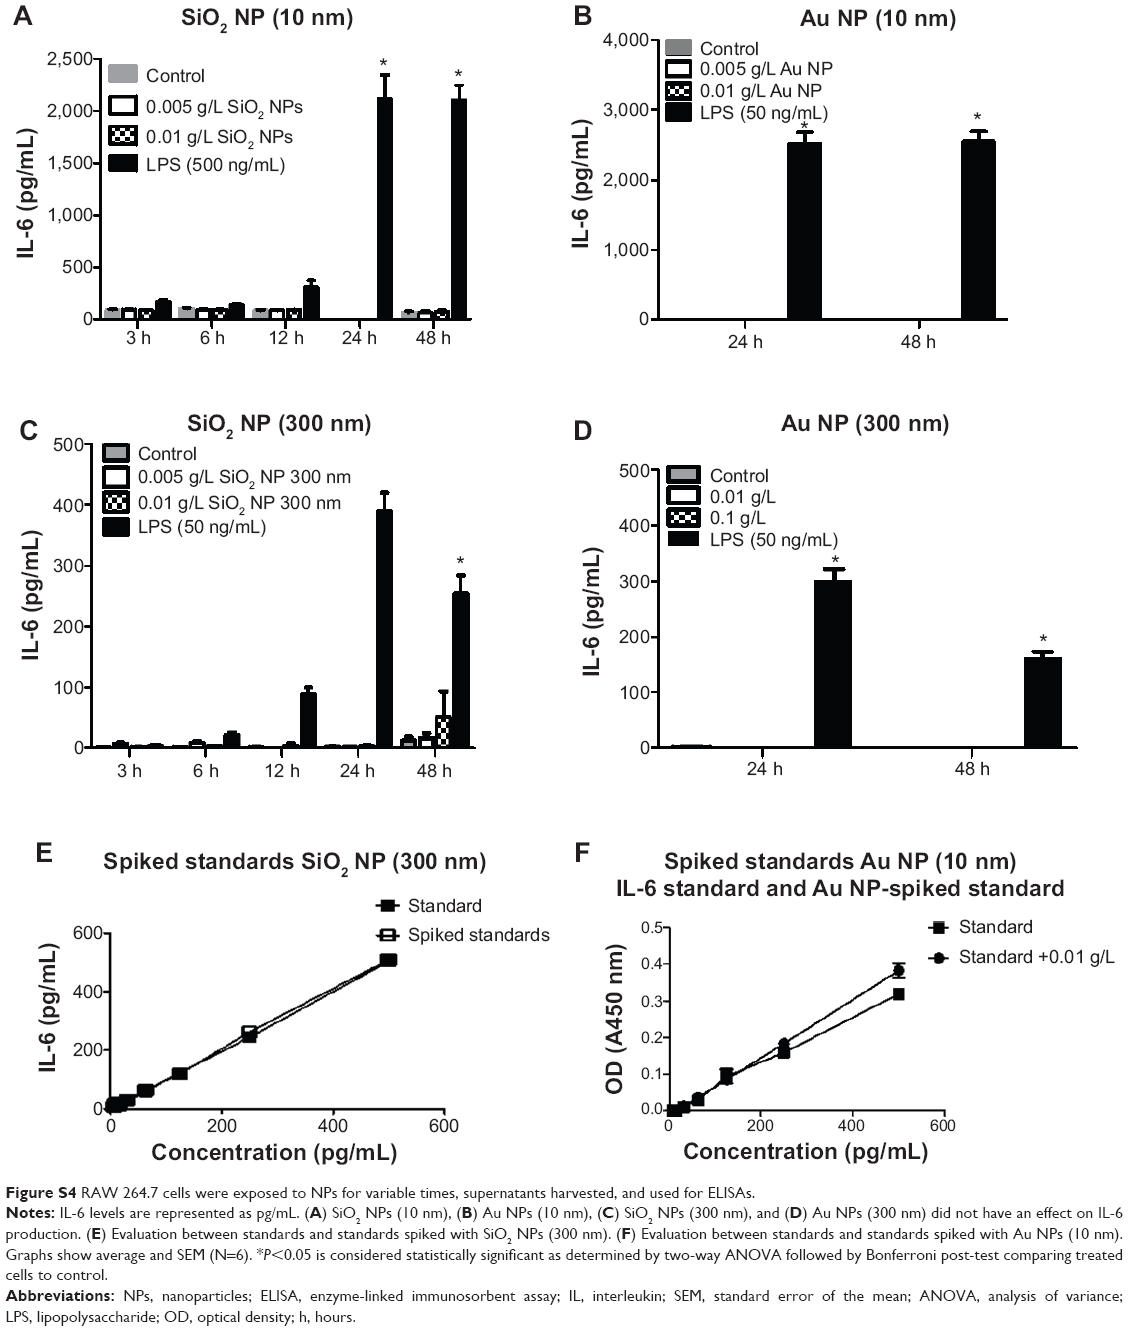
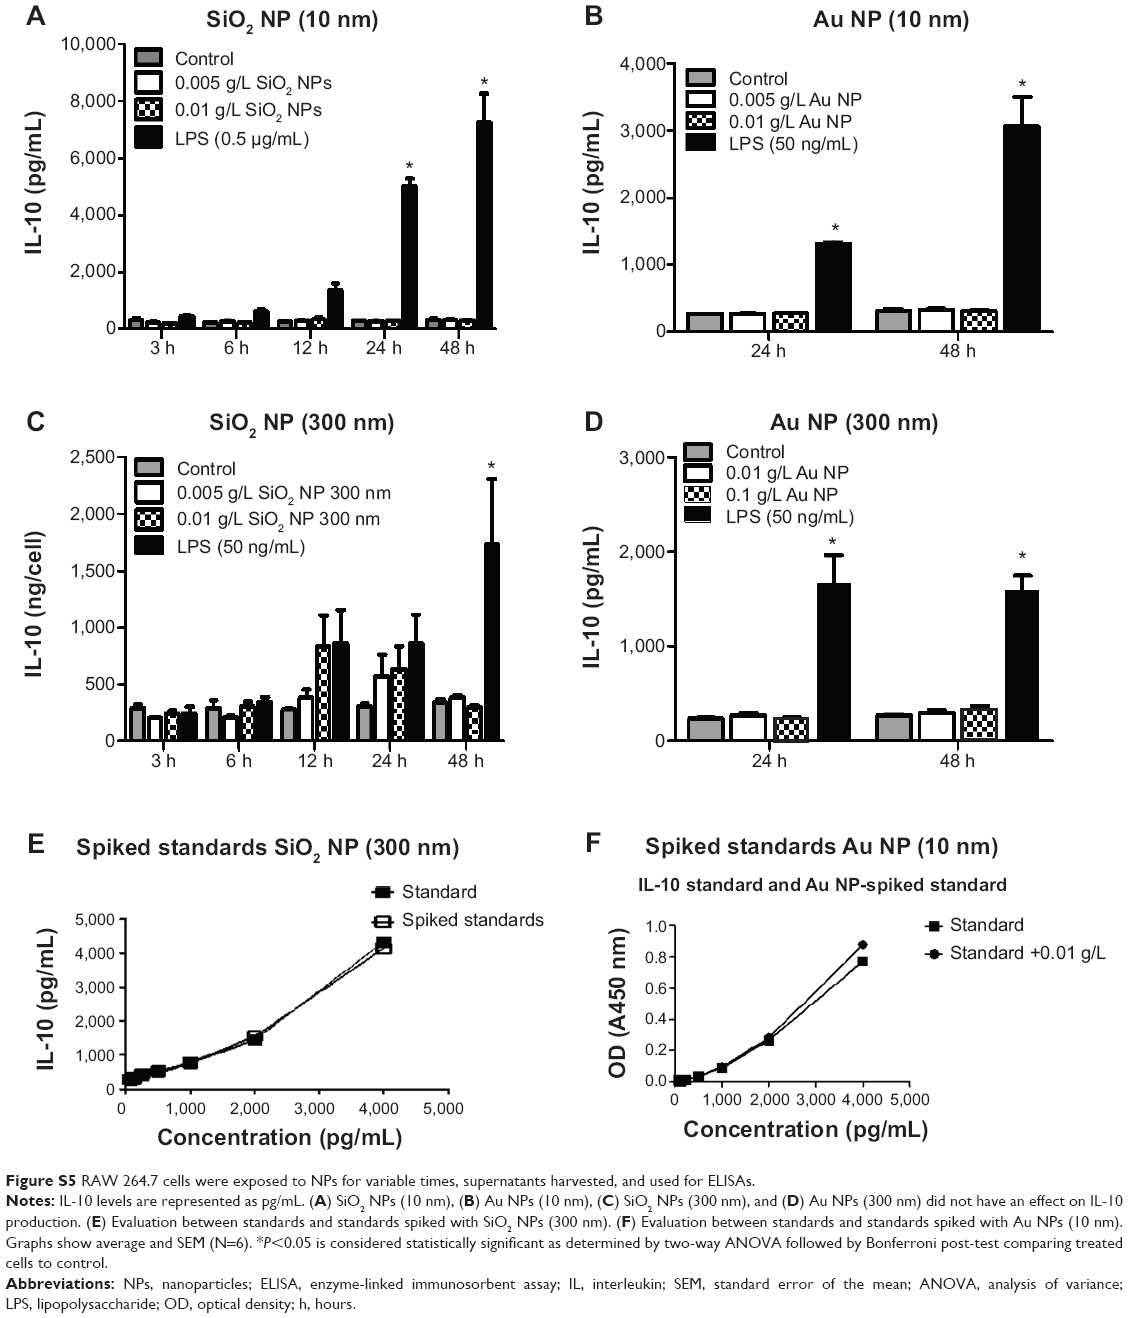
There was no change in TNF-α, IL-6, or IL-10 levels in RAW 264.7 cells treated with Au NPs (10 nm and 300 nm) and SiO2 NPs (300 nm) or in IL-6 and IL-10 levels in SiO2 NPs (10 nm)-treated cells. There was no interference detected in SiO2 NPs (10 nm and 300 nm)- and Au NPs (10 nm and 300 nm)-spiked standards for IL-6 and IL-10 ELISA (Figures S3–S5).
RAW 264.7 cells treated with NPs did not show a change in activation markers
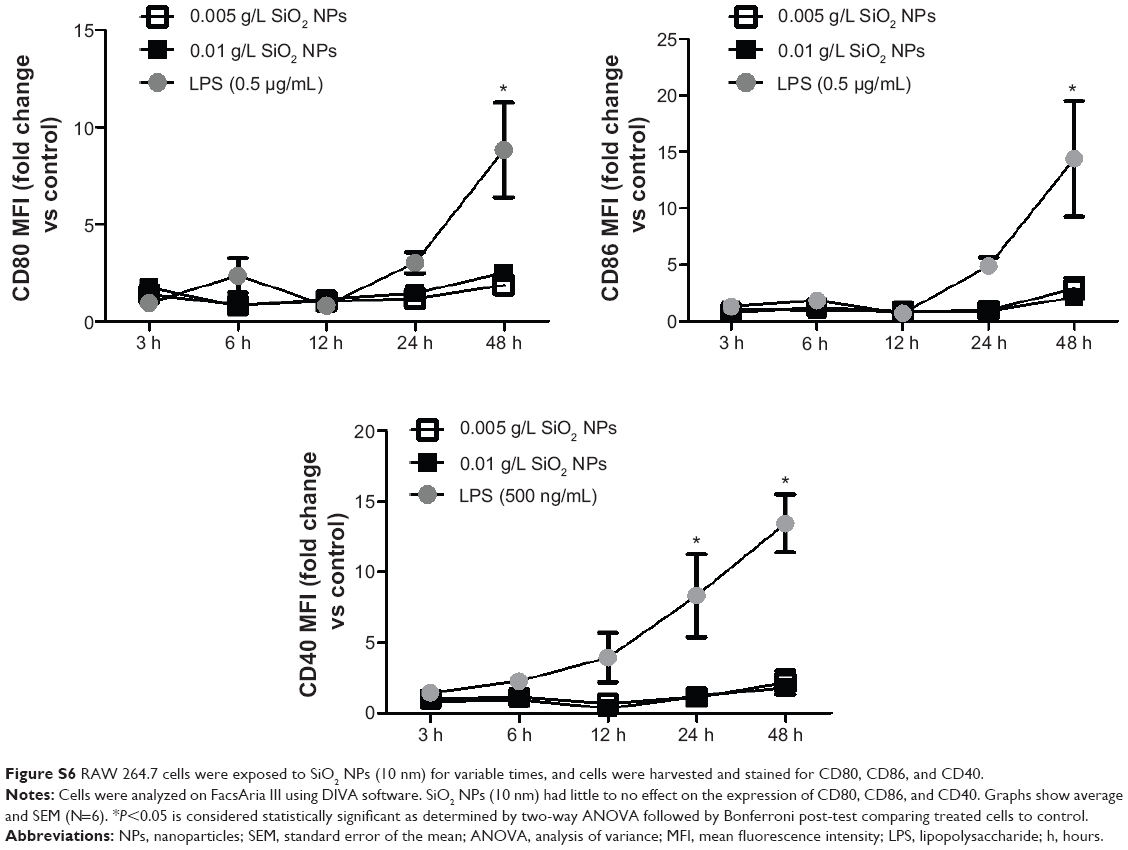
NP-treated cells were also assayed for surface activation markers (CD80, CD86, and CD40). The maximum fold of induction in the activation markers in RAW 264.7 cells exposed to SiO2 NPs (10 nm and 300 nm) and Au NPs (10 nm and 300 nm) was ~2.8-fold increase seen with the SiO2 NPs (10 nm) at 48 hours (Figure S6). The other NPs did not show any difference from the controls (data not shown).
RAW 264.7 cells treated with SiO2 NPs (10 nm), Au NPs (10 nm), and Au NPs (300 nm) show decreased phagocytosis
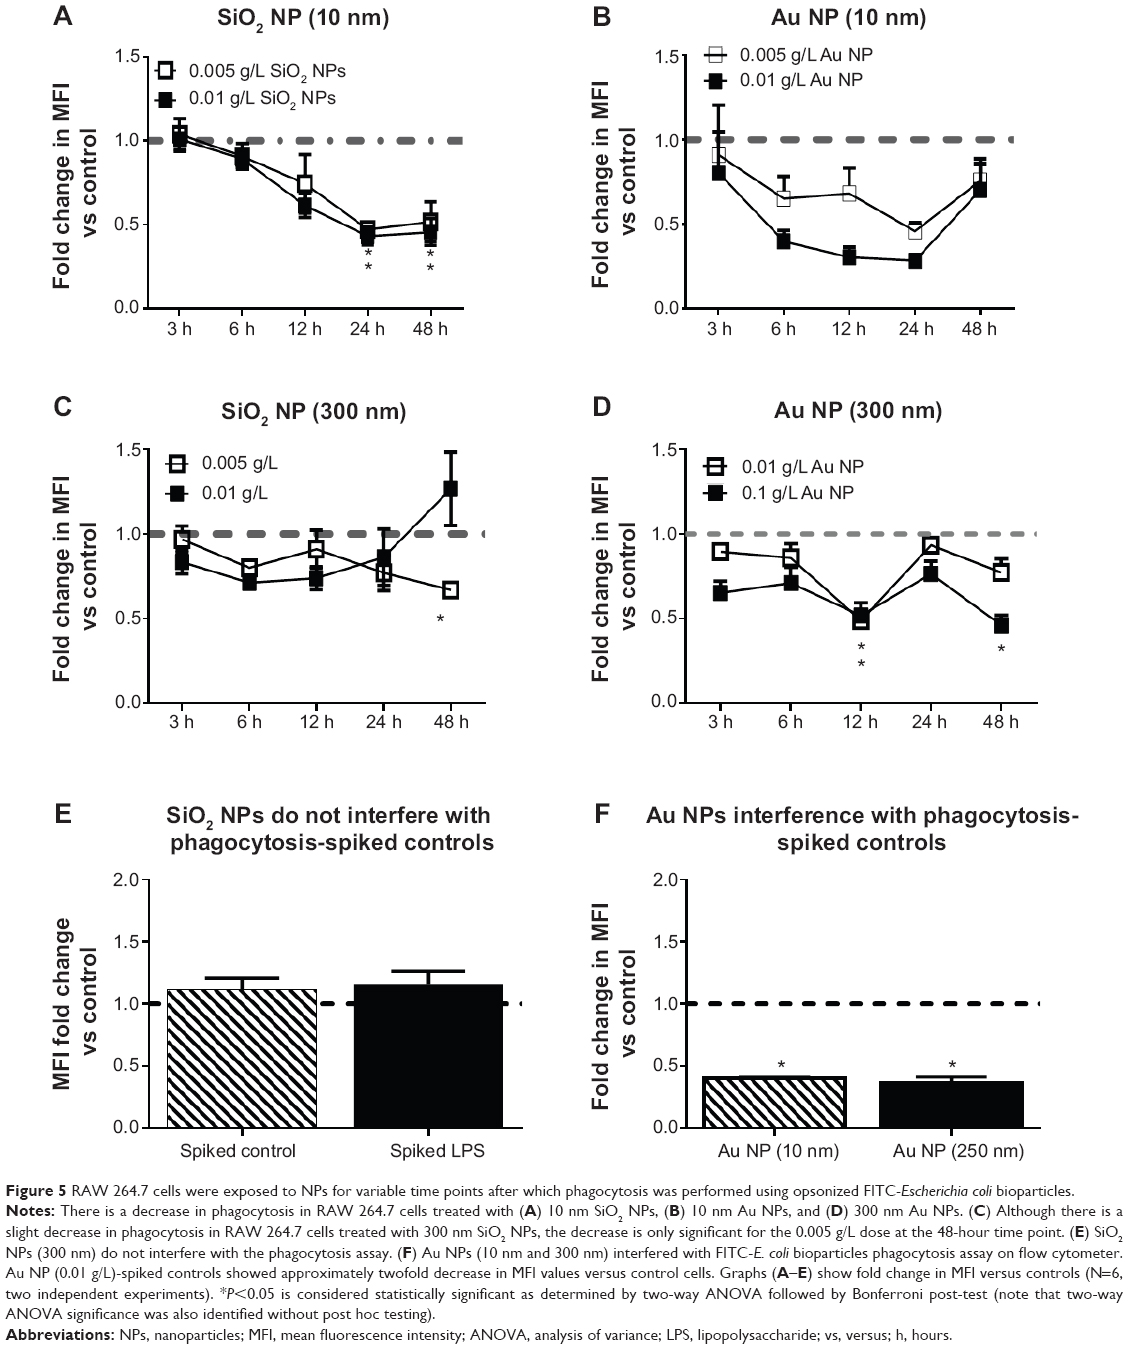
In order to test whether or not NPs have an effect on phagocytosis, RAW 264.7 cells were treated with NPs for variable times, after which cells were exposed to opsonized FITC-E. coli. LPS (50 ng/mL or 500 ng/mL) was used as positive control. Figure 5 shows the change in E. coli incorporation after preexposure to NPs as compared to control cells exposed to only growth media. E. coli incorporation is monitored by changes in MFI. For aid in visualizing, the LPS control was not included. LPS-treated cells showed either increase or no change in E. coli incorporation over the control cells.
|
Figure 5 RAW 264.7 cells were exposed to NPs for variable time points after which phagocytosis was performed using opsonized FITC-Escherichia coli bioparticles. |
SiO2 NPs (10 nm)- and Au NPs (10 nm)-treated RAW 264.7 cells show decreased phagocytosis starting at cells exposed to NPs for 6 hours. However, evaluation of Au NPs-spiked controls (Figure 5F) showed that Au NPs interfere with phagocytosis assays. SiO2 NPs (300 nm) have little to no effect on phagocytosis. SiO2 NPs did not interfere with phagocytosis as determined by spiked controls (Figure 5E).
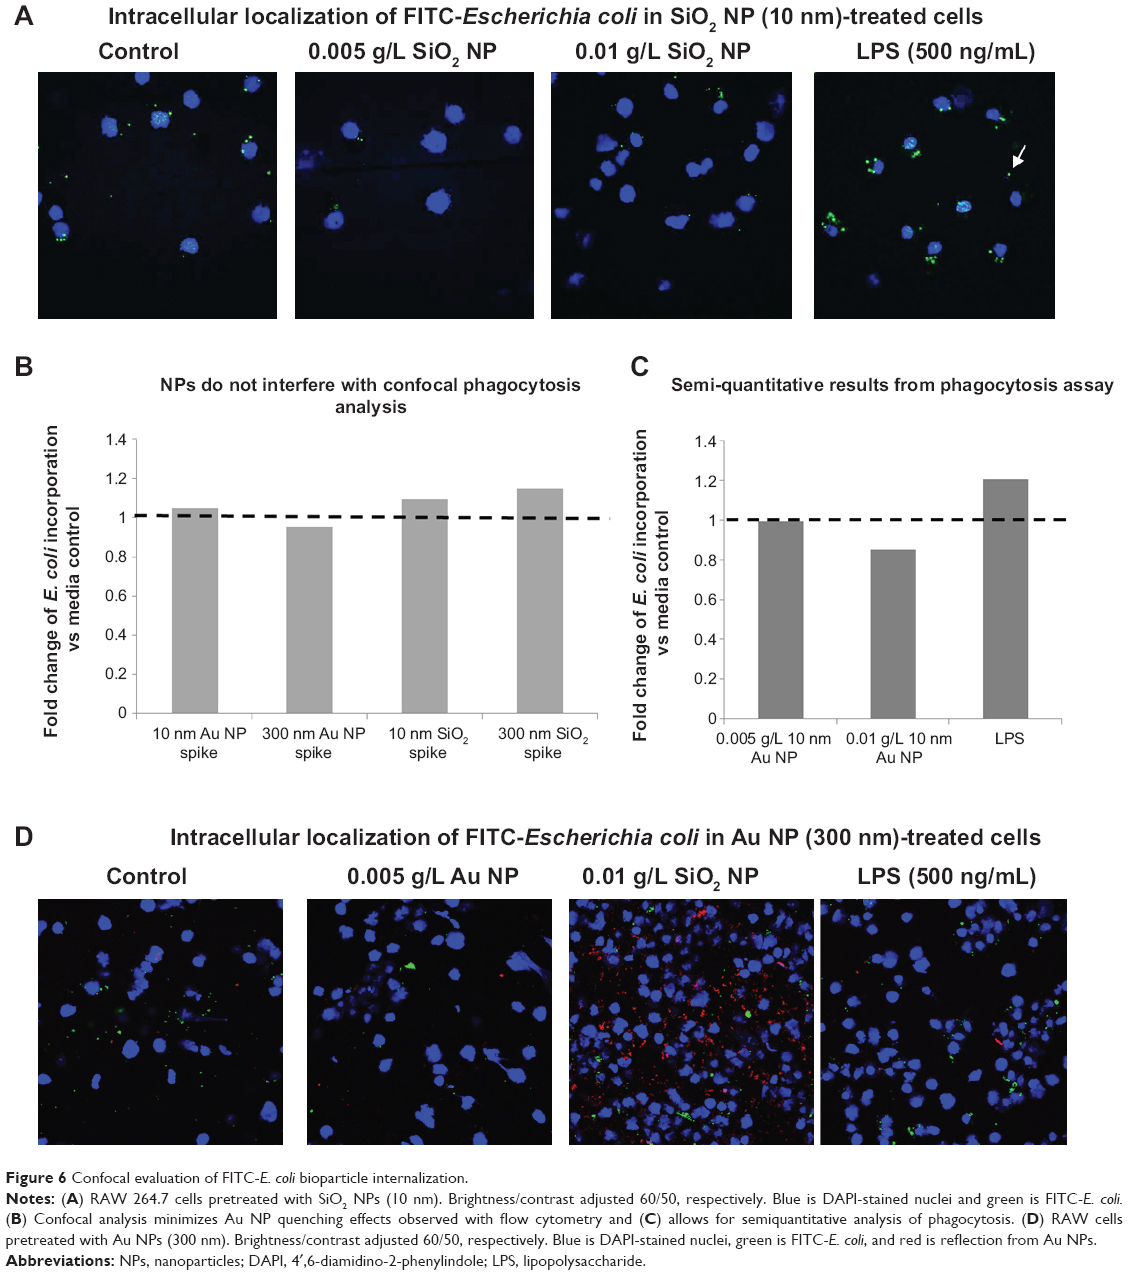
In order to confirm that the bacteria were actually internalized into the macrophages (as opposed to association with the outer cellular membrane), a series of zeta sections (0.1 μm) were obtained. Figure 6A shows that in SiO2 NPs (10 nm)-treated cells, FITC-E. coli are localized inside the cells, around the nucleus. Visual inspection shows that SiO2 NPs-treated cells show less FITC-E. coli incorporation compared to control and LPS-treated cells. The white arrow shows unincorporated FITC-E. coli bioparticles.
|
Figure 6 Confocal evaluation of FITC-E. coli bioparticle internalization. |
Confocal microscopy was further used to evaluate the phagocytosis of FITC-E. coli in the presence of Au NPs, which showed minimal interference with this technique (Figure 6B).
Figure 6A–D shows representative confocal images for cells exposed to first 10 nm SiO2 or 300 nm Au NP for 24 hours, followed by E. coli exposure. Cell nuclei are colored blue, while E. coli are green. Au NPs may be observed via reflective scattering and are colored red. For both particles, a visual examination reveals less E. coli uptake in the pretreated cells than the media or LPS controls. These results could then be analyzed via ImageJ to provide semiquantitative measurements of E. coli internalization. Figure 6C shows the results of a phagocytosis assay after 24-hours preexposure to 10 nm Au NP. There is a reduction of E. coli incorporation in the cells. Figure 6B shows the spiked controls for the confocal method, indicating little to no interference using this method.
Bone marrow-derived primary macrophage phagocytosis
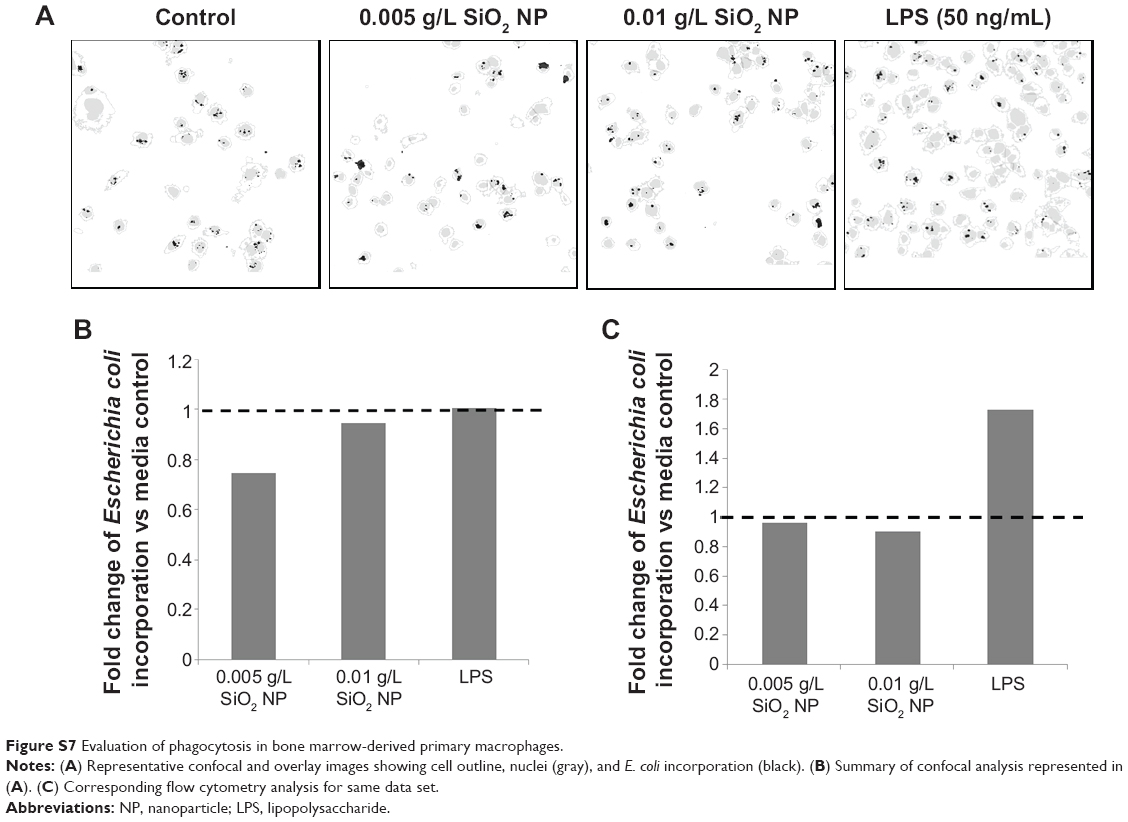
There was an overall significant loss of the primary cells due to manipulations and sample handling. Bone marrow cells were isolated on three separate occasions. Cells were in sufficient quantities for flow analysis in two of three experiments. Both flow cytometry analysis and confocal analysis indicated a reduction in E. coli uptake when cells were first preincubated with 10 nm SiO2. Figure S7A and B shows a representative confocal analysis with ImageJ and the corresponding semiquantitative results. Cell outlines and nuclei are indicated by gray, while the E. coli is indicated by black. Flow cytometry also indicated a reduction in E. coli incorporation. The results, however, were not statistically significant for either method.
Discussion
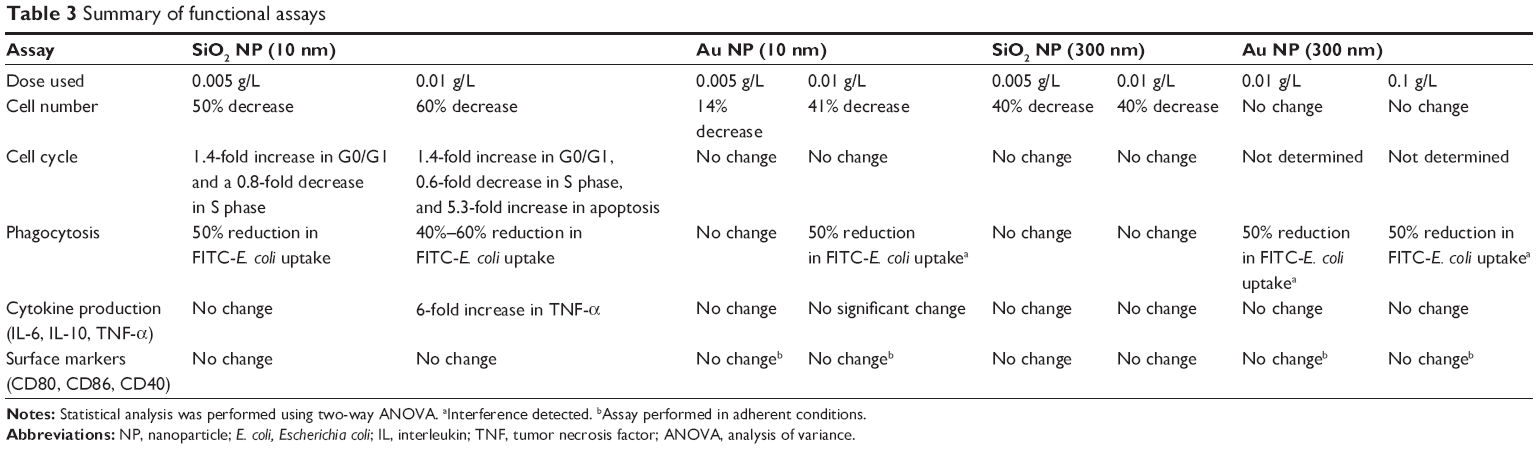
In the current study, a panel of functional assays was employed to determine if nontoxic concentrations of different durable NPs (gold and silica) and sizes (~10 nm and 300 nm) have an effect on macrophage functions in vitro. Table 3 presents a summary of the functional assays and results. Gold and silica NPs are both relevant durable NPs to investigate as they have been proposed for use as drug delivery vehicles, imaging agents, and even active pharmaceutical ingredients.25–27
|
Table 3 Summary of functional assays |
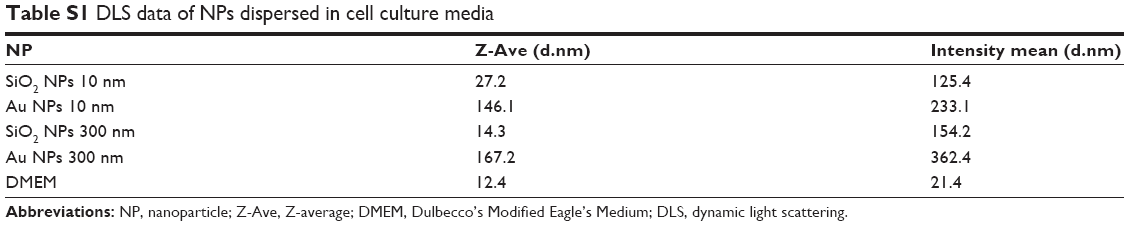
As appropriate characterization has been repeatedly shown to be critical prior to toxicology evaluations, all NPs were first characterized through a battery of tests (Table 1).28,29 Particle size and zeta potential were characterized in both water and relevant testing conditions (ie, cell culture media, Table S1).21,22 Note that both Z-average (Z-Ave) and intensity-weighted average are complicated by the presence of serum proteins in the media. With the exception of the SiO2 NPs (10 nm), all NPs were initially dispersed as individual NPs.
It has been previously demonstrated that simple weight concentrations may not provide a complete picture of NP dosimetry. Therefore, it is important to take into consideration the number, volume, and area used in studies.30 These parameters were calculated and are shown in Table 2. Although the same weight concentration (g/L) was used for all NPs, due to the differences in size, the NP number and surface area are significantly different among NPs with the same core. Furthermore, due to density differences between gold and silica, NP number, surface area, and volume are also different between SiO2 NPs and Au NPs. These differences may partially account for some of the differences observed in functional studies (discussed in more detail below).
Prior to initiating the functional assays, the nontoxic dosing level needed to be established. While all of the studied NPs have been shown to be cytotoxic at higher doses, for the purposes of this study, toxic doses would not be useful for multiple reasons. First, NPs used for therapeutic purposes would not be expected to demonstrate overt toxicity, and so these higher doses would not be appropriately representative of the intended use. Second, if the cell is acutely damaged, many of the functional assays could produce results due to the active dying of the cell, as opposed to the direct impact of the NP internalization. A murine cell line was chosen as the macrophage model in order to more accurately bridge the in vitro studies to future in vivo studies. In addition, a suspended culture was utilized for the majority of experiments for several reasons: 1) The suspended state tends to reduce NP assay interference.21 2) In adherent cell cultures, the exact number of cells is not known at the initiation of the experiment. By utilizing cell suspensions, the amount of cells used in the assay may be fixed, thus more tightly controlling the ratio of cells/NP. It is well known that LPS is a potent inducer of pro-inflammatory cytokines31 and, therefore, it has been extensively used as a positive control in in vitro studies involving macrophages.32–34 In the current study, therefore, LPS-treated cells were used as a positive control.
For all but the 300 nm Au NP, cytotoxic effects were monitored by PI incorporation and calcein green started emerging after a 0.01 g/L NP dose (Figure 1). This dose was therefore chosen as the dose immediately below the threshold of toxicity. A second lower dose was also tested to determine if functional changes were observed even further below the threshold toxicity. Au NP (300 nm) began showing toxicity above 0.1 g/L and so this was used as the high dose, with 0.01 g/L used as the lower dose to allow for weight-based concentration comparisons across the different particles.
With the exception of the increase in TNF-α for SiO2 (10 nm)-treated cells, there was no increase in cytokine levels in any of NPs-treated cells. The current cytokine results are in agreement with some of the published nanotoxicity communications. Zhang et al showed that RAW 264.7 cells exposed to Au NPs (60 nm; NIST standard reference materials) showed no increase in production of TNF-α or IL-6.35 Kusaka et al studied the impact of size on amorphous silica NP-induced inflammation for murine macrophages.36 In their study, they noted that the smaller NPs (30–1,000 nm) induced a greater inflammatory response than the larger NPs. Our study also shows a similar result, with only the 10 nm silica NP showing any difference in cytokine production. A second study evaluated 50 nm and 250 nm gold NPs in vivo to determine the effect of size on pulmonary inflammation. Both sizes of NPs induced only mild inflammation, with no significant different in response due to the size of the NPs.37 Our results for the Au NPs are also consistent with this study (no significant inflammatory response with either size Au NP). Lack of cytokine production in culture supernatants, however, does not exclude increase in the expression of these genes. For example, Lee et al showed that RAW 264.7 cell exposure to Au NPs and silica-coated Au nanorods resulted in a significant increase in several cytokine mRNA expressions.38
NP-treated cells were also assayed for surface activation markers (CD80, CD86, and CD40), and showed no significant change after NP treatment. It has been reported that polypyrrole monodisperse NP-treated J774.A1 cells increased the expression of CD80, CD86, and CD40.39 Our assays, however, were performed using RAW 264.7 cells, which might behave differently compared to primary macrophages.
Proliferation, cytokine production, and phagocytosis were differently impacted by NPs and the cell response was independent of core and size. However, it is important to keep in mind that although the weight concentration used for NPs was the same (eg, 0.01 g/L), NP number is dramatically different depending on the NP size and density (Table 2). For example, when using the weight concentration, NP number, total volume, and the total surface area of 10 nm SiO2 NPs and 300 nm SiO2 NPs were ~100-fold higher versus Au NPs 10 nm and Au NPs 300 nm. This difference is due to the lower density of the SiO2 NPs compared to the Au NPs, resulting in more SiO2 NPs needed in order to obtain the same weight concentration as the Au NPs (which, in turn, leads to more surface area and total volume). Such an increase in volume and surface area may, in part, explain differences observed for the functional studies, with the greater surface area allowing for more cellular interactions and more NP volume “filling up” the cells. Internally between materials, the size alone will impact total number of NPs, etc. As an example, the total number of NPs for SiO2 NPs at 0.01 g/L is 2.4×10¹⁶, whereas same weight concentration of 300 nm SiO2 NPs has 105 less NPs. Therefore, the NP/cell ratio will be different and consequently the effect of SiO2 NPs (300 nm) on macrophage function could be “milder.” In order to obtain 1016 NPs, cells need to be exposed to ~500 g/L SiO2 NPs (300 nm), a concentration that is toxic for RAW 264.7 cells. These reasons could indicate why 10 nm SiO2 produced the most robust response in the assays of all the NPs tested, as they had the greater particle number and total surface area of all the NPs tested.
The major finding of the current study is that SiO2 NPs (10 nm)-, Au NPs (10 nm)-, and Au NPs (300 nm)-treated RAW 264.7 cells show decrease in E. coli bioparticle phagocytosis. As with the other functional assays, 10 nm SiO2 showed the most robust response, with reduction in phagocytosis observed after 6-hour incubation with NPs and decreasing with exposures up to 48 hours. Both sizes of Au NPs indicate a reduction in phagocytosis starting at 3-hour preexposure to NPs. For the 10 nm Au NPs, the E. coli incorporation roughly decreases until 48 hours, where there is an increase in E. coli incorporation. This rise in phagocytosis (as well as the leveling out of the effect for 10 nm SiO2) may be partially explained by the proliferation of the RAW 264.7 cells over the time course of the experiment. By 48 hours, cells have gone through roughly three doubling times, while the NP concentration within the media has been steadily decreasing due to cellular incorporation and sedimentation effects. Therefore, cells have less NPs per cell than at the peak of phagocytosis effects (seen at 24 hours). The Au NP data are more varied than the SiO2 NPs, possibly due to the effects of the Au NP interference, which most strongly emerges as quenching as indicated in Figure 5F. It should be noted that these spiked controls (as well as the spiked controls for the other assay) were performed using the highest possible NP exposure (the full 0.01 g/L dose). As such, they indicate a worst-case scenario. In practice, the full NP dose will not be available for interaction with the assay materials, either through cellular internalization or through the multiple washing steps that occur prior to the assay initiation. However, the assay interference results cannot be discounted and complicate assay interpretation.
Due to the significant interaction of the Au NPs with the E. coli fluorescent tag, confocal microscopy was used to 1) confirm NP and E. coli macrophage internalization and 2) confirm the decrease in phagocytosis observed with flow cytometry. Due to the nature of the confocal measurements, only semiquantitative results are possible. However, the method is able to overcome the quenching interference observed with the flow cytometry method and also provides data using a small quantity of cells (~400 cells needed per group). Such considerations proved critical in evaluating the effects of Au NPs.
In order to help bridge the gap from in vitro results to in vivo relevance, several ex vivo experiments were conducted with isolated primary bone marrow cells and the 10 nm SiO2 NPs (which produced the most robust effect in vitro). There was a significant loss of cells during the course of the experiment due to sample handling (during plating, counting, suspension, etc). This low cell number may account for the lack of significance in the phagocytosis experiments, especially in terms of the confocal analysis. Other possibilities include the mixed cell population from derived bone marrow cells as well as increased differential response when using primary cells from multiple animals. In addition, there may be a lack of correlation from the immortalized cell line to a more relevant system. Current studies are underway with animal models to further probe the effects of the reduction in pathogen phagocytosis observed in cell models to help gauge clinical relevance.
Shvedova et al showed that exposure of alveolar macrophages to carbon nanotubes decreased Listeria monocytogenes phagocytosis by macrophages in vitro.16 Decrease in phagocytosed bacteria can lead to decreased bacterial clearance during infections. Indeed, in a pharyngeal aspiration model, mice exposed to carbon nanotubes showed decrease in lung bacterial clearance of L. monocytogenes (Gram-positive bacteria). Alternatively, mice exposed to Cu NPs by inhalation or instillation exhibited a significant decrease in the pulmonary bacterial clearance of Klebsiella pneumoniae (Gram-negative bacteria).40 The above-mentioned studies were conducted using a single dose of NPs in pulmonary models. One clinical study evaluating the effect of an iron sucrose formulation demonstrated that polymorphonuclear leukocytes isolated from patients treated with the NP formulation showed less bacterial killing of E. coli ex vivo than patients administered a placebo, although the results were not significant and only occurred immediately after administration of the parenteral iron compound.41 The impact of systemic administration of NPs as well as repeat dosing of NPs is not yet known.
The decrease in phagocytosis for nontoxic doses of NPs is of significant interest for durable NPs. Decreased macrophage phagocytosis has been linked to the production or worsening of several disease states.42–45 With the sequestration of the NPs within the MPS, exposure to durable NPs within the macrophages may last a long time, and potentially span the lifetime of a patient. Such exposure becomes even more important in the treatment of chronic diseases, where therapies are administered repeatedly to the affected population, or the patient population is already immunocompromised (eg, cancer patients). Since there is no overt toxicity in terms of cytokine production or activation markers, these data may indicate that the suppression effect is due to a clearance/sequestration mechanism of the NPs as opposed to a traditional functional toxicity mechanism.
In addition, such a mechanism may be core and drug independent.46 Indeed Qu et al reported a decrease in the ability of macrophages to phagocytose red blood cells after preexposure to quantum dots in vitro.47 Ultrafine TiO2, Ag, ZnO, and carbon black have also been shown to reduce phagocytosis after NP instillation and ex vivo phagocytosis analysis.48,49 It should be noted that all of the above-mentioned studies also exhibited additional overt toxicity signals, such as inflammation in addition to the reduced phagocytosis. The current study demonstrates phagocytosis reduction even at doses that do not indicate other toxicity signals. A similar study by Kodali et al has examined the effect of pre-dosing bone marrow-derived macrophages with silica or superparamagnetic iron oxide NPs at nontoxic doses.50 Results indicated phagocytosis suppression for a wide range of bacteria with macrophages pretreated with the iron oxide NP. The diversity of NPs producing similar immunosuppressive effects may indicate that this effect is class (ie, durable NP) dependent, with the macrophages exhausting their capabilities to uptake any particle, NP, or bioparticle when preexposed to durable NPs. In an in vivo setting, the body has a deep reserve of phagocytic cells, with the ability to produce more upon demand. It is unclear if or how many particles would be needed to saturate the macrophages under in vivo conditions to see a similar effect.
While the biological impact of these findings remains unclear, our results indicate that bioaccumulation of durable NPs within the macrophages may lead to a suppression of bacterial uptake. It should be noted that the work presented has not yet established that the observed decrease in phagocytosis is causally linked to impaired bactericidal activity. Animal studies are currently underway to assess the impact and relevance of the observed in vitro phagocytosis decrease. Results from this and current studies should help inform both regulators and drug sponsors on appropriate follow-up immunotoxicity testing when durable NPs accumulate in the macrophages of the MPS.
Acknowledgments
The authors acknowledge the Office of Science and Engineering Laboratories, CDRH FDA, for the use of their TGA. This project was supported in part by an appointment to the Research Participation Program at the Center for Drug Evaluation and Research administered by the Oak Ridge Institute for Science and Education through an interagency agreement between the US Department of Energy and the US Food and Drug Administration. The authors would like to acknowledge the FDA White Oak Nanotechnology Core Facility for instrument use and scientific and technical assistance.
Disclosure
The findings and conclusions in this article have not been formally disseminated by the Food and Drug Administration and should not be construed to represent any Agency determination or policy. The mention of commercial products, their sources, or their use in connection with material reported herein is not to be construed as either an actual or implied endorsement of such products by the Department of Health and Human Services. The authors have no conflicts of interest in this work.
References
Etheridge ML, Campbell SA, Erdman AG, Haynes CL, Wolf SM, McCullough J. The big picture on nanomedicine: the state of investigational and approved nanomedicine products. Nanomedicine. 2013;9(1):1–14. | ||
Horstkotte E, Odoerfer KI. Towards improved therapies using nanopharmaceuticals: recent patents on pharmaceutical nanoformulations. Recent Pat Food Nutr Agric. 2012;4(3):220–244. | ||
Fernandez-Fernandez A, Manchanda R, McGoron AJ. Theranostic applications of nanomaterials in cancer: drug delivery, image-guided therapy, and multifunctional platforms. Appl Biochem Biotechnol. 2011; 165(7–8):1628–1651. | ||
Hall JB, Dobrovolskaia MA, Patri AK, SMcNeil SE. Characterization of nanoparticles for therapeutics. Nanomedicine. 2007;2(6):789–803. | ||
Kateb B, Chiu K, Black KL, et al. Nanoplatforms for constructing new approaches to cancer treatment, imaging, and drug delivery: what should be the policy? Neuroimage. 2011;54(suppl 1):S106–S124. | ||
Benezra M, Penate-Medina O, Zanzonico PB, et al. Multimodal silica nanoparticles are effective cancer-targeted probes in a model of human melanoma. J Clin Invest. 2011;121(7):2768–2780. | ||
Libutti SK, Paciotti GF, Byrnes AA, et al. Phase I and pharmacokinetic studies of CYT-6091, a novel PEGylated colloidal gold-rhTNF nanomedicine. Clin Cancer Res. 2010;16(24):6139–6149. | ||
Demoy M, Andreux JP, Weingarten C, Gouritin B, Guilloux V, Couvreur P. Spleen capture of nanoparticles: influence of animal species and surface characteristics. Pharm Res. 1999;16(1):37–41. | ||
Cho WS, Cho M, Jeong J, et al. Acute toxicity and pharmacokinetics of 13 nm-sized PEG-coated gold nanoparticles. Toxicol Appl Pharmacol. 2009;236(1):16–24. | ||
De Jong WH, Hagens WH, Krystek P, Burger MC, Sips AJAM, Geertsma RE. Particle size-dependent organ distribution of gold nanoparticles after intravenous administration. Biomaterials. 2008;29(12):1912–1919. | ||
Hirn S, Semmler-Behnke M, Schleh C, et al. Particle size-dependent and surface charge-dependent biodistribution of gold nanoparticles after intravenous administration. Eur J Pharm Biopharm. 2011;77(3):407–416. | ||
Virella G. Diagnostic evaluation of phagocytic function. In: Virella G, editor. Immunology Series. Vol. 58. New York: Marcel Dekker; 1993:311–327. | ||
Campbell PA, Vanono BP, Drevets DA. Measurement of bacterial ingestion and killing by macrophages. In: Collgan JE, Kruisbeck AM, Margulies DH, Shevach EM, Strober W, editors. Current Protocols in Immunology. New York: John Wiley & Sons, Inc; 1994:14.6.1–14.6.13. | ||
Skoczen SL, Potter TM, Dobrovolskaia MA. In vitro analysis of nanoparticle uptake by macrophages using chemiluminescence. In: McNeil SE, editor. Characterization of Nanoparticles Intended for Drug Delivery. New York: Springer Science; 2011:255–261. | ||
Braydich-Stolle LK, Speshock JL, Castle A, Smith M, Murdock RC, Hussain SM. Nanosized aluminum altered immune function. ACS Nano. 2010;4(7):3661–3670. | ||
Shvedova AA, Fabisiak JP, Kisin ER, et al. Sequential exposure to carbon nanotubes and bacteria enhances pulmonary inflammation and infectivity. Am J Respir Cell Mol Biol. 2008;38(5):579–590. | ||
Mitchell LA, Lauer FT, Burchiel SW, McDonald JD. Mechanisms for how inhaled multiwalled carbon nanotubes suppress systemic immune function in mice. Nat Nanotechnol. 2009;4(7):451–456. | ||
Zogovic NS, Nikolic NS, Vranjes-Djuric SD, et al. Opposite effects of nanocrystalline fullerene (C(60)) on tumour cell growth in vitro and in vivo and a possible role of immunosupression in the cancer-promoting activity of C(60). Biomaterials. 2009;30(36):6940–6946. | ||
Moon EY, Yi GH, Kang JS, Lim JS, Kim HM, Pyo S. An increase in mouse tumor growth by an in vivo immunomodulating effect of titanium dioxide nanoparticles. J Immunotoxicol. 2011;8(1):56–67. | ||
Guidance for Industry. S8 Immunotoxicity Studies for Human Pharmaceuticals; 2006. Available from: http://www.fda.gov/downloads/Drugs/GuidanceComplianceRegulatoryInformation/Guidances/ucm074965.pdf | ||
Bancos S, Weaver JL, Katherine Tyner KM. Evaluation of viability and proliferation profiles of macrophage-treated silica nanoparticles in vitro via plate based, flow cytometry and Coulter counter assays. ISRN Nanotechnol. 2012(2012); Article ID 454072:11. | ||
Keene AM, Tyner KM. Analytical characterization of gold nanoparticle primary particles, aggregates, agglomerates, and agglomerated aggregates. J Nanopart Res. 2011;13:3465–3481. | ||
Keene AM, Peters D, Rouse R, Stewart S, Rosen ET, Tyner KM. Tissue and cellular distribution of gold nanoparticles varies based on aggregation/agglomeration status. Nanomedicine. 2012;7(2):199–209. | ||
National Research Council. Guide for the Care and Use of Laboratory Animals. Washington, DC, USA: National Academy Press; 1996. | ||
Thakor AS, Luong R, Paulmurugan R, et al. The fate and toxicity of Raman-active silica-gold nanoparticles in mice. Sci Transl Med. 2011; 3(79):79ra33. | ||
Goel R, Shah N, Visaria R, Paciotti GF, Bischof JC. Biodistribution of TNF-alpha-coated gold nanoparticles in an in vivo model system. Nanomedicine. 2009;4(4):401–410. | ||
Mukherjee P. Antiangiogenic properties of gold nanoparticles. Clin Cancer Res. 2005;11:3530–3534. | ||
Warheit DB. How meaningful are the results of nanotoxicity studies in the absence of adequate material characterization. Toxicol Sci. 2008;101(2):183–185. | ||
Oberdorster G. Safety assessment for nanotechnology and nanomedicine: concepts of nanotoxicology. J Intern Med. 2009;267(1):89–105. | ||
Teeguarden JG, Hinderliter PM, Orr G, Thrall BD, Pounds JG. Particokinetics in vitro: dosimetry considerations for in vitro nanoparticle toxicity assessments. Toxicol Sci. 2006;95(2):300–312. | ||
Ulevitch RJ, Tobias PS. Receptor dependent mechanism of cell stimulation by bacterial endotoxin. Annu Rev Immunol. 1995;13:437–457. | ||
Lichtman SN, Wang J, Lemasters JJ. LPS receptor CD14 participates in release of TNF-α in RAW 264.7 and peritoneal cells but not in Kupffer cells. Am J Physiol. 1998;275(1):G39–G46. | ||
Netea MG, Kullberg BJ, van der Meer JW. Lipopolysaccharide-induced production of tumor necrosis factor and interleukin-1 is differentially regulated at the receptor level: the role of CD-14-dependent and CD-14-independent pathways. Immunology. 1998;94(3):340–343. | ||
Jian ZJ, Yang Z, Miller MS, Carter CD, Slauson DO, Bochsler PN. Interleukin-6 secretion by bacterial lipopolysaccharide-stimulated bovine alveolar macrophages in vitro. Vet Immunol Immunopathol. 1995;49(1–2):51–60. | ||
Zhang Q, Hitchins VM, Schrand AM, Hussain SM, Goering P. Uptake of gold nanoparticles in murine macrophage cells without cytotoxicity or production of pro-inflammatory mediators. Nanotoxicology. 2011;5(3):284–295. | ||
Kusaka T, Nakayama M, Nakamura K, Ishimiya M, Furusawa E, Ogasawara K. Effect of silica particle size on macrophage inflammatory responses. PLoS One. 2014;9(3):e92634. | ||
Gosens I, Post JA, de la Fonteyne LJJ, et al. Impact of agglomeration state of nano- and submicron sized gold particles on pulmonary inflammation. Part Fibre Toxicol. 2010;7(37):1–11. | ||
Lee JY, Park W, Yi DK. Immunostimulatory effects of gold nanorod and silica-coated gold nanorod on RAW 264.7 mouse macrophages. Toxicol Lett. 2012;209(1):51–57. | ||
Kim S, Oh WK, Jeong YS, et al. Cytotoxicity of, and innate immune response to, size-controlled polypyrrole nanoparticles in mammalian cells. Biomaterials. 2011;32(9):2234–2250. | ||
Kim JS, Adamcakova-Dodd A, O’Shaughnessy PT, Grassian VH, Thorne PS. Effects of copper nanoparticle exposure on host defense in a murine pulmonary infection model. Part Fibre Toxicol. 2011;8:29–43. | ||
Deicher R, Xiai F, Cohen G, Mullner M, Horl WH. High-dose parenteral iron sucrose depresses neutrophil intracellular killing capacity. Kidney Int. 2003;64:728–736. | ||
Danikas KK, Karakantza M, Theodorous GL, Sakellaropoulos GC, Gogos CA. Prognostic value of phagocytic activity of neutrophils and monocytes in sepsis. Correlation to CD64 and CD14 antigen expression. Clin Exp Immunol. 2008;154(1):87–97. | ||
Prieto J, Subira ML, Vastilla A, Civeira MP, Serrano M. Monocyte disorder causing cellular immunodeficiency: a family study. Clin Exp Immunol. 1990;79(1):1–6. | ||
Wolach B, Gavrieli R, Roos D, Berger-Achituv S. Lessons learned from phagocytic function studies in a large cohort of patients with recurrent infections. J Clin Immunol. 2012;32(3):454–466. | ||
Sharbaugh RJ. Effect of cyclophosphamide on in vitro phagocytosis of staphylococcus aureus. J Infect Dis. 1976;134(6):619–623. | ||
Coraschi D, Constantino L, Italiani P. Interaction of nanoparticles with immunocompetent cells: nanosafety considerations. Nanomedicine. 2012;7(12):121–131. | ||
Qu G, Zhang C, Yuan L, et al. Quantum dots impair macrophagic morphology and the ability of phagocytosis by inhibiting the Rho-associated kinase signaling. Nanoscale. 2012;4:2239–2244. | ||
Renwick LC, Brown D, Clouter A, Donaldson K. Increased inflammation and altered macrophage chemotactic responses caused by two ultrafine particle types. Occup Environ Med. 2004;61(5):442–447. | ||
Liu H, Yang D, Yang H, et al. Comparative study of respiratory tract immune toxicity induced by three sterilisation nanoparticles: silver, zinc oxide and titanium dioxide. J Hazard Mater. 2013;248–249:478–486. | ||
Kodali V, Littke MH, Tilton SC, et al. Dysregulation of macrophage activation profiles by engineered nanoparticles. ACS Nano. 2013;7(8):6997–7010. |
Supplementary materials
|
Figure S1 NPs were analyzed by TEM and DLS in water. |
|
Figure S2 RAW 264.7 cells were exposed to NPs for variable time points and the cell cycle was determined flow cytometry. |
|
Figure S3 RAW 264.7 cells were exposed to NPs for variable times, supernatants harvested, and used for ELISAs. |
|
Figure S4 RAW 264.7 cells were exposed to NPs for variable times, supernatants harvested, and used for ELISAs. |
|
Figure S5 RAW 264.7 cells were exposed to NPs for variable times, supernatants harvested, and used for ELISAs. |
|
Figure S6 RAW 264.7 cells were exposed to SiO2 NPs (10 nm) for variable times, and cells were harvested and stained for CD80, CD86, and CD40. |
|
Figure S7 Evaluation of phagocytosis in bone marrow-derived primary macrophages. |
|
Table S1 DLS data of NPs dispersed in cell culture media |
 © 2014 The Author(s). This work is published and licensed by Dove Medical Press Limited. The full terms of this license are available at https://www.dovepress.com/terms.php and incorporate the Creative Commons Attribution - Non Commercial (unported, v3.0) License.
By accessing the work you hereby accept the Terms. Non-commercial uses of the work are permitted without any further permission from Dove Medical Press Limited, provided the work is properly attributed. For permission for commercial use of this work, please see paragraphs 4.2 and 5 of our Terms.
© 2014 The Author(s). This work is published and licensed by Dove Medical Press Limited. The full terms of this license are available at https://www.dovepress.com/terms.php and incorporate the Creative Commons Attribution - Non Commercial (unported, v3.0) License.
By accessing the work you hereby accept the Terms. Non-commercial uses of the work are permitted without any further permission from Dove Medical Press Limited, provided the work is properly attributed. For permission for commercial use of this work, please see paragraphs 4.2 and 5 of our Terms.