")
Back to Journals » Drug Design, Development and Therapy » Volume 16
Effect of Rifampicin on the Pharmacokinetics of Evogliptin in Healthy Volunteers
Authors Shin Y , Choi C, Oh ES, Kim CO, Park K, Park MS
Received 11 October 2022
Accepted for publication 30 November 2022
Published 20 December 2022 Volume 2022:16 Pages 4301—4310
DOI https://doi.org/10.2147/DDDT.S383157
Checked for plagiarism Yes
Review by Single anonymous peer review
Peer reviewer comments 2
Editor who approved publication: Dr Tuo Deng
Yesong Shin,1 Chungam Choi,2 Eun Sil Oh,2,3 Choon Ok Kim,2 Kyungsoo Park,1 Min Soo Park2– 4
1Department of Pharmacology, Yonsei University College of Medicine, Seoul, Korea; 2Department of Clinical Pharmacology and Clinical Trials Center, Severance Hospital, Yonsei University Health System, Seoul, Korea; 3Department of Pharmaceutical Medicine and Regulatory Science, Graduate Inter Program, Yonsei University College of Medicine, Seoul, Korea; 4Department of Pediatrics, Yonsei University College of Medicine, Seoul, Korea
Correspondence: Min Soo Park, Department of Clinical Pharmacology, Severance Hospital, Yonsei University Health System, 50 Yonsei-ro, Seodaemun-gu, Seoul, 120-752, Korea, Tel +82-2-2228-0400, Fax +82-31-787-4045, Email [email protected]
Purpose: Evogliptin (DA-1229) is a novel, potent, and selective dipeptidyl peptidase 4 (DPP-4) inhibitor for treating type 2 diabetes mellitus. This study investigates the effect of rifampicin on evogliptin pharmacokinetics.
Patients and Methods: An open-label, crossover, one-sequence study was conducted on 12 healthy subjects. Reference baseline pharmacokinetic samples were collected on day 1 after the subjects were administered a single dose of 5 mg evogliptin. After a washout period, the subjects were administered 600 mg rifampicin once daily for 10 days, from days 8 to 17, for full induction of hepatic enzyme activity. On day 17, single doses of evogliptin (5 mg) were administered along with rifampicin (600 mg). The test pharmacokinetic samples were collected with a sampling schedule identical to that used for the reference.
Results: Maximum concentration (Cmax) and area under the plasma drug concentration-time curve (AUC0-96h) of evogliptin with and without co-administration of rifampicin were compared. Reference and test Cmax and AUC0-96h values of evogliptin were 4.70 ng/mL vs 4.86 ng/mL and 153.97 ng∙h/mL vs 58.83 ng∙h/mL, respectively. All adverse events were mild in intensity and considered unrelated to evogliptin administration.
Conclusion: Rifampicin decreased the AUC0-96h of evogliptin by 61.8% without significantly affecting Cmax. The mechanism underlying the decrease in AUC0-96h is thought to be the induction of cytochrome P450 (CYP), especially 3A, by rifampicin. The adverse events, none of which were serious, were not significantly altered by the concomitant administration of evogliptin and rifampicin. Nevertheless, it would be prudent that evogliptin dosing should be carefully considered when co-administered with CYP3A inducers.
Keywords: drug–drug interaction, DPP-4 inhibitor, CYP3A inducer, evogliptin, rifampicin
Introduction
Evogliptin (DA-1229) is a newly developed dipeptidyl peptidase 4 (DPP-4) inhibitor (Figure 1). The pharmacological activity of DPP-4 inhibitors is derived from blocking the degradation of glucagon-like peptide-1 (GLP-1), which plays an important role in glucose homeostasis.1,2 Evogliptin showed high potency (half maximal inhibitory concentration (IC50): 0.98 nM) and over 6000-fold selectivity for DPP-4 compared with DPP-8 or DPP-9.3
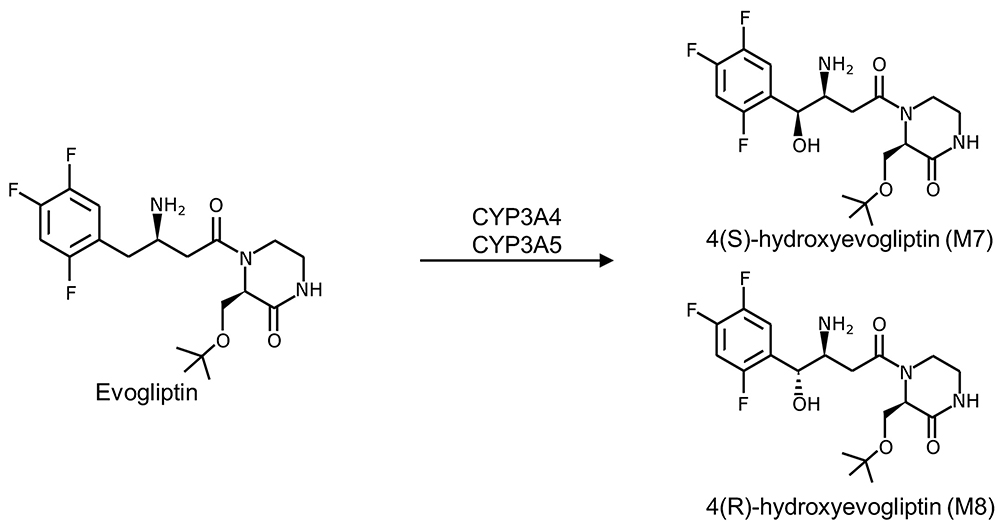 |
Figure 1 Structure of evogliptin and its active metabolites (M7 and M8).37 |
Evogliptin is characterized by a long half-life (> 30 h) and is unaffected by food following a single-dose Phase 1 study.4 In a multiple-dose phase 1 study, evogliptin showed dose proportionality within the 5–20 mg dose range.5 In both studies, evogliptin showed rapid absorption after 5 mg oral administration and 5 h for the time to peak plasma concentration (Tmax).4,5 The absolute bioavailability was reported to be about 50%.6 In a clinical trial on type 2 diabetes, administration of 5 mg of evogliptin once daily for 12 weeks reduced glycated hemoglobin (HbA1c) by 0.66% compared with a decrease of 0.09% in the control group.7
Patients with type 2 diabetes taking DPP-4 inhibitors commonly consume additional antidiabetic medications, such as metformin, sulfonylureas, or thiazolidinediones.8 Moreover, antidiabetic medication regimens can become more complex and stressful for the patients.9
Enzyme induction/inhibition studies revealed that evogliptin was unlikely to induce cytochrome P450 (CYP), especially 3A, or inhibit CYP1A2, 2C9, 2C19, 2D6, or 3A4.10 However, evogliptin exposure may be influenced by drugs that affect the pathways involved in the pharmacokinetic (PK) profile of evogliptin. In an in vitro study using human cDNA-expressed CYPs, evogliptin was mainly metabolized to hydroxy-DA-1229 (M7 or M8) by CYP3A4 in human hepatocytes, liver microsomes, and liver S9 fractions (Figure 1).10 In healthy volunteers, the drug is excreted in a comparable amount through the hepatic and renal pathways.11
Several medications are known to induce CYP3A enzyme expression.12 When CYP3A enzyme inducers are co-administered with evogliptin, CYP3A-mediated metabolic change may reduce evogliptin exposure in the body, eventually leading to treatment failure attributed to inadequate control of glucose levels.13 Authorities recommend clinical pharmacology studies of drug interactions during drug development, especially when the potential risk of drug interactions is deemed high.14,15 Rifampicin is an antibacterial agent that is known to be one of the most potent CYP3A inducers.14–16 It is commonly used as a CYP3A perpetrator in in vivo drug–drug interaction studies.14,15 To investigate the effect of CYP3A induction on the PK of evogliptin, we conducted a clinical drug–drug interaction study using rifampicin, a strong CYP inducer.
Materials and Methods
Study Design
This study used an open-label, crossover, and one-sequence design. PK assessments were performed in two periods: when a single dose of evogliptin was administered alone (reference period) and when it was co-administered with rifampicin after full induction of CYP enzyme activity by multiple doses of rifampicin (test period) in the same subjects (Figure 2). A 16-day washout period for evogliptin was allowed between the two periods. A 5 mg dose (1 tablet) of evogliptin (Dong-A ST; Seoul, Korea) and a 600 mg dose (1 tablet) of rifampicin (Rifodex, Chong Kun Dang Pharm, Seoul, Korea) were used.
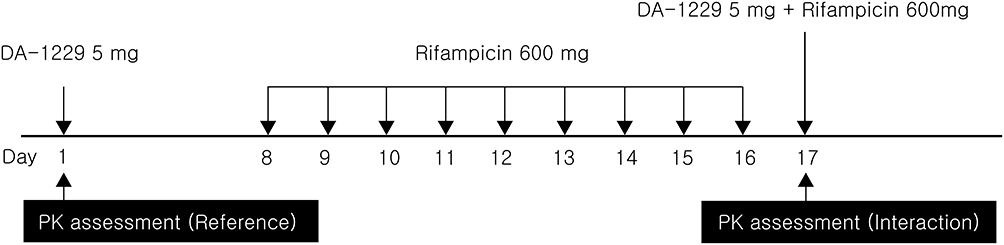 |
Figure 2 Schematic overview of the study design. |
Subjects
This study was approved by the institutional review board (IRB) of the Severance Hospital, Seoul, Korea (CR No: 4–2014-0600). The study was conducted in compliance with related regulations and guidelines, including the Declaration of Helsinki. Written informed consent was obtained from healthy Korean subjects aged 20–55 years, weighing 55 kg or more, and with a body mass index of 18.5–25 kg/m2. During the screening, vital signs (blood pressure, pulse rate, and body temperature) were measured; laboratory analyses (hematology, blood chemistry, urinalysis, urine drug screening, and serological tests) and 12-lead electrocardiography were also performed. Twelve subjects participated in this study. The participants had no significant medical conditions or history relevant to the study participated in this study. None of the patients were taking any medications. The participants were either non-smokers or casual smokers (≤ 10 cigarettes/day) and were prohibited from smoking during the study period.
Procedures
On day −1, all subjects were hospitalized at the Clinical Pharmacology Unit of the Clinical Trials Center at Severance Hospital. After overnight fasting, the subjects were administered a single dose of evogliptin (5 mg) in the morning of day 1 and were discharged after completing PK sampling. The subjects visited the site in the mornings to receive rifampicin (600 mg) once daily on days 8–16 for enzyme induction. They entered the clinical facility again in the afternoon of day 16 and received single doses of evogliptin (5 mg) and rifampicin (600 mg) in the morning of day 17.
PK blood sampling was performed on the day of evogliptin administration (days 1 and 17). An indwelling venous catheter was placed in each subject, and serial blood sampling was performed at the following time points: pre-dose, 0.5, 1, 1.5, 2, 3, 4, 5, 6, 8, 12, 24, 48, 72, and 96 h post-dose.
During the study, participants received standardized meals. Grapefruit intake was prohibited for at least 1 week before the study; caffeine, smoking, and alcohol were prohibited from day −2 until the last PK sampling.
Drug Assay
Blood samples for PK analysis were collected in heparinized tubes. Plasma was separated by centrifugation for 10 min at 3500 rpm and stored at −70 °C. The plasma concentrations of evogliptin and its metabolites (M7 and M8) were measured using liquid chromatography-tandem mass spectrometry (LC-MS/MS) with Prominence UFLC XR (Shimadzu; MD, USA) and API5000 (AB SCIEX; MA, USA). For analysis of evogliptin, 10 μL of internal standard (DA-1229-d9 10 ng/mL) was added to the tube containing 200 μL of plasma sample. After precipitation with 600 μL of acetonitrile, the samples were centrifuged for 5 min at 13,000 rpm. The upper phase was evaporated under nitrogen gas and reconstituted with 100 μL of mobile phase (5 mM ammonium formate:acetonitrile, 70:30). After centrifugation, a 5-μL aliquot was injected into the analytical column. For metabolites, 15 μL of internal standard (DA-1229-M8-d9 80 ng/mL) was added to the tube containing 300 μL of the plasma sample. After precipitation with 1 mL of acetonitrile, the samples were centrifuged for 5 min at 13,000 rpm. The upper phase was evaporated under nitrogen gas and reconstituted with 150 μL mobile phase. After centrifugation under the same conditions, 10 μL aliquots were injected into the analytical column.
The calibration curve ranges for evogliptin and its metabolites were 0.03–30 ng/mL and 0.01–10 ng/mL, respectively; all curves showed linearity (r ≥ 0.9950). In intra/inter-validation, accuracy was within 85–115%, while precision was below 15%.
Pharmacokinetics of Evogliptin
The PK profiles of evogliptin, M7, and M8 were analyzed by a non-compartmental method using Phoenix® WinNonlin® (version 6.3, Pharsight, CA, USA). The peak plasma concentration (Cmax) and Tmax were obtained directly from the data. The slope of the terminal elimination phase (λz) was obtained based on the best-adjusted R-squared with at least three points. The terminal half-life (t1/2) was calculated using the following equation: t1/2 = ln2/λz. The area under the time-concentration curve (AUC) was calculated using the linear trapezoidal rule for the rising phase and the log-linear trapezoidal rule for the descending phase. The AUC was extrapolated to infinity (AUC0-∞) based on the Clast divided by λz, where Clast is the last quantifiable concentration.
Statistical Analysis
The results are presented as mean ± standard deviation (SD) or median (range) in both the text and tables. The main PK variables (Cmax, AUC0-96h, and AUC0-∞) were log-transformed and analyzed. Point estimates of the geometric least-squares mean ratio and 90% confidence intervals of the parameters for the test period to the reference period were calculated. PK data were analyzed using Phoenix® WinNonlin® (version 6.3, Pharsight, CA, USA). Tmax data for the two periods were compared using the Wilcoxon signed-rank test; for the Wilcoxon test, the “wilcox.test” package in R (version 3.2.2, R Foundation for Statistical Computing, Vienna) was used.17,18
Results
Participant demographics are presented in Table 1. Following the inclusion and exclusion criteria for the subjects, 12 subjects were enrolled; 11 subjects completed the study, and their data were analyzed. The subjects included in this analysis were 29.3 ± 5.1 years old (mean ± SD) and weighed 70.1 ± 7.6 kg. In total, 41.6% were smokers, 66.6% were alcohol consumers, and 50% were caffeine consumers. The plasma evogliptin concentration-time curve and those of its metabolites (M7 and M8) are presented in Figure 3. The PK properties of evogliptin and the individual changes between the periods are provided in Table 2 and Figure 4, respectively.
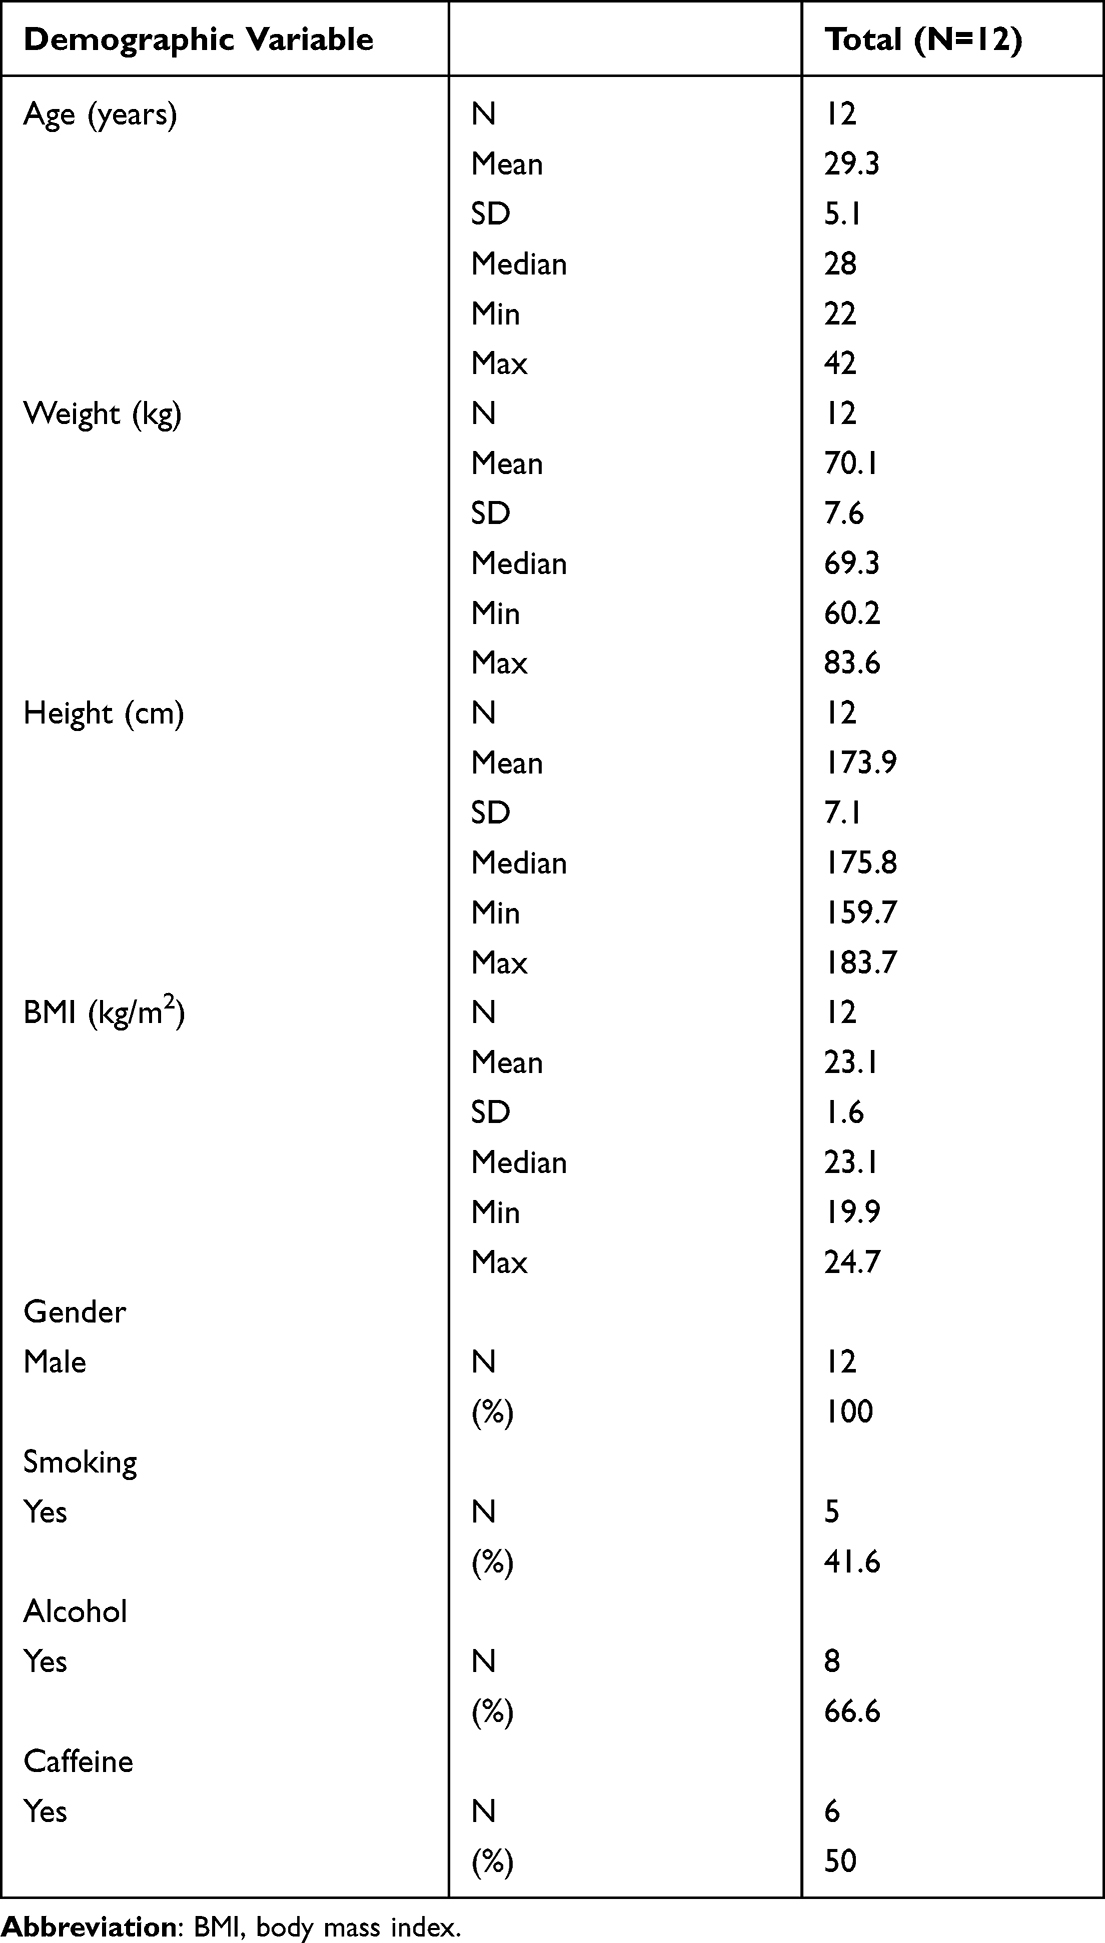 |
Table 1 Demographics and Baseline Characteristics of Study Subjects |
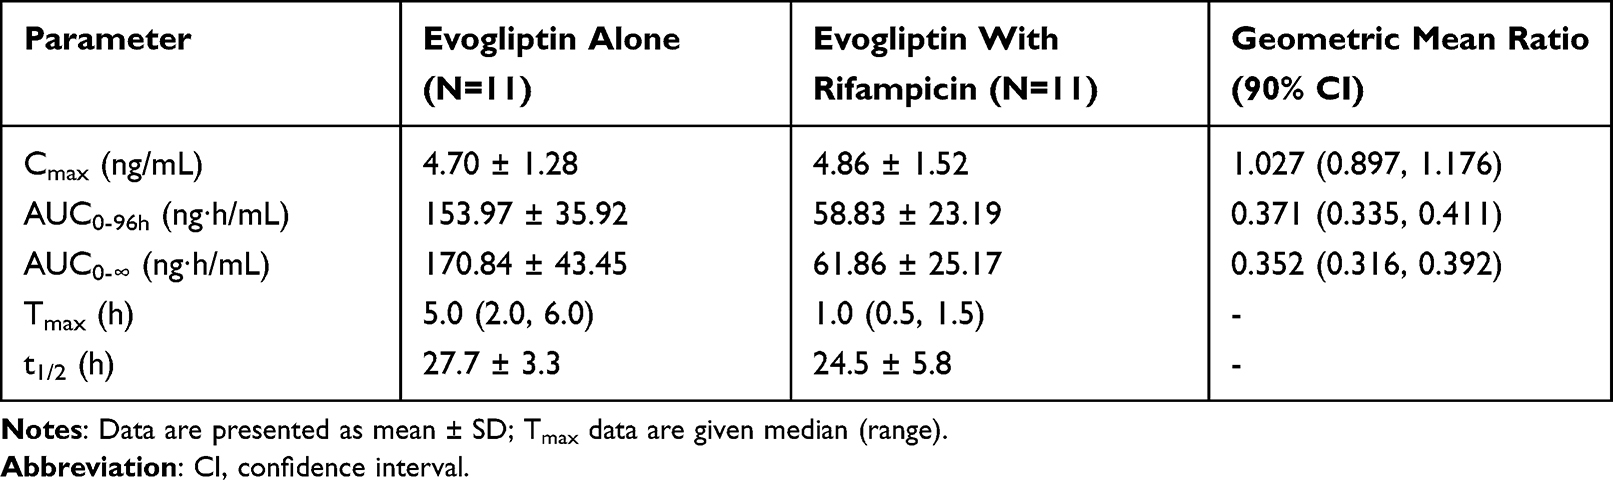 |
Table 2 Pharmacokinetic Parameters and Statistical results of Evogliptin Following Single-Dose Administration of Evogliptin 5 Mg with or Without Rifampicin |
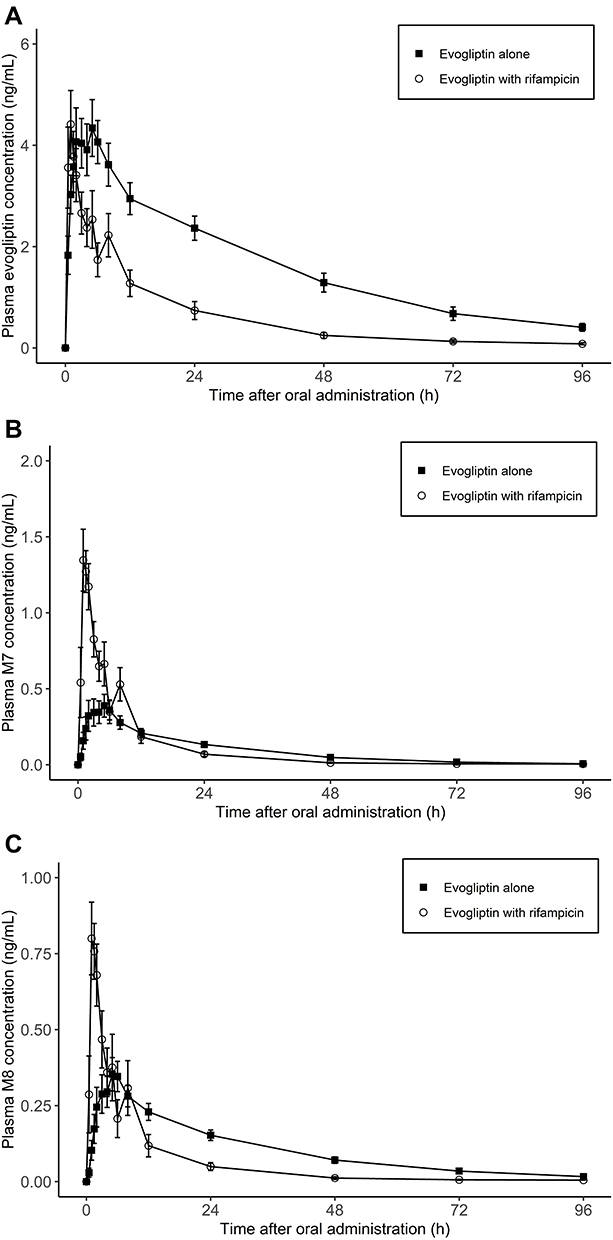 |
Figure 3 Arithmetic mean ± SD values for (A) plasma concentrations of evogliptin and its metabolites (B) M7 and (C) M8 following administration of a single 5 mg dose with or without 600 mg rifampicin. |
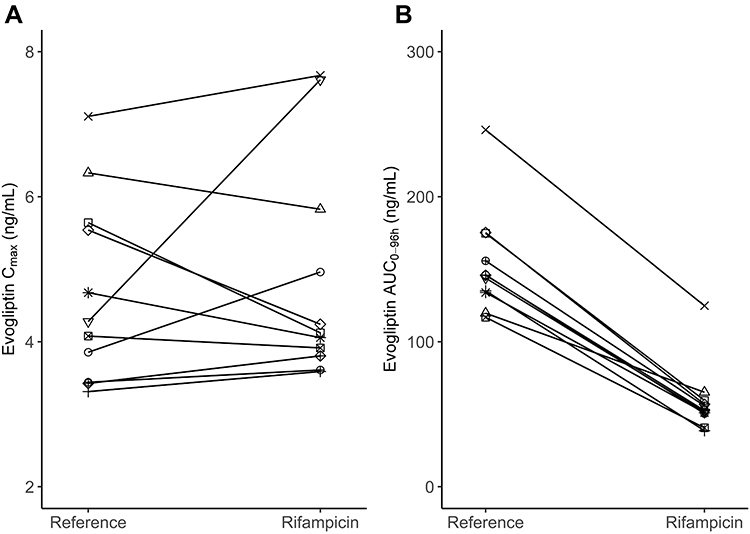 |
Figure 4 Individual evogliptin (A) Cmax and (B) AUC0-96h changes from the period when evogliptin 5 mg was administered alone (Reference) to the period when evogliptin 5 mg was administered with rifampicin 600 mg (Rifampicin). |
There was no significant change in the Cmax of evogliptin between the groups treated with and without rifampicin, 4.70 ng/mL and 4.86 ng/mL, respectively (Table 2). However, the AUC0-96h of evogliptin decreased from 153.97 to 58.83 ng∙h/mL. Individual fluctuations in PK parameters are presented in Figure 4. The median Tmax of evogliptin decreased from 5.0 to 1.0 h in the presence of rifampicin.
As for the metabolites, the mean Cmax of both M7 and M8 increased in the presence of rifampicin; M7, from 0.42 to 1.41 ng/mL; M8, from 0.37 to 0.85 ng/mL. The AUC0-96h result was mixed for the two metabolites; for M7, AUC0-96h increased from 8.38 to 9.42 ng∙h/mL; for M8, AUC0-96h decreased from 9.76 to 5.70 ng∙h/mL.
No difference in safety could be found as the baseline conditions of the subjects before and after the washout time were similar. In the reference and test periods, one subject in each period experienced an adverse event (8.3% and 9.1%, respectively). In the induction phase (administration of rifampin alone), four subjects (36.4%) experienced adverse events (Table 3). Among these, one adverse event (hyperhidrosis) was considered related to rifampicin. All the adverse events were mild and resolved without treatment.
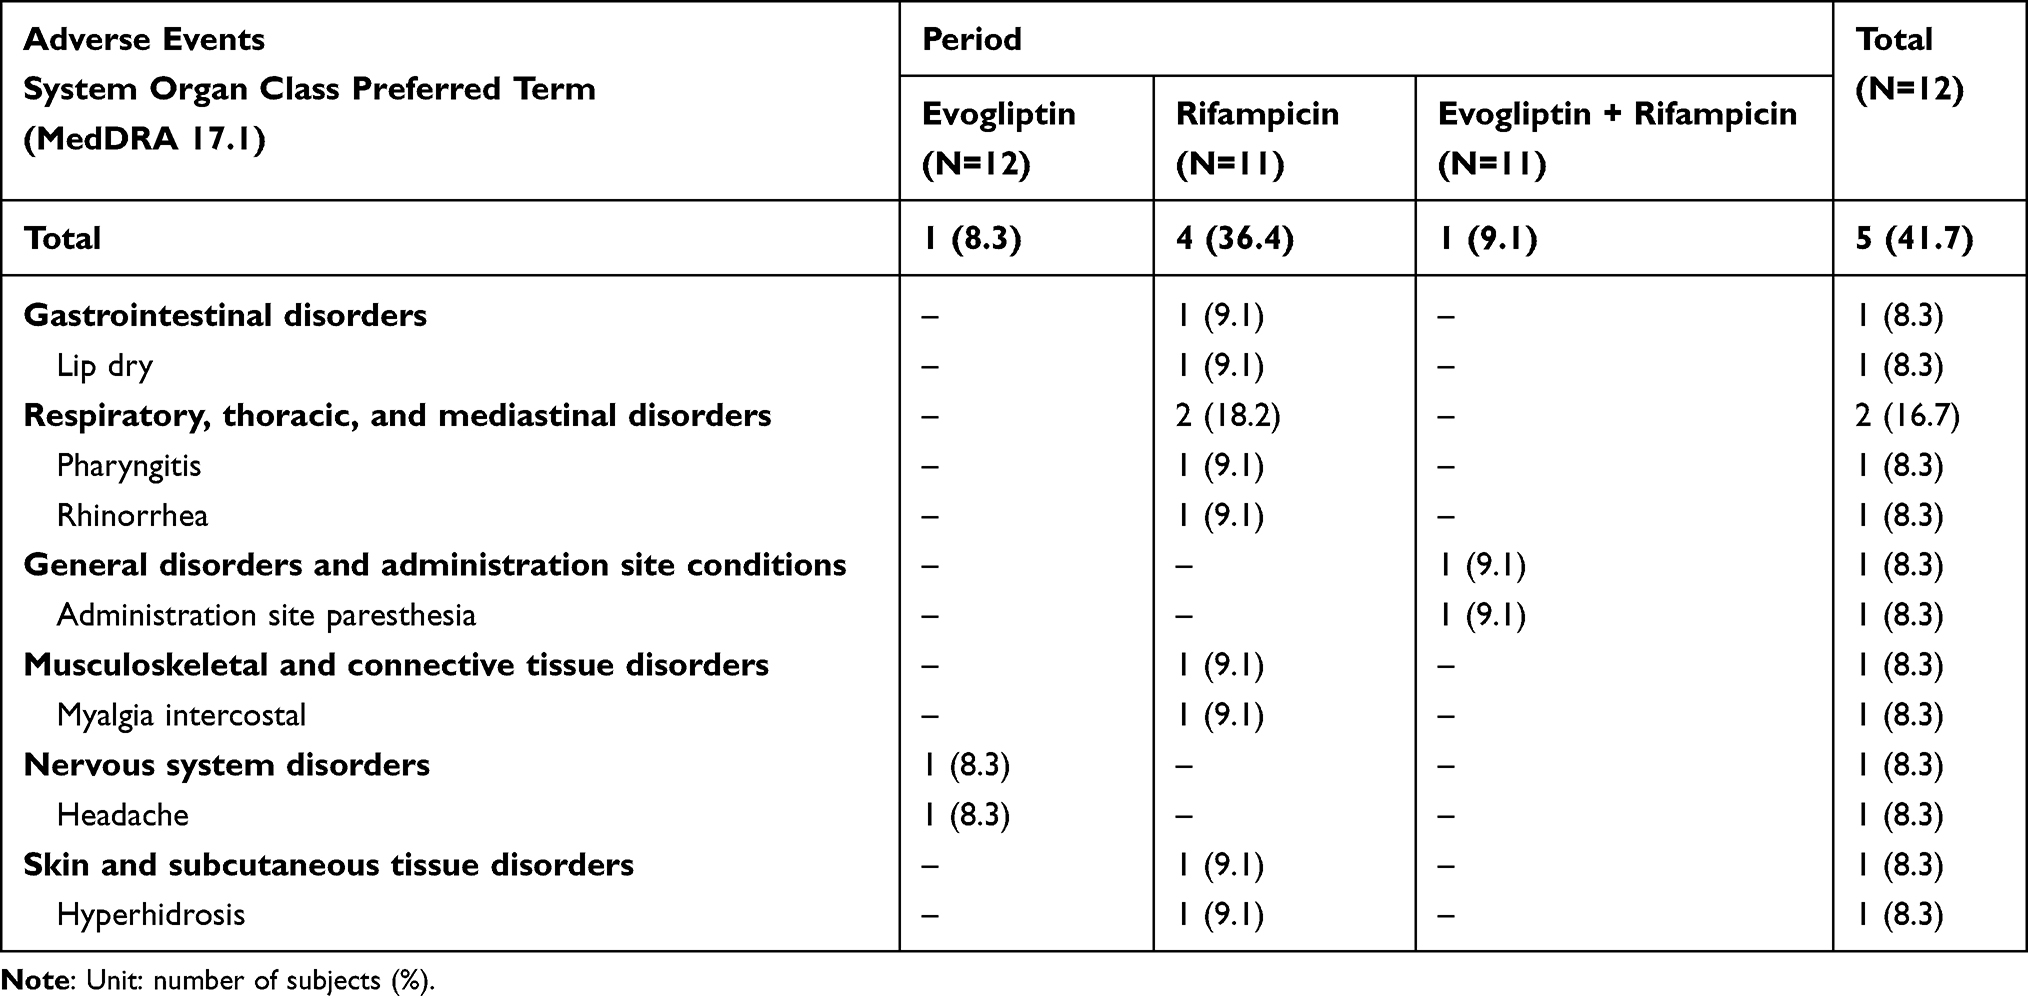 |
Table 3 Summary of Adverse Events |
Discussion
To investigate the interaction between rifampicin and evogliptin, a single-group crossover study was conducted. The design was regarded as appropriate considering the known absorption, distribution, metabolism, and excretion properties of evogliptin and rifampicin, especially CYP3A induction/recovery for rifampicin. Evogliptin is a known substrate of CYP3A and is more rapidly metabolized by the induced CYP3A enzyme. Rifampicin reportedly induces CYP enzyme expression.19,20 Multiple reports have shown that 600 mg of rifampicin administration for 10 days is sufficient to induce CYP enzyme expression.21,22 It has been documented that propranolol concentration reaches a new steady state after daily administration of 600 mg rifampicin for 10 days.21 Another study showed that administrating 600 mg rifampicin doses daily for 7–14 days could increase the clearance of antipyrine up to a maximum.22 In this study, a daily dose of 600 mg of rifampicin was administered for 10 days for maximum induction of the CYP enzyme, aiming to study the full interaction of rifampicin with the study drug. After the last dose of rifampicin was administered together with evogliptin for PK analysis, no additional dose was administered as induced enzyme activity persisted after rifampicin discontinuation, and complete recovery from enzyme induction took up to 3–4 weeks.23
To prevent a carry-over effect, the washout period for evogliptin was set to 16 days, which is five times longer than the t1/2 of evogliptin (32.5–39.8 h).4 The washout period was adequate because none of the subjects had detectable plasma evogliptin levels at pre-dose sampling in the rifampicin period. To minimize the period effect, this study was conducted on healthy volunteers in the same environment, providing the same diet, and found no significant differences in the pre-dose baseline conditions of the individuals. Although the period effect cannot be ruled out, it was negligible.
The presence of rifampicin altered the PK properties of evogliptin. Although rifampicin is well-known as a CYP3A inducer, it also exerts inhibitory effects on certain transporters, including organic anion-transporting polypeptide (OATP),24,25 P-glycoprotein (P-gp),26 and multidrug resistance-associated protein 2 (MRP2).27 P-gp and MRP2 are expressed on the membrane of enterocytes and are involved in the excretion of specific exogenous substances.28,29 The co-administration of rifampicin and evogliptin may result in evogliptin exhibiting Tmax reduction with a constant Cmax; this was likely due to the relationship between absorption and elimination rates. Following the strong induction of CYP3A by rifampicin, the total clearance of evogliptin may be increased, thereby suspected to influence a reduction in exposure (AUC0-96h decreased by 61.8%) and Tmax. Since Cmax is stable, rapid absorption may occur during the absorption period, which is rate-limiting.
The analysis of the two active major metabolites showed that the Cmax of M7 and M8 increased 3.6-fold and 2.3-fold, respectively. However, AUC0-96h values thereof only slightly increased (M7: from 8.38 to 9.42 ng∙h/mL) or decreased (M8: from 9.76 to 5.70 ng∙h/mL). Given the function of the transporters and their potential rifampicin inhibition, an acute dose of rifampicin may have increased the early absorption of evogliptin by blocking P-gp or MRP2, thereby resulting in a significantly increased Cmax of the metabolites in the absorption phase. Considering the nearly 2-fold decrease in the t1/2 of both M7 and M8 in the presence of rifampicin, the disposition of the metabolites could be affected by the induction of enzymes or transporters. An internal qualitative analysis using samples from in vivo studies suggested that the main metabolites, M7 and M8, are glucuronidated to form M14 and transferred by another Phase I metabolism process to form M5, respectively. Therefore, M8 may undergo CYP-mediated metabolism. However, the increased clearance of M7 could not be sufficiently explained by the induction of oxidation/reduction reactions. It has been reported that rifampicin is not only capable of inducing CYP enzymes but is also capable of inducing non-CYP enzymes, including uridine diphosphate glucuronyltransferases (UGTs), by binding to the pregnane X receptor.20 Collectively, the UGT activity induced by rifampicin may have contributed to the increased clearance of M7.
This mechanism also explains the shortened Tmax of evogliptin in the presence of rifampicin. The median (min, max) Tmax values of evogliptin with or without rifampicin were 1.0 h (0.5, 1.5) and 5.0 h (2.0, 6.0), respectively. During the period of rifampicin and evogliptin co-administration, the Tmax of evogliptin significantly decreased (p = 0.0037, Wilcoxon signed-rank test), indicating an increase in the absorption rate. The PK of evogliptin observed during the absorption phase may be mediated by intestinal transporters. Benet et al reported that food could reduce the Tmax of drugs depending on the Biopharmaceutics Drug Disposition Classification System, among which one mechanism could be the inhibition of the efflux cycling in the intestine, thereby decreasing Tmax and increasing drug bioavailability.30 Similarly, blocking intestinal transporters by rifampicin may interfere with efflux cycling, decreasing the Tmax of the affected drugs. Other than P-gp or MRP2, certain transporters are known to cause the efflux of xenobiotics from intestinal enterocytes, such as MRP3 or breast cancer resistance protein.31 Although their interactions with rifampicin are unclear and not clinically proven, they cannot be ruled out. Further studies, including in vitro transporter assays, are needed to investigate the factors contributing to the absorption profile. The decreased t1/2 of evogliptin from 27.7 to 24.5 h is also indicative of enzyme induction. Additionally, the individual differences of t1/2 were increased after rifampicin induction. As a strong PXR agonist, rifampicin has large inter-individual variability inducing CYP3A4 expression in humans.32,33 CYP3A4 mutations are substantially more common across east Asians than in other ethnic groups.34
Similar PK interactions that result in decreased AUC without significant changes in the Cmax of drugs in the presence of rifampicin have been reported. Rifampicin decreased the AUC0-96h of both pioglitazone and moxifloxacin without significantly affecting the Cmax of each drug being observed.35,36 Moreover, the formation of pioglitazone metabolites during the absorption phase was more rapid, with a shorter Tmax.
Although this study involved only a small number of participants and clinical experience in larger populations would yield a more conclusive result, all adverse events observed in the study were mild and were not altered by co-administration of evogliptin with rifampicin. Additionally, enzyme induction by rifampicin is likely to be modest, as there was only a slight change observed in the total amount of the parent drug and its metabolites.
Conclusion
In conclusion, rifampicin moderately decreased the plasma AUC of evogliptin, most likely via CYP3A induction. However, no significant change in plasma Cmax of evogliptin was observed. The adverse events, none of which were serious, were not significantly altered by the concomitant administration of evogliptin and rifampicin. Nevertheless, evogliptin dosing should be carefully considered when co-administered with CYP3A inducers.
Data Sharing Statement
The data that support the findings of this study are not available due to confidentiality.
Funding
This study was funded by Dong-A ST Co., Ltd., Seoul, Korea. The sponsor did not play a major role in the study design or data analysis.
Disclosure
None of the authors have any conflicts of interest to declare for this work.
References
1. Kieffer TJ, Habener JF. The glucagon-like peptides. Endocr Rev. 1999;20(6):876–913. doi:10.1210/edrv.20.6.0385
2. Vilsboll T, Holst JJ. Incretins, insulin secretion and Type 2 diabetes mellitus. Diabetologia. 2004;47(3):357–366. doi:10.1007/s00125-004-1342-6
3. Kim MK, Chae YN, Kim HD, et al. DA-1229, a novel and potent DPP4 inhibitor, improves insulin resistance and delays the onset of diabetes. Life Sci. 2012;90(1–2):21–29. doi:10.1016/j.lfs.2011.10.007
4. Kim TE, Lim KS, Park MK, et al. Evaluation of the pharmacokinetics, food effect, pharmacodynamics, and tolerability of DA-1229, a dipeptidyl peptidase IV inhibitor, in healthy volunteers: first-in-human study. Clin Ther. 2012;34(9):1986–1998. doi:10.1016/j.clinthera.2012.08.006
5. Gu N, Park MK, Kim TE, et al. Multiple-dose pharmacokinetics and pharmacodynamics of evogliptin (DA-1229), a novel dipeptidyl peptidase IV inhibitor, in healthy volunteers. Drug Des Devel Ther. 2014;8:1709–1721. doi:10.2147/DDDT.S65678
6. Song JS, Lee DY, Shim H, et al. A Phase I, open-label, 2-part study to establish absolute bioavailability and the absorption, metabolism and excretion of evogliptin in healthy male subjects by a light-label approach. Drug Metab Pharmacokinet. 2017;32(1):S78–S78. doi:10.1016/j.dmpk.2016.10.307
7. Jung CH, Park CY, Ahn KJ, et al. A randomized, double-blind, placebo-controlled, Phase II clinical trial to investigate the efficacy and safety of oral DA-1229 in patients with type 2 diabetes mellitus who have inadequate glycaemic control with diet and exercise. Diabetes Metab Res Rev. 2015;31(3):295–306. doi:10.1002/dmrr.2613
8. American Diabetes A. Standards of medical care in diabetes-2015 abridged for primary care providers. Clin Diabetes. 2015;33(2):97–111. doi:10.2337/diaclin.33.2.97
9. Luzuriaga M, Leite R, Ahmed H, Saab PG, Garg R. Complexity of antidiabetic medication regimen is associated with increased diabetes-related distress in persons with type 2 diabetes mellitus. BMJ Open Diabetes Res Care. 2021;9:1. doi:10.1136/bmjdrc-2021-002348
10. Jeong HU, Kim JH, Lee DY, Shim HJ, Lee HS. In vitro metabolic pathways of the new anti-diabetic drug evogliptin in human liver preparations. Molecules. 2015;20(12):21802–21815. doi:10.3390/molecules201219808
11. Hong T, Jin BH, Kim CO, et al. Pharmacokinetics and safety of evogliptin in hepatically impaired patients. Br J Clin Pharmacol. 2021;87(7):2757–2766. doi:10.1111/bcp.14680
12. Hukkanen J. Induction of cytochrome P450 enzymes: a view on human in vivo findings. Expert Rev Clin Pharmacol. 2012;5(5):569–585. doi:10.1586/ecp.12.39
13. Murray M. Role of CYP pharmacogenetics and drug-drug interactions in the efficacy and safety of atypical and other antipsychotic agents. J Pharm Pharmacol. 2006;58(7):871–885. doi:10.1211/jpp.58.7.0001
14. FDA. Guidance for industry: drug interaction studies —study design, data analysis, implications for dosing, and labeling recommendations; 2012.
15. EMA. Guideline on the investigation of drug interactions; 2012.
16. Saito Y, Hisaka A, Kume T, et al. Drug interaction guideline for drug development and labeling recommendations: final draft of Japanese new guideline. Drug Metab Rev. 2015;47:118–119. doi:10.1016/j.dmpk.2019.11.009
17. Hollander M, Wolfe DA. Nonparametric Statistical Methods.
18. Team. RC. R: A Language and Environment for Statistical Computing. Vienna, Austria: R Foundation for Statistical Computing; 2021.
19. Venkatesan K. Pharmacokinetic drug interactions with rifampicin. Clin Pharmacokinet. 1992;22(1):47–65. doi:10.2165/00003088-199222010-00005
20. Chen J, Raymond K. Roles of rifampicin in drug-drug interactions: underlying molecular mechanisms involving the nuclear pregnane X receptor. Ann Clin Microbiol Antimicrob. 2006;5:3. doi:10.1186/1476-0711-5-3
21. Herman RJ, Nakamura K, Wilkinson GR, Wood AJJ. Induction of propranolol metabolism in man by rifampicin. Pharmacologist. 1982;24:181. doi:10.1111/j.1365-2125.1983.tb02218.x
22. Ohnhaus EE, Breckenridge AM, Park BK. Urinary excretion of 6 beta-hydroxycortisol and the time course measurement of enzyme induction in man. Eur J Clin Pharmacol. 1989;36(1):39–46. doi:10.1007/BF00561021
23. Herman RJ, Nakamura K, Wilkinson GR, Wood AJ. Induction of propranolol metabolism by rifampicin. Br J Clin Pharmacol. 1983;16(5):565–569. doi:10.1111/j.1365-2125.1983.tb02218.x
24. Roth M, Obaidat A, Hagenbuch B. OATPs, OATs and OCTs: the organic anion and cation transporters of the SLCO and SLC22A gene superfamilies. Br J Pharmacol. 2012;165(5):1260–1287. doi:10.1111/j.1476-5381.2011.01724.x
25. Lau YY, Huang Y, Frassetto L, Benet LZ. Effect of OATP1B transporter inhibition on the pharmacokinetics of atorvastatin in healthy volunteers. Clin Pharmacol Ther. 2007;81(2):194–204. doi:10.1038/sj.clpt.6100038
26. Reitman ML, Chu X, Cai X, et al. Rifampin’s acute inhibitory and chronic inductive drug interactions: experimental and model-based approaches to drug-drug interaction trial design. Clin Pharmacol Ther. 2011;89(2):234–242. doi:10.1038/clpt.2010.271
27. Shingaki T, Takashima T, Ijuin R, et al. Evaluation of Oatp and Mrp2 activities in hepatobiliary excretion using newly developed positron emission tomography tracer [11C]dehydropravastatin in rats. J Pharmacol Exp Ther. 2013;347(1):193–202. doi:10.1124/jpet.113.206425
28. Thiebaut F, Tsuruo T, Hamada H, Gottesman MM, Pastan I, Willingham MC. Cellular localization of the multidrug-resistance gene product P-glycoprotein in normal human tissues. Proc Natl Acad Sci U S A. 1987;84(21):7735–7738. doi:10.1073/pnas.84.21.773
29. Schaub TP, Kartenbeck J, Konig J, et al. Expression of the MRP2 gene-encoded conjugate export pump in human kidney proximal tubules and in renal cell carcinoma. J Am Soc Nephrol. 1999;10(6):1159–1169. doi:10.1681/ASN.V1061159
30. Custodio JM, Wu CY, Benet LZ. Predicting drug disposition, absorption/elimination/transporter interplay and the role of food on drug absorption. Adv Drug Deliv Rev. 2008;60(6):717–733. doi:10.1016/j.addr.2007.08.043
31. Giacomini KM, Huang SM, Tweedie DJ, et al. Membrane transporters in drug development. Nat Rev Drug Discov. 2010;9(3):215–236. doi:10.1038/nrd3028
32. Kolars JC, Schmiedlinren P, Schuetz JD, Fang C, Watkins PB. Identification of rifampin-inducible P450iiia4 (Cyp3a4) in human small-bowel enterocytes. J Clin Invest. 1992;90(5):1871–1878. doi:10.1172/Jci116064
33. Watkins PB, Murray SA, Winkelman LG, Heuman DM, Wrighton SA, Guzelian PS. Erythromycin breath test as an assay of glucocorticoid-inducible liver cytochromes P-450 - studies in rats and patients. J Clin Invest. 1989;83(2):688–697. doi:10.1172/Jci113933
34. Guttman Y, Nudel A, Kerem Z. Polymorphism in Cytochrome P450 3A4 Is Ethnicity Related. Front Genet. 2019;10. doi:10.3389/fgene.2019.00224
35. Weiner M, Burman W, Luo CC, et al. Effects of rifampin and multidrug resistance gene polymorphism on concentrations of moxifloxacin. Antimicrob Agents Chemother. 2007;51(8):2861–2866. doi:10.1128/AAC.01621-06
36. Jaakkola T, Backman JT, Neuvonen M, Laitila J, Neuvonen PJ. Effect of rifampicin on the pharmacokinetics of pioglitazone. Br J Clin Pharmacol. 2006;61(1):70–78. doi:10.1111/j.1365-2125.2005.02515.x
37. Oh ES, Choi C, Kim CO, et al. Effects of clarithromycin on the pharmacokinetics of evogliptin in healthy volunteers. J Clin Pharm Ther. 2017;42(6):689–694. doi:10.1111/jcpt.12604
 © 2022 The Author(s). This work is published and licensed by Dove Medical Press Limited. The full terms of this license are available at https://www.dovepress.com/terms.php and incorporate the Creative Commons Attribution - Non Commercial (unported, v3.0) License.
By accessing the work you hereby accept the Terms. Non-commercial uses of the work are permitted without any further permission from Dove Medical Press Limited, provided the work is properly attributed. For permission for commercial use of this work, please see paragraphs 4.2 and 5 of our Terms.
© 2022 The Author(s). This work is published and licensed by Dove Medical Press Limited. The full terms of this license are available at https://www.dovepress.com/terms.php and incorporate the Creative Commons Attribution - Non Commercial (unported, v3.0) License.
By accessing the work you hereby accept the Terms. Non-commercial uses of the work are permitted without any further permission from Dove Medical Press Limited, provided the work is properly attributed. For permission for commercial use of this work, please see paragraphs 4.2 and 5 of our Terms.