")
Back to Journals » Drug Design, Development and Therapy » Volume 8
Effect of renal function on the pharmacokinetics of fimasartan: a single-dose, open-label, Phase I study
Authors Kim S , Lee J, Shin D, Lim KS, Kim YS, Jang I , Yu K
Received 3 June 2014
Accepted for publication 27 June 2014
Published 6 October 2014 Volume 2014:8 Pages 1723—1731
DOI https://doi.org/10.2147/DDDT.S68784
Checked for plagiarism Yes
Review by Single anonymous peer review
Peer reviewer comments 5
Seokuee Kim,1 Jongtae Lee,1 Donghoon Shin,1 Kyoung Soo Lim,1 Yon Su Kim,2 In-Jin Jang,1 Kyung-Sang Yu1
1Department of Clinical Pharmacology and Therapeutics, 2Division of Nephrology, Department of Internal Medicine, Seoul National University College of Medicine and Hospital, Seoul, Korea
Background: Fimasartan is a novel angiotensin II receptor blocker. Fimasartan is mainly eliminated via biliary excretion, and its urinary elimination is less than 3%.
Objective: Based on guidance from the United States Food and Drug Administration, a reduced pharmacokinetic (PK) study was conducted to evaluate the effect of renal function on the PK of fimasartan in patients with renal impairment and healthy volunteers.
Methods: A single centre, single-dose, open-label, healthy volunteer controlled trial was conducted in patients with renal impairment (RI) (estimated glomerular filtration rate lower than 30 mL/min/1.73 m2) and age-, weight- and sex-matched healthy volunteers (estimated glomerular filtration rate higher than 90 mL/min/1.73 m2). All participants received a single oral dose of fimasartan 120 mg, after which serial blood sampling for PK evaluation was conducted. Noncompartmental PK analysis of fimasartan was performed. A mixed-effects model approach was used to identify significant covariates and PK parameters.
Results: Sixteen subjects were enrolled (8 healthy volunteers and 8 RI patients). The maximum plasma concentrations and areas under the plasma concentration curves of the RI patients were higher than those of the healthy volunteers, with geometric mean ratios of 1.87 and 1.73, respectively. The relative bioavailability of fimasartan from the population PK analysis was 77% higher in the RI patients than in the healthy volunteers.
Conclusion: The increased drug exposure of fimasartan in RI patients was explained by the increased relative bioavailability. This result can be explained from our knowledge concerning alterations in PK related to renal function.
Keywords: renal impairment, fimasartan, pharmacokinetics, safety
Introduction
Hypertension is an important worldwide public health challenge. Hypertension affects approximately 25% of the adult population worldwide, and its prevalence is predicted to increase by 60% by 2025 when a total of 1.56 billion people may be affected.1 In South Korea, the estimated age-adjusted prevalence of hypertension and prehypertension is 22.9%.2 Hypertension is a risk factor for cardiovascular disease and is responsible for many deaths worldwide.3 In public health, the goal of antihypertensive therapy is to reduce cardiovascular and renal morbidity and mortality.4 In the absence of a specific indication, there are five main classes of antihypertensive drugs that are used for initial monotherapy: thiazide diuretics, beta-blockers, calcium channel blockers, angiotensin-converting enzyme (ACE) inhibitors, and angiotensin II receptor blockers (ARBs).5
Fimasartan (Kanarb®, fimasartan potassium; Boryung Pharmaceutical Co., Ltd., Seoul, Korea) is a novel ARB that has been shown to exert its effects predominantly through blockade of the angiotensin II type I receptor. It was developed to treat patients with essential hypertension and was approved by the Korea Ministry of Food and Drug Safety in September 2010. Regarding the renoprotective properties of ARBs,6 fimasartan may be a good treatment option for hypertensive patients with chronic kidney disease.
Recent guidelines from the US Food and Drug Administration (FDA) suggest that a pharmacokinetic (PK) study should be conducted in patients with impaired renal function when the drug is likely to be used in such patients and when renal impairment (RI) is expected to mechanistically alter the PK of the drug and/or its active metabolites.7 Fimasartan is mainly eliminated via biliary excretion, and its urinary elimination is less than 3%.8 The FDA has proposed that drugs eliminated predominantly by nonrenal processes should be evaluated through a reduced PK study in patients with end-stage renal disease who are not yet on dialysis.7 Based on the guidance from the FDA, we conducted a reduced PK study of fimasartan in both end-stage renal disease patients not yet on dialysis and healthy volunteers (the control group with normal renal function). The aim of this study was to evaluate the effect of renal function on the PK of fimasartan in a noncompartmental and a nonlinear mixed-effects model.
Materials and methods
Study design
This study (ClinicalTrials.gov identifier: NCT01148368) was conducted in accordance with the International Conference on Harmonization guidelines for Good Clinical Practice and the ethical principles that have their origins in the Declaration of Helsinki. The study protocol was reviewed and approved by the Institutional Review Board of Seoul National University Hospital and the health authorities from the Ministry of Food and Drug Safety of South Korea. This single centre, single-dose, open-label, healthy volunteer controlled trial was conducted in severe RI patients not yet on dialysis and age-, weight- and sex-matched healthy volunteers. The healthy volunteers had normal renal function with an estimated glomerular filtration rate (eGFR) higher than 90 mL/min/1.73 m2, and the patients in the RI group had severe RI with an eGFR lower than 30 mL/min/1.73 m2, not yet on dialysis. For this study, the eGFR was calculated using the Modification of Diet in Renal Disease formulation.9 Based on former PK studies on fimasartan, 120 mg tablet of fimasartan was used in this study.8,10–13
Study participants
A total of 16 subjects (8 healthy subjects and 8 RI patients) provided their written informed consent to participate in this study. The subjects in both groups were all matched in age, sex, body weight, height and body mass index. The subjects in the healthy volunteer group had no diseases or disorders, while those in the RI group did not have any significant medical problems other than the RI or related conditions, such as hypertension. Their medical history, physical examination, electrocardiography (ECG), and clinical laboratory tests were assessed in the screening examinations that were performed within 3 weeks prior to the administration of the study drug. Neither the healthy volunteers nor the RI patients were allowed to administer concomitant medications during the study period. The RI patients were asked to stop their medications based on the respective half-life of each drug. However, for safety, the RI patients were allowed to take amlodipine until 1 day prior to the administration of the study drug, because there were no clinically relevant pharmacokinetic interactions between fimasartan and amlodipine.13 Patients’ medication was allowed to be restarted beginning 48 hours after the administration of the study drug.
Monitoring and blood sampling
The participants’ vital signs, 12-lead ECGs, clinical laboratory tests, adverse events checks, and physical examinations were assessed during the study. Based on the PK properties of fimasartan described previously,8 approximately 4 mL of blood was drawn from each participant for PK analysis; the samples were obtained in heparinised tubes from predose to 48 hours postdose. The PK samples were centrifuged immediately, and the plasma samples were stored in freezers at temperatures below −70°C.
Determination of fimasartan
Plasma fimasartan concentrations were determined using a validated liquid chromatography-tandem mass spectrometry method. The standards for fimasartan and the internal standard BR-A-563 were provided by Boryung Pharmaceutical Co., Ltd., (Seoul, Korea). BR-A-563 was separated using high-performance liquid chromatography (HPLC; Agilent 1,200 series, Agilent Technologies, Inc., Santa Clara, California) and detected by MS/MS (API 3,200 Quadruple; Applied Biosystems, Applied Biosystems/MDS-Sciex, Toronto, Canada) using a method described previously.14 The lower limit of quantification for fimasartan was 0.5 ng/mL, and the standard calibration curves were linear over the range from 0.5 to 500 ng/mL (coefficient of determination, R2≥0.997). The inter-batch precision and accuracy ranged from 1.910% to 8.106% and from 96.97% to 103.2%, respectively.
Pharmacokinetic evaluation
Noncompartmental pharmacokinetic analysis of fimasartan was performed using WinNonlin (Version 6.3.0; Pharsight Corporation, CA, USA). The actual times at which the blood samples were obtained were used in the PK analysis. The values of the maximum plasma concentration of fimasartan (Cmax) and the time to reach Cmax (tmax) were directly obtained from the observed data. The area under the plasma concentration curve (AUC) from time 0 to infinity (AUCinf) and the AUC from time 0 to the last detectable time point (AUClast) were estimated using the linear-up/log-down rule. The apparent clearance (CL/F) was calculated by dividing the dosage amount by AUCinf. To determine the terminal elimination rate constant (ke), fittings for terminal slopes started from three points including the last concentration and gradually adding the earlier time points in regression until the adjusted R2 reached the maximum. The terminal elimination half-life (t1/2) was calculated as ln(2)/ke.
Statistical analysis
The statistical analysis was carried out using SPSS (Version 21.0; SPSS Inc., Chicago, IL, USA). Arithmetic means and standard deviations (SDs), medians, and the minimum and maximum values for continuous data and the absolute and relative frequencies for categorical data were calculated. After conduction of the Shapiro–Wilk test, the PK parameters (Cmax, AUClast, CL/F and ke) were analysed using an independent t-test. The systemic exposures of fimasartan were presented as the ratios and 90% confidence intervals (CIs) of the geometric means between both groups.
Modelling and simulation
Nonlinear mixed-effects modelling (NONMEM®, version 7.2; ICON, Hanover MD, USA) was used for the population PK analysis. The parameter estimates were obtained using first-order conditional estimation with interaction. The interindividual variability of each parameter was applied exponentially:
Pi = θi·exp(ηi), | (1) |
where Pi is the ith individual parameter, such as clearance (CL), volume of central compartment (Vc), absorption rate constant (Ka), volume of peripheral compartment (Vp), intercompartmental clearance (Q) and relative bioavailability (F1). Additionally, θi is the typical value of the ith population parameter, and ηi is a random variable assumed to follow a Gaussian distribution with a mean of 0 and variance of ω2. Based on first-order elimination, a one- or two-compartment distribution model was tested. The models were selected based on a decrease in the objective function value (OFV) by 3.84 (alpha =0.05, degrees of freedom =1) or 5.99 (alpha =0.05, degrees of freedom =2) in approximate χ2 distribution. Several criteria measures of model stability and adequacy (condition number, successful convergence, significant digits, and matrix singularity) were considered.
Covariate model building was performed in a stepwise fashion with forward inclusion and backward deletion based upon model selection criteria, as defined previously. Continuous variables such as age, height, weight, eGFR, and laboratory test levels (eg, blood urea nitrogen, creatinine, albumin, aspartate transaminase, alanine transaminase, alkaline phosphatase, total cholesterol, total protein, albumin, and uric acid) and categorical variables such as sex and study group (GRP) were evaluated as covariates. The F1 for a healthy subject was estimated by fixing F1 to 1 for RI patients. The equation for F1 was as follows:
F1 = θ6^GRP, | (2) |
where GRP is one for healthy volunteers and is 0 for RI patients.
To evaluate the stability and robustness of the final PK model, the bootstrap resampling method was performed; by resampling with replacement, 1,000 bootstrap data sets were generated. The final population PK model was fitted repeatedly to each of them. The 2.5th and 97.5th percentiles of the mean population PK parameters were regarded as the lower and upper 95% confidence interval (CI) limits, respectively. Visual predictive checks were performed by simulated concentrations of 1,000 virtual datasets (nsub =1,000 in the $SIMULATION block) from the final model. Curves for the 5th, 50th, and 95th percentiles of concentrations were overlaid on the observed concentrations stratified by GRP.
Results
Demographics
All 16 subjects completed the study. Both groups had two men and six women in each. There was no significant difference between groups with regard to age, body weight, height, and body mass index, but not with regard to eGFR (Table 1). During the trial, RI patients discontinued their medication as described in the Materials and methods section. Comorbidities in RI patients are summarized in Table 2.
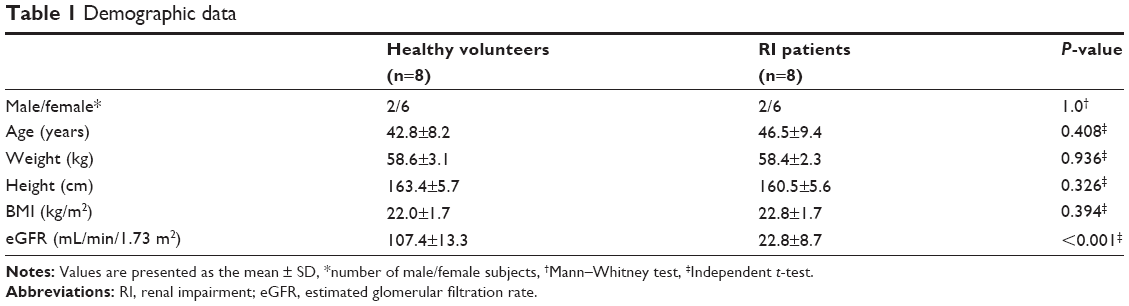 | Table 1 Demographic data |
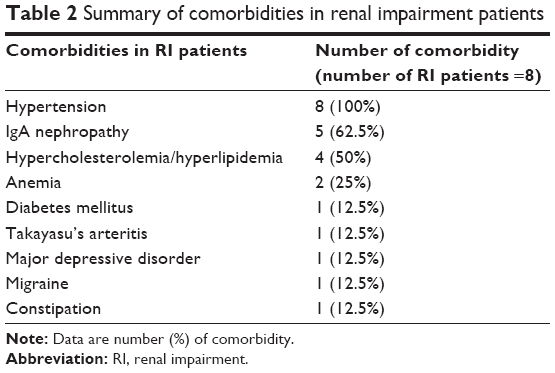 | Table 2 Summary of comorbidities in renal impairment patients |
Safety
A single 120 mg oral dose of fimasartan was well tolerated in both groups. There were no serious adverse events and no withdrawals due to adverse events. Although there were no clinically significant changes in laboratory test levels, ECGs, or vital signs in either group, there were six treatment-related adverse events in the healthy group and four treatment-related adverse events in the RI patient group (Table 3). However, all of the treatment-related adverse events were resolved without any treatment.
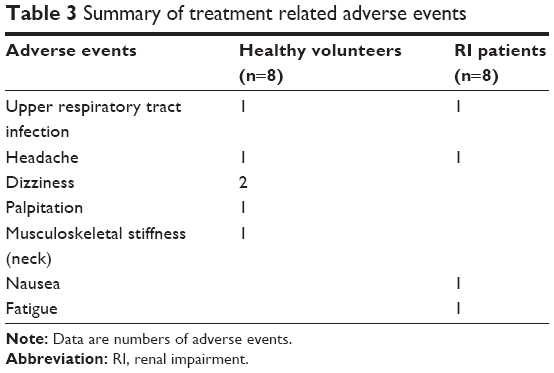 | Table 3 Summary of treatment related adverse events |
Noncompartmental pharmacokinetic analysis
Fimasartan was rapidly absorbed after a single oral dose of 120 mg, with similar concentration-time profiles between the two groups (Figure 1). The tmax and t1/2 were comparable in both groups. The mean values for Cmax and AUClast in the RI patients were higher than those of the healthy volunteers, with geometric mean ratios of 1.87 and 1.73, respectively (Table 4). On the contrary, the RI patient group had lower mean values for CL/F than the group with normal renal function.
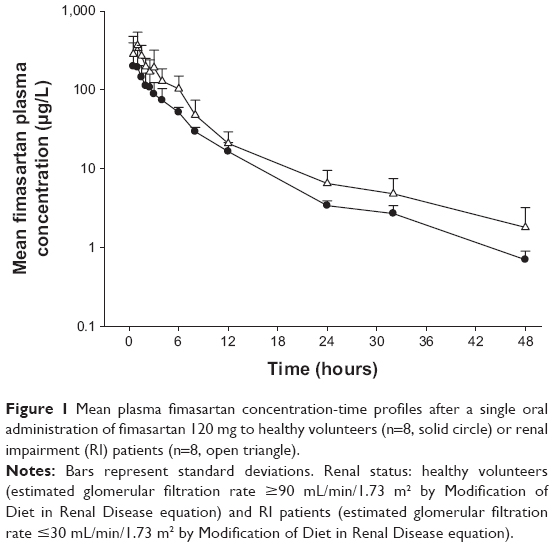 | Figure 1 Mean plasma fimasartan concentration-time profiles after a single oral administration of fimasartan 120 mg to healthy volunteers (n=8, solid circle) or renal impairment (RI) patients (n=8, open triangle). |
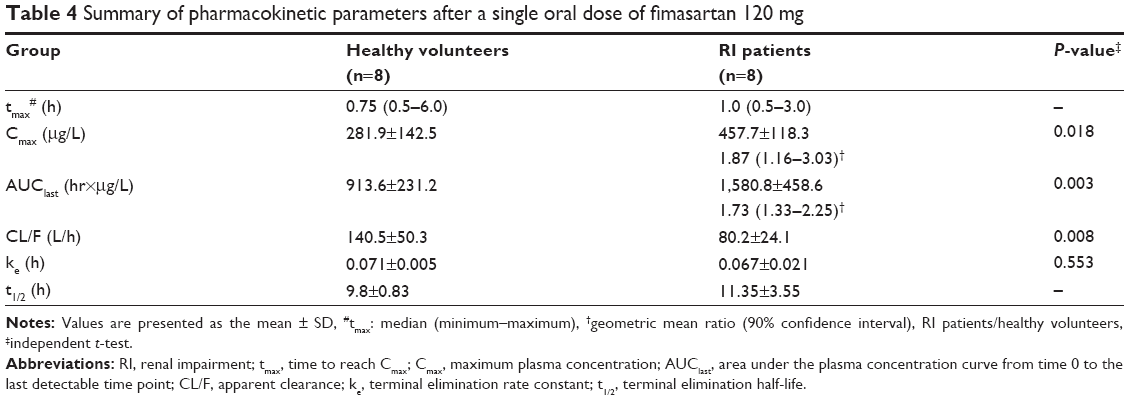 | Table 4 Summary of pharmacokinetic parameters after a single oral dose of fimasartan 120 mg |
There was a correlation between eGFR and Cmax, AUClast and CL/F. No significant correlation was observed between eGFR and the terminal elimination rate constant (Table 4 and Figure 2).
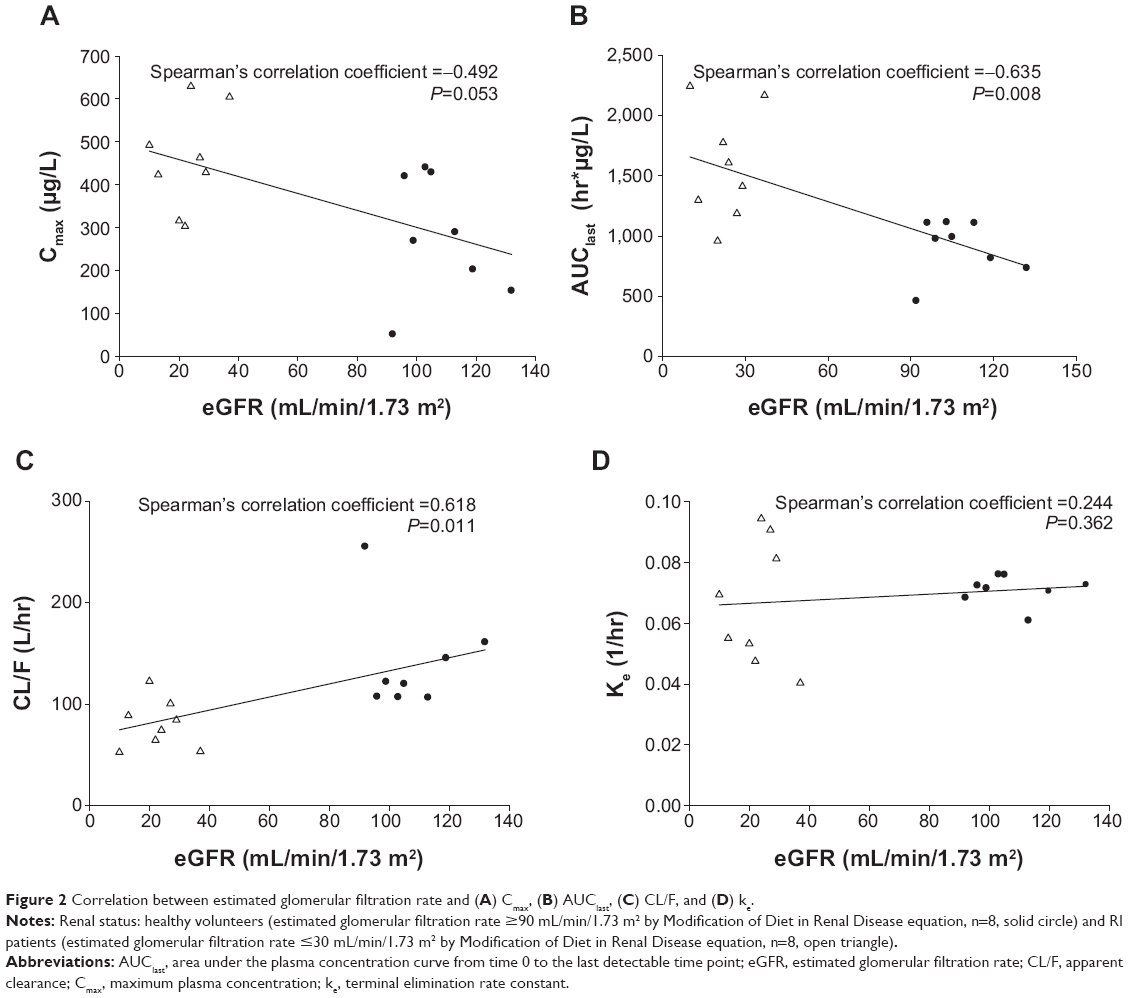 | Figure 2 Correlation between estimated glomerular filtration rate and (A) Cmax, (B) AUClast, (C) CL/F, and (D) ke. |
Modelling and simulation
A two-compartment first-order elimination model best described the PK of fimasartan. After the basic model was established, the covariates of the relevant PK parameters were explored. The covariate that explained the difference in the systemic exposure of fimasartan was GRP on the F1 of fimasartan (Figure 3).
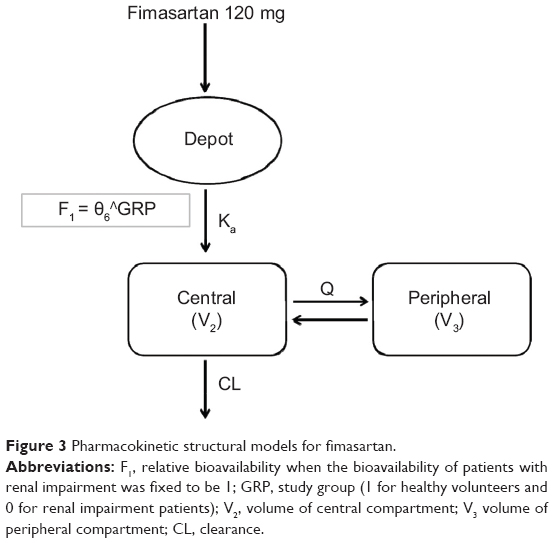 | Figure 3 Pharmacokinetic structural models for fimasartan. |
The population PK parameter estimates and bootstrap results are summarized in Table 5. The F1 for healthy subjects was 0.566 when the bioavailability of RI patients was fixed to be 1. The relative bioavailability of fimasartan was 77% higher in RI patients than in healthy volunteers.
 | Table 5 Final estimates of population pharmacokinetic parameters |
The basic goodness-of-fit plots for the final PK model are displayed in Figure 4 and demonstrated that individual predicted fimasartan concentrations corresponded well to observations without systemic bias. The median parameter estimates and 95% confidence intervals from bootstrap replications (n=1,000) are summarized in Table 5. The median parameter estimates from the bootstrap method were similar to the estimates of the final PK model. Visual predictive checks of the final population PK model are presented in Figure 5 and stratified by GRP. The model-predicted confidence intervals and medians corresponded well to the observed data.
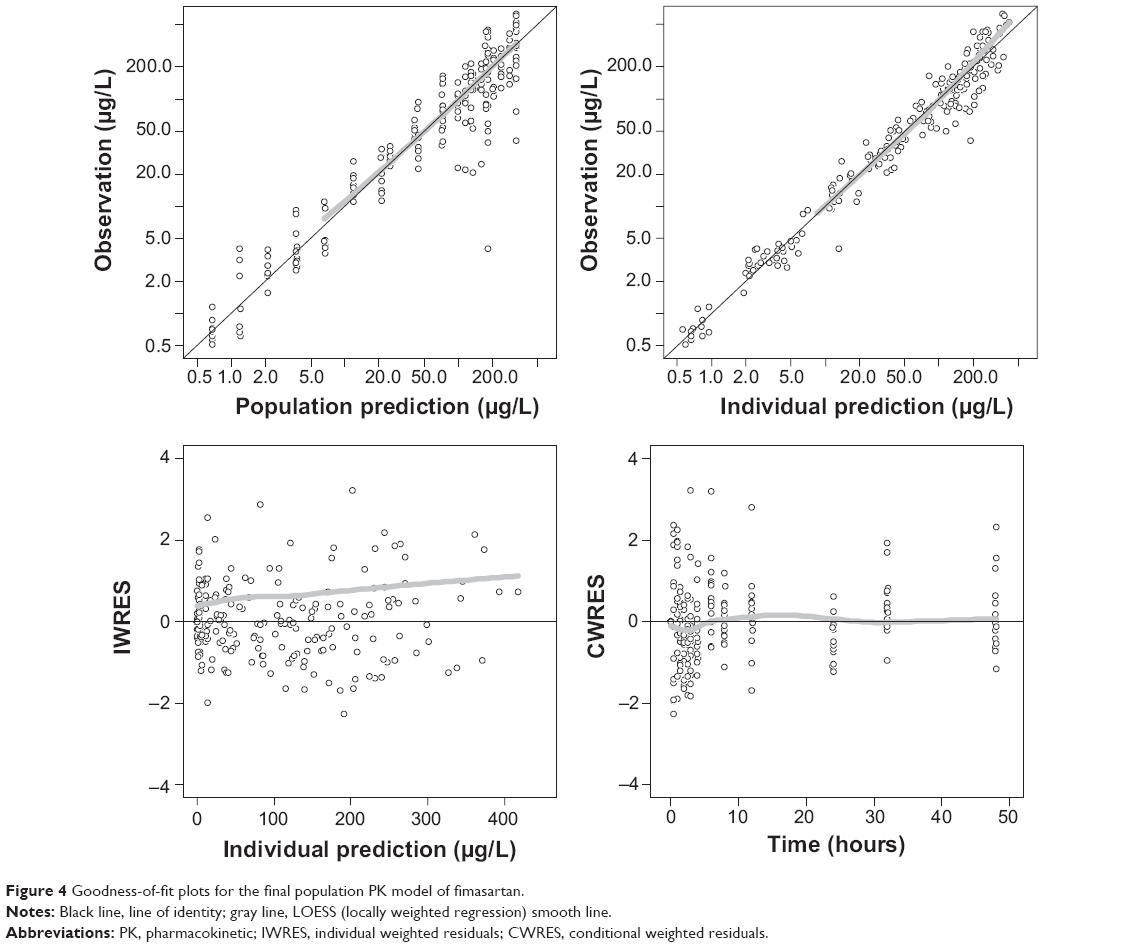 | Figure 4 Goodness-of-fit plots for the final population PK model of fimasartan. |
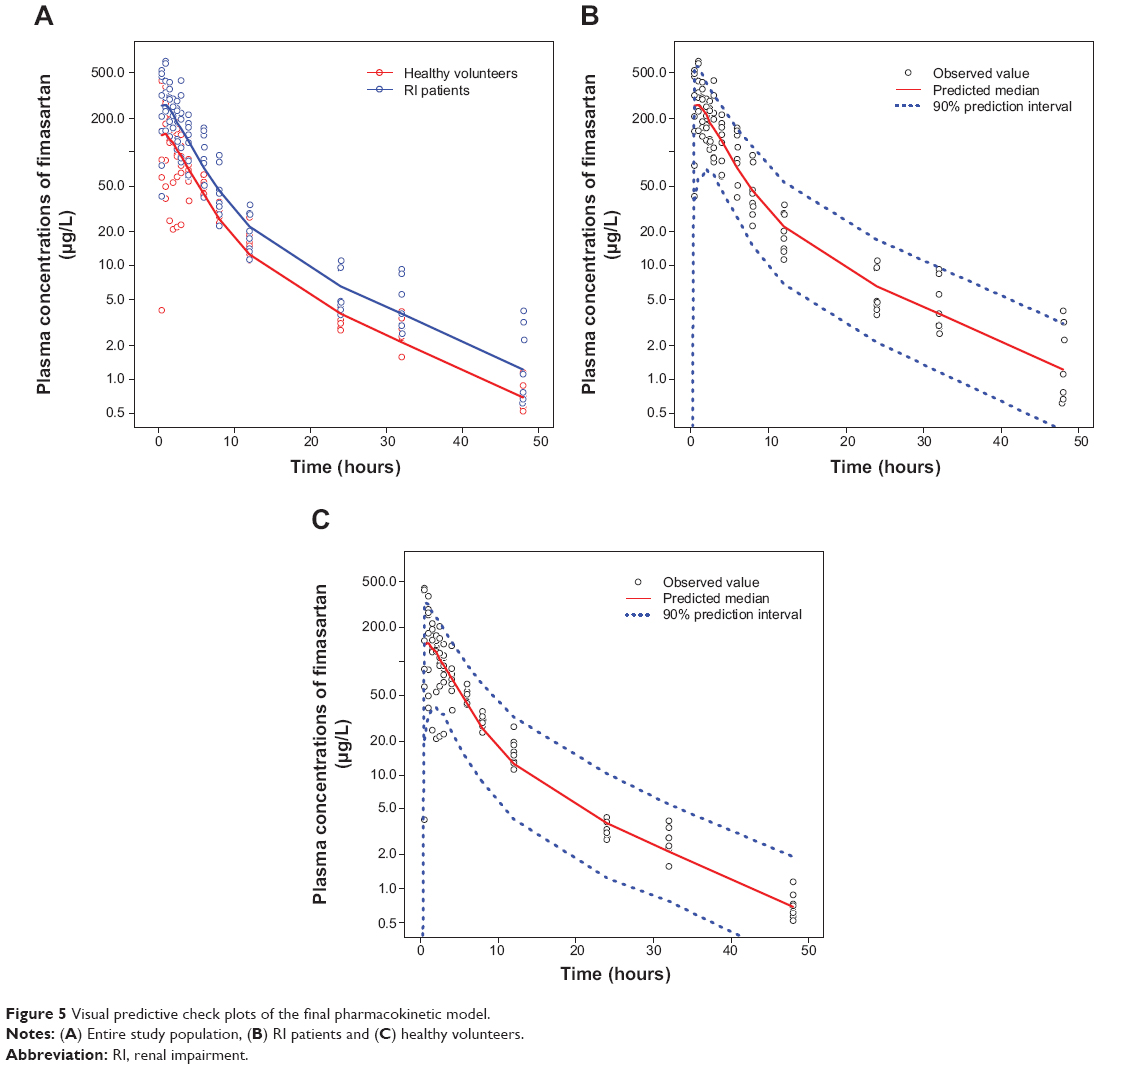 | Figure 5 Visual predictive check plots of the final pharmacokinetic model. |
Discussion
The RI patients were found to have higher systemic exposure to fimasartan, although the ke was comparable in both groups (P-value =0.553, Table 4). Thus, it was difficult to explain this result with RI and its related alterations in elimination considering that fimasartan undergoes nonrenal elimination and that the overall urinary excretion of unchanged drug is less than 3% of the administered dose.8 The RI patient group had significantly lower CL/F than the group with normal renal function (Table 4). Therefore, the meaningful difference in bioavailability between the healthy volunteers and RI patients may provide a physiologic explanation for the changes in the systemic exposure of fimasartan.
To find the significant covariates affecting F1, OFV was compared with GRP as a discrete variable and eGFR as a continuous variable. When GRP was selected as a covariate on F1, the decrease of OFV from the basic model was 11.1 and eGFR decreased from the OFV by 10.3. Since this study was a reduced design without any participants with mild to moderate RI, the incorporation of eGFR on F1 as a continuous variable may not be suitable. In addition, there was no relationship between eGFR and F1 within each group. Therefore, the difference of F1 between two groups was more clearly explained by GRP, and the F1 for the healthy volunteers was 0.566 when the bioavailability of RI patients was fixed to be 1. The bioavailability of fimasartan for RI patients was increased 1.77-fold compared with healthy volunteers.
It is a well-known fact that RI and its associated uremia can influence the changes in metabolism and transport of nonrenally cleared drugs. Decreased renal function can increase bioavailability of Pgp and MRP2 substrates by decreasing the functional expression of these efflux transporters in the gastrointestinal tract.15 Similarly, decreased first-pass effect by the downregulation of phase I enzymes like CYP3A, leads to increased bioavailability.15 Furthermore, several in vitro studies have shown that the accumulation of uremic toxins induces chronic inflammation, and the uremic toxins and inflammation induce an increase in the bioavailability of drugs in the intestine due to decreases in the function and protein expression of transporters such as MRP2 and Pgp.16 Although fimasartan was identified as a substrate for CYP3A4, OAT1, OATP1B1, OATP2B1, and OATP1B3,10,11,13 further study is required for a better mechanistic understanding of the alteration on PK of fimasartan in RI patients.
Sica et al17 determined the effect of renal function on the PK and pharmacodynamics of losartan and its metabolite, and it was suggested that an initial dosage adjustment for losartan in the presence of RI was not required. From the drug label of losartan, no dosage adjustment is necessary for patients with RI unless they are volume depleted.18 Prasad et al19 determined the effect of renal function on the PK and pharmacodynamics of valsartan, and they suggested that RI does not alter the PK of valsartan, and dose adjustments in patients with renal function of CLCR ≥10mL/min are not recommended. From the drug label of valsartan, no initial dosage adjustment is required for patients with mild or moderate RI (CLCR ≥10 mL/min) and care should be exercised with dosing of valsartan in patients with severe RI (CLCR ≤10 mL/min).20
In this study, the systemic exposure to fimasartan was increased in patients with severe RI who were not yet on dialysis without prolongation of the terminal elimination half-life. The increase in systemic exposure was less than twofold compared with healthy volunteers (Table 4). These differences were explained by differences in bioavailability based on the nonlinear mixed-effects modelling results. Therefore, considering that the terminal elimination half-life was not prolonged, accumulation after multiple dosing would not occur. A previous PK study of fimasartan in healthy volunteers showed that fimasartan up to 480 mg as a single dose and up to 360 mg as multiple doses was well tolerated.8 Additionally, a Phase II study in patients with essential hypertension has shown that fimasartan up to 240 mg as a once daily dose was well tolerated.12 Based on previous studies and the results of this study, the systemic exposure from the administration of 120 mg of fimasartan to patients with severe RI is expected to be within a tolerable range. These findings may be applied to recommend the appropriate dose of fimasartan for RI patients. Considering that this degree of increased exposure to fimasartan in RI patients is not likely to pose safety issues, the initial dosage regimen may need not be altered. However, regarding efficacy and safety after multiple dosings, further studies are warranted to identify optimal dosage regimens.
Acknowledgments
This study was sponsored by Boryung Pharmaceutical Co., Ltd., Seoul, Korea. This study was designed and conducted by qualified investigators of the Department of Clinical Pharmacology and Therapeutics of Seoul National University College of Medicine and Hospital. The sponsor played a minor role in study design and interpretation. All of the coauthors participated in either writing or reviewing the manuscript.
Disclosure
The authors report no conflicts of interests regarding the content of this article.
References
Kearney PM, Whelton M, Reynolds K, Muntner P, Whelton PK, He J. Global burden of hypertension: analysis of worldwide data. Lancet. 2005;365(9455):217–223. | ||
Choi KM, Park HS, Han JH, et al. Prevalence of prehypertension and hypertension in a Korean population: Korean National Health and Nutrition Survey 2001. J Hypertens. 2006;24(8):1515–1521. | ||
Ezzati M, Lopez AD, Rodgers A, Vander Hoorn S, Murray CJ. Selected major risk factors and global and regional burden of disease. Lancet. 2002;360(9343):1347–1360. | ||
Chobanian AV, Bakris GL, Black HR, et al; Joint National Committee on Prevention, Detection, Evaluation, and Treatment of High Blood Pressure. National Heart, Lung, and Blood Institute; National High Blood Pressure Education Program Coordinating Committee. Seventh report of the Joint National Committee on Prevention, Detection, Evaluation, and Treatment of High Blood Pressure. Hypertension. 2003;42(6): 1206–1252. | ||
Mancia G, De Backer G, Dominiczak A, et al. 2007 Guidelines for the management of arterial hypertension: The Task Force for the Management of Arterial Hypertension of the European Society of Hypertension (ESH) and of the European Society of Cardiology (ESC). Eur Heart J. 2007;28(12):1462–1536. | ||
Izuhara Y, Nangaku M, Inagi R, et al. Renoprotective properties of angiotensin receptor blockers beyond blood pressure lowering. J Am Soc Nephrol. 2005;16(12):3631–3641. | ||
US Department of Health and Human Services, Food and Drug Administration. Guidance for Industry; Pharmacokinetics in Patients with Impaired Renal Function – Study Design, Data Analysis, and Impact on Dosing and Labeling. Rockville, MD: US Food and Drug Administration, Drug Information Branch; 2010. Available from: http://www.fda.gov/downloads/Drugs/GuidanceComplianceRegulatoryInformation/Guidances/ucm072127.pdf. Accessed June 3, 2014. | ||
Chi YH, Lee H, Paik SH, et al. Safety, tolerability, pharmacokinetics, and pharmacodynamics of fimasartan following single and repeated oral administration in the fasted and fed states in healthy subjects. Am J Cardiovasc Drugs. 2011;11(5):335–346. | ||
Levey AS, Bosch JP, Lewis JB, Greene T, Rogers N, Roth D. A more accurate method to estimate glomerular filtration rate from serum creatinine: a new prediction equation. Modification of Diet in Renal Disease Study Group. Ann Intern Med. 1999;130(6):461–470. | ||
Yi S, Kim JW, Kim TE, et al. Effect of multiple doses of fimasartan, an angiotensin II receptor antagonist, on the steady-state pharmacokinetics of digoxin in healthy volunteers. Int J Clin Pharmacol Ther. 2011;49(5):321–327. | ||
Shin KH, Kim TE, Kim SE, et al. The effect of the newly developed angiotensin receptor II antagonist fimasartan on the pharmacokinetics of atorvastatin in relation to OATP1B1 in healthy male volunteers. J Cardiovasc Pharmacol. 2011;58(5):492–499. | ||
Lee H, Yang HM, Lee HY, et al. Efficacy and tolerability of once-daily oral fimasartan 20 to 240 mg/d in Korean Patients with hypertension: findings from Two Phase II, randomized, double-blind, placebo-controlled studies. Clin Ther. 2012;34(6):1273–1289. | ||
Yi S, Kim TE, Yoon SH, et al. Pharmacokinetic interaction of fimasartan, a new angiotensin II receptor antagonist, with amlodipine in healthy volunteers. J Cardiovasc Pharmacol. 2011;57(6):682–689. | ||
Kim JW, Yi S, Kim TE, et al. Increased systemic exposure of fimasartan, an angiotensin II receptor antagonist, by ketoconazole and rifampicin. J Clin Pharmacol. 2013;53(1):75–81. | ||
Nolin TD, Naud J, Leblond FA, Pichette V. Emerging evidence of the impact of kidney disease on drug metabolism and transport. Clin Pharmacol Ther. 2008;83(6):898–903. | ||
Dreisbach AW, Lertora JJ. The effect of chronic renal failure on drug metabolism and transport. Expert Opin Drug Metab Toxicol. 2008;4(8): 1065–1074. | ||
Sica DA, Lo MW, Shaw WC, et al. The pharmacokinetics of losartan in renal insufficiency. J Hypertens Suppl. 1995;13(1):S49–S52. | ||
Cozaar® (losartan potassium tablets) [package insert]. Whitehouse Station, NJ: Merck & Co., Inc.; 2003. | ||
Prasad P, Mangat S, Choi L, et al. Effect of renal function on the pharmacokinetics of valsartan. Clin Drug Invest. 1997;13(4):207–214. | ||
Diovan (valsartan tablets) [package insert]. East Hanover, NJ: Novartis Pharmaceuticals Corp.; 1996. |
 © 2014 The Author(s). This work is published and licensed by Dove Medical Press Limited. The full terms of this license are available at https://www.dovepress.com/terms.php and incorporate the Creative Commons Attribution - Non Commercial (unported, v3.0) License.
By accessing the work you hereby accept the Terms. Non-commercial uses of the work are permitted without any further permission from Dove Medical Press Limited, provided the work is properly attributed. For permission for commercial use of this work, please see paragraphs 4.2 and 5 of our Terms.
© 2014 The Author(s). This work is published and licensed by Dove Medical Press Limited. The full terms of this license are available at https://www.dovepress.com/terms.php and incorporate the Creative Commons Attribution - Non Commercial (unported, v3.0) License.
By accessing the work you hereby accept the Terms. Non-commercial uses of the work are permitted without any further permission from Dove Medical Press Limited, provided the work is properly attributed. For permission for commercial use of this work, please see paragraphs 4.2 and 5 of our Terms.