")
Back to Journals » Clinical Ophthalmology » Volume 12
Effect of quantitative intraocular pressure reduction on visual field defect progression in normal tension glaucoma under medical therapy applying Markov model
Authors Yoshikawa K , Santo K, Hizaki H, Hashimoto M
Received 25 April 2018
Accepted for publication 21 June 2018
Published 30 August 2018 Volume 2018:12 Pages 1617—1624
DOI https://doi.org/10.2147/OPTH.S172273
Checked for plagiarism Yes
Review by Single anonymous peer review
Peer reviewer comments 2
Editor who approved publication: Dr Scott Fraser
Keiji Yoshikawa,1 Kazunori Santo,2 Hiroko Hizaki,2 Masayo Hashimoto2
1Yoshikawa Eye Clinic, Machida, Tokyo, Japan; 2Japan Medical Affairs, Santen Pharmaceutical Co., Ltd, Osaka, Japan
Purpose: To quantitatively evaluate the association of intraocular pressure (IOP) reduction with visual field defect (VFD) progression in normal tension glaucoma (NTG) under medical therapy.
Patients and methods: Clinical data for 622 eyes of 311 primary open-angle glaucoma and NTG patients were collected from April 2006 to March 2016. Of these patients, those with normal IOP, glaucomatous VFD by Anderson’s criteria, corrected visual acuity ≥0.7, >5 years of medical therapy, ≥5 visual field tests at least five times at 12-month intervals, visual field testing reliability coefficients of ≤33%, and mean deviation (MD) exceeding below -20 dB in the initial visual field test were included in this retrospective data analysis. MD and IOP data were collected at baseline and after 5 years. Following MD categorization into stages I to IV, stage transition matrices were generated using a Markov model to evaluate VFD changes. Eyes were divided based on IOP reduction (0%, 10%, 15%, 20%, 25%, 30%) from baseline. VFD aggravations were compared using the Markov model and MD slopes with IOP reduction rates as cutoff values.
Results: Overall, 132 eyes of 132 NTG patients fulfilled the eligibility criteria. MD decreased significantly (P<0.0001) at 5 years vs baseline. During follow-up, visual field stage using the Markov model was constant in ~60%, with transitions in ~40%. IOP decreased significantly (P<0.001) at 5 years vs baseline. Though MD slopes did not differ significantly between each of the groups that achieved the various IOP reduction cut-off values and the corresponding group that did not achieve the cut-off values, a significant difference (P=0.0432) in VFD was found between the group that achieved the 25% cut-off value and the group that did not when evaluated using the Markov model.
Conclusion: In NTG patients, VFD aggravation was significantly suppressed in groups with IOP reductions of ≥25% from baseline.
Keywords: normal tension glaucoma, visual field defect (VFD) progression, long-term follow-up, intraocular pressure reduction, Markov model
Introduction
In our previous long-term monitoring of patients on continuous medical therapy for visual field defects (VFD) in normal tension glaucoma (NTG), we reported that VFD tended to become aggravated, but the progression was slow.1 In that study, we used the mean deviation (MD) slope as a tool to determine the degree of VFD aggravation. The MD slope, along with yearly changes in MD and statistical significance, was evaluated by linear regression analysis.2
Meanwhile, glaucomatous VFD show a wide variety of progression patterns, including linear or episodic progression and progression following a plateau.3 Therefore, event analysis can also be utilized to compare visual fields at various time points vs baseline,4 and there are no established methods for evaluating glaucomatous VFD progression. The available methods for evaluating malignant disease transitions, such as courses and outcomes, include the Markov model.5 The Markov model is employed in health economics6 and disease treatment evaluations,7 as well as in the glaucoma field to determine gain and loss of treatment costs,8 perform automated diagnoses using imaging technologies,9 and assess imaging-based progression.10 However, few studies have reported on this model for clinical course evaluation in VFD.11 Therefore, we attempted to evaluate VFD progression in NTG patients under medical therapy using a Markov model. We previously reported that intraocular pressure (IOP) reductions significantly suppressed the progression of VFD in NTG patients under medical therapy.1 However, that study only involved a qualitative evaluation of IOP reductions. Hence, we conducted the present study to determine the influence of quantitative IOP reductions on VFD progression.
Patients and methods
Study design
This was a retrospective observational study.
Subjects
Patients who provided written consent for data collection at the time of their initial visit were selected from those who received topical glaucoma medications and underwent routine ophthalmologic examinations (including IOP and visual field tests) at Yoshikawa Eye Clinic between April 2006 through March 2016.
The inclusion criteria were: 1) age of ≥20 years at the start of the follow-up period; 2) IOP of <21 mmHg at any test; 3) glaucomatous VFD diagnosed according to the Anderson criteria on a visual field test; 4) at least five visual field tests with a Humphrey field analyzer (Zeiss-Humphrey, San Leandro, CA, USA) at least five times at 12-month intervals without alteration of strategy (SITA standard) or program (C24-2); 5) measurement of baseline IOP at least four times by Goldmann applanation tonometry before treatment; and 6) periodic measurements of IOP during follow-up.
The exclusion criteria were: 1) MD below –20 decibels (dB) in a visual field test at the start of the follow-up period; 2) corrected visual acuity of <0.7 during follow-up; 3) reliability coefficients in visual field tests of ≥33% (loss of fixation, false positives, false negatives); 4) the presence of other ophthalmic disorders that may affect visual fields; 5) ophthalmic surgery (including intraocular lens implantation) during the follow-up period; 6) anterior segment abnormalities that may affect measurement by Goldmann applanation tonometry; 7) history of recurrent uveitis, scleritis, or corneal herpes; 8) pregnant or breastfeeding women; and 9) patients judged to be ineligible for other reasons. There were no restrictions on the type and number of topical glaucoma medications and patients of both sexes were enrolled.
The study protocol was approved by the Institutional Review Board of Kyoyukai River Side Clinic. Prior to accessing medical records, opt-out consent was obtained from patients after providing an explanation of the study objectives and information collection methods in accordance with the principles of the Helsinki Declaration. Patients could choose to refuse to participate after receiving the outline and opt out of the study. The study was registered in UMIN (ID: UMIN000022334) in advance of data collection.
Investigations
Baseline data were collected, and MD values and MD slopes during 5 years of medical therapy were calculated using Hfa Files Version 5.0 software (Beeline, Tokyo, Japan).
Baseline IOP was calculated as the mean of four or more IOP measurements before initiation of glaucoma treatment. “Mean IOP” was defined as the mean of all IOP values measured every 3 months during the follow-up period. The difference between baseline IOP and mean IOP was defined as ΔIOP, and the IOP reduction rate was determined by calculating ΔIOP as a percentage of baseline IOP.
Statistical analysis
Personal information of the subjects was concealed before data entry. One eye from each subject was used for the analysis. If both eyes met the selection criteria for the study, the eye with the lower initial MD value was chosen.
A Markov model was used to analyze visual field stage transitions. The difference between the first MD measurement and each subsequent MD measurement was calculated for each subject eye and expressed by the number of years. The lowest MD value in the 5-year follow-up period was used as the representative value (MD criterion). Based on this criterion, VFD were categorized into stages I to IV (stage I, ≥−6 dB; stage II, >−12 dB and <−6 dB; stage III, ≥−20 dB and ≤−12 dB; stage IV, <−20 dB). A cross table of the data obtained at study initiation and after 5 years was made to determine the MD criterion transition rates, and state transition matrices based on these rates were generated.
In addition, the subject eyes were divided into those with IOP reductions compared with baseline IOP (10%, 15%, 20%, 25%, 30%) and those without reductions, and the visual field stage transitions based on state transition matrices generated by a Markov model were compared (Wilcoxon two-sample test). With regard to MD slopes, the degrees of aggravation were compared using the IOP reduction rates as cut-off values (Aspin-Welch t-test).
Analyses were performed with EZR Version 1.32 software (Saitama Medical Center, Jichi Medical University, Saitama, Japan), a graphical user interface for R (The R Foundation for Statistical Computing, Vienna, Austria). The level of significance was set at 5% (two-sided).
Results
Among 622 eyes of 311 primary open-angle glaucoma (POAG) and NTG patients, 132 eyes of 132 NTG patients fulfilled all the eligibility criteria. These 132 patients comprised 51 men and 81 women with a mean age (± SD) of 57.8±11.3 years (range, 28–80 years) (Table 1).
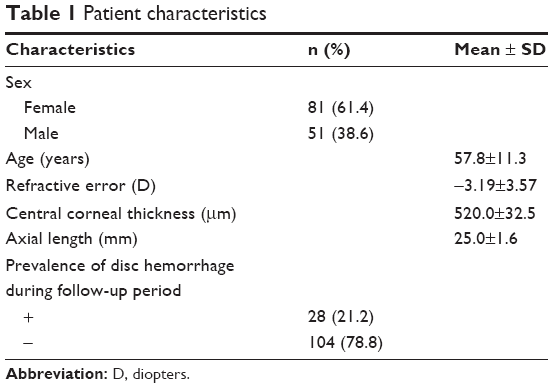 | Table 1 Patient characteristics |
After 5 years of medical therapy, IOP (11.8±0.9 mmHg; 9.0–15 mmHg) was significantly decreased (P<0.0001, paired t-test) compared with baseline IOP (14.9±1.9 mmHg; 10.7–19.7 mmHg). During the study period, visual field testing was performed 8.7±3.1 times (4–20 times), and the MD slope was −0.35±0.49 dB (−1.70 to +1.17 dB) (Table 2).
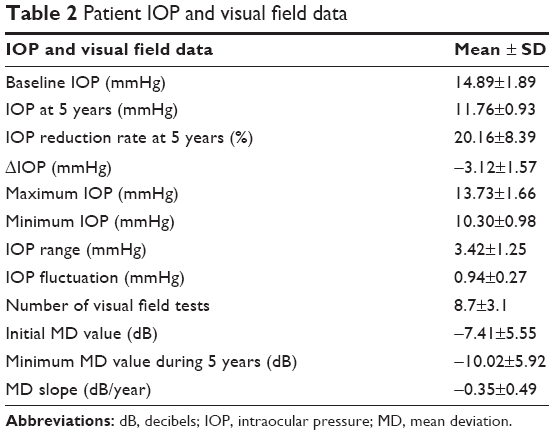 | Table 2 Patient IOP and visual field data |
In the initial examination, the most prevalent visual field stage was stage I (65 eyes, 49.2%), followed by stage II (36 eyes, 27.3%) and stage III (31 eyes, 23.5%), while stage IV was absent. After 5 years of medical therapy, stage I had decreased to 41 eyes (31.1%), while stage II had increased to 44 eyes (33.3%), stage III had increased to 35 eyes (26.5%), and stage IV had increased to 12 eyes (9.1%) (Figure 1).
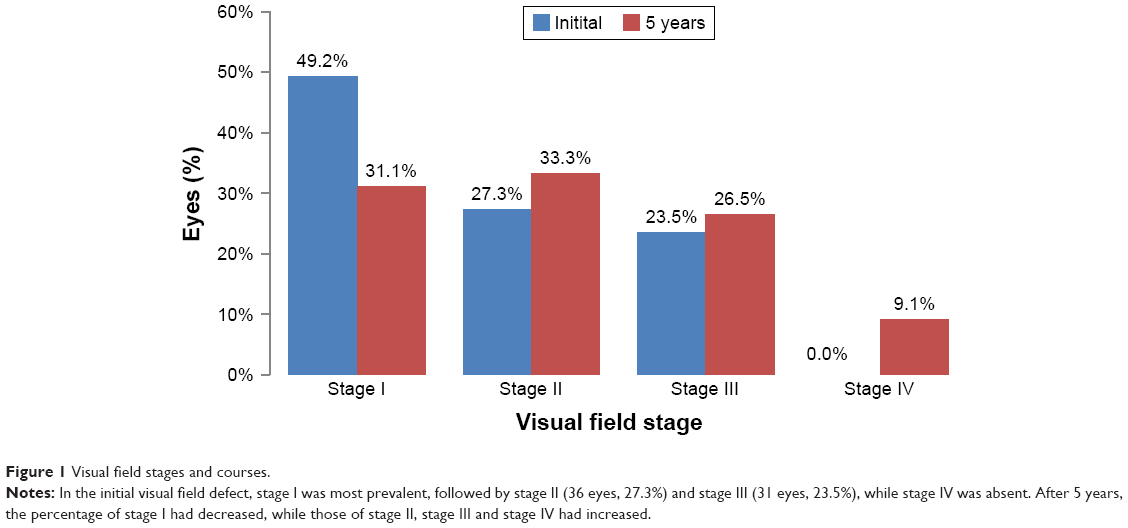 | Figure 1 Visual field stages and courses. |
When the visual field transitions from baseline to year 5 were examined using a Markov model, the ratio of patients whose condition remained at the same stage was 61.5% at stage I, 55.6% at stage II, 58.1% at stage III. However, the visual field stage transit from stage I to II in 35.4% of patients, from stage II to III in 41.7%, and from stage III to IV in 38.7%. The visual field stage skipped from stage I to III in 3.1% of patients. Transitions from stage II to I and from stage III to II occurred in 2.8% and 3.2% of patients, respectively (Figure 2).
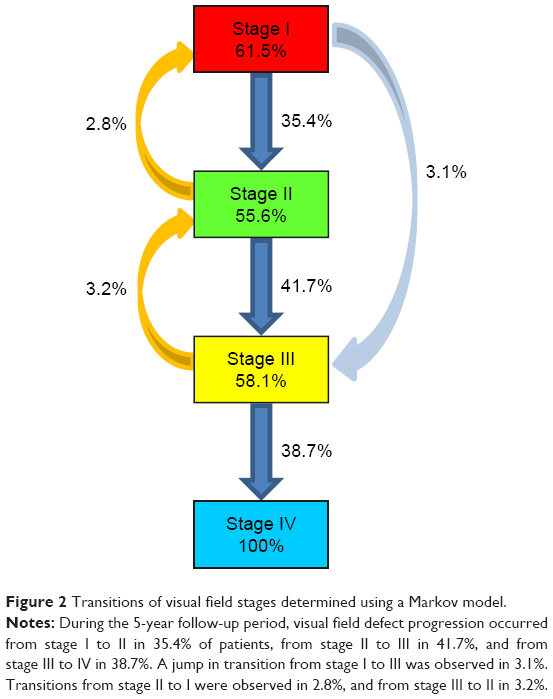 | Figure 2 Transitions of visual field stages determined using a Markov model. |
The IOP reduction rate for the entire study population was 20.2%±8.4% (−0.9% to 39.0%). The IOP reduction was <10% in 17 eyes (12.9%) and ≥10% in 115 eyes (87.1%). Likewise, the IOP reduction rate was <15% in 35 eyes, ≥20% in 67 eyes, ≥25% in 39 eyes, and ≥30% in 16 eyes.
When the differences in MD slopes were examined using the same cut-off values, no significant differences were found (10%, P=0.1096; 15%, P=0.0707; 20%, P=0.8238; 25%, P=0.0607; 30%, P=0.7868) (Table 3).
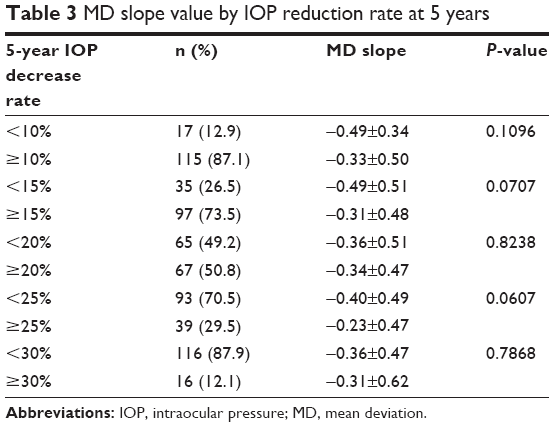 | Table 3 MD slope value by IOP reduction rate at 5 years |
Using the IOP reduction rates as cut-off values, the subjects were divided into two groups and examined for associations with visual field stage transitions. When the IOP reduction rate cut-off values were 10%, 15%, 20%, and 30%, no significant differences between the two groups in the probability of visual field stage progression were found (10%, P=0.8589; 15%, P=0.7896; 20%, P=0.3133; 30%, P=0.6644). However, when the cut-off value was 25%, the probability of visual field stage transitions was significantly lower in the groups with IOP reductions of ≥25% than in the groups with IOP reductions of <25% (P=0.0432) (Figure 3).
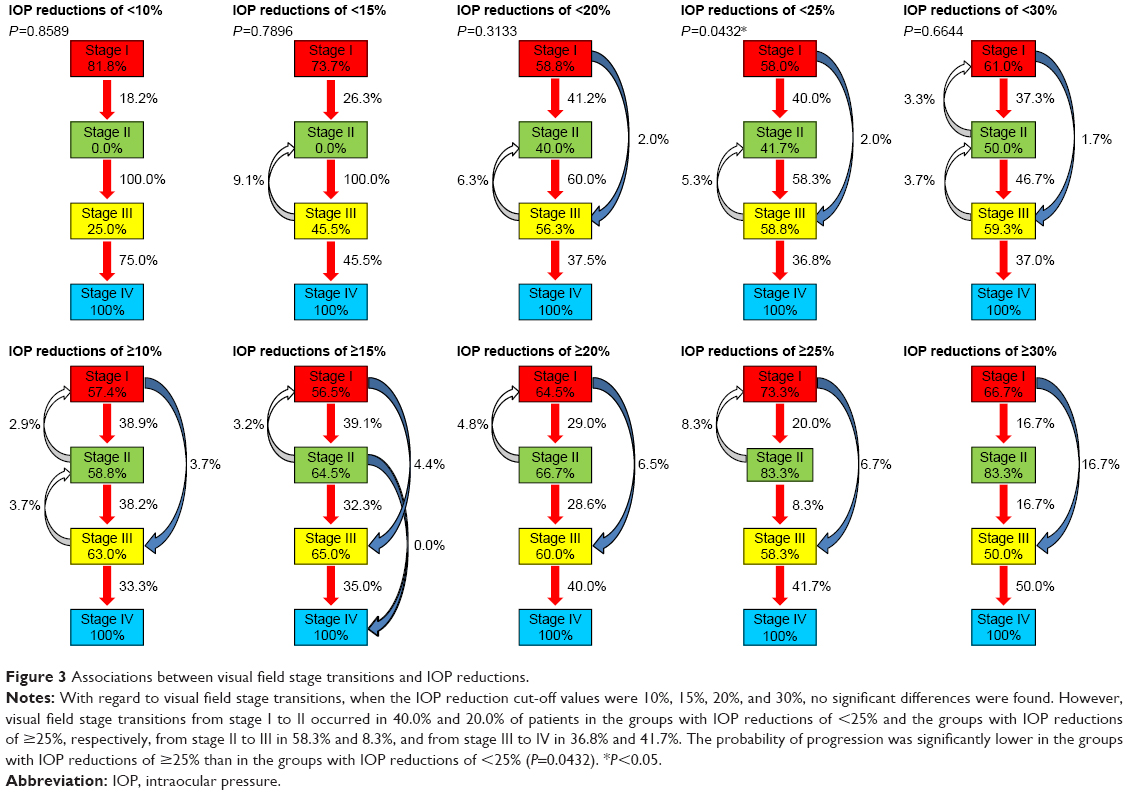 | Figure 3 Associations between visual field stage transitions and IOP reductions. |
Discussion
During 5 years of VFD monitoring of NTG patients with baseline IOP <21 mmHg without treatment, we observed a significant suppression of VFD exacerbation in those eyes with IOP reductions of ≥25% from baseline, when compared to those eyes without such reductions.
Trend analysis and event analysis can provide indicators for evaluating glaucomatous VFD progression. As a tool for trend analysis, the MD slope is intended to plot MD values in a clinical course over time, and to determine progression based on linear regression analysis, a form of parametric analysis. Event analysis is intended to determine the progressive nature of the disease based on the presence or absence of aggravations in comparisons between baseline and various time points, using a non-parametric approach. Because glaucomatous VFD has a wide variety of aggravation patterns and can be ameliorated in terms of test results, including MD values, a so-called semi-parametric analysis12 performed to evaluate events within a certain period is considered highly useful for evaluating aggravation patterns. However, the representative method of this analysis, survival time analysis,13 is a unidirectional analysis. Therefore, we attempted to evaluate VFD changes using a Markov model that enables evaluation of status changes over a period involving transition between a state and another.
In a Markov model, a certain “state” is considered to be determined by the “just preceding state”. Therefore, importance should be placed on setting the first cycle. In the present study, a 5-year period from the start of follow-up examination was defined as the first cycle, and the transitions of visual field status over this period were examined. More specifically, the lowest MD value obtained during the 5-year period was adopted as the representative value for the “transition,” the key to successful use of a Markov model. The degrees were classified into stages I to IV, as reported previously.14
When the visual field stages were determined at the first examination for NTG in the present study, stage I accounted for about 50%, followed by stages II and III, accounting for about 25% each, with stage IV being absent. However, the visual field stage at 5 years remained at stage I in 61.5% of patients, at stage II in 55.6%, and at stage III in 58.1%, thus revealing the progressive nature of VFD in NTG. When the data were examined using Markov model transition graphs, the visual field stage transitioned from stage I to II in 35.4% of patients, from stage II to III in 41.7%, and from stage III to IV in 38.7%, meaning that transition to the next stage was observed in ~40% of patients. Meanwhile, transitions from stage II to I and from stage III to II occurred in 2.8% and 3.2% of patients, respectively, and a skip in transition from stage I to III occurred in 3.1%. There were few cases of rapid VFD aggravations, suggesting that the condition tended to become aggravated slowly but steadily in NTG eyes. These observations are consistent with those in previously published reports.1,15 In general, glaucoma progression was reported to accelerate in the middle stage and thereafter.16 In the present analysis using a Markov model, VFD aggravations in NTG were not conspicuous after the middle stage; instead, the progression seemed to be linear, as reported by Lee et al.17 We conjectured that this observation may reflect an influence of medical therapy on the study subjects. We previously reported that the presence or absence of continuous aggravations of MD values was associated with long-term VFD during follow-up of NTG patients.18 Combined with the fact that Markov model evaluations include MD changes during the follow-up period, the above finding is considered to demonstrate the importance of taking note of continuous aggravations of MD within short periods, and of the Markov model in moderate to long periods, when evaluating the course of VFD in NTG patients.
In our previous study, IOP reductions were identified as a suppressive factor for VFD progression in NTG patients.1 However, we did not quantitatively evaluate the IOP reductions at that time. In the present study, IOP reductions were categorized according to the IOP reduction rates from baseline, and their associations with visual field stage transitions evaluated using a Markov model were examined quantitatively. When the IOP reduction rate cut-off value was 25%, visual field stage transition occurred from stage I to II in 40% and 20% of patients, from stage II to III in 58% and 8.3%, and from stage III to IV in 36.8% and 41.2%, with the IOP reduction rates being significantly lower in groups with IOP reductions of ≥25% than in groups with IOP reductions of <25%. The CNTGS study19 reported that VDF progression was suppressed by IOP reductions of ≥30%; however, its subjects included patients having baseline IOPs of ≥20 mmHg. The subjects of the present study, on the other hand, were exclusively NTG patients having an average baseline IOP of 14.9 mmHg (up to 19.7 mmHg). MD slopes were also compared using the IOP reduction rates as cut-off values, and no significant differences were observed.
Traditionally, it has been proposed that a 20% reduction in IOP from baseline should be targeted as the first step of NTG treatment.20 However, a study on lifetime visual outcomes in POAG21 and a study on NTG with IOP reductions divided into tertiles22 suggested the necessity for IOP reductions exceeding 20%. The present results are considered to indicate that NTG treatment with an initial goal of achieving IOP reductions of ≥25% from baseline can suppress VFD aggravations over a long period.
We also tried to simulate the transition of visual field stage after 20 years using the state transition matrices generated in the present study, on the assumption of starting treatment from stage I in all patients. The probability of transition to stage IV was higher at 49% in the groups with IOP reductions of <25%, and lower at 21% in the groups with IOP reductions of ≥25%. Furthermore, the difference between the two groups was significant, demonstrating the utility of a Markov model for long-term therapeutic evaluations (Figure 4).
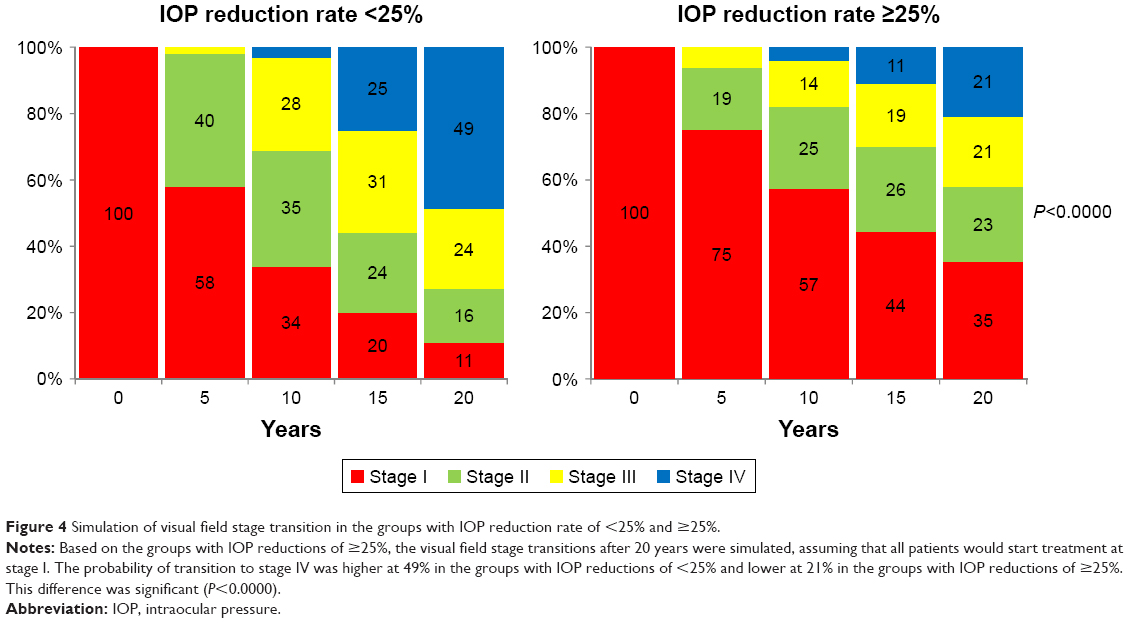 | Figure 4 Simulation of visual field stage transition in the groups with IOP reduction rate of <25% and ≥25%. |
In the present study, the time courses of VFD in NTG patients were evaluated using a Markov model, yielding similar results to those obtained by evaluation of MD values. Meanwhile, when the data were evaluated by IOP reduction rate categories, the probability of VFD aggravations was decreased in the groups with IOP reductions of ≥25% vs baseline compared with the groups without such reductions. A similar evaluation was performed for MD slopes using the same IOP reduction rates as cut-off values but found no significant differences. These findings are considered to demonstrate that the influence of IOP reductions can be evaluated quantitatively by examining stage transitions using a Markov model.
The present study is subject to some limitations. First, research with a Markov model makes it important to set a yearly course, this is, a simulation period. In the present study, one cycle consisted of 5 years. Varied MD slopes for VFD in NTG, ranging from −0.2 to −0.5 dB/year, have been reported in different studies,14,16,22,23 and we previously reported a similar level of −0.3 dB/year.1 Therefore, the 5-year MD aggravations were considered to range from −1 to −2.5 dB/year, suggesting that it is highly rational to evaluate VFD in NTG patients with the setting of 5 years for one cycle. Furthermore, while the reliability of visual field testing results was good, the fluctuation in MD values used in the study may affect the evaluation of VFD changes and quality of the findings, thereby possibly limiting their validity.
When the associations between VFD and IOP reductions were examined quantitatively, the number of patients with IOP reductions of ≥30% was found to be small, and this may represent a limitation to the evaluation in the study. In addition, IOP reductions were evaluated in 5% increments. Another limitation may be the difficulty in distinguishing between the IOP-lowering effects of treatment and IOP changes found in the normal condition (2 mmHg), as the baseline IOP is normal in NTG.
VFD progression in NTG was reported to involve not only IOP factors, but also local factors, such as severity of myopia,23 central corneal thickness,24 and disc hemorrhage.15,17,24 While, disc hemorrhage has been considered as a significant risk factor, it is not a highly specific prognostic factor because it is difficult to detect every occurrence of disc hemorrhage in clinical practice. Although the present study focused on the degree of IOP reductions, it cannot be concluded that IOP reductions alone influence the VFD, and this is a limitation to the study.
In addition, the study exclusively enrolled patients who underwent medical therapy, the first choice for treatment of NTG, which allowed a long follow-up period. For this reason, we did not evaluate the short-term time courses of visual fields or influence of IOP, including patients who underwent surgery. Furthermore, patients with dose escalations in medical therapy were excluded from the evaluations. Hence, the inability to make individual evaluations for the effects of ophthalmic drugs presents another limitation.
In the present study, analysis of VFD progression in NTG patients over a long period using a Markov model showed that visual field progression in NTG required sufficient, such as >25%, IOP reductions, and that treatment for a 5-year period from baseline influenced the subsequent VFD progression.
Conclusion
In NTG patients who were monitored for VFD progression during 5 years of medical therapy, VFD aggravations were significantly suppressed in the groups with IOP reductions of ≥25% from baseline, compared with the groups without such reductions.
Acknowledgments
This was an investigator-industry collaborative study, funded by Santen Pharmaceutical Co., Ltd (Osaka, Japan). Santen Pharmaceutical Co. Ltd participated in the design of the study, suggestions of the statistical method, interpretation of the data, and preparation and review of the manuscript, but had no role in the collection and analysis of data.
Disclosure
Santo K, Hizaki H, and Hashimoto M are employees of Santen Pharmaceutical Co. Ltd. The authors report no other conflicts of interest in this work.
References
Yoshikawa K, Santo K, Hizaki H, Hashimoto M. Long-term progression of visual field defects and related factors in medically treated normal tension glaucoma. Clin Ophthalmol. 2018;12:247–253. | ||
Heijl A, Buchholz P, Norrgren G, Bengtsson B. Rates of visual field progression in clinical glaucoma care. Acta Ophthalmol. 2013;91(5):406–412. | ||
Mikelberg FS, Drance SM. The mode of progression of visual field defects in glaucoma. Am J Ophthalmol. 1984;98(4):443–445. | ||
Casas-Llera P, Rebolleda G, Muñoz-Negrete FJ, Arnalich-Montiel F, Pérez-López M, Fernández-Buenaga R. Visual field index rate and event-based glaucoma progression analysis: comparison in a glaucoma population. Br J Ophthalmol. 2009;93(12):1576–1579. | ||
Kay R. A Markov model for analysing cancer markers and disease states in survival studies. Biometrics. 1986;42(4):855–865. | ||
Standfield LB, Comans TA, Scuffham PA. An empirical comparison of Markov cohort modeling and discrete event simulation in a capacity-constrained health care setting. Eur J Health Econ. 2017;18(1):33–47. | ||
Byun JH, Park JA, Kang HR, Shin JY, Lee EK. Comparison of effectiveness between delamanid and bedaquiline among patients with multidrug-resistant tuberculosis: a Markov model simulation Study. Clin Drug Investig. 2016;36(11):957–968. | ||
Boodhna T, Crabb DP. More frequent, more costly? Health economic modelling aspects of monitoring glaucoma patients in England. BMC Health Serv Res. 2016;16(1):611. | ||
Azuara-Blanco A, Banister K, Boachie C, et al. Automated imaging technologies for the diagnosis of glaucoma: a comparative diagnostic study for the evaluation of the diagnostic accuracy, performance as triage tests and cost-effectiveness (GATE study). Health Technol Assess. 2016;20(8):1–168. | ||
Belghith A, Bowd C, Medeiros FA, Balasubramanian M, Weinreb RN, Zangwill LM. Glaucoma progression detection using nonlocal Markov random field prior. J Med Imaging. 2014;1(3):034504. | ||
Kymes SM, Lambert DL, Lee PP, et al. The development of a decision analytic model of changes in mean deviation in people with glaucoma: the COA model. Ophthalmology. 2012;119(7):1367–1374. | ||
Muñoz A, Sunyer J. Comparison of semiparametric and parametric survival models for the analysis of bronchial responsiveness. Am J Respir Crit Care Med. 1996;154(6 Pt 2):S234–S239. | ||
Sekine M, Araie M, Suzuki Y, Koseki N. Study on risk factors for progression of visual field damage in normal-tension glaucoma. Nippon Ganka Gakkai Zasshi. 1994;98(4):369–373. | ||
Kymes SM, Kass MA, Anderson DR, Miller JP, Gordon MO. for Ocular Hypertension Treatment Study Group (OHTS). Management of ocular hypertension: a cost-effectiveness approach from the Ocular Hypertension Treatment Study. Am J Ophthalmol. 2006;141(6):997–1008. | ||
Komori S, Ishida K, Yamamoto T. Results of long-term monitoring of normal-tension glaucoma patients receiving medical therapy: results of an 18-year follow-up. Graefes Arch Clin Exp Ophthalmol. 2014;252(12):1963–1970. | ||
Mikelberg FS, Schulzer M, Drance SM, Lau W. The rate of progression of scotomas in glaucoma. Am J Ophthalmol. 1986;101(1):1–6. | ||
Lee J, Kong M, Kim J, Kee C. Comparison of visual field progression between relatively low and high intraocular pressure groups in normal tension glaucoma patients. J Glaucoma. 2014;23(8):553–560. | ||
Naito T, Yoshikawa K, Mizoue S, et al. Relationship between consecutive deterioration of mean deviation value and progression of visual field defect in open-angle glaucoma. Clin Ophthalmol. 2015;9:2217–2222. | ||
Collaborative Normal-Tension Glaucoma Study Group. Comparison of glaucomatous progression between untreated patients with normal-tension glaucoma and patients with therapeutically reduced intraocular pressures. Collaborative Normal-Tension Glaucoma Study Group. Am J Ophthalmol. 1998;126(4):487–497. | ||
Japan glaucoma society. The Japan Glaucoma Society Guidelines for Glaucoma (4th Edition)]. 2018 Jan; 2018. http://www.nichigan.or.jp/member/guideline/glaucoma4.pdf. Accessed July 20, 2018. | ||
Nordmann JP, Lafuma A, Deschaseaux C, Berdeaux G. Clinical outcomes of glaucoma treatments over a patient lifetime: a Markov model. J Glaucoma. 2005;14(6):463–469. | ||
Kim M, Kim DM, Park KH, Kim TW, Jeoung JW, Kim SH. Intraocular pressure reduction with topical medications and progression of normal-tension glaucoma: a 12-year mean follow-up study. Acta Ophthalmol. 2013;91(4):e270–e275. | ||
Sakata R, Aihara M, Murata H, et al. Contributing factors for progression of visual field loss in normal-tension glaucoma patients with medical treatment. J Glaucoma. 2013;22(3):250–254. | ||
Erdem E, Williams A, Kuchar SD, Waisbourd M, Spaeth GL. Long-term (>8 years) evaluation of progression in patients with low-pressure glaucoma. Eur J Ophthalmol. 2015;25(6):490–495. |
 © 2018 The Author(s). This work is published and licensed by Dove Medical Press Limited. The full terms of this license are available at https://www.dovepress.com/terms.php and incorporate the Creative Commons Attribution - Non Commercial (unported, v3.0) License.
By accessing the work you hereby accept the Terms. Non-commercial uses of the work are permitted without any further permission from Dove Medical Press Limited, provided the work is properly attributed. For permission for commercial use of this work, please see paragraphs 4.2 and 5 of our Terms.
© 2018 The Author(s). This work is published and licensed by Dove Medical Press Limited. The full terms of this license are available at https://www.dovepress.com/terms.php and incorporate the Creative Commons Attribution - Non Commercial (unported, v3.0) License.
By accessing the work you hereby accept the Terms. Non-commercial uses of the work are permitted without any further permission from Dove Medical Press Limited, provided the work is properly attributed. For permission for commercial use of this work, please see paragraphs 4.2 and 5 of our Terms.