")
Back to Journals » Drug Design, Development and Therapy » Volume 11
Effect of picroside II on hind limb ischemia reperfusion injury in rats
Authors Kılıç Y , Özer A , Tatar T, Zor MH, Kirişçi M, Kartal H , Dursun AD , Billur D, Arslan M , Küçük A
Received 14 January 2017
Accepted for publication 5 May 2017
Published 26 June 2017 Volume 2017:11 Pages 1917—1925
DOI https://doi.org/10.2147/DDDT.S132401
Checked for plagiarism Yes
Review by Single anonymous peer review
Peer reviewer comments 3
Editor who approved publication: Dr Qiongyu Guo
Yiğit Kılıç,1 Abdullah Özer,1 Tolga Tatar,1 Mustafa Hakan Zor,1 Mehmet Kirişçi,2 Hakan Kartal,3 Ali Doğan Dursun,4 Deniz Billur,5 Mustafa Arslan,6 Ayşegül Küçük7
1Department of Cardiovascular Surgery, Gazi University Medical Faculty, Ankara, 2Department of Cardiovascular Surgery, Kahramanmaras Sutcu Imam Medical Faculty, Kahramanmaras, 3Department of Cardiovascular Surgery, Ardahan State Hospital, Ardahan, 4Department of Physiology, Ankara University Medical Faculty, 5Department of Histology and Embryology, Ankara University Medical Faculty, 6Department of Anaesthesiology and Reanimation, Gazi University Medical Faculty, Ankara, 7Department of Physiology, Dumlupinar University Medical Faculty, Kütahya, Turkey
Introduction: Many structural and functional damages are observed in cells and tissues after reperfusion of previously viable ischemic tissues. Acute ischemia reperfusion (I/R) injury of lower extremities occurs especially when a temporary cross-clamp is applied to the abdominal aorta during aortic surgery. Research regarding the treatment of I/R injury has been increasing day-by-day. In this study, we aimed to investigate the effect of picroside II on skeletal muscle of rats experiencing simulated I/R.
Materials and methods: Twenty-four male Wistar albino rats weighing between 210 and 300 g were used in this study. Rats were randomly divided into 4 groups of 6 rats each (control, I/R, control + picroside II, and I/R + picroside II). The infrarenal section of the abdominal aorta was occluded with an atraumatic microvascular clamp in I/R group. The clamp was removed after 120 minutes and reperfusion was provided for a further 120 minutes. Picroside II (10 mg kg–1) was administered intraperitoneally to the animals in control + picroside II and I/R + picroside II groups. At the end of the study, skeletal muscle tissue was obtained for the determination of total oxidant status (TOS) and total antioxidant status (TAS) levels. Apoptosis was evaluated by TUNEL experiment.
Results: TOS levels were significantly higher in I/R group than that of control and I/R + picroside II groups (P=0.014, P=0.005, respectively). TAS levels were significantly higher in I/R group than that of control and I/R + picroside II groups (P=0.007 P=0.005, respectively). TUNEL assay revealed that picroside II reduced cell necrosis.
Conclusion: The results of this study demonstrated that picroside II plays a critical role to prevent I/R injury. Even though our results were found to be satisfactory, it should be encouraging to those who want to conduct future research on this topic.
Keywords: ischemia reperfusion, picroside II, hind limb skeletal muscle, TOS, TAS
Introduction
Cellular damage after reperfusion of previously viable ischemic tissues in lower extremity is a common and critical clinical incident. When blood flow is re-established after reperfusion, secondary metabolites such as oxygen free radicals are produced as a result of oxidation of metabolites and are spread throughout the body via systemic circulation.
Unpaired electrons and free radicals are highly reactive and readily take part in chemical reactions with virtually all cellular components (lipids, proteins, complex carbohydrates, and nucleic acids) in the body. These reactions occur through a chain of oxidative reactions to cause tissue injury. The highly unsaturated fatty acids present in cellular membranes are the most susceptible macromolecules to oxidative damage in cells. Endothelial cells, macrophages, neutrophils, and neuronal cells generate superoxide (O2−) and NO, which can combine to form peroxynitrite anion (ONOO-). Peroxynitrite, known to oxidize sulfhydryl groups and to yield products indicative of hydroxyl radical (OH) reaction with deoxyribose and dimethyl sulfoxide, causes direct cellular injury by inducing lipid and protein peroxidation and damage nucleic acids.1,2
Oxygen free radicals are the most important and toxic substances produced in various clinical conditions.3 The common characteristics in all of the clinical situations is either hypoxic microenvironments followed by reoxygenation or ischemic microenvironments followed by reperfusion. In general, as reperfusion progresses, systemic inflammatory response syndrome and multiple organ failure (excretory, respiratory, circulatory system, etc.) follow local edema and muscle necrosis.4–8
Picroside II is a glycoside derivative, and its chemical structural formula is C23H28O13. It is one of the primary active constituents isolated from Picrorhiza scrophulariiflora. It belongs to the family, Scrophulariaceae. Several pharmacological effects of picroside II, such as antioxidant,9–11 anti-apoptotic,12,13 anti-inflammatory,12,13 anticarcinogenic,14 neuroprotective,15,16 hepatoprotective,17 anticholestatic effects, and immune modulating activities18 have been demonstrated in various studies.
While most of the studies focused on myocardial ischemia/reperfusion (I/R) injury, the primary aim of this study was to investigate the role of picroside II in an experimental model of rat lower limb muscle I/R injury.
Materials and methods
Animals and experimental protocol
This study was performed at Gazi University GUDAM Laboratory with the approval of the Ethics Committee of Experimental Animals of our university. All of the procedures were performed according to accepted standards of Guide for the Care and Use of Laboratory Animals.
In this study, 24 Wistar Albino rats weighing between 210 and 300 g, raised under the same environmental conditions, were used. The rats were kept under 24°C in cycles of 12-hour daylight and 12-hour darkness and had free access to food until 2 hours before the anesthesia procedure. The animals were randomly separated into four groups of 6 rats each. Midline laparatomy was performed under ketamine (100 mg kg−1) anesthesia.
Control (C) group
A midline laparotomy was performed without any extra surgical intervention. After 4 hours of follow-up, blood sample from abdominal aorta and tissue samples from hind limb skeletal muscles were collected. Tissue samples from hind limb skeletal muscles of rats were obtained for immunohistochemical and biochemical evaluations, and then animals were sacrificed.
Control + picroside II (P) group
All steps were performed similar to C group but in addition picroside II was intraperitoneally administered (10 mg kg−1) 30 minutes before ischemia. After collecting blood and tissue samples, rats were sacrificed at the end of 4 hours.
I/R group
Midline laparotomy was performed as previously mentioned. Infrarenal aorta was clamped for 2 hours. The clamp was removed and then reperfusion was started. Reperfusion lasted for 2 more hours. In the end, after blood and tissue sampling, rats were sacrificed.
I/R + picroside II (I/R + P) group
All steps were performed similar to C group but in addition to the procedure, picroside II was intraperitoneally administered (10 mg kg−1) 30 minutes before ischemia. After collecting blood and tissue samples, rats were sacrificed at the end of 2 hours of reperfusion period.
Preparation and application of picroside II
Picroside II was purchased from Sigma-Aldrich Co. Ltd. (St Louis, MO, USA; CAS No: 39012-20-9, purity >98%, molecular formula: C23H28O13). It was diluted to a 1% solution with normal saline. The animals in the treatment group were administered an intraperitoneal injection of picroside II 30 minutes before ischemia (10 mg·kg−1); the animals in the C and I/R groups were injected with the same volume of 0.09% NaCl. After collecting samples, rats were sacrificed at the end of reperfusion period that lasted for 2 hours.
Homogenization of tissues
The hind limb tissue was collected in a sterile Eppendorf tube and was stored at −80°C until total antioxidant/oxidant status and oxidative stress index analysis. Without being allowed to thaw, the tissues were quickly weighed on a precision scale and separated as 80–100 mg using a no 22 lancet (PLUSMED®). The frozen tissue samples were crushed in the presence of liquid nitrogen in a porcelain bowl. The powdered tissue was transferred to the homogenization tube, and for each gram of tissue, 140 mM KCl solution was added such that the dilution was 1/10. To prevent increase in temperature during homogenization, the tube was held in a snow-filled glass beaker before and after homogenization with a homogenizer (Glas_Col K5424®) at a speed of 50 revolutions per minute (rpm) for 2 minutes. Homogenates were transferred to Eppendorf tubes, and the tubes were coated with parafilm and then centrifuged (Hettich Micro 200R®) for 10 minutes at 3,000 rpm. After centrifugation, the supernatant was collected in another Eppendorf tube and the total oxidative status (TOS) and total antioxidant status (TAS) were measured.
TAS measurement
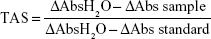
TAS was measured by using TAS test kit (RelAssay Diagnostic®, Gaziantep, Turkey), and the test was performed according to the manufacturer’s instructions. Briefly, 500 μL of reagent 1 (measurement buffer) and 30 μL of sample were mixed and absorbance was measured at 660 nm by a spectrophotometer (NanoDrop® ND-1000) (A1). Next, 75 μL of reagent 2 (colored 2,2-azino-bis-3-ethylbenzothiazoline-6-sulfonic acid) (ABTS) was added to the mixture. The tube was covered with parafilm and incubated for 5 minutes in a hot water bath at 37°C (Lightning Laborteknik®). After incubation, absorbance was measured at 660 nm (A2). For standard measurement, the Trolox Eq solution at a concentration of 1 mmol/L was used instead of the sample. The first and second measurements were performed thrice, and their averages were calculated. The absorbance change (ΔAbs) was calculated by subtracting the first absorbance value (A1) from the second absorbance value (A2). TAS levels were calculated using the formula given in the kit and expressed as mmol Trolox Eq/L.
|
TOS measurement
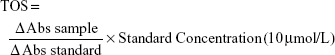
TOS was measured by the TOS test kit (RelAssay Diagnostic®), and the test was performed according to the manufacturer’s instructions. Briefly, 500 μL of reagent 1 (measurement buffer) and 75 μL of sample were mixed and absorbance was measured at 530 nm by a spectrophotometer (NanoDrop® ND-1000) (A1). Next, 25 mL of reagent 2 (Pro-chromogenic solution) was added to the mixture. The tube was covered with parafilm and incubated for 5 minutes in a hot water bath at 37°C (Lightning Laborteknik®). After incubation, absorbance was measured at 530 nm (A2). A standard solution containing 10 μmol/L hydrogen peroxide (H2O2) equivalent/liter given in the kit was used for standard measurement. The first and second measurements were performed thrice, and their averages were calculated. The absorbance change (ΔAbs) was calculated by subtracting the first absorbance value (A1) from the second absorbance value (A2). TOS levels were calculated using the formula given in the kit and expressed as mmol H2O2 Eq/L.
|
Preparation of histological samples and light microscopic investigations
For light microscopy, muscle tissue samples were placed in 10% neutral buffered formalin for 72 hours to fix the samples. After fixation routine histological evaluation of tissues was performed. After rinsing tissues in running tap water for an hour, all samples were dehydrated in a graded series of ethanol (75%, 80%, 90%, and 100%, respectively). Xylene was used to clear the tissue, and then tissue was embedded in paraffin blocks. Sections (5 μm) were cut using the Leica RM 2125RT model microtome and then placed on the slide. The slides were held overnight for deparaffinization at 60°C. Xylene was used to clear the slides, and then they were stained by H&E. The sections were examined and photographed by two different histology and embryology specialists who were blinded about the groups on the AxioScope. A1 (Carl Zeiss, Oberkochen, Germany) brand light microscope in terms of their morphological and histomorphometric properties. To determine the histological damage score, 3 different sections of the same animal were evaluated according to degeneration and disorganization findings of muscle fibers observed at ×100 magnification, and they were evaluated as follows: 0= normal, (0%); 1= mild, (1%–33%); 2= moderate (34%–66%); and 3= severe (67%–100%). In order to determine the severity of mononuclear cell infiltration in the same section, the aforementioned score table was used.19
Histomorphometric study for gastrocnemius muscle
Samples from transverse muscle sections stained with H&E for each muscle tissue were examined by light microscopy in five different microscopic fields using ×200 magnification and the cross-sectional area of each muscle fiber in this area was measured using the AxioVision computer program. The results were evaluated statistically.
Terminal deoxynucleotidyl transferase-mediated dUTP nick end-labeling (TUNEL)
TUNEL (in situ end labeling) method was used to determine the apoptotic cells in the tissues. In situ Cell Death Detection Kit (POD Roche Applied Science, Cat ≠ 11684817910) was used according to the manufacturer’s directions.
Sections (4 μm thick) were transferred to polylysine-coated slides and incubated overnight at 60°C. Then, they were deparaffinized in xylene. Sections were rehydrated in graded series of 75%, 80%, 90%, and 100% ethanol and washed with PBS. Slides immersed in 0.1 M citrate buffer were microwaved at 350 W for 5 minutes, and antigen retrieval procedure was performed. PBS was used for washing. Sections were incubated with the TUNEL reaction mixture (labeling solution + terminal deoxynucleotidyl transferase (TdT) enzyme solution) at 37°C for 1 hour in a humidified chamber and washed twice in PBS. For negative control, some sections were incubated with label solution only (without terminal transferase) instead of TUNEL reaction mixture. After this step, Converter-POD was added, and the slides were incubated for 30 minutes at 37°C and then rinsed twice with PBS. The sections were then treated with 3,3-diaminobenzidine at room temperature and rinsed twice with PBS. Sections were counterstained with Harris’ Hematoxylin for 10 minutes. The sections were dehydrated by passing them through series of graded alcohol concentrations. Xylene was used as a clearing agent, and then, the sections were coverslipped with Entellan for light microscopical examination.
TUNEL outcome evaluations
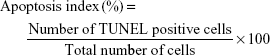
Immunohistochemically, immunoreactive cells for TUNEL staining in tissues were counted in 5 different fields in each section with a AxioScope.A1 (Carl Zeiss, Oberkochen, Germany) light microscope at a magnification of x 40. The apoptosis index of each group was calculated as percentage (%) according to the following formula:
|
Statistical analyses
Statistical analyses were performed with SPSS (Chicago, IL, USA) 20.0 program. P-value <0.05 was considered statistically significant. Kolmogorov–Smirnov test was used to compare the distribution of all variable groups. The variations in TOS and TAS levels were assessed by using the Kruskal–Wallis test. To determine which group differs from the others, we used the Bonferroni-adjusted Mann–Whitney U test after the Kruskal–Wallis test. The data were expressed as mean ± standard deviation. (mean ± SD).
Results
When the groups (skeletal muscle tissue) were compared in terms of TOS enzyme activity, there was a significant difference between the groups (P=0.023). Significantly higher TOS enzyme activity was found in I/R group than that of C and I/R + P groups (P=0.014, P=0.005, respectively), (Table 1).
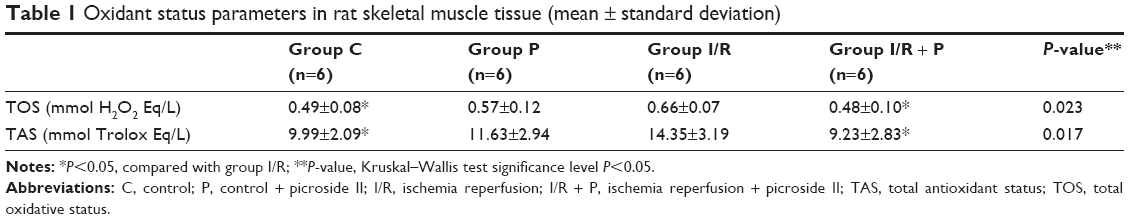 | Table 1 Oxidant status parameters in rat skeletal muscle tissue (mean ± standard deviation) |
There was a statistically significant difference between the groups when they were compared among themselves by means of TAS enzyme activity in skeletal muscle tissue (P=0.017). TAS enzyme activity in I/R group was found significantly higher than that of C and I/R + P groups (P=0.007 P=0.005, respectively) (Table 1).
There was a significant difference between the groups when number of TUNEL-positive cells in skeletal muscle tissue were compared (P<0.0001). The number of TUNEL-positive cells was significantly higher in I/R group than that of C, P, and I/R + P groups (P<0.0001, P<0.0001, P<0.0001, respectively). In addition, the number of TUNEL-positive cells in I/R + P group was significantly higher than that of C and P groups (P<0.0001, P<0.0001, respectively) (Table 2, Figures 1–4).
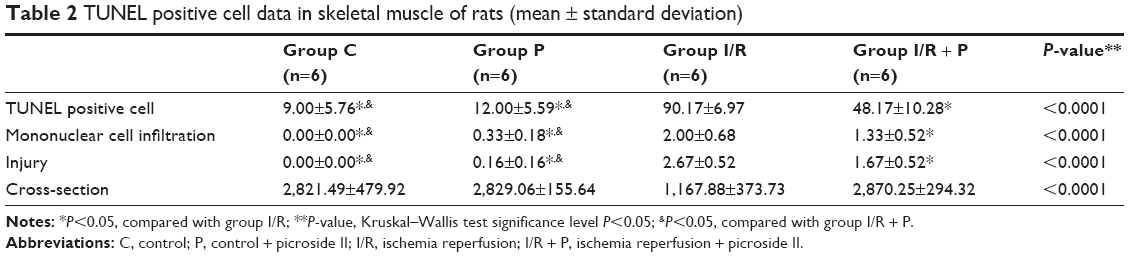 | Table 2 TUNEL positive cell data in skeletal muscle of rats (mean ± standard deviation) |
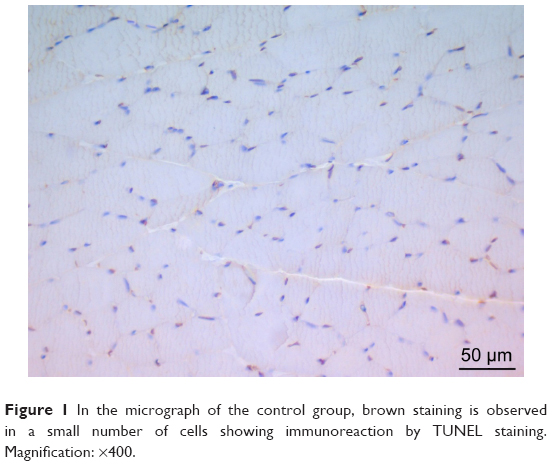 | Figure 1 In the micrograph of the control group, brown staining is observed in a small number of cells showing immunoreaction by TUNEL staining. Magnification: ×400. |
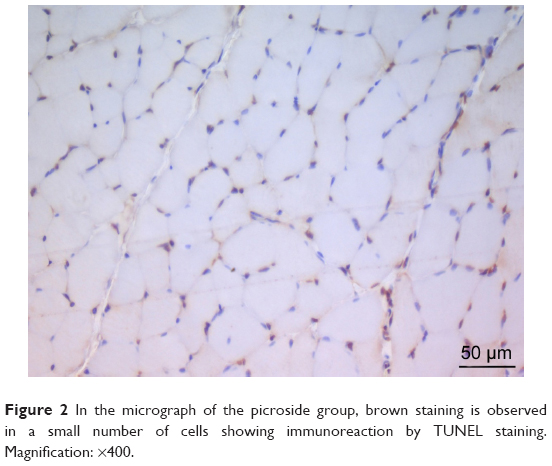 | Figure 2 In the micrograph of the picroside group, brown staining is observed in a small number of cells showing immunoreaction by TUNEL staining. Magnification: ×400. |
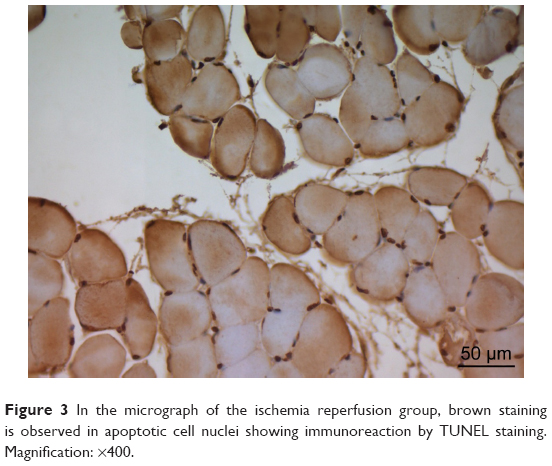 | Figure 3 In the micrograph of the ischemia reperfusion group, brown staining is observed in apoptotic cell nuclei showing immunoreaction by TUNEL staining. Magnification: ×400. |
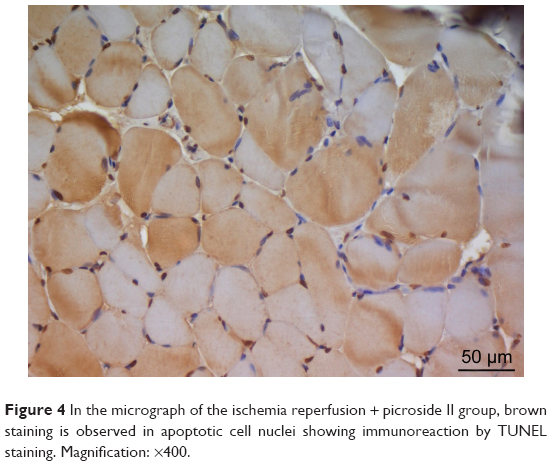 | Figure 4 In the micrograph of the ischemia reperfusion + picroside II group, brown staining is observed in apoptotic cell nuclei showing immunoreaction by TUNEL staining. Magnification: ×400. |
There was a significant difference in mononuclear cell infiltration in skeletal muscle tissue when the groups were compared (P<0.0001). The mononuclear cell Infiltration was significantly higher in I/R group than that of C, P, and I/R + P groups (P<0.0001, P<0.0001, P=0.027, respectively). In addition, the mononuclear cell infiltration in I/R + P group was significantly higher than that of C and P groups (P<0.0001, P=0.002, respectively) (Table 2, Figures 5–11).
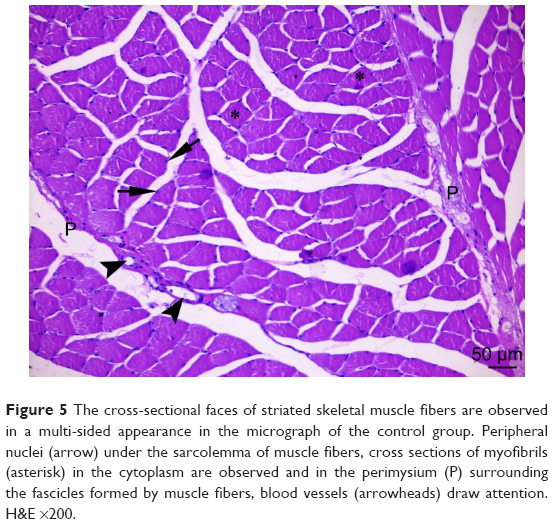 | Figure 5 The cross-sectional faces of striated skeletal muscle fibers are observed in a multi-sided appearance in the micrograph of the control group. Peripheral nuclei (arrow) under the sarcolemma of muscle fibers, cross sections of myofibrils (asterisk) in the cytoplasm are observed and in the perimysium (P) surrounding the fascicles formed by muscle fibers, blood vessels (arrowheads) draw attention. H&E ×200. |
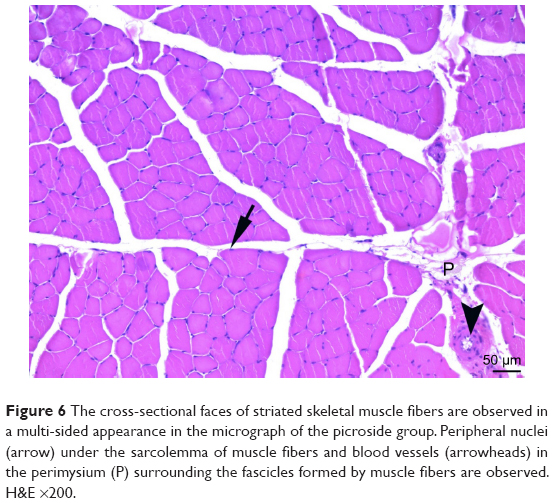 | Figure 6 The cross-sectional faces of striated skeletal muscle fibers are observed in a multi-sided appearance in the micrograph of the picroside group. Peripheral nuclei (arrow) under the sarcolemma of muscle fibers and blood vessels (arrowheads) in the perimysium (P) surrounding the fascicles formed by muscle fibers are observed. H&E ×200. |
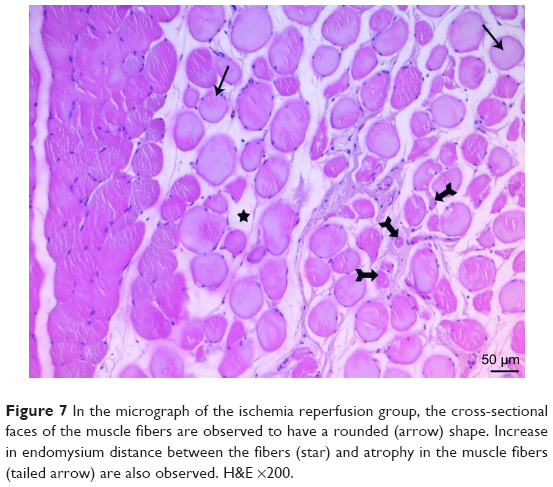 | Figure 7 In the micrograph of the ischemia reperfusion group, the cross-sectional faces of the muscle fibers are observed to have a rounded (arrow) shape. Increase in endomysium distance between the fibers (star) and atrophy in the muscle fibers (tailed arrow) are also observed. H&E ×200. |
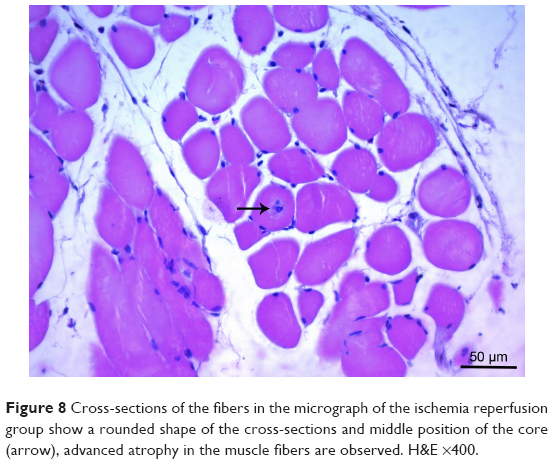 | Figure 8 Cross-sections of the fibers in the micrograph of the ischemia reperfusion group show a rounded shape of the cross-sections and middle position of the core (arrow), advanced atrophy in the muscle fibers are observed. H&E ×400. |
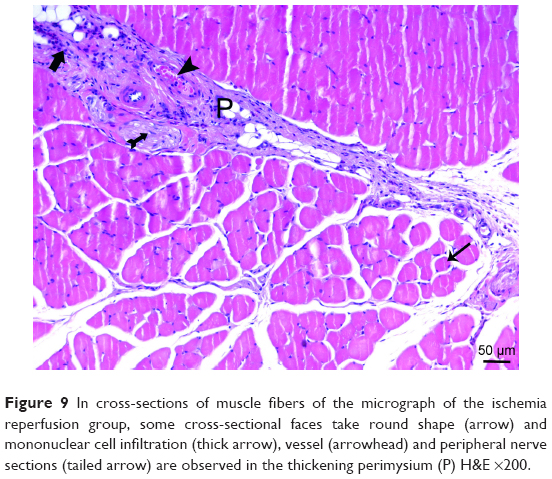 | Figure 9 In cross-sections of muscle fibers of the micrograph of the ischemia reperfusion group, some cross-sectional faces take round shape (arrow) and mononuclear cell infiltration (thick arrow), vessel (arrowhead) and peripheral nerve sections (tailed arrow) are observed in the thickening perimysium (P) H&E ×200. |
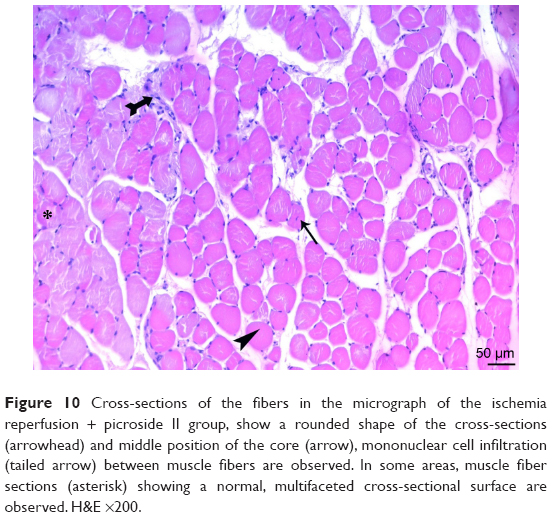 | Figure 10 Cross-sections of the fibers in the micrograph of the ischemia reperfusion + picroside II group, show a rounded shape of the cross-sections (arrowhead) and middle position of the core (arrow), mononuclear cell infiltration (tailed arrow) between muscle fibers are observed. In some areas, muscle fiber sections (asterisk) showing a normal, multifaceted cross-sectional surface are observed. H&E ×200. |
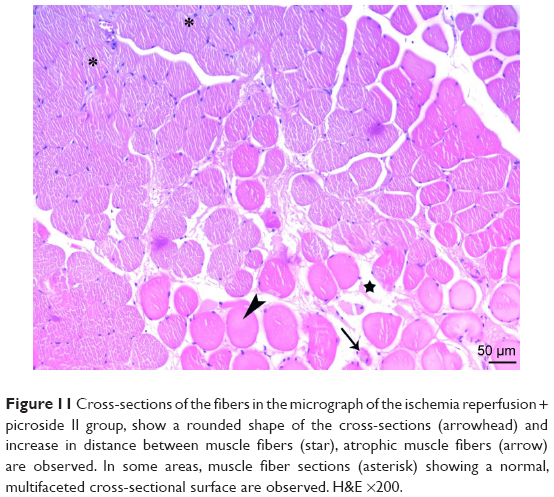 | Figure 11 Cross-sections of the fibers in the micrograph of the ischemia reperfusion + picroside II group, show a rounded shape of the cross-sections (arrowhead) and increase in distance between muscle fibers (star), atrophic muscle fibers (arrow) are observed. In some areas, muscle fiber sections (asterisk) showing a normal, multifaceted cross-sectional surface are observed. H&E ×200. |
When the groups were compared in terms of skeletal muscle injury, there was a significant difference between the (P<0.0001). Skeletal muscle injury was significantly higher in I/R group than that of C, P, and I/R + P groups (P<0.0001, P<0.0001, P=0.003, respectively). In addition, skeletal muscle injury in the I/R + P group was significantly higher than that of C and P groups (P<0.0001, P<0.0001, respectively) (Table 2, Figures 5–11).
There was a significant difference between the groups in terms of cross-section of skeletal muscle (P<0.0001). The cross-section was significantly higher in I/R group than that of C, P, and I/R + P groups (P<0.0001, P<0.0001, P<0.0001, respectively), (Table 2, Figures 6–11).
In cross-sections examined in the C and P groups, it was observed that the muscle fibers were rounded, or they were found to have a slightly angular polygonal shape if they were compressing to each other. It was observed that the muscle fibers in the fascicle surrounded by the perimysium were tightly packed together, and the interstitial area was extremely narrow. In addition to the sections containing one or more nuclei located just below the sarcolemma, there were also nucleus-free cross-sections. Blood vessels and nerve sections were observed in connective tissue sheaths. Cross-sections of myofibrils were seen on the cross-sectional surfaces of muscle fibers (Figures 5 and 6).
In the I/R group, it was seen that the cross-section of the muscle fibers was round or irregular; the distance between the muscle fibers surrounded by the endomysium, where the core was placed mid-point, was increased. The presence of atrophied muscle fibers attracted our attention. Mononuclear cell infiltration was observed with thickening in the perimysium surrounding the muscle fascicles, more prominently around the vessel (Figures 7–9).
In the I/R + P group cross-sectional surfaces of the muscle fibers were observed to be rounded occasionally, and in some of the fibers, mid-point settlement of the core was remarkable. Increase in the area between muscle fibers and mild mononuclear cell infiltration were observed. Although the atrophic muscle fibers were seen in the specimens occasionally, there were muscle fibers showing a normal multifaceted cross-sectional surface in some areas (Figures 10 and 11).
Discussion
Picroside II (β-d-glucopyrano side,1a,1b,2,5a,6,6a-hexahydro-6-[(4-hydroxy-3-methoxybenzoyl)oxy]-1a(hydroxymethyl)oxireno[4,5]cyclopenta[1,2-c]pyran-2-yl) is a major iridoid glycoside isolated from P. scrophulariiflora Pennell (Scrophulariaceae).20 Several pharmacological effects of picroside II such as antioxidant,9–11 anti-apoptotic,12,13 anti-inflammatory,12,13 anticarcinogenic,14 neuroprotective,15,16 hepatoprotective,17 anticholestatic effects, and immune modulating activities18 have been demonstrated.
Unpaired electrons and free radicals are highly reactive and readily take part in chemical reactions with virtually all cell components (lipids, proteins, complex carbohydrates, and nucleic acids) in the body. These reactions occur through a chain of oxidative reactions to cause tissue injury. For most biological structures (such as lipids, proteins, and nucleic acids), free radical damage is closely associated with oxidative damage, causing direct cellular injury by inducing lipid and protein peroxidation and damaging nucleic acids.1 I/R results in the generation of toxic ROS in the organs. It reduces the activity of cellular defense enzymes against ROS, and reperfusion or the introduction of oxygen further disturbs the delicate balance of oxidants/antioxidants 21 and intracellular calcium overload, adenosine triphosphate depletion, myocardial apoptosis, and endothelial dysfunction are all observed consequently.22,23 Furthermore, oxidative products such as ROS, reactive nitrogen species, hydrochloric acid, malondialdehyde (MDA), and lipid peroxides constitute TOS.10
Zhang et al24 performed animal experiments and showed that the amount of MDA, nitric oxide (NO), and H2O2 can directly reflect the changes in free radical content in vivo in cerebral ischemic injury. The amount of MDA, NO, and H2O2 increased significantly in serum and brain tissue after establishing the animal models, and the amount decreased after injecting picroside II intraperitoneally. It was suggested that picroside II can enhance the activity of endogenous antioxidant enzymes and clear the excess oxygen radicals to protect brain tissue from oxidative injury.
In our study, TAS, as the marker of total antioxidant protection against the attack of free radicals in the organism and TOS, as the marker of total value of oxidative stress were used. Studies have shown that TAS measurement provides more valuable information than individual measurements of antioxidants.25,26
When we compared skeletal muscle tissue in terms of TOS enzyme activity in our study, there was a significant difference between the groups. TOS enzyme activity was significantly higher in I/R group than that of C and I/R + P groups. Oxidative stress, which is the primary actor of I/R injury, was found to be lower in the picroside II-treated groups in TOS measurement.
In addition, when we compared skeletal muscle tissue in terms of TAS enzyme activity in our study, there was a significant difference between the groups. TAS enzyme activity was found to be significantly higher in I/R group than that of C and I/R + P groups, which is parallel to the fact that antioxidant systems are impaired by I/R damage, and that the low activity of TAS enzyme in the groups given picroside II indicates that the antioxidant systems are protected, in other words active. Kim et al27 found that administration of 2.5 mg vitamin C for 5 days increased the total antioxidant status during that period, and after the administration of 2.5 mg vitamin C for 5 days, TAS was found to be decreased. They thought that this decrease in TAS was related to decreased antioxidant stress. Ayada et al28 also observed that nesfatin-1 reduced TOS and also TAS levels under laparatomy and I/R conditions. They thought that chronic peripheral nesfatin-1 administration can reduce oxidant level in both experimental conditions in parallel with inhibition of NO production.
TUNEL method is a staining method used for in situ detection of DNA fragments (breaks) that are an indicator of apoptosis.29–31 Li et al32 reported that picroside II could have a neuroprotective effect by inhibiting apoptosis and the expressions of NFκB and IκB following middle cerebral artery occlusion/reperfusion in rats. Wang et al33 reported that cerebral ischemic injury activated ERK1/2 to induce apoptosis, whereas picroside II down-regulated ERK1/2 expression following cerebral ischemia to inhibit apoptosis in rats. The number of positive inflammatory cells (histiocytes) in epithelioid granulomas in 1 mm2 area was the number of TUNEL positive cells, and in our study, there was a significant difference between the groups when the skeletal muscle tissues were compared in terms of number of TUNEL cells. The number of TUNEL cells was significantly higher in I/R group than that of C, P, and I/R + P groups. In addition, the number of TUNEL cells in I/R + P group was significantly higher than that of C and P groups.
When we compared skeletal muscle tissues in terms of mononuclear cell infiltration, in our study, there was a significant difference between the groups. It was significantly higher in I/R group than that of C, P, and I/R + P groups. In addition, mononuclear cell infiltration in I/R + P group was significantly higher than that of C and P groups.
When we compared injury to skeletal muscle tissue, in our study, there was a significant difference between the groups. The injury was significantly higher in I/R group than that of C, P, and I/R + P groups.
There was a significant difference between the groups in terms of skeletal muscle cross-section in our study.
In conclusion, our findings suggest that picroside II has a protective effect against I/R injury of skeletal muscle, but we still think these promising results should further be supported by more detailed studies with larger volumes.
Disclosure
The authors alone are responsible for the content and writing of the paper. The authors report no conflicts of interest in this work.
References
Halliwell B, Gutteridge JMC. Free Radicals in Biology and Medicine. 3rd ed. New York: Oxford University Press; 1999:246–350. | ||
Radi R, Beckman JS, Bush KM, Freeman BA. Peroxynitrite-induced membrane lipid peroxidation: the cytotoxic potential of superoxide and nitric oxide. Arch Biochem Biophys. 1991;288(2):481–487. | ||
Hensley K, Robinson KA, Gabbita SP, Salsman S, Floyd RA. Reactive oxygen species, cell signaling, and cell injury. Free Radic Biol Med. 2000;15;28(10):1456–1462. | ||
Sirmali R, Armağan A, Öktem F, et al. Protective effects of erdosteine, vitamin E, and vitamin C on renal injury induced by the ischemia-reperfusion of the hind limbs in rats. Turk J Med Sci. 2015;45(1):33–37. | ||
Duru S, Koca U, Oztekin S, et al. Antithrombin III pretreatment reduces neutrophil recruitment into the lung and skeletal muscle tissues in the rat model of bilateral lower limb ischemia and reperfusion: a pilot study. Acta Anaesthesiol Scand. 2005;49(8):1142–1148. | ||
Turchányi B, Tóth B, Rácz I, Vendégh Z, Furész J, Hamar J. Ischemia reperfusion injury of skeletal muscle after selective deafferentation. Physiol Res. 2005;54(1):25–32. | ||
Erer D, Özer A, Demirtaş H, et al. Effects of alprostadil and iloprost on renal, lung and skeletal muscle injury following hindlimb ischemia-reperfusion injury in rats. Drug Des Devel Ther. 2016;10:2651–2658. | ||
Erer D, Dursun AD, Oktar GL, et al. The effects of iloprost on lung injury induced by skeletal muscle ischemia-reperfusion. Bratisl Lek Listy. 2014;115(7):405–410. | ||
Sood H, Chauhan RS. Biosynthesis and accumulation of a medicinal compound, Picroside-I, in cultures of Picrorhiza kurroa Royle ex Benth. Plant Cell Tiss Organ Cult. 2010;100:113–117. | ||
Ansari RA, Aswal BS, Chander R, et al. Hepatoprotective activity of kutkin – the iridoid glycoside mixture of Picrorhiza kurroa. Indian J Med Res. 1988;87:401–404. | ||
Banerjee D, Maity B, Nag SK, Bandyopadhyay SK, Chattopadhyay S. Healing potential of Picrorhiza kurroa (Scrofulariaceae) rhizomes against indomethacin-induced gastric ulceration: a mechanistic exploration. BMC Complement Altern Med. 2008;8:3. | ||
Cao Y, Liu JW, Yu YJ, et al. Synergistic protective effect of picroside II and NGF on PC12 cells against oxidative stress induced by H2O2. Pharmacol Rep. 2007;59(5):573–579. | ||
He LJ, Liang M, Hou FF, Guo ZJ, Xie D, Zhang X. Ethanol extraction of Picrorhiza scrophulariiflora prevents renal injury in experimental diabetes via anti-inflammation action. J Endocrinol. 2009;200:347–355. | ||
Rajkumar V, Guha G, Kumar RA. Antioxidant and anti-neoplastic activities of Picrorhiza kurroa extracts. Food Chem Toxicol. 2011;49(2):363–369. | ||
Li Q, Li Z, Xu XY, Guo YL, Du F. Neuroprotective properties of picroside II in a rat model of focal cerebral ischemia. Int J Mol Sci. 2010;11(11):4580–4590. | ||
Li T, Liu JW, Zhang XD, Guo MC, Ji G. The neuroprotective effect of picroside II from hu-huang-lian against oxidative stress. Am J Chin Med. 2007;35(4):681–691. | ||
Gao H, Zhou YW. Inhibitory effect of picroside II on hepatocyte apoptosis. Acta Pharmacol Sin. 2005;26(6):729–736. | ||
Sud A, Chauhan RS, Tandon C. Identification of imperative enzymes by differential protein expression in Picrorhiza kurroa under metabolite accumulating and nonaccumulating conditions. Protein Pept Lett. 2013;20:826–835. | ||
Erkanli K, Kayalar N, Erkanli G, Ercan F, Sener G, Kirali K. Melatonin protects against ischemia/reperfusion injury in skeletal muscle. J Pineal Res. 2005;39(3):238–242 | ||
Li P, Matsunaga K, Yamakuni T, Ohizumi Y. Potentiation of nerve growth factor-action by picrosides I and II, natural iridoids, in PC12D cells. Eur J Pharmacol. 2000;406(2):203–208. | ||
McCord JM. Free radicals and myocardial ischemia: overview and outlook. Free Radic Biol Med. 1988;4(1):9–14. | ||
Mozaffari MS, Liu JY, Abebe W, Baban B. Mechanisms of load dependency of myocardial ischemia reperfusion injury. Am J Cardiovasc Dis. 2013;3(4):180–196. | ||
Turer AT, Hill JA. Pathogenesis of myocardial ischemia-reperfusion injury and rationale for therapy. Am J Cardiol. 2010;106(3):360–368. | ||
Zhang M, Fangfang P, Zhang R, Zhao L, Wu Y. The antioxidant effect of picroside II and the optimizing of therapeutic dose and time window in cerebral ischemic injury in rats. Merit Res J Pharm Pharm Sci. 2013;1(1):1–7. | ||
Ghiselli A, Serafini M, Natella F, Scaccini C. Total antioxidant capacity as a tool to assess redox status: critical view and experimental data. Free Radic Biol Med. 2000;29(11):1106–1114. | ||
Erel O. A novel automated direct measurement method for total antioxidant capacity using a new generation, more stable ABTS radical cation. Clin Biochem. 2004;37(4):277–285. | ||
Kim JH, Kim YC, Nahm FS, Lee PB. The therapeutic effect of vitamin C in an animal model of complex regional pain syndrome produced by prolonged hindpaw ischemia-reperfusion in rats. Int J Med Sci. 2017;14(1):97–101. | ||
Ayada C, Toru Ü, Genç O, Akcilar R, Şahin S. Balanced oxidative status by nesfatin-1 in intestinal ischemia-reperfusion. Int J Clin Exp Med. 2015;8(3):3318–3324. | ||
Nagoescu A, Lorimier P, Labat-Moleur F, et al. In situ apoptotic cell labeling by the TUNEL method: improvement and evaluation on cell preparations. J Histochem Cytochem. 1996;44(9):959–968. | ||
Grasl-Kraupp B, Ruttkay-Nedecky B, Koudelka H, Bukowska K, Bursch W, Schulte-Hermann R. In situ detection of fragmented DNA (TUNEL assay) fails to discriminate among apoptosis, necrosis, and autolytic cell death: a cautionary note. Hepatology. 1995;21(5):1465–1468. | ||
Orita Y, Nishizaki K, Sasaki J, et al. Does TUNEL staining during peri- and post-natal development of the mouse inner ear indicate apoptosis? Acta Otolaryngol Suppl. 1999;540:22–26. | ||
Li Z, Xu XY, Shen W, Guo YL. The interferring effects of picroside II on the expressions of NF-κB and I-κB following cerebral ischemia reperfusion injury in rats. Chin Pharmacol Bull. 2010;26:56–59. | ||
Wang T, Zhai L, Guo Y, Pei H, Zhang M. Picroside II has a neuroprotective effect by inhibiting ERK1/2 activation after cerebral ischemic injury in rats. Clin Exp Pharmacol Physiol. 2015;42:930–939. |
 © 2017 The Author(s). This work is published and licensed by Dove Medical Press Limited. The full terms of this license are available at https://www.dovepress.com/terms.php and incorporate the Creative Commons Attribution - Non Commercial (unported, v3.0) License.
By accessing the work you hereby accept the Terms. Non-commercial uses of the work are permitted without any further permission from Dove Medical Press Limited, provided the work is properly attributed. For permission for commercial use of this work, please see paragraphs 4.2 and 5 of our Terms.
© 2017 The Author(s). This work is published and licensed by Dove Medical Press Limited. The full terms of this license are available at https://www.dovepress.com/terms.php and incorporate the Creative Commons Attribution - Non Commercial (unported, v3.0) License.
By accessing the work you hereby accept the Terms. Non-commercial uses of the work are permitted without any further permission from Dove Medical Press Limited, provided the work is properly attributed. For permission for commercial use of this work, please see paragraphs 4.2 and 5 of our Terms.