")
Back to Journals » Drug Design, Development and Therapy » Volume 10
Effect of N-methyl deuteration on metabolism and pharmacokinetics of enzalutamide
Authors Jiang J, Pang X, Li L, Dai X, Diao X, Chen X, Zhong D, Wang Y, Chen Y
Received 25 April 2016
Accepted for publication 25 May 2016
Published 7 July 2016 Volume 2016:10 Pages 2181—2191
DOI https://doi.org/10.2147/DDDT.S111352
Checked for plagiarism Yes
Review by Single anonymous peer review
Peer reviewer comments 2
Editor who approved publication: Prof. Dr. Wei Duan
Jinfang Jiang,1,2,* Xuehai Pang,2,3,* Liang Li,1,2 Xiaojian Dai,1,2 Xingxing Diao,1 Xiaoyan Chen,1,2 Dafang Zhong,1,2 Yingwei Wang,2,3 Yuanwei Chen2–4
1State Key Laboratory of Drug Research, Shanghai Institute of Materia Medica, Chinese Academy of Sciences, Shanghai, 2University of Chinese Academy of Sciences, Beijing, 3Chengdu Institute of Organic Chemistry, Chinese Academy of Sciences, 4Hinova Pharmaceuticals Inc, Chengdu, People’s Republic of China
*These authors contributed equally to this work
Background: The replacement of hydrogen with deuterium invokes a kinetic isotope effect. Thus, this method is an attractive way to slow down the metabolic rate and modulate pharmacokinetics.
Purpose: Enzalutamide (ENT) acts as a competitive inhibitor of the androgen receptor and has been approved for the treatment of metastatic castration-resistant prostate cancer by the US Food and Drug Administration in 2012. To attenuate the N-demethylation pathway, hydrogen atoms of the N–CH3 moiety were replaced by the relatively stable isotope deuterium, which showed similar pharmacological activities but exhibited favorable pharmacokinetic properties.
Methods: We estimated in vitro and in vivo pharmacokinetic parameters for ENT and its deuterated analog (d3-ENT). For in vitro studies, intrinsic primary isotope effects (KH/KD) were determined by the ratio of intrinsic clearance (CLint) obtained for ENT and d3-ENT. The CLint values were obtained by the substrate depletion method. For in vivo studies, ENT and d3-ENT were orally given to male Sprague Dawley rats separately and simultaneously to assess the disposition and metabolism of them. We also investigated the main metabolic pathway of ENT by comparing the rate of oxidation and hydrolysis in vitro.
Results: The in vitro CLint (maximum velocity/Michaelis constant [Vmax/Km]) of d3-ENT in rat and human liver microsomes were 49.7% and 72.9% lower than those of the non-deuterated compound, corresponding to the KH/KD value of ~2. The maximum observed plasma concentration, Cmax, and area under the plasma concentration -time curve from time zero to the last measurable sampling time point (AUC0–t) were 35% and 102% higher than those of ENT when orally administered to rats (10 mg/kg). The exposure of the N-demethyl metabolite M2 was eightfold lower, whereas that of the amide hydrolysis metabolite M1 and other minor metabolites was unchanged. The observed hydrolysis rate of M2 was at least ten times higher than that of ENT and d3-ENT in rat plasma.
Conclusion: ENT was mainly metabolized through the “parent→M2→M1” pathway based on in vitro and in vivo elimination behavior. The observed in vitro deuterium isotope effect translated into increased exposure of the deuterated analog in rats. Once the carbon–hydrogen was replaced with carbon–deuterium (C–D) bonds, the major metabolic pathway was retarded because of the relatively stable C–D bonds. The systemic exposure to d3-ENT can increase in humans, so the dose requirements can be reduced appropriately.
Keywords: enzalutamide, N-methyl deuteration, deuterium kinetic isotope effect, pharmacokinetics
Introduction
In chemical reactions, the carbon–deuterium (C–D) covalent bond requires higher energy for undergoing cleavage than the carbon–hydrogen (C–H) bond. Considering the lower vibration frequency and lower zero-point energy than a corresponding C–H bond, the C–D bond is theoretically 6.9 times more stable; this phenomenon is the so-called deuterium kinetic isotope effect (DKIE).1 Selective replacement of hydrogen atoms with deuterium atoms has been used to investigate the mechanisms of metabolic transformation of molecules.2–4 In recent years, this strategy has drawn significant attention for the design of new molecular entities.5
Single-electron and hydrogen atom transfers are the two primary mechanisms of N-demethylation6–8 (Figure 1). Cleavage of the αC–H bond is the rate-limiting step; hence, when hydrogen atoms are substituted with stable deuterium, preferable pharmacokinetic properties, such as slowing down of systemic clearance, increase in bioavailability, reduction in dosing requirements, and lower metabolite loads, would be achieved.9–18 This strategy is not applicable to every compound because the differences observed in vitro do not always translate into isotope effects in vivo. However, this method is still an effective way to develop drug candidates. No deuterated drug has been approved in the market to date, but deuterated drugs have been widely investigated in preclinical studies. Moreover, several lead compounds have achieved commendable results in clinical trials. CTP-499 is a deuterated analog of the active metabolite of pentoxifylline and was developed by Concert Pharmaceuticals Inc for the treatment of diabetic nephropathy; this drug exhibited superior pharmacological activity and tolerability in clinical trials.19,20 SD-809 is a deuterated analog of tetrabenazine, developed by Teva Pharmaceutical Industries Ltd and has shown advantages for the treatment of Huntington disease.21 The company has recently nabbed a breakthrough drug designation from the US Food and Drug Administration (FDA) because of this discovery. SD-809 will be the first deuterated drug once approved. Furthermore, quite a number of deuterated compounds are under investigation in the product candidate pipeline (http://www.concertpharma.com/product-pipeline/, http://www.auspexpharma.com/pipeline/).
 | Figure 1 Mechanistic pathway for CYP450-catalyzed demethylation of alkylamines. |
Enzalutamide (ENT; Astellas Pharma US Inc, http://www.astellas.us; Figure 2) is a competitive inhibitor of the androgen receptor and impairs nuclear translocation and DNA binding, resulting in apoptosis of prostate cancer cells.22 ENT was approved by the FDA for the treatment of metastatic castration-resistant prostate cancer (mCRPC) patients who previously received docetaxel therapy.23,24 On September 10, 2014, the FDA approved ENT for the treatment of patients with chemotherapy-naïve mCRPC.25,26 The metabolic active site is the N-methyl moiety, which tends to be oxidized to hydroxymethyl-ENT and subsequently is converted to the N-demethylation metabolite M2 via cytochrome P450 catalysis; ENT is also hydrolyzed through amide bond cleavage. The predominant metabolites in humans are active M2 and the inactive carboxylic acid metabolite M1,27 which circulate at ~96%–125% and 31%–62% exposure of ENT,28 respectively. The pharmacokinetic parameters differ significantly in humans and experimental animals, eg, M2 circulates at ~10% of ENT in rats and beagle dogs.29
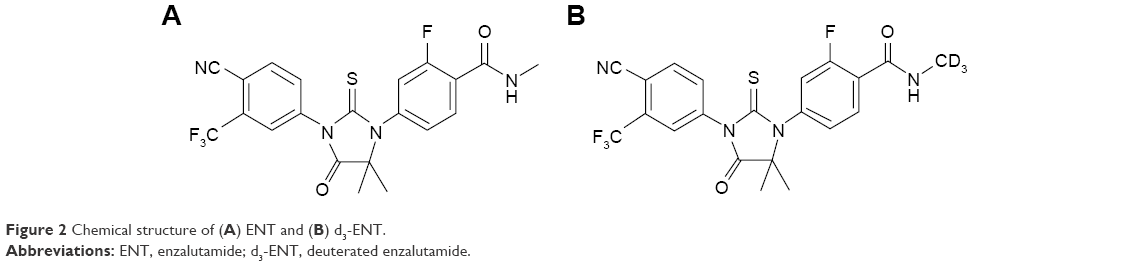 | Figure 2 Chemical structure of (A) ENT and (B) d3-ENT. |
Deuterated ENT (N-trideuteromethyl enzalutamide, d3-ENT) is a new molecular entity based on the structure of ENT. Deuterium incorporation can significantly alter the metabolic and pharmacokinetic profiles of the nondeuterated compound, thereby increasing the exposure of d3-ENT and reducing the dose requirement. Therefore, to verify this hypothesis and support further development of d3-ENT into the clinic, we evaluated the metabolic and pharmacokinetic profiles of both compounds. We also investigated the main metabolic pathway and the reason for the differences in pharmacokinetics.
Materials and methods
Chemicals and reagents
ENT (99.1% purity), d3-ENT (99.56% purity), carboxylic acid metabolite M1 (99.94% purity), and N-demethylation metabolite M2 (98.6% purity) were kindly provided by Hinova Pharmaceuticals Inc (Sichuan, People’s Republic of China). Pooled mixed-sex human, monkey, dog, rat, and mouse liver microsomes were purchased from BD Gentest (Woburn, MA, USA). Reduced nicotinamide adenine dinucleotide phosphate (NADPH) and voriconazole (100% purity) were purchased from Sigma-Aldrich Co (St Louis, MO, USA). Pure water (18.2 mΩ, total organic carbons ≤50 ppb) was obtained from a Millipore Milli-Q Gradient Water Purification System (Molsheim, France). All other chemicals, reagents, and solvents were of either analytical or high-performance liquid chromatography grade. The Declaration of Helsinki was followed for the use of human liver microsomes (HLM), but no further ethical permission was sought.
Experimental
Liver microsome incubation
Stock solutions of ENT and d3-ENT were prepared in dimethyl sulfoxide (DMSO). A mixture containing 3 μM ENT or d3-ENT was mixed with human, monkey, dog, rat, and mouse liver microsomes (HLM, cyLM, DLM, RLM, and MLM, 1 mg/mL), in addition to 100 mM phosphate-buffered saline (PBS, containing 3.2 mM MgCl2, pH 7.4), at a final volume of 200 μL. The final DMSO concentration was <0.1%. After preincubation at 37°C for 5 minutes, 2 mM NADPH was added to initiate the reactions. After incubation for 4 hours, an equal volume of ice-cold acetonitrile was added to terminate each reaction. Control samples without NADPH or microsomes were also prepared. Samples were duplicated. After centrifugation at 11,000× g for 5 minutes, the supernatants were evaporated to dryness under N2 stream at 40°C. The residues were reconstituted in 100 μL water/acetonitrile (90:10, v/v). Then, a 7.0 μL aliquot of the reconstituted solution was injected into the ultra-high-performance liquid chromatography (UPLC)/quadrupole time-of-flight mass spectrometry (Q-TOF MS) system for analysis.
Hydrolysis of ENT, d3-ENT, and M2 in vitro
Compound stock solutions were prepared by dissolving an appropriate amount of ENT, d3-ENT, and M2 in DMSO. These stock solutions were diluted to 2 μM with 100 mM phosphate buffer (pH 7.4), and 1,000 μL of this solution was added to 1,000 μL fresh rat plasma (heparin anticoagulated). The final substrate concentration was 1 μM. The final assay solvent concentration was <0.1% DMSO. The incubation mixtures were immersed in a water bath at 37°C for up to 6 hours. At various time points, 50 μL of each incubation mixture was precipitated by adding 125 μL acetonitrile (containing the internal standard, voriconazole). The accurate analyte concentrations were quantified by liquid chromatography–tandem mass spectrometry (LC-MS/MS). Similarly, analytes were incubated with NaF- or (bis (4-nitrophenyl) phosphate) (BNPP)-treated plasma. The hydrolysis rate constant ke was calculated using Equation 1, as follows:
Ct/C0 = exp(−ket) | (1) |
where Ct represents the substrate concentration at various time points, C0 is the initial concentration, and ke is the elimination rate constant (expressed in units of reciprocal time, ie, h−1). The elimination rate constant was used to calculate the elimination half-life (t½); ke and t½ were calculated using Prism5.0 (GraphPad Software Inc, La Jolla, CA, USA).
The N-demethylation metabolite M2 was intravenously dosed to assess the actual disposition in rats: the M2 (1 mg/mL) solution (in saline containing 1% polyethylene glycol-200 and 1% Tween-80, vol%) was given intravenously to three male Sprague Dawley rats (weighing ~200 g). The time points were as follows: predose (0 minute); 5 minutes, 15 minutes, 30 minutes, and 60 minutes postdose; and 1.5 hours, 2 hours, 4 hours, 6 hours, 8 hours, 10 hours, 12 hours, and 24 hours postdose. A 25 μL aliquot of plasma was precipitated immediately by adding 125 μL acetonitrile (containing internal standard voriconazole) and was stored at −20°C before analysis.
Enzyme kinetics in liver microsomes
Enzyme kinetic parameters of ENT and d3-ENT were evaluated in RLM and HLM (final concentration: 1.0 mg/mL). The conditions for incubation were optimized to be linear in terms of incubation time and protein concentration. The incubation volume was 100 μL, and the substrate concentrations ranged from 0.147 μM to 90 μM. Preincubation was performed at 37°C for 5 minutes and then NADPH (final concentration: 2 mM) was added to initiate the reaction. Incubation times were 2 hours and 3 hours for RLM and HLM, respectively. Control samples were studied in parallel using thermally inactivated liver microsomes. Reactions were terminated by adding an equal volume of ice-cold acetonitrile and then vortexed. Twenty-five microliters of the internal standard voriconazole, 25 μL of each sample, and 125 μL acetonitrile were added to a polypropylene tube. Samples were mixed and centrifuged at 11,000× g for 5 minutes, and the supernatant was injected into the LC-MS/MS system. Data are presented as averages of duplicate experiments. Kinetic constants were obtained by fitting the Michaelis–Menten equation shown as Equation 2 to experimental data using nonlinear regression (Prism 5.0; GraphPad Software Inc).
ν = Vmax ×S/(Km+S) | (2) |
where v is the reaction velocity, Vmax is the maximum velocity, Km is the Michaelis constant (substrate concentration at 0.5Vmax), and S is the substrate concentration. In vitro CLint was calculated as Vmax/Km. The fitness of the model was estimated based on Eadie–Hofstee plots (corresponding to V against V/S) and the calculated correlation coefficient.
Single-dosing rat pharmacokinetic study
The d3-ENT capsule contents were dissolved in caprylocaproyl macrogolglycerides at a concentration of 40 mg/mL. A total of eleven male Sprague Dawley rats were randomly divided into three groups (A group, four rats; B group, four rats; C group, three rats). The A and B groups were orally given 20 mg/kg ENT and d3-ENT, respectively. The blood-sampling time points were predose (0 minute) and 0.5 hour, 1 hour, 3 hours, 5 hours, 7 hours, 9 hours, 24 hours, 48 hours, 72 hours, 96 hours, and 120 hours postdose. Group C was given a 1:1 formulation of ENT and d3-ENT (10/10 mg/kg) by oral administration. The blood-sampling time points were predose (0 hour) and 1 hour, 2 hours, 3 hours, 5 hours, 6 hours, 8 hours, 12 hours, 24 hours, 48 hours, 72 hours, 96 hours, and 120 hours postdose. Rat plasma sample (100 μL) was added to 5 μL BNPP (0.5 mol/L, carboxylesterase inhibitor), and the samples were stored at −20°C after thorough vortexing. The animal study was ethically and legally approved by the IACUC of Shanghai Institute of Materia Medica. All rodent studies were also carried out in accordance with the Guidelines for Care and Use of Laboratory Animals approved by the Shanghai Institute of Materia Medica, Chinese Academy of Sciences (Shanghai, People’s Republic of China).
Analytical condition
Metabolite profiling by UPLC-ultraviolet/Q-TOF-MS
Metabolic profiling of ENT and d3-ENT in biologic samples was performed on a Waters Acquity UPLC system (Waters, Milford, MA, USA) equipped with a binary solvent delivery pump, a column oven, an ultraviolet (UV) detector, and an autosampler. Chromatographic separation was performed on an Acquity UPLC HSS T3 column (100×2.1 mm, inner diameter 1.8 mm; Waters) at 45°C. The UV detection wavelength was set at 236 nm. The mobile phase consisted of 5 mM ammonium acetate in water containing 0.5% formic acid (solvent A) and acetonitrile (solvent B) at a flow rate of 0.4 mL/min. Elution started with a 2 minute isocratic run with 10% solvent B, followed by a linear gradient from 10% to 55% of solvent B in 14 minutes and from 55% to 99% of solvent B in 2 minutes, and then turned to 10% solvent B to equilibrate the column. MS detection was conducted on a triple TOF 5600+ MS/MS system (AB Sciex, Concord, ON, Canada) in negative electrospray ionization mode. Mass range was set at mass-to-charge ratio (m/z) 100–1,000. The following parameter settings were used: ion spray voltage: −4,500 V; declustering potential: −80 V; ion source heater: 500°C; curtain gas: 40 psi; ion source gas 1: 55 psi; ion source gas 2: 55 psi. For TOF MS scans, collision energy was −10 eV; for product ion scans, collision energy was −40 eV, and the collision energy spread was 10 eV. Data were acquired via full scan and information-dependent acquisition (IDA)-triggered product ion scans with mass defect filter. The real-time multiple mass defect filter was used for IDA criteria.
Analyst®TF V1.6 (AB Sciex) and Masslynx V4.1 software (Waters) were applied for data processing and acquisition, and PeakView® V1.2 and MetabolitePilot V1.5 of AB Sciex were used for data analysis. Mass defect filtering was used to screen metabolites with a 40 mDa filter between the filter and the target metabolites. The fragment ion spectra were compared between the parent compound and the metabolites to help identify the potential metabolites.
Preclinical bioanalysis in rat pharmacokinetic studies
Quantification of ENT, d3-ENT, and the major metabolites M1 and M2 was accomplished by applying a nonvalidated LC-MS/MS method. Calibration curve (nine-point) concentration ranges were 5.00–10,000 ng/mL for d3-ENT and M1, and 2.00–4,000 ng/mL for M2. For each analyte, the calibration curve was fitted with a linear least-squares regression model (y =1/x2). Calibration samples were extracted alongside study samples. Aliquots (25 μL) of either calibrant or study plasma sample were added to a 1.5 mL polypropylene tube, and then 25 μL of internal standard solution was added, followed by addition of 100 μL acetonitrile to precipitate proteins, then vortexed and centrifuged at 11,000× g for 5 minutes; finally, the supernatant was injected into LC-MS/MS system.
An LC-30AD liquid chromatographic system (Shimadzu, Kyoto, Japan) coupled to a Triple Quad 5500 mass spectrometer (AB Sciex) was used for acquiring LC-MS/MS data. Analyst V1.6 software (AB Sciex) was used for data processing. Chromatographic separation was conducted on an Eclipse Plus C18 column (100×4.6 mm, inner diameter 3.5 μm; Agilent Technologies, Santa Clara, CA, USA), which was maintained at 45°C. The mobile phases used for isocratic elution were 30% (solvent A) 5 mM ammonium acetate–formic acid (100/0.5, v/v) and 70% (solvent B) methanol. The flow rate was 0.65 mL/min (0.3–0.9 minutes: 0.9 mL/min; 4.05–4.9 minutes: 1.2 mL/min). The mass spectrometer equipped with an electrospray ionization source was operated in the positive multiple reaction monitoring mode. The ion spray voltage and source temperature were set to 5,500 V and 500°C, respectively. The nebulizer gas, heater gas, curtain gas, and collision-activated dissociation gas were optimized at 50 psi, 50 psi, 30 psi, and 9 psi, respectively. Samples were detected using multiple reaction monitoring, and the parent-to-product transitions were m/z 465.2 →209.2 for ENT, m/z 468.2→212.2 for d3-ENT, m/z 452.2→196.2 for M1, m/z 451.2→195.2 for M2, and m/z 350.2→127.2 for voriconazole. The collision energy was set at 21 eV, 21 eV, 32 eV, 32 eV, and 30 eV, respectively. The dwell time for each transition was set at 100 ms.
Data analysis
The pharmacokinetic parameters were calculated by a noncompartmental model using WinNonlin software V5.3 (Pharsight, St Louis, MO, USA). Area under the plasma concentration–time curve from time zero to the last measurable sampling time point (AUC0–t) was calculated under the linear–trapezoidal rule. The elimination half-life (t½) was calculated using the expression t½=0.693/ke, where the terminal elimination phase rate constant (ke) was estimated using the least-squares regression analysis of the concentration–time data in the terminal log-linear phase. AUC0–t, Cmax, mean residence time, and t½ were transformed into a logarithmic form and analyzed with Student’s two-sided t-test. The time to Cmax, Tmax, was analyzed with Wilcoxon rank sum test; a probability value of P<0.05 was considered to be significant.
Results
Mass fragmentation behavior of parent and major metabolites
The metabolites of ENT and d3-ENT were identified by comparing their chromatographic and MS fragmentation behavior with those of the parent drug and the synthesized reference standards. The UPLC/Q-TOF MS data are listed in Table 1.
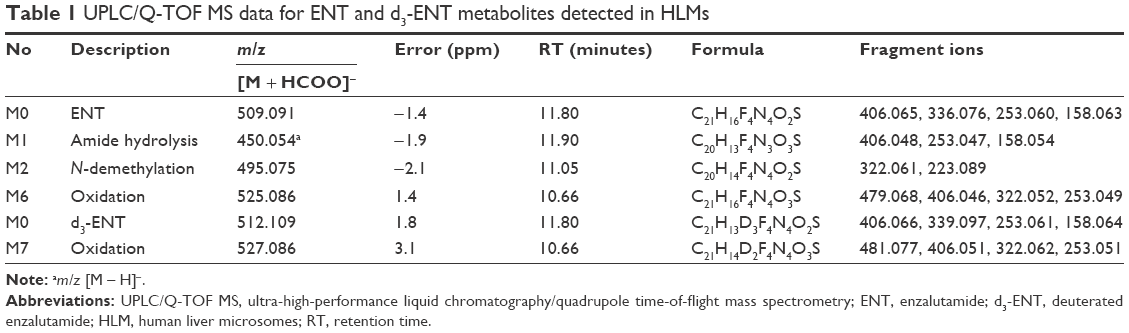 | Table 1 UPLC/Q-TOF MS data for ENT and d3-ENT metabolites detected in HLMs |
Parent drugs ENT and d3-ENT
Chromatographic peaks were detected at 11.8 minutes during HLM incubation, with elemental compositions of C21H16F4-N4O2S and C21H13D3F4N4O2S. The molecular weights were 509.091 Da and 512.109 Da ([M + HCOO]−). The retention time and mass spectral fragmentation patterns were identical to those of the parent drugs, indicating that these compounds were unchanged ENT and d3-ENT.
Metabolite M1
M1 had a retention time of 11.9 minutes, exhibited a deprotonated molecule at m/z 450.054 in the Q1 full scan spectrum, and had a derived formula of C20H13F4N3O3S. The product ion spectrum showed three fragment ions at m/z 406.048, 253.047, and 158.054, which were consistent with the reference standard of M1. M1 was a major metabolite in rat plasma, urine, and feces.
Metabolite M2
M2 was eluted at 11.1 minutes and displayed a molecule at m/z 495.075 ([M + HCOO]−). The product ion spectrum showed two fragment ions at m/z 322.061 and 223.089, which were consistent with the reference standard of M2. M2 was a major metabolite in rat plasma, with trace amounts in urine and feces.
Metabolites M6 and M7
The extracted ion chromatograms of m/z 525.086 (M6) and 527.098 (M7, [M + HCOO]−) showed peaks at 10.6 minutes during incubation of liver microsomes and rat plasma, with elemental compositions of C21H16F4N4O3S and C21H14D2F4N4O3S. The molecules were 15.99 Da larger than the parent drugs ENT and d3-ENT. This finding indicated N-methyl monooxidation (N-CH2OH and N-CD2OH). In addition, the fragmention patterns of the two metabolites were at m/z 479.068, 406.046, 322.052, and 253.049 and at m/z 481.077, 406.051, 322.062, and 253.051. The fragment ion of M6 at m/z 479.068 was 2 Da smaller than the corresponding fragment ion of M7, indicating that the oxidation site was on the N-CD3 moiety of d3-ENT. This chain was transformed to N-CD2OH through oxidation. M6 and M7 were precursors of M2 and the major metabolites in HLM, but these were barely detectable in rat plasma, urine, and feces.
Metabolite M4
M4 was eluted at 10.8 minutes and displayed a molecule at m/z 496.137 ([M + HCOO]−) with an elemental composition of C21H13D3F4N4O3. The product ion spectrum showed three fragment ions at m/z 390.098, 253.066, and 158.076. The accurate fragment ion of M4 at m/z 390.098 indicated that the atom S was substituted by O in the five-membered heterocycle of d3-ENT, and the ions at m/z 253.066 and 158.076 indicated that the N-CD3 side chain remained unaltered. M4 could be detected in rat plasma and feces after administration of d3-ENT.
Metabolite M5
The extracted ion chromatograms of m/z 434.076 ([M – H]−) showed a peak at 11.2 minutes with an elemental composition of C20H13F4N3O4. The product ions were m/z 390.083, 253.056, and 158.059. The fragment ion of M5 at m/z 390.083 was 16 Da smaller than that at m/z 406.048 of M1. This result was attributed to the substitution of S by O in the five-membered heterocycle. M5 was found to be a major metabolite in rat urine and feces, but not in plasma.
In vitro metabolism
Liver microsome incubation
As shown in Figure 3, after microsomal incubation for 4 hours, ~30% of the ENT was consumed in liver microsomes from different species. M1 could be detected in liver microsomes without NADPH after incubation for 4 hours and 24 hours, indicating that M1 was partially independent of NADPH. After incubation for 4 hours, M6, M7, M1, and M2 were the primary metabolites (Table 1). Comparatively, the N-CD2OH metabolite M7 from d3-ENT was markedly lower by 5.03, 3.14, 2.39, 9.62, and 11.8 folds in HLM, cyLM, DLM, RLM, and MLM than the metabolite M6 (Figure 3). This observation resulted in a KH/KD value of ~11.8 at most, indicating that DKIE was involved in the C–D bond cleavage of d3-ENT. The remnant proportion of parent for d3-ENT was much greater than ENT when incubated with liver microsomes for 24 hours (data not shown).
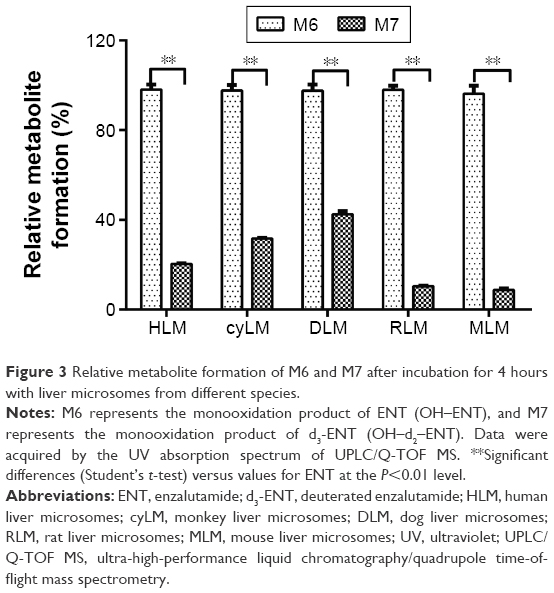 | Figure 3 Relative metabolite formation of M6 and M7 after incubation for 4 hours with liver microsomes from different species. |
Hydrolysis of ENT, d3-ENT, and M2 in vitro
The hydrolytic velocities in rat plasma incubations are shown in Figure 4. After incubation for 6 hours in rat plasma at 37°C, ~10% of ENT and d3-ENT were hydrolyzed to M1, and ~70% of M2 was hydrolyzed. The calculated values of ke for ENT, d3-ENT, and M2 in rat plasma were 0.00954 h−1, 0.00691 h−1, and 0.0838 h−1, and the calculated values of t½ were 72.6 hours, 100.3 hours, and 8.27 hours. NaF and BNPP both inhibited the hydrolysis markedly. These results demonstrated that the hydrolytic velocity of M2 was at least tenfold higher than that of ENT and d3-ENT. When M2 was intravenously administered to rats, M2 was linearly hydrolyzed to M1 (Figure 5), and 41% of M2 was hydrolyzed to M1 after administration for 30 minutes. M1 was the only detected metabolite in rat plasma after M2 was administered (data not shown).
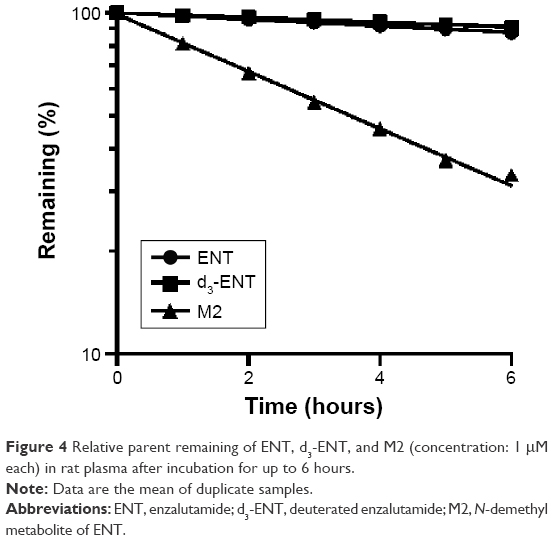 | Figure 4 Relative parent remaining of ENT, d3-ENT, and M2 (concentration: 1 μM each) in rat plasma after incubation for up to 6 hours. |
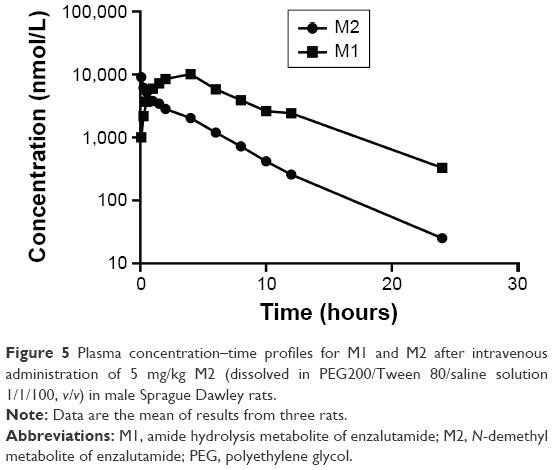 | Figure 5 Plasma concentration–time profiles for M1 and M2 after intravenous administration of 5 mg/kg M2 (dissolved in PEG200/Tween 80/saline solution 1/1/100, v/v) in male Sprague Dawley rats. |
Enzyme kinetics in liver microsomes
Transformed substrate saturation curves that compare rates of substrate depletion in rat and human microsomes are provided in Figure 6, and the CLint values are listed in Table 2. Only M6 or M7, M1, and M2 were detected for up to 3 hours in HLM. A marked amount of M1 was detected during RLM incubation. The curves were transformed using the Michaelis–Menten method. For RLM (Figure 6A), deuteration had no marked effect on the Km (79.6 μM versus 71.5 μM); for HLM (Figure 6B), Km of d3-ENT was much lower than that of ENT (12.6 μM versus 36.7 μM), and the Vmax was much lower (6.51 pmol/min/mg protein versus 32.8 pmol/min/mg protein). CLint values for d3-ENT were reduced by 50%–73% in both RLM and HLM when compared with the unlabeled compound; this CLint corresponded to a KH/KD value of ~2. Eadie–Hofstee plots of both compounds in HLM demonstrated biphasic kinetics. This observation indicated that multiple cytochrome isoforms were involved in the oxidation, although the reactions were fitted by a one-enzyme model appropriately.
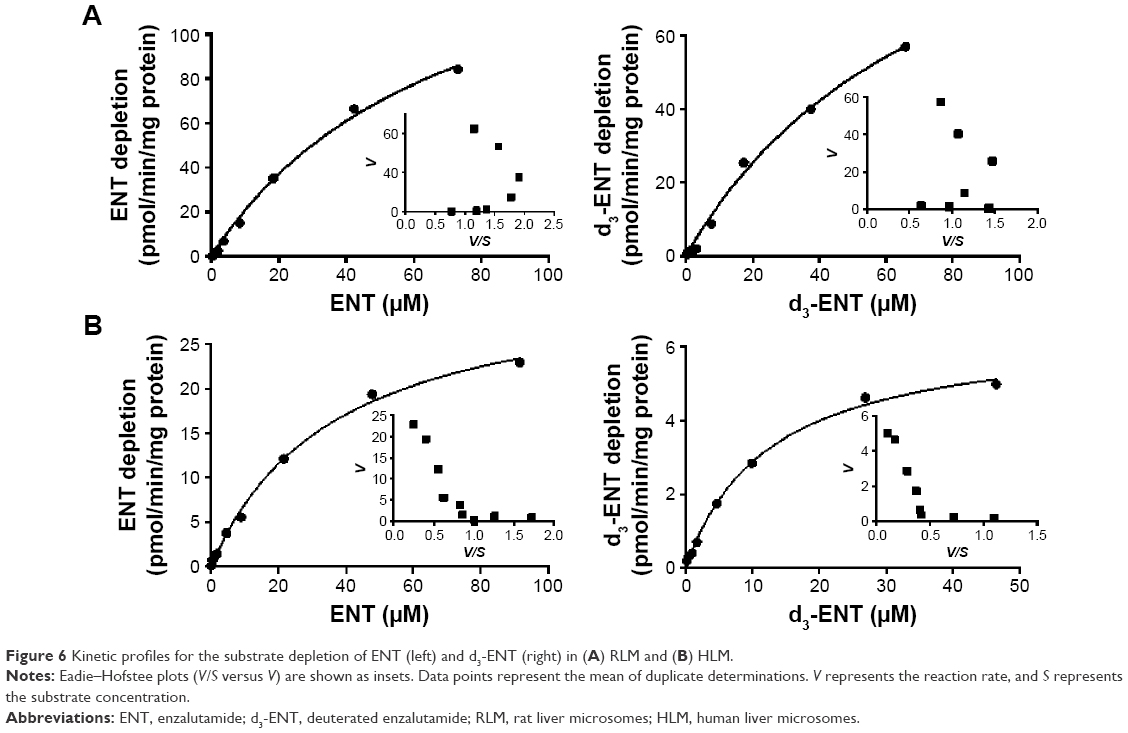 | Figure 6 Kinetic profiles for the substrate depletion of ENT (left) and d3-ENT (right) in (A) RLM and (B) HLM. |
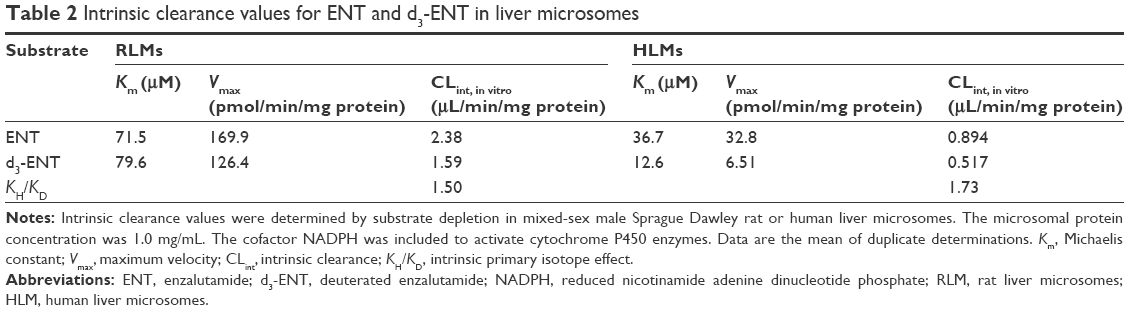 | Table 2 Intrinsic clearance values for ENT and d3-ENT in liver microsomes |
Determining the exact kinetic parameters was impossible using models describing the involvement of more than one enzyme because of the multiphasic nature of the Eadie–Hofstee plots as well as the long incubation period with liver microsomes (>1 hour). These factors have led to inaccuracy of the kinetic parameters. However, relative quantification of metabolic rates has been accomplished, which helps to characterize the influence of the deuterated compound relative to ENT.
Single-dosing rat pharmacokinetic study
The proposed metabolic pathway of d3-ENT in rats is shown in Figure 7. A total of five major metabolites were detected in rat plasma, including the N-demethylation metabolite M2, amide hydrolysis metabolite M1, monooxide metabolite M7, S-substituted-to-O metabolite M4, and amide hydrolysis-and-further metabolite M5. M4 was undetected when ENT was administered, but the nondeuterated ones were detected. Among these, M1 and M2 were the major circulating metabolites. After a single oral dosing of ENT to male rats, exposures of M1 and M2 to ENT were 69.7% and 8.30%, respectively; the values were 61.9% and 1.02% when dosed with d3-ENT (Figure 8). The formation ratio of M2 was decreased by eightfold, whereas M1 was nearly unchanged. The exposure ratio of M1 to M2 was altered from 8.39:1 to 60.7:1, indicating the occurrence of “metabolic switching”.
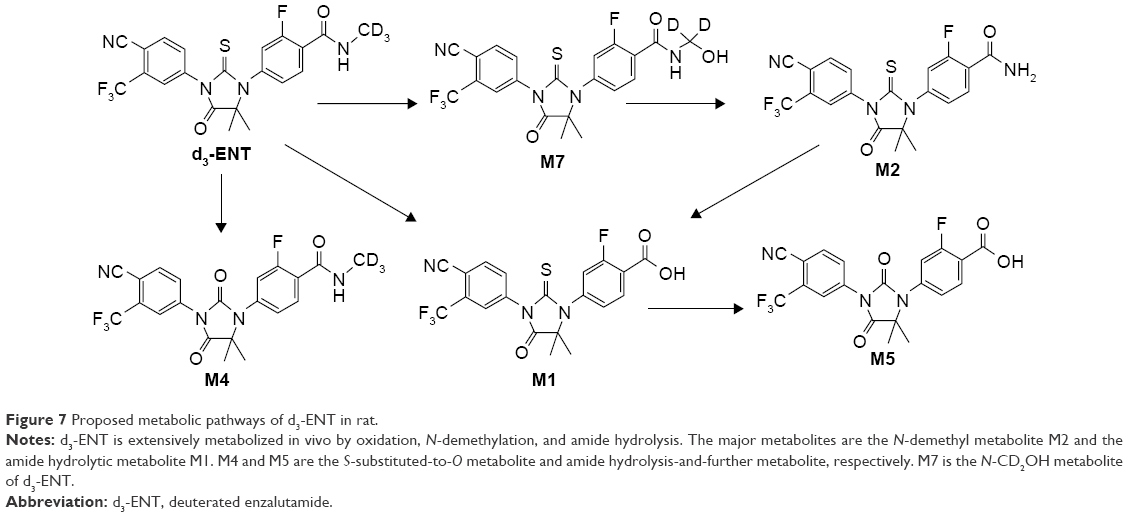 | Figure 7 Proposed metabolic pathways of d3-ENT in rat. |
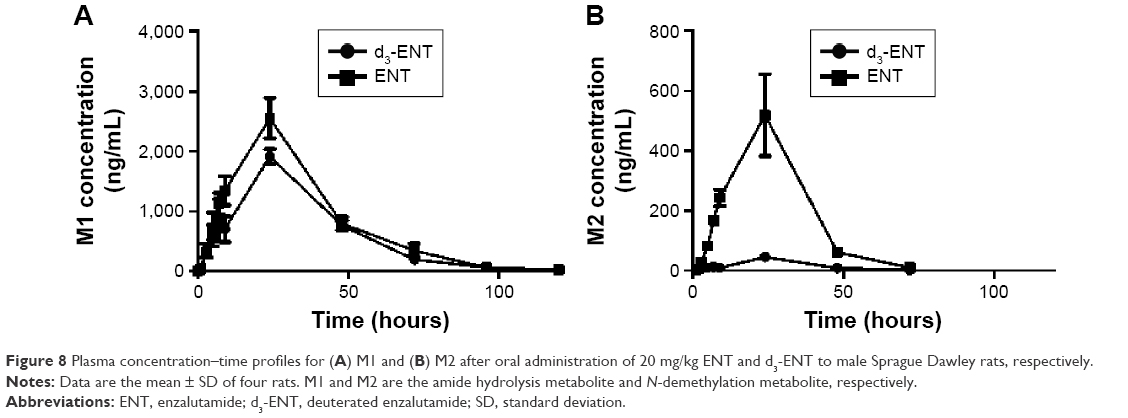 | Figure 8 Plasma concentration–time profiles for (A) M1 and (B) M2 after oral administration of 20 mg/kg ENT and d3-ENT to male Sprague Dawley rats, respectively. |
To minimize individual differences between rats, a formulation mixture of ENT and d3-ENT (10/10 mg/kg) was simultaneously administered (Figure 9). Pharmacokinetic curves showed the double-peak phenomenon. The Cmax of d3-ENT increased by 35% (3,055±229 ng/mL versus 2,258±193 ng/mL), and AUC0–t increased by 102% (104,401±6,393 h·ng/mL versus 51,483±2,904 h·ng/mL) in male rats. The elimination half-life t½ was extended by 6 hours (11.9±2.4 hours versus 18.4±2.2 hours), and the mean residence time was extended by 10 hours (18.1±0.5 hours versus 28.6±3.7 hours) for d3-ENT. The detailed pharmacokinetic parameters in rats are presented in Table 3.
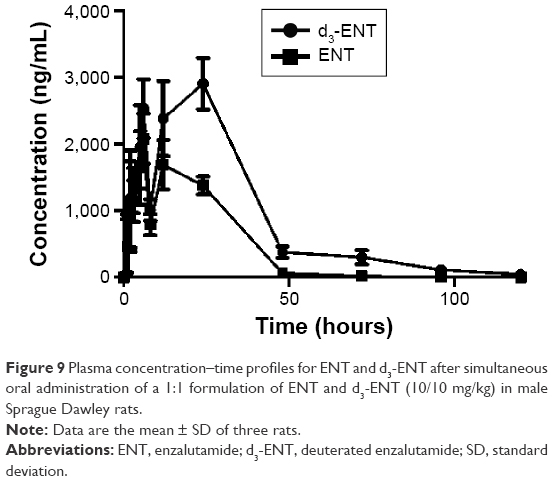 | Figure 9 Plasma concentration–time profiles for ENT and d3-ENT after simultaneous oral administration of a 1:1 formulation of ENT and d3-ENT (10/10 mg/kg) in male Sprague Dawley rats. |
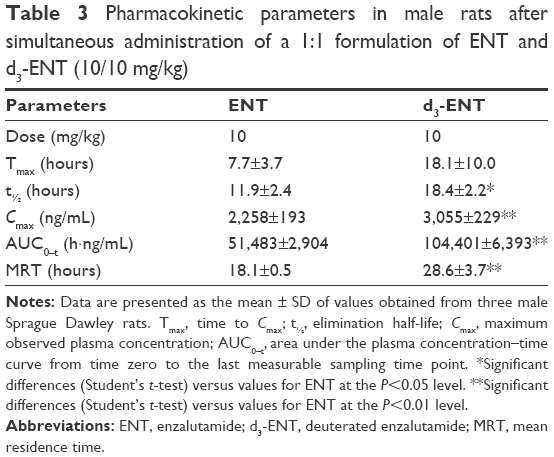 | Table 3 Pharmacokinetic parameters in male rats after simultaneous administration of a 1:1 formulation of ENT and d3-ENT (10/10 mg/kg) |
Discussion
Deuterium substitution is an attractive way to increase drug exposure by slowing down the oxidative metabolic rate. Researchers often screen superior drug candidates through hydrogen substitution at various sites of the molecule.30,31 However, observations of decreased rate of biotransformation reactions in vitro do not translate into isotope effects in vivo for all cases.32,33 Deuterated propofol showed nearly no alteration when compared with nondeuterated analog in vivo mainly because the primary metabolic pathway was glucuronidation rather than oxidation.34 Another trial has been made to retard the N-demethylation step in the case of imatinib, but no difference was observed in rats.35 In vivo deuterium replacement strategies may be confounded by metabolic switching and may be challenged by the various metabolic pathways.31
ENT was already listed among the first-line drugs for the treatment of prostate cancer, and its relevant data can be acquired through FDA or Astellas Inc Web sites. The N-methyl group is the primary metabolic site of ENT in different species, mainly metabolized through N-demethylation and amine hydrolysis. We have investigated the difference in metabolic rate and pharmacokinetic characters of ENT and d3-ENT. The CLint values of d3-ENT in RLM and HLM were 49.7% and 72.9% lower than that of ENT, resulting in the KH/KD value of ~2 in vitro. A significant challenge occurred when estimating the kinetic parameters of ENT and d3-ENT because both of them are low-clearance drugs. No metabolites were detected during incubation with HLM (1 mg/mL) for 1 hour, which was believed to be the typical incubation condition. Approximately 30% of the parent drug was oxidized after 4-hour incubation in HLM, and the amounts of M6 and M7 showed linear increases between 0 hour and 4 hours. To retain the enzyme activities, the incubation time was set at 3 hours rather than 4 hours in HLM and 2 hours in RLM. The data were not entirely accurate compared with those obtained under typical conditions because the enzyme activity decreased over time. However, relative quantification of metabolic rates was achieved, which helped to characterize the influence of deuteration on ENT. CLint can be estimated based on the rate of depletion of the parent drug or formation of the specific metabolite. In this study, KH/KD values of 3.14–11.8 were observed based on the N-CD2OH or N-CH2OH metabolite (precursor of M2) formation method. However, the results obtained by this metabolite formation method have overestimated the in vivo isotope effect observed in rats. KH/KD values of 1.5–1.73 were acquired based on the parent depletion method and were close to the exposure difference in vivo. Therefore, inaccuracies caused by other compensative pathways could be alleviated using the parent drug depletion method as in vitro evaluation model. Stringer et al12 observed similar results when evaluating deuterated NVS-CRF-38 in vitro and in vivo.
Apart from the N-demethylation pathway, ENT was also eliminated through amide hydrolysis, but significant differences in the two metabolic pathways among species were observed in vivo, as well as for d3-ENT. Uncertainties could crop up in predicting the clinical usage. Despite these known differences in the quantitative aspects of animal metabolism, preclinical pharmacokinetic studies still serve as an important means to assess human pharmacokinetics and safety of drug candidates before clinical studies in humans. Rat plasma hydrolysis experiments demonstrated that the hydrolytic rate of M2 was nearly tenfold higher than that of the parent drug. Hence, we could make the prediction that the high exposure of M1 in vivo was mainly hydrolysis from M2 rather than from the parent drug. In other words, ENT was mainly metabolized through “parent→M2→M1” pathway. Once deuterated, formation to M2 was retarded owing to DKIE, leading to a remarkable increment in the exposure of d3-ENT. The observed in vitro isotope effect was in accordance with in vivo pharmacokinetic changes in laboratory animals. Except for the two primary metabolites, other metabolites were insignificantly increased as a result of the suppression of the N-demethylation pathway.
One of the consequences of deuteration is “metabolic switching”. Selected deuteration has been made on paroxetine by Concert Pharmaceuticals Inc and thereby the formation of reactive metabolites and further inhibition by CYP2D6 were reduced.18 In this study, the consequence of “metabolic switching” was the reduction of the formation rate of M2, but not of M1. After oral dosing of ENT to male rats, exposures of M1 and M2 to ENT were 69.7% and 8.30%, respectively; the values were 61.9% and 1.02% when equally dosed with d3-ENT. The formation ratio of M2 to parent drug was reduced by ~7%, whereas the AUC0–t of d3-ENT increased by onefold. In general, the exposures of pharmacologically active d3-ENT and M2 were increased.
In vitro KH/KD value of ~1.5 in RLM translated into a twofold difference of AUC0–t in rats. Therefore, a significant difference in AUC0–t could be achieved with the isotope effect of KH/KD value of ~1.73 in HLM. The increased exposure of d3-ENT in rats is a promising observation, and the obvious difference in pharmacokinetics is advantageous to support the further development of this deuterated analog. The key role of deuteration strategy in the development of new drug candidates has been verified once again.
Conclusion
In vitro and in vivo pharmacokinetic parameters for both nondeuterated and deuterated ENT were estimated in this study. The in vitro CLint values of the deuterated compound in RLM and HLM were 49.7% and 72.9% lower based on the parent depletion method, resulting in a KH/KD value of ~2; the Cmax and AUC0–t were 35% and 102% higher when the deuterated compound was orally administered to rats compared with the values for the non-deuterated compound. The AUC0–t of d3-ENT would increase significantly in humans and thus the dose requirement could be reduced appropriately.
Acknowledgments
The study was supported by the National Science and Technology Major Project “Key New Drug Creation and Manufacturing Program” of People’s Republic of China (grant number 2014ZX09304002-008-001), the National Natural Science Foundation of China (grant number 81521005), and the Project of Shanghai Institute of Materia Medica for “State Key Laboratory of New Drug Research” (grant number SIMM1501ZZ-02).
Disclosure
The authors report no conflicts of interest in this work.
References
Wiberg KB. The Deuterium isotope effect. Chem Rev. 1955;55(4):713–743. | ||
Parli CJ, McMahon RE. The mechanism of microsomal deamination: heavy isotope studies. Drug Metab Dispos. 1973;1(1):337–341. | ||
Mutlib AE, Gerson RJ, Meunier PC, et al. The species-dependent metabolism of efavirenz produces a nephrotoxic glutathione conjugate in rats. Toxicol Appl Pharmacol. 2000;169(1):102–113. | ||
Mutlib AE. Application of stable isotope-labeled compounds in metabolism and in metabolism-mediated toxicity studies. Chem Res Toxicol. 2008;21(9):1672–1689. | ||
Katsnelson A. Heavy drugs draw heavy interest from pharma backers. Nat Med. 2013;19(6):656. | ||
Wang Y, Kumar D, Yang C, Han K, Shaik S. Theoretical study of N-demethylation of substituted N,N-dimethylanilines by cytochrome P450: the mechanistic significance of kinetic isotope effect profiles. J Phys Chem B. 2007;111(26):7700–7710. | ||
Li C, Wu W, Cho KB, Shaik S. Oxidation of tertiary amines by cytochrome p450-kinetic isotope effect as a spin-state reactivity probe. Chemistry. 2009;15(34):8492–8503. | ||
Cerny MA, Hanzlik RP. Cytochrome P450-catalyzed oxidation of N-benzyl-N-cyclopropylamine generates both cyclopropanone hydrate and 3-hydroxypropionaldehyde via hydrogen abstraction, not single electron transfer. J Am Chem Soc. 2006;128(10):3346–3354. | ||
Harbeson SL, Tung RD. Deuterium medicinal chemistry: a new approach to drug discovery and development. Medchem News. 2014;2:8–22. | ||
Gant TG. Using deuterium in drug discovery: leaving the label in the drug. J Med Chem. 2014;57(9):3595–3611. | ||
Zhang Y, Tortorella MD, Wang Y, et al. Synthesis of deuterated benzopyran derivatives as selective COX-2 inhibitors with improved pharmacokinetic properties. ACS Med Chem Lett. 2014;5(10):1162–1166. | ||
Stringer RA, Williams G, Picard F, et al. Application of a deuterium replacement strategy to modulate the pharmacokinetics of 7-(3,5-dimethyl-1H-1,2,4-triazol-1-yl)-3-(4-methoxy-2-methylphenyl)-2,6-dimethylp yrazolo[5,1-b]oxazole, a novel CRF1 antagonist. Drug Metab Dispos. 2014;42(5):954–962. | ||
Xu R, Zhan M, Peng L, et al. Design, synthesis and biological evaluation of deuterated nintedanib for improving pharmacokinetic properties. J Labelled Comp Radiopharm. 2015;58(7):308–312. | ||
Morgan AJ, Nguyen S, Uttamsingh V, et al. Design and synthesis of deuterated boceprevir analogs with enhanced pharmacokinetic properties. J Labelled Comp Radiopharm. 2011;54(9):613–624. | ||
Guo S, Pang X, Peng L, et al. Design, synthesis and biological evaluation of deuterated Tivozanib for improving pharmacokinetic properties. Bioorg Med Chem Lett. 2015;25(11):2425–2428. | ||
Shao L, Abolin C, Hewitt MC, Koch P, Varney M. Derivatives of tramadol for increased duration of effect. Bioorg Med Chem Lett. 2006;16(3):691–694. | ||
Zhu YQ, Zhou J, Jiao B. Deuterated clopidogrel analogues as a new generation of antiplatelet agents. ACS Med Chem Lett. 2013;4(3):349–352. | ||
Uttamsingh V, Gallegos R, Liu JF, et al. Altering metabolic profiles of drugs by precision deuteration: reducing mechanism-based inhibition of CYP2D6 by paroxetine. J Pharmacol Exp Ther. 2015;354(1):43–54. | ||
Graham P, Sabounjian L, Shipley J, et al. Safety, tolerability and pharmacokinetics of Ctp-499 in a multi-center, double-blind, two-arm, placebo-controlled, randomized study in non-dialysis patients with stage 3 chronic kidney disease. Am J Kidney Dis. 2012;59(4):A38–A38. | ||
Braman V, Graham P, Cheng CF, et al. A randomized phase I evaluation of CTP-499, a novel deuterium-containing drug candidate for diabetic nephropathy. Clin Pharmacol Drug Dev. 2013;2(1):53–66. | ||
Testa C, Stamler D, Frank S. Testing the safety and efficacy of SD-809 for symptomatic treatment of chorea in Huntington disease. Neurotherapeutics. 2014;11(1):222–223. | ||
Tran C, Ouk S, Clegg NJ, et al. Development of a second-generation antiandrogen for treatment of advanced prostate cancer. Science. 2009;324(5928):787–790. | ||
Scher HI, Fizazi K, Saad F, et al; AFFIRM Investigators. Increased survival with enzalutamide in prostate cancer after chemotherapy. N Engl J Med. 2012;367(13):1187–1197. | ||
Ning YM, Pierce W, Maher VE, et al. Enzalutamide for treatment of patients with metastatic castration-resistant prostate cancer who have previously received docetaxel: U.S. Food and Drug Administration drug approval summary. Clin Cancer Res. 2013;19(22):6067–6073. | ||
Beer TM, Armstrong AJ, Rathkopf DE, et al. Enzalutamide in metastatic prostate cancer before chemotherapy. N Engl J Med. 2014;371(5):424–433. | ||
Ning YM, Brave M, Maher VE, et al. U.S. Food and Drug Administration approval summary: enzalutamide for the treatment of patients with chemotherapy-naive metastatic castration-resistant prostate cancer. Oncologist. 2015;20(8):960–966. | ||
Astellas Pharma US, Inc. [webpage on the Internet]. XTANDI® (enzalutamide) Capsules for Oral Use; 2012. Available from: http://www.accessdata.fda.gov/drugsatfda_docs/label/2012/203415lbl.pdf. Accessed September 23, 2013. | ||
Gibbons JA, Ouatas T, Krauwinkel W, et al. Clinical pharmacokinetic studies of enzalutamide. Clin Pharmacokinet. 2015;54(10):1043–1055. | ||
Pharmaceuticals and Medical Devices Agency [webpage on the Internet]. mdv3100. Available from: http://ss.pmda.go.jp/ja_all/search.x?q=mdv3100&x=32&y=10&ie=UTF-8&page=1. Accessed April 13, 2016. | ||
Schofield J, Brasseur D, de Bruin B, et al. Effect of deuteration on the metabolism and clearance of some pharmacologically active compounds – synthesis and in vitro metabolism of deuterated derivatives of dronedadrone. J Labelled Comp Radiopharm. 2013;56(9–10):504–512. | ||
Xu G, Lv BH, Roberge JY, et al. Design, synthesis, and biological evaluation of deuterated C-aryl glycoside as a potent and long-acting renal sodium-dependent glucose cotransporter 2 inhibitor for the treatment of type 2 diabetes. J Med Chem. 2014;57(4):1236–1251. | ||
Sharma R, Strelevitz TJ, Gao H, et al. Deuterium isotope effects on drug pharmacokinetics I. System-dependent effects of specific deuteration with aldehyde oxidase cleared drugs. Drug Metab Dispos. 2012;40(3):625–634. | ||
Dunsaed C, Dornish J, Aastveit T, Pettersen E. In vivo pharmacokinetics of the antitumor agent 4,6-benzylidene-d-glucose (bg) and a deuterated analog 4,6-benzylidene-d1-d-glucose (p-1013) in mice, rats and dogs. Int J Oncol. 1993;2(1):61–66. | ||
Helfenbein J, Lartigue C, Noirault E, et al. Isotopic effect study of propofol deuteration on the metabolism, activity, and toxicity of the anesthetic. J Med Chem. 2002;45(26):5806–5808. | ||
Manley PW, Blasco F, Mestan J, Aichholz R. The kinetic deuterium isotope effect as applied to metabolic deactivation of imatinib to the des-methyl metabolite, CGP74588. Bioorg Med Chem. 2013;21(11):3231–3239. |
 © 2016 The Author(s). This work is published and licensed by Dove Medical Press Limited. The full terms of this license are available at https://www.dovepress.com/terms.php and incorporate the Creative Commons Attribution - Non Commercial (unported, v3.0) License.
By accessing the work you hereby accept the Terms. Non-commercial uses of the work are permitted without any further permission from Dove Medical Press Limited, provided the work is properly attributed. For permission for commercial use of this work, please see paragraphs 4.2 and 5 of our Terms.
© 2016 The Author(s). This work is published and licensed by Dove Medical Press Limited. The full terms of this license are available at https://www.dovepress.com/terms.php and incorporate the Creative Commons Attribution - Non Commercial (unported, v3.0) License.
By accessing the work you hereby accept the Terms. Non-commercial uses of the work are permitted without any further permission from Dove Medical Press Limited, provided the work is properly attributed. For permission for commercial use of this work, please see paragraphs 4.2 and 5 of our Terms.