")
Back to Journals » Diabetes, Metabolic Syndrome and Obesity » Volume 14
Effect of LncPVT1/miR-20a-5p on Lipid Metabolism and Insulin Resistance in NAFLD
Authors Zhang H, Niu Q, Liang K, Li X, Jiang J, Bian C
Received 9 September 2021
Accepted for publication 2 November 2021
Published 23 November 2021 Volume 2021:14 Pages 4599—4608
DOI https://doi.org/10.2147/DMSO.S338097
Checked for plagiarism Yes
Review by Single anonymous peer review
Peer reviewer comments 3
Editor who approved publication: Prof. Dr. Antonio Brunetti
Han Zhang,1 Qinghui Niu,1 Kun Liang,2 Xuesen Li,3 Jing Jiang,2 Cheng Bian2
1Department of Liver Center, The Affiliated Hospital of Qingdao University, Qingdao, Shandong, People’s Republic of China; 2Department of Infectious Diseases, The Affiliated Hospital of Qingdao University, Qingdao, Shandong, People’s Republic of China; 3Department of Spine Surgery, The Affiliated Hospital of Qingdao University, Qingdao, Shandong, People’s Republic of China
Correspondence: Qinghui Niu
Department of Liver Center, The Affiliated Hospital of Qingdao University, No. 59 Haier Road, Qingdao, Shandong, 266100, People’s Republic of China
Tel +86-0532-82915998
Email [email protected]
Purpose: Nonalcoholic fatty liver disease (NAFLD) is closely related to lipid metabolism and insulin resistance. The current research mainly attempted to verify the clinical value of LncRNA plasmacytoma variant translocation 1 (PVT1), and whether microRNA regulates lipid metabolism and insulin resistance to participate in NAFLD.
Patients and Methods: 81 patients with NAFLD and 78 healthy individuals were enrolled in this study. In addition, C57BL/6 mice were fed a high-fat diet to establish NAFLD model in vivo. Serum PVT1 and miR-20a-5p expression in NAFLD patients and mice were assessed by RT-qPCR. ROC curves determine the diagnostic value of PVT1 and miR-20a-5p. NAFLD mice were subjected to IPGTT to detect changes in insulin sensitivity, and the common indicators of lipid metabolism and insulin resistance were also evaluated. Dual-luciferase reporter assay verified the regulation mechanism of PVT1 and miR-20a-5p.
Results: PVT1 was upregulated in NAFLD patients and mice, while miR-20a-5p was decreased. Their expression trends were similar in patients with HOMA-IR ≥ 2.5. What’s more, miR-20a-5p, FBG, ALT, and HOMA-IR were independently correlated with PVT1. And PVT1 and miR-20a-5p show high clinical diagnostic value. Bodyweight, insulin sensitivity, lipid metabolism inductors were increased in NAFLD mice, but these increases were attenuated by PVT1 elimination. Finally, miR-20a-5p might function as the possible miRNA target of PVT1 via the binding sites at 3ʹ-UTR and negatively regulated by it.
Conclusion: PVT1 and miR-20a-5p are potential clinical biomarkers of NAFLD, and PVT1 promotes the occurrence of NAFLD by regulating insulin sensitivity and lipid metabolism, which may be achieved by targeting miR-20a-5p.
Keywords: PVT1, miR-20a-5p, NAFLD, insulin sensitivity, lipid metabolism
Introduction
Nonalcoholic fatty liver disease (NAFLD) refers to the presence of fatty liver disease in individuals without excessive alcohol consumption and other causes of disease that can lead to fatty liver disease.1 The global prevalence of NAFLD is 20–30%,1 and the prevalence of asymptomatic patients is 17–22%.2 Research predicts that one-third of the people worldwide have NAFLD.2 NAFLD is initially an abnormal accumulation of triglycerides in the liver, and the vast majority of patients gradually develop non-alcoholic steatohepatitis, fibrosis, cirrhosis, and even liver cancer.3 Insulin resistance, metabolic syndrome, diabetes, and dyslipidemia are all risk factors for NAFLD.4 Despite the liver biopsy being recognized as the gold standard for NAFLD evaluation, it is related to the risk of adverse events.5 Therefore, exploring new diagnostic biomarkers and finding key therapeutic targets is of great significance to the treatment and drug development of NAFLD.
The long non-coding RNA (LncRNA) molecules are over 200 nucleotides in length, and the coding is limited or absent. Specific dysregulation LncRNA participates in the pathological process of NAFLD, such as NEAT1,6 H19,7 MAYA.8 LncRNA plasmacytoma variant translocation 1 (PVT1) has 1716 nucleotides located in the chr8q24.21 region,9 which is overexpressed in various cancers.10 And PVT1 sponge miR-365 promotes autophagy in hepatocellular carcinoma (HCC),11 and is up-regulated in hepatitis B virus-positive HCC tissue or cell lines to promote its progression.12 What’s more, obesity and diabetes are important risk factors for NAFLD, and PVT1 is associated with the reduction of fatty acid synthesis and fatty acid oxidation in obesity13,14 and is involved in type I and II diabetic end-stage renal disease and diabetic retinopathy.15,16 However, the role of PVT1 in NAFLD is currently missing.
As another non-coding RNA molecule, microRNAs (miRNAs) are 19–25 nucleotides, and several miRNAs have been identified in NAFLD, including miR-135a-3p,17 miR-34a,18 and miR-122.19 Among many miRNAs, miR-20a-5p has been described to play a role in the autophagy of diabetes (a common complication of NAFLD).20 Among NAFLD, miR-20a-5p is significantly declined in NAFLD patients and is markedly correlated with severe NAFLD.21 In addition, miR-20a-5p improves lipid overaccumulation in NAFLD by inhibiting fatty acid translocation enzyme CD36.22 In addition to liver disease, miR-20a-5p was also decreased in other diseases, such as next-generation sequencing and microarray analysis showed that the expression of microRNA-20a-5p (miR-20a-5p) was decreased in multiple sclerosis.23 Furthermore, PVT1 can affect the miR-20a-5p has been demonstrated in septic acute kidney injury24 and pancreatic ductal adenocarcinoma.25 Whether PVT1 promotes steatosis in NAFLD through regulation of miR-20a-5p has not been reported.
Based on the aforementioned research, we explore the potential clinical value of PVT1 in NAFLD and its role in lipid metabolism and insulin resistance of mice models and preliminarily explore the potential mechanism of action of PVT1 and miR-20a-5p to provide a new perspective for treatment of NAFLD.
Patients and Methods
Ethics Statement
The informed agreement signed by all participants has been obtained before the study. The animal experiments in this study were carried out following the “Laboratory Animal Care and Use” of the National Institutes of Health. C57BL/6 mice (male, 8 weeks old) weighing 25–35 g were acquired from Shanghai Experimental Animal Research Center. They reared under a 12 h light-dark cycle and controlled temperature (25 ± 1°C) and humidity (55 ± 5%). Water and food were freely obtained. Our experimental protocol was approved by the Affiliated Hospital of Qingdao University, and the animal experiments were carried out by the guidelines of the animal care and Ethics Committee of our hospital.
Participants Data
A total of 81 NAFLD patients (46 males and 35 females, median age of 56 [49, 64] years) who were diagnosed for the first time in the Affiliated Hospital of Qingdao University from June 2017 to July 2019 were included. The diagnosis of NAFLD patients is based on B ultrasound results and the World gastroenterology Organization (WGO) Global Guidelines for Nonalcoholic Fatty liver and Nonalcoholic Steatohepatitis in 2014.26 Patients with no prior treatment or medication, no history of alcohol consumption, and no viral hepatitis or autoimmune hepatitis were enrolled in the study. Furthermore, patients with metabolic diseases (except diabetes), cancer, primary cholangitis, and drug-induced liver disease were also excluded. 78 healthy invidious (35 males, 43 females, median age of 61 [50, 66] years) from the healthy examination center of our hospital were selected as the control group. They have normal liver ultrasound effects, and age range of patients, excluding hepatitis carriers, metabolic diseases, and individuals with renal failure, heart failure, or other major medical conditions. The current research protocol is authorized by the Affiliated Hospital of Qingdao University Medical Ethics Committee and implemented by Helsinki. All recruited personnel have signed written informed consent.
Clinical Evaluation
Peripheral venous blood was collected from all subjects after fasting, and the levels of alanine aminotransferase (ALT), total cholesterol (TC), triglyceride (TG), high-density lipoprotein cholesterol C (HDL-C), low-density lipoprotein cholesterol C (LDL-C), fasting blood glucose (FBG) were discovered by the automatic biochemical analyzer. In addition, insulin resistance index [homeostasis model assessment for insulin resistance (HOMA-IR)] was calculated using HOMA model: (fasting insulin (mIU/L) × fasting glucose (mmol/L)/22.5.27,28
Serum Collection
5 mL upper limb venous blood was taken from the subjects. Centrifuge after standing collected the upper serum sample, place it in 1.5 mL RNase/DNase free EP tubes, and stored at −80°C.
Mouse Model of NAFLD
After 1 week of adaptive feeding, 40 C57BL/6 mice were randomly divided into control, HFD, si-NC, and si-PVT1 four groups, with 10 mice in each group. The mice in the control group were fed a normal standard diet (20% kcal protein, 10% kcal fat, and 70% kcal carbohydrate). The remaining groups of mice were fed a high-fat diet (HFD, 20% kcal protein, 60% kcal fat, and 20% kcal protein) for 12 weeks to establish the NAFLD model. What’s more, to analyze the regulatory effect of PVT1 on NAFLD, small interfering RNA (siRNA) targeting PVT1 (si-PTV1, 5ʹ-GCUUGGAGGCUGAGGAGUUTT-3ʹ) was injected into the tail vein in vivo once a week for 8 weeks according to previous research.29 Dissolve 50 μg si-PVT1 or negative control si-NC with 50 μL in vivo transfection agent Enrtranster TM in 100μL glucose solution according to the manufacturer’s requirements. The body weight of the mice was calculated weekly. At the end of the experiment, a blood sample was taken from the eyeballs for biochemical testing.
Animal Biochemical Analysis
Animal blood was placed at room temperature for 20 min, centrifuged, and serum was collected and stored at −80°C. Subsequently, the changes of TG, TC, ALT, AST, and other indicators were detected by biological analysis instruments. Intraperitoneal glucose tolerance test (IPGTT) was performed 12 h after fasting in mice. Glucose (2 g/kg) was injected intraperitoneally, and blood glucose levels were measured through the rail vein and Accu-Check at 0, 30, 60, 90, 120 min after injection.
Quantitative Real-Time Polymerase Chain Reaction (RT-qPCR)
TRIzol LS isolated and purified total RNA from serum samples, and detected its concentration and purity. The ratio ofA260/A280 is in the range of 1.8–2.1 to determine the purity of RNA. Then, reverse transcription of the extracted RNA was performed using the HiFiScript cDNA synthesis Kit and miRNA cDNA synthesis Kit (CWbiotech, Beijing, China). Then the template, primer, and UltraSYBR Mixture Kit or miRNA qPCR assay Kit were mixed for PCR amplification on Bio-Rad CFX96 Touch qPCR detection system. The levels of PVT1 and miR-20a-5p were normalized to GAPDH or U6, respectively. And they were measured by the 2−ΔΔCt. The specific primer sequences used were as follows: PVT1 forward: 5ʹ-CAGCACTCTGGACGGAC −3ʹ and reverse: 5ʹ-CAACAGGAGAAGCAAACA-3ʹ; miR-20a-5p forward: 5ʹ-GTAAAGTGCTTATAGTGCAG-3ʹ and reverse: 5ʹ-GTCGTATCCAGTGCGTGTCG-3ʹ; U6 forward: 5ʹ-CTCGCTTCGGCAGCACA-3ʹ and reverse: 5ʹ-AACGCTTCACGAATTTGCGT-3ʹ.
Dual-Luciferase Reporter Gene Assay
Genes targeted by PVT1 and miR-20a-5p were predicted and analyzed by bioinformatic websites https://starbase.sysu.edu.cn/. Subsequently, PVT1 containing miR-20a-5p binding sequences or PVT1 containing mutational site was subcloned to the pmirGLO vector (Promega, USA) to construct the pmirGLO-Wild type-PVT1 (WT-PVT1) and pmirGLO-mutational-PVT1 (MUT-PVT1), respectively. The commonly used tool cell 293T was inoculated into 24-well plates and cultured overnight. miR-20a-5p mimic or inhibitor was mixed with WT-PVT1 or MUT-PVT1 respectively. And the transfection reagent of lipofectamine 2000 was supplemented, and the mixture was gently beaten and stood at room temperature, and then dropped into the cells. 48 h later, the cells were harvested and lysed. The luciferase assay kit (Genomeditech Co., Shanghai, China) was used to determine the luciferase activity.
Statistical Analysis
Each experiment was tested in triplicate for statistical analysis. Normally distributed Values are displayed as mean ± SD, while not normally distributed values are presented as medians (25th, 75th percentile). SPSS 23.0 and GraphPad Prism 6 software were performed to chart drawing and data analysis. Comparisons between two groups were assessed by t-test (for data with normal distribution), and the Mann–Whitney U-test was applied to determine the differences between the two groups in case of non-normal distribution. What’s more, comparisons of multiple groups were conducted by one-way ANOVA followed by the Tukey’s test. Values of P < 0.01 were examined statistically significantly.
Results
Clinicopathological Data of Participants
Initially, we analyzed basic clinical information of 81 NAFLD patients and 78 healthy individuals. There was no dramatic difference in gender and age between the two groups (P > 0.05). However, BMI, ALT, TC, LDL-C, and HOMA-IR of NAFLD patients were increased than of healthy patients, and HDL-C was reduced than that of healthy patients (P < 0.05, Table 1).
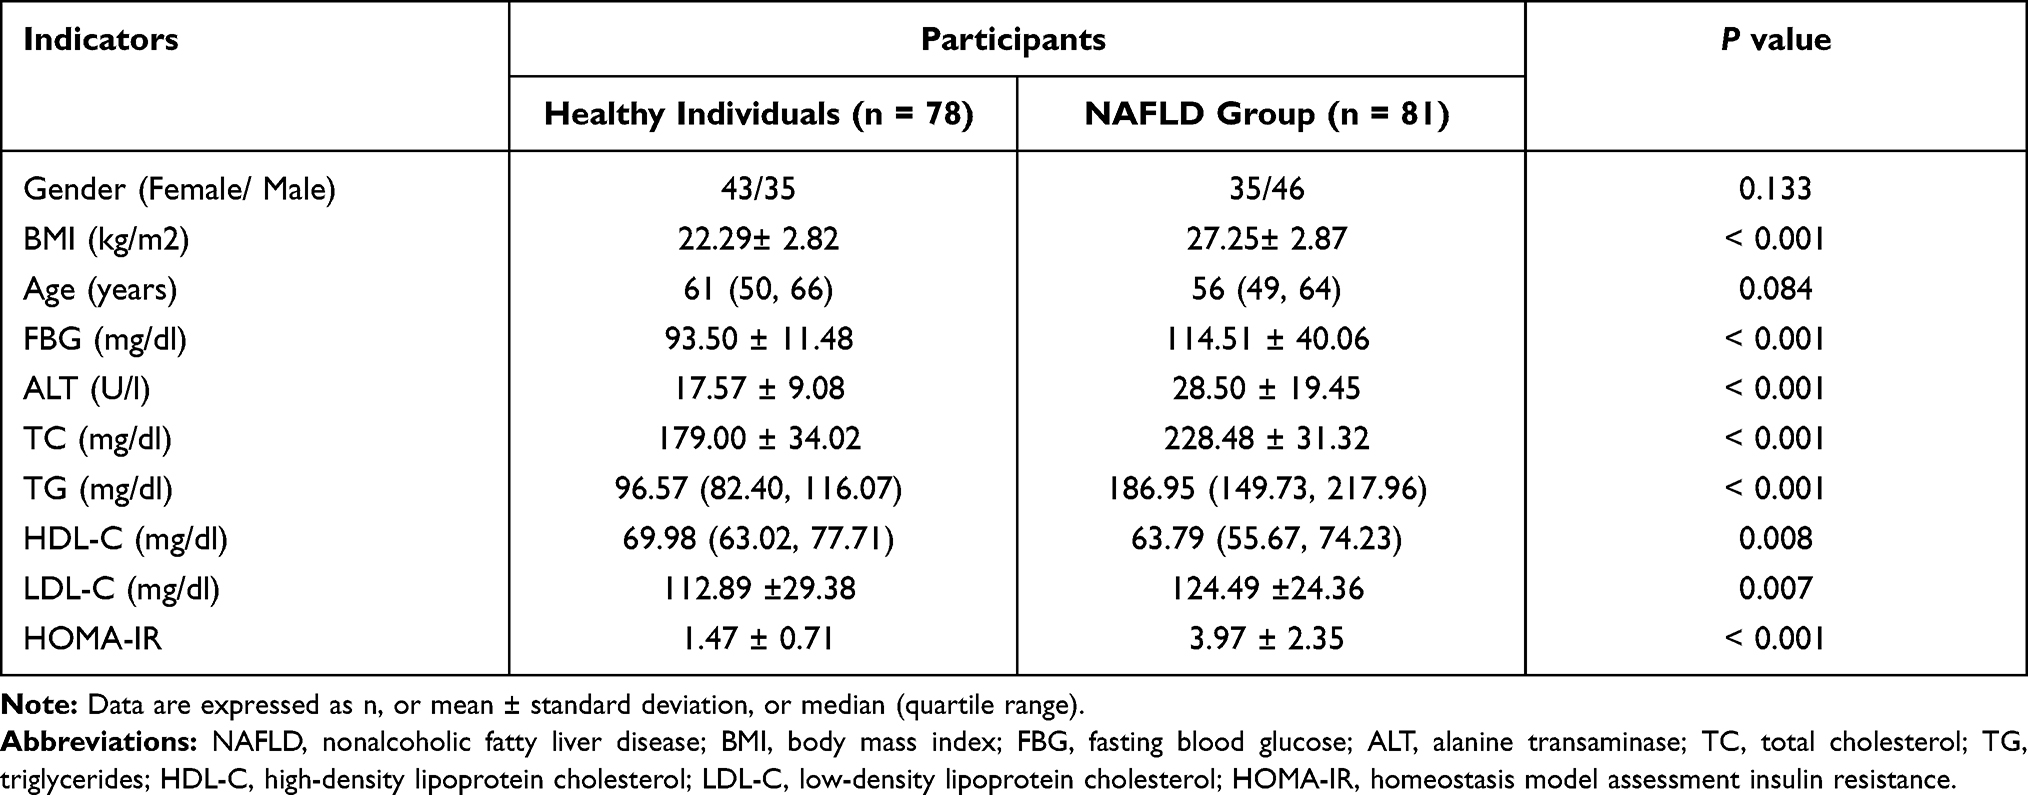 |
Table 1 Basic Clinical Data of Participants |
The Levels of PVT1 and miR-20a-5p in NAFLD Patients
Subsequently, serum PVT1 levels in participants were measured by RT-qPCR. It was found that serum PVT1 in NAFLD patients (1.46±0.28) was significantly elevated than that in healthy individuals (1.03±0.27) (P < 0.001, Figure 1A). Then, to further analyze the role of PVT1 in insulin resistance, NAFLD patients were divided into HOMA-IR ≥ 2.5 groups and HOMA-IR < 2.5 groups based on the traditional definition of insulin resistance (HOMA-IR ≥ 2.5). Results showed that serum PVT1 level in NAFLD patients with HOMA-IR ≥ 2.5 (1.61±0.24) was significantly higher than that in the HOMA-IR < 2.5 groups (1.29±0.22) (P < 0.05, Figure 1B). These results indicated that PVT1 has been crucial in NAFLD and possibly associated with insulin resistance.
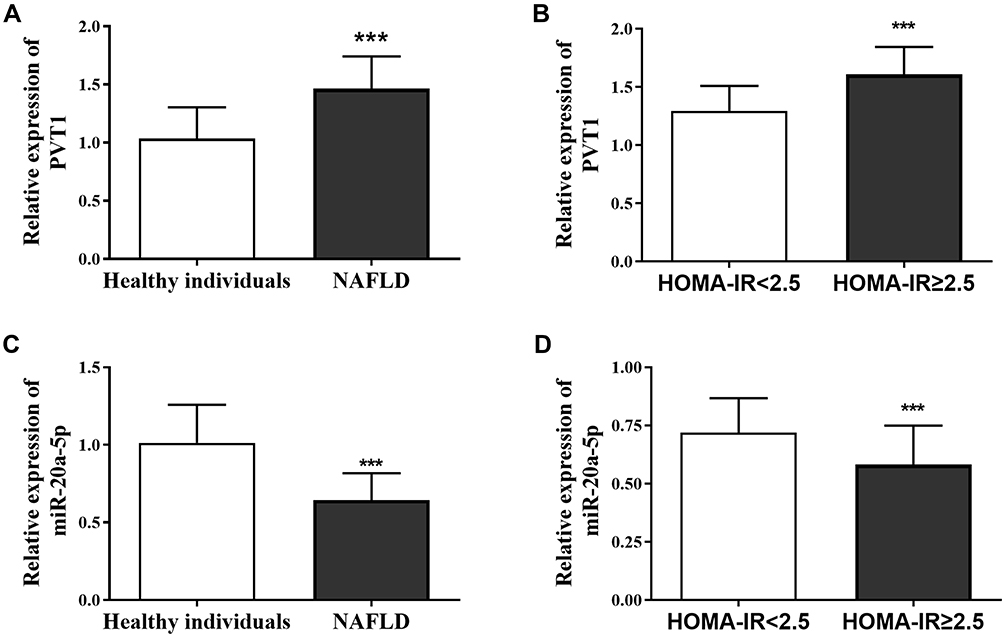 |
Figure 1 Serum PVT1 and miR-20a-5p levels in NAFLD patients. (A) RT-qPCR was performed to detect the levels of PVT1 in NAFLD patients and healthy individuals. (B) PVT1 levels in the HOMA-IR ≥ 2.5 and HOMA-IR < 2.5 groups were analyzed. (C) RT-qPCR was performed to discover the levels of miR-20a-5p in NAFLD patients and healthy individuals. (D) Serum miR-20a-5p in the HOMA-IR ≥ 2.5 groups and HOMA-IR < 2.5 groups were explored. ***P< 0.001 versus the healthy individual’s groups or HOMA-IR < 2.5 groups. |
Similarly, we also analyzed the levels of miR-20a-5p and revealed that miR-20a-5p of NAFLD patients (0.64±0.17) was significantly decreased than that in healthy individuals (1.01±0.25) (P < 0.05, Figure 1C). This is the opposite of the PVT1 level in NAFLD patients, but it is consistent with the low expression of miR-20a-5p in the literature. In addition, we also discovered that serum miR-20a-5p in patients with HOMA-IR ≥ 2.5 (0.58±0.17) was substantially lower than that in patients with HOMA-IR < 2.5 (0.72±0.15) (P < 0.05, Figure 1D), which is also opposite of the level of PVT1 in HOMA-IR groups. Results suggest that declined miR-20a-5p in patients may be associated with decreased insulin resistance.
Serum PVT1 and miR-20a-5p Acted as a Diagnostic Marker in NAFLD Patients
To explore the clinical diagnostic value of PVT1 and miR-20a-5p in NAFLD patients, the ROC curves were drawn. As shown in Figure 2A, PVT1 can significantly identify NAFLD patients from healthy individuals. The AUC of ROC was 0.895, sensitivity and specificity were 84.0% and 84.6%, respectively, showing high clinical diagnostic ability. Similarly, miR-20a-5p significantly distinguishes healthy individuals from NAFLD patients with an AUC of 0.892, a sensitivity of 93.8%, and a specificity of 80.8% (Figure 2B). These results confirm the potential clinical value of PVT1 and miR-20a-5p as diagnostic biomarkers for NAFLD.
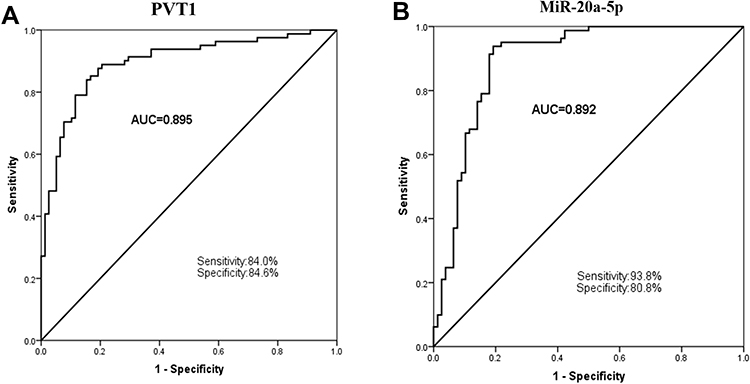 |
Figure 2 Clinical diagnostic value of PVT1 and miR-20a-5p in NAFLD patients. (A) PVT1 can significantly distinguish NAFLD patients from healthy individuals. (B) miR-20a-5p can dramatically distinguish healthy individuals and NAFLD patients, showing high clinical diagnostic value. |
Correlation of Serum PVT1 with Clinical Data
To further analyze the involvement of PVT1 in NAFLD, we conducted multiple linear regression analyses to explore the correlation between PVT1 level and clinical characteristics in NFALD patients. We found that the clinical indicators FBG, ALT, HOMA-IR, and miR-20a-5p were independently correlated with PVT1 (P < 0.05, Table 2). What’s more, we also analyzed the relationship between clinical information and HOMA-IR, an indicator of insulin resistance. The results showed that PVT1 (OR = 3.323, 95% CI = 1.160–9.516, P < 0.05, Table 3) and miR-20a-5p (OR = 0.311, 95% CI = 0.105–0.916, P < 0.05, Table 3) were independent risk factors for insulin resistance. This suggests that PVT1 and miR-20a-5p may be involved in abnormal metabolism and insulin resistance in NAFLD patients.
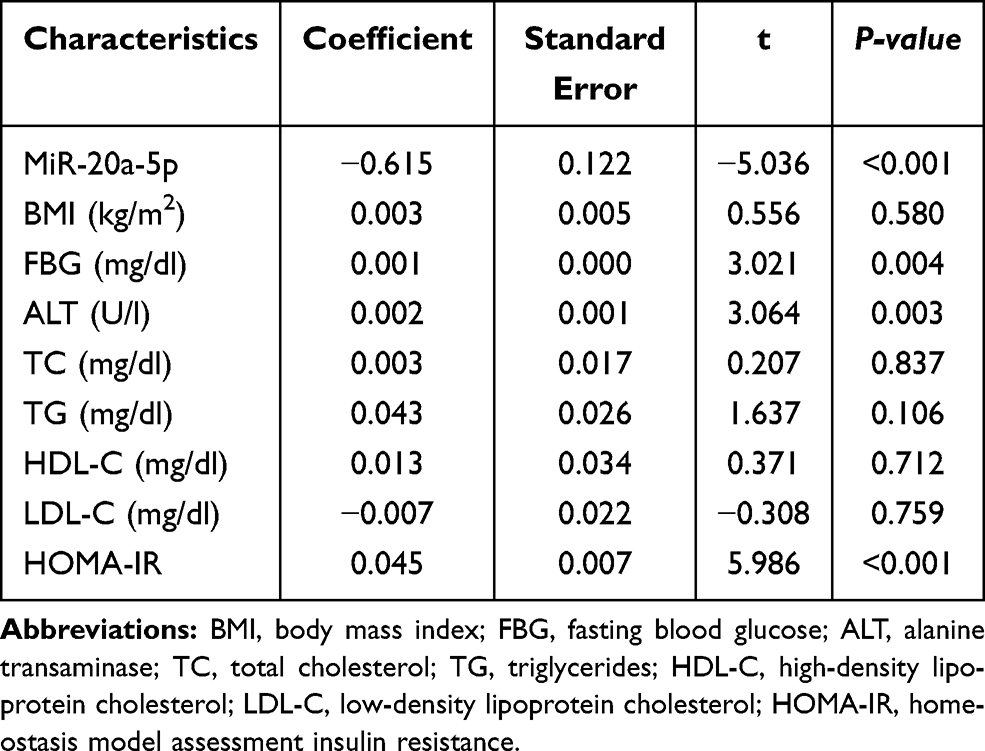 |
Table 2 Multiple Linear Regression Analysis on Variables Associated with lncRNA PVT1 |
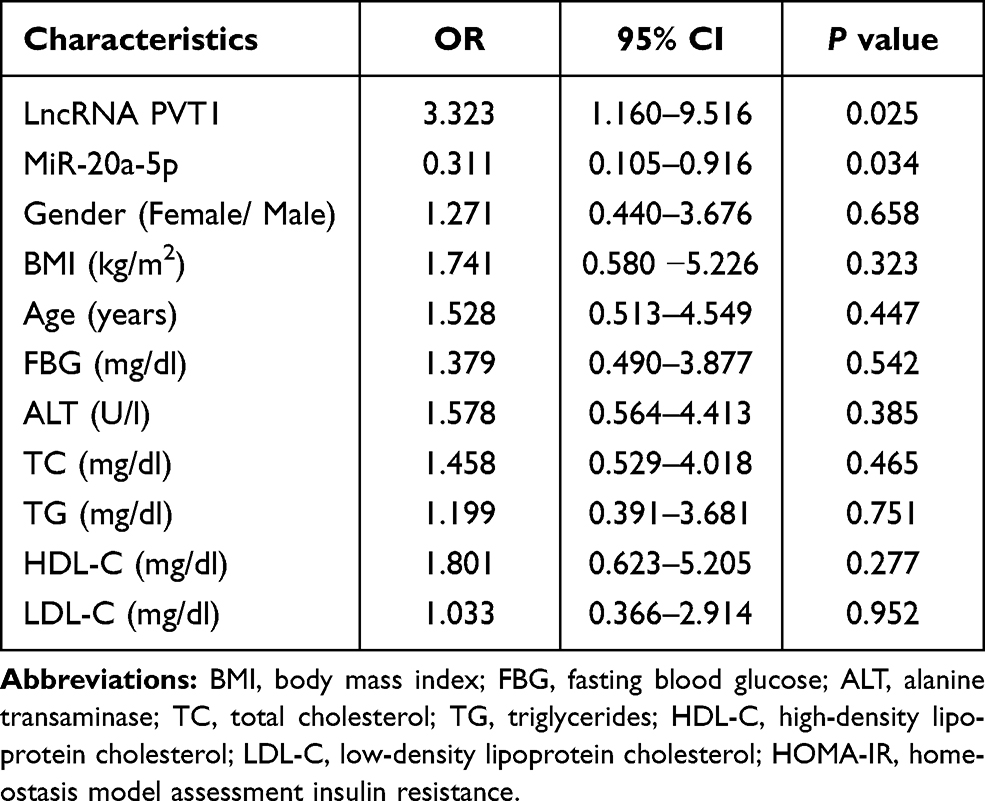 |
Table 3 Relationship Between Different Variables and HOMA-IR |
PVT1 Regulates Lipid Metabolism and Insulin Resistance in NAFLD Mice
To confirm our hypothesis, we constructed the NAFLD model through a high-fat diet (HFD) based on previous studies and inhibited the expression of PVT1 in vivo. This finding confirmed that the HFD group significantly increased the expression of PVT1, but when si-PVT1 was injected in vivo, the expression of PVT1 was inhibited (P < 0.001, Figure 3A). We tested the bodyweight of the mice for 8 weeks and confirmed that compared with the control group, HFD significantly increased the weight of mice, while inhibiting PVT1 slowed down the weight gain of the mice (P < 0.001, Figure 3B). To confirm the relationship between PVT1 and insulin sensitivity in NAFLD, we examined changes in IPGTT levels in mice. Glucose concentration in HFD mice increased significantly over time. When PVT1 was inhibited, the glucose concentration was significantly inhibited (P < 0.001, Figure 3C). These founds indicated that PVT1 may affect NAFLD by affecting insulin sensitivity. Subsequently, whether PVT1 regulates NAFLD lipid metabolism and liver damage was detected. Results showed that Triglyceride, Cholesterol, ALT, and AST were markedly elevated, and their levels were dramatically reduced when PVT1 was inhibited (P < 0.001, Figure 3D–G). Our findings confirmed that PVT1 participates in NAFLD by affecting insulin sensitivity and lipid metabolism.
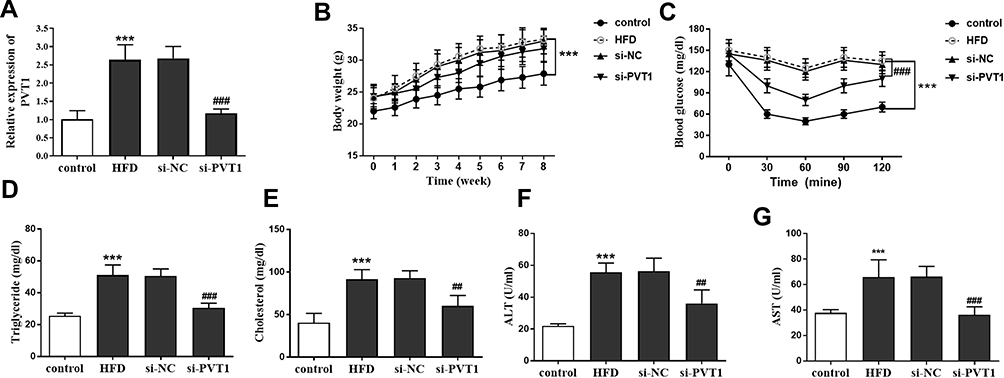 |
Figure 3 PVT1 regulates lipid metabolism and insulin resistance in NAFLD mice. (A) RT-qPCR has accessed the expression of PVT1 after a high-fat diet and PVT1 inhibition. (B) Effects of PVT1 on body weight of mice after high-fat diet. (C) Effects of PVT1 on blood glucose levels in high-fat diet mice. Regulation of PVT1 on lipid metabolism inductors Triglyceride (D), Cholesterol (E), ALT (F), and AST (G). ***P< 0.001 versus the control groups; ##P<0.01, ###P<0.001 versus the HFD groups. |
miR-20a-5p Was a miRNA Target of PVT1
Clinical results confirmed that the expression of PVT1 is related to miR-20a-5p, and its expression level is the opposite. So we further confirmed the relationship between them. Bioinformatics software confirmed the existence of potential binding sites between the PVT1 and miR-20a-5p (Figure 4A). A dual-luciferase reporter analysis was performed, and it was confirmed that miR-20a-5p mimics depleted the luciferase activity of WT-PVT1, while miR-20a-5p inhibitors elevated the luciferase activity. However, they did not affect the MUT-PVT1 luciferase activity (P < 0.001, Figure 4B). What’s more, we also found that miR-20a-5p was elevated in the HFD group, but this elevation was significantly inhibited by the PVT1 depletion (P < 0.001, Figure 4C). This finding suggests that PVT1 may participate in NAFLD through miR-20a-5p negative target regulation.
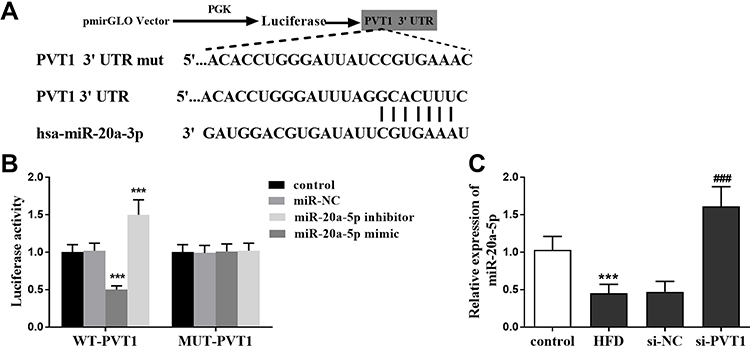 |
Figure 4 PVT1 acted as the sponge of miR-20a-5p. (A) The depiction of the schematic on the recombinant luciferase plasmid. (B) Verification of targeted binding of miR-20a-5p and PVT1. (C) miR-20a-5p was negatively regulated by PVT1 in NAFLD model mice. ***P< 0.001 versus the control groups; ###P<0.001 versus the HFD groups. |
Discussion
In recent years, with the deepening of LncRNA research, the importance of the abnormal expression level of LncRNA in diseases has gradually attracted people’s attention. Studies have indicated that LncRNA could not only serve as an essential molecule in controlling gene expressions such as chromosome modification and transcription but also participate in abnormal levels of steatosis, oxidative stress, inflammation, insulin resistance, and other pathological processes. In NAFLD, 381 LncRNA have been confirmed to be highly expressed,30 and LncRNA MEG3 has also been described to be elevated to participate in insulin resistance level in NAFLD and the aging of liver endothelial cells.31 In addition, the increase of LncRNA GAS5 is involved in the advanced liver fibrosis of NFALD. There is no doubt that LncRNA plays an indispensable role in NAFLD.
PVT1 is a LncRNA located in the 8q24.21 region of the human chromosome, and its potential role in cancer has been widely reported. Such as endometrial cancer,32 bladder cancer,33 and ovarian cancer.34 The latest research found that PVT1 is engaged in the progression of hepatitis B virus-positive liver cancer,12 and can regulate the diabetes-related disease, a common complication of NAFLD. For example, PVT1 is upregulated in diabetic cataracts, and is related to cell function,35 and inhibits podocyte injury and apoptosis in diabetic nephropathy through FOXA1.36 In addition, obesity is caused by abnormal lipid metabolism. PVT1 promotes the synthesis and inhibits the oxidation of fatty acids in obesity.13,14 Based on the above literature, the role of PVT1 in NAFLD has aroused our interest. Therefore, we tested the serum PVT1 of the enrolled population and found that its level was abnormally elevated.
Previous studies have confirmed that PVT1 can participate in the occurrence of acute kidney injury in sepsis and pancreatic ductal adenocarcinoma through the targeted regulation of miR-20a-5p,24,25 and miR-20a-5p has been reported to be involved in NAFLD.22 Therefore, we speculated whether PVT1participates in the progression of NAFLD by affecting miR-20a-5p. Consistent with the results of previous studies, miR-20a-5p was significantly reduced in patients. Although LncRNA and miRNA lack tissue specificity in clinical application, however, the urine PCA3 (PROGENSA) as a lncRNA has been approved by the FDA for the diagnosis of prostate cancer.37 Recent studies have highlighted that the interaction and co-regulation of these ncRNAs may be involved in the progression of NAFLD and have great potential as new diagnostic biomarkers.38 Subsequently, we analyzed the clinical diagnostic value of abnormal levels of PVT1 and miR-20a-5p and found that both can significantly distinguish healthy individuals from NFALD patients, which may be a new biomarker for the diagnosis of NAFLD.
The specific pathogenesis of NAFLD is complex, and its mechanism is far from being elucidated,39 but insulin resistance and lipid metabolism both play crucial roles in its progression.40,41 Therefore, to further confirm our conjecture, we divided NAFLD patients into two groups based on the traditional task of insulin resistance. We found that patients with reduced insulin sensitivity have reduced PVT1 levels and increased miR-20a-5p. HOMA-IR, FBG, ALT, and miR-20a-5p were independent risk factors for PVT1. Therefore, we clinically confirmed that PVT1 may be engaged in the progression of NAFLD by regulating lipid metabolism and insulin sensitivity.
The establishment of the NAFLD model through HFD has been very mature in NAFLD studies.42 Therefore, we established a NAFLD mice model through a high-fat diet. Consistent with the clinical expression level, PVT1 was significantly increased, but si-PVT1 inhibited its expression. In addition, the HFD group increased body weight, while the elimination of PVT1 slowed the level of body weight gain. The IPGTT method was used to detect insulin sensitivity during glucose metabolism.43 In our study, its level was generally higher in the HFD group, while the decrease in PVT1 alleviated the increase in glucose levels. Similar results were obtained for more important lipid metabolism and liver injury indicators, confirming that PVT1 may participate in NAFLD by affecting insulin sensitivity and lipid metabolism. Subsequently, the luciferase reporter gene assay confirmed the targeting relationship between miR-20a-5p and PVT1. Moreover, the miR-20a-5p level in the serum of mice was negatively regulated by PVT1.
The results of current research should be interpreted with consideration of the following limitations. Such as failure to provide timely histological features of liver in NAFLD mice, will be the focus of our further studies. Secondly, due to the small sample size of the subjects, the mean value and SD of clinical data may large differ greatly. What’s more, although there was no significant difference in gender distribution between our two groups in this study, there was a high proportion of male patients with NAFLD. Considering that male is risk factor for NAFLD, our research conclusion needs to be confirmed in a larger sample. Previous studies have shown that high-fat diet-induced animal models of NAFLD are pathologically and phenotypically similar to human NAFLD, although they can greatly improve the ability to understand the mechanisms controlling the progression of human NAFLD. However, it cannot fully reflect human NAFLD, so we hold a reserved attitude towards the research results of this model.
Conclusion
In conclusion, PVT1 elevated in NAFLD patients and mice, while miR-20a-5p decreased significantly. In patients with HOMA-IR ≥ 2.5, the expression levels of PVT1 and miR-20a-5p were opposite. Moreover, PVT1 and miR-20a-5p have potential diagnostic value. All in all, we confirmed for the first time that PVT1 may participate in the pathological process of NAFLD by affecting miR-20a-5p to regulate insulin sensitivity and lipid metabolism.
Disclosure
The authors reports no conflicts of interest in this work.
References
1. Ekstedt M, Nasr P, Kechagias S. Natural history of NAFLD/NASH. Curr Hepatol Rep. 2017;16(4):391–397. doi:10.1007/s11901-017-0378-2
2. Lizardi-Cervera J, Laparra DI, Chavez-Tapia NC, Ostos ME, Esquivel MU. Prevalence of NAFLD and metabolic syndrome in asymtomatics subjects. Rev Gastroenterol Mex. 2006;71(4):453–459.
3. Liu Q, Bengmark S, Qu S. The role of hepatic fat accumulation in pathogenesis of non-alcoholic fatty liver disease (NAFLD). Lipids Health Dis. 2010;9(1):42. doi:10.1186/1476-511X-9-42
4. Perumpail BJ, Khan MA, Yoo ER, Cholankeril G, Kim D, Ahmed A. Clinical epidemiology and disease burden of nonalcoholic fatty liver disease. World J Gastroenterol. 2017;23(47):8263–8276. doi:10.3748/wjg.v23.i47.8263
5. Younossi Z, Anstee QM, Marietti M, et al. Global burden of NAFLD and NASH: trends, predictions, risk factors and prevention. Nat Rev Gastroenterol Hepatol. 2018;15(1):11–20. doi:10.1038/nrgastro.2017.109
6. Ye J, Lin Y, Yu Y, Sun D. LncRNA NEAT1/microRNA-129-5p/SOCS2 axis regulates liver fibrosis in alcoholic steatohepatitis. J Transl Med. 2020;18(1):445. doi:10.1186/s12967-020-02577-5
7. Liu J, Tang T, Wang GD, Liu B. LncRNA-H19 promotes hepatic lipogenesis by directly regulating miR-130a/PPARgamma axis in non-alcoholic fatty liver disease. Biosci Rep. 2019;39(7). doi:10.1042/BSR20181722
8. Yuan P, Qi X, Song A, et al. LncRNA MAYA promotes iron overload and hepatocyte senescence through inhibition of YAP in non-alcoholic fatty liver disease. J Cell Mol Med. 2021;25(15):7354–7366. doi:10.1111/jcmm.16764
9. Shtivelman E, Henglein B, Groitl P, Lipp M, Bishop JM. Identification of a human transcription unit affected by the variant chromosomal translocations 2;8 and 8;22 of Burkitt lymphoma. Proc Natl Acad Sci U S A. 1989;86(9):3257–3260. doi:10.1073/pnas.86.9.3257
10. Cui M, You L, Ren X, Zhao W, Liao Q, Zhao Y. Long non-coding RNA PVT1 and cancer. Biochem Biophys Res Commun. 2016;471(1):10–14. doi:10.1016/j.bbrc.2015.12.101
11. Yang L, Peng X, Jin H, Liu J. Long non-coding RNA PVT1 promotes autophagy as ceRNA to target ATG3 by sponging microRNA-365 in hepatocellular carcinoma. Gene. 2019;697:94–102. doi:10.1016/j.gene.2019.02.036
12. Jiang B, Yang B, Wang Q, Zheng X, Guo Y, Lu W. lncRNA PVT1 promotes hepatitis B virus‑positive liver cancer progression by disturbing histone methylation on the cMyc promoter. Oncol Rep. 2020;43(2):718–726. doi:10.3892/or.2019.7444
13. Zhang L, Zhang D, Qin ZY, Li J, Shen ZY. The role and possible mechanism of long noncoding RNA PVT1 in modulating 3T3-L1 preadipocyte proliferation and differentiation. IUBMB Life. 2020;72(7):1460–1467. doi:10.1002/iub.2269
14. Ghafouri-Fard S, Taheri M. The expression profile and role of non-coding RNAs in obesity. Eur J Pharmacol. 2021;892:173809. doi:10.1016/j.ejphar.2020.173809
15. Millis MP, Bowen D, Kingsley C, Watanabe RM, Wolford JK. Variants in the plasmacytoma variant translocation gene (PVT1) are associated with end-stage renal disease attributed to type 1 diabetes. Diabetes. 2007;56(12):3027–3032. doi:10.2337/db07-0675
16. Hanson RL, Craig DW, Millis MP, et al. Identification of PVT1 as a candidate gene for end-stage renal disease in type 2 diabetes using a pooling-based genome-wide single nucleotide polymorphism association study. Diabetes. 2007;56(4):975–983. doi:10.2337/db06-1072
17. Jiang H, Qian Y, Shen Z, et al. Circulating microRNA135a3p in serum extracellular vesicles as a potential biological marker of nonalcoholic fatty liver disease. Mol Med Rep. 2021;24(1). doi:10.3892/mmr.2021.12137
18. Alshehri AS, El-Kott AF, El-Kenawy AE, Khalifa HS, AlRamlawy AM. Cadmium chloride induces non-alcoholic fatty liver disease in rats by stimulating miR-34a/SIRT1/FXR/p53 axis. Sci Total Environ. 2021;784:147182. doi:10.1016/j.scitotenv.2021.147182
19. Yang L, Liu Q, Zhang H, et al. Silibinin improves nonalcoholic fatty liver by regulating the expression of miR122: an in vitro and in vivo study. Mol Med Rep. 2021;23(5):May. doi:10.3892/mmr.2021.11974
20. Tian D, Xiang Y, Tang Y, Ge Z, Li Q, Zhang Y. Circ-ADAM9 targeting PTEN and ATG7 promotes autophagy and apoptosis of diabetic endothelial progenitor cells by sponging mir-20a-5p. Cell Death Dis. 2020;11(7):526. doi:10.1038/s41419-020-02745-x
21. Ando Y, Yamazaki M, Yamada H, et al. Association of circulating miR-20a, miR-27a, and miR-126 with non-alcoholic fatty liver disease in general population. Sci Rep. 2019;9(1):18856. doi:10.1038/s41598-019-55076-z
22. Wang X, Ma Y, Yang LY, Zhao D. MicroRNA-20a-5p Ameliorates Non-alcoholic Fatty Liver Disease via Inhibiting the Expression of CD36. Front Cell Dev Biol. 2020;8:596329. doi:10.3389/fcell.2020.596329
23. Keller A, Leidinger P, Steinmeyer F, et al. Comprehensive analysis of microRNA profiles in multiple sclerosis including next-generation sequencing. Mult Scler. 2014;20(3):295–303. doi:10.1177/1352458513496343
24. Deng LT, Wang QL, Yu C, Gao M. lncRNA PVT1 modulates NLRP3mediated pyroptosis in septic acute kidney injury by targeting miR20a5p. Mol Med Rep. 2021;23(4). doi:10.3892/mmr.2021.11910
25. Huang F, Chen W, Peng J, et al. LncRNA PVT1 triggers Cyto-protective autophagy and promotes pancreatic ductal adenocarcinoma development via the miR-20a-5p/ULK1 Axis. Mol Cancer. 2018;17(1):98. doi:10.1186/s12943-018-0845-6
26. Dyson JK, Anstee QM, McPherson S. Non-alcoholic fatty liver disease: a practical approach to treatment. Frontline Gastroenterol. 2014;5(4):277–286. doi:10.1136/flgastro-2013-100404
27. Matthews DR, Hosker JP, Rudenski AS, Naylor BA, Treacher DF, Turner RC. Homeostasis model assessment: insulin resistance and beta-cell function from fasting plasma glucose and insulin concentrations in man. Diabetologia. 1985;28(7):412–419. doi:10.1007/BF00280883
28. Sarafidis PA, Lasaridis AN, Nilsson PM, et al. Validity and reproducibility of HOMA-IR, 1/HOMA-IR, QUICKI and McAuley’s indices in patients with hypertension and type II diabetes. J Hum Hypertens. 2007;21(9):709–716. doi:10.1038/sj.jhh.1002201
29. Brachs S, Winkel AF, Tang H, et al. Inhibition of citrate cotransporter Slc13a5/mINDY by RNAi improves hepatic insulin sensitivity and prevents diet-induced non-alcoholic fatty liver disease in mice. Mol Metab. 2016;5(11):1072–1082. doi:10.1016/j.molmet.2016.08.004
30. Ye L, Zhao D, Xu Y, et al. LncRNA-Gm9795 promotes inflammation in non-alcoholic steatohepatitis via NF-[Formula: see text]B/JNK pathway by endoplasmic reticulum stress. J Transl Med. 2021;19(1):101. doi:10.1186/s12967-021-02769-7
31. Cheng X. Long non-coding RNA Meg3 deficiency impairs glucose homeostasis and insulin signaling by inducing cellular senescence of hepatic endothelium in obesity. Redox Biol. 2021;40:101863. doi:10.1016/j.redox.2021.101863
32. Cong R, Kong F, Ma J, Li Q, Yang H, Ma X. The PVT1/miR-612/CENP-H/CDK1 axis promotes malignant progression of advanced endometrial cancer. Am J Cancer Res. 2021;11(4):1480–1502.
33. Chen M, Zhang R, Lu L, et al. Correction for: lncRNA PVT1 accelerates malignant phenotypes of bladder cancer cells by modulating miR-194-5p/BCLAF1 axis as a ceRNA. Aging. 2021;13(3):4731–4733. doi:10.18632/aging.202683
34. Wu Y, Gu W, Han X, Jin Z. LncRNA PVT1 promotes the progression of ovarian cancer by activating TGF-beta pathway via miR-148a-3p/AGO1 axis. J Cell Mol Med. 2021;25(17):8229–8243. doi:10.1111/jcmm.16700
35. Yang J, Zhao S, Tian F. SP1-mediated lncRNA PVT1 modulates the proliferation and apoptosis of lens epithelial cells in diabetic cataract via miR-214-3p/MMP2 axis. J Cell Mol Med. 2020;24(1):554–561. doi:10.1111/jcmm.14762
36. Liu DW, Zhang JH, Liu FX, et al. Silencing of long noncoding RNA PVT1 inhibits podocyte damage and apoptosis in diabetic nephropathy by upregulating FOXA1. Exp Mol Med. 2019;51(8):1–15. doi:10.1038/s12276-019-0259-6
37. Newcomb LF, Zheng Y, Faino AV, et al. Performance of PCA3 and TMPRSS2: eRGurinary biomarkers in prediction of biopsy outcome in the Canary Prostate Active Surveillance Study (PASS). Prostate Cancer Prostatic Dis. 2019;22(3):438–445. doi:10.1038/s41391-018-0124-z
38. Wruck W, Graffmann N, Kawala MA, Adjaye J. Concise Review: current Status and Future Directions on Research Related to Nonalcoholic Fatty Liver Disease. Stem Cells. 2017;35(1):89–96. doi:10.1002/stem.2454
39. Tarantino G, Citro V, Capone D. Nonalcoholic Fatty Liver Disease: a Challenge from Mechanisms to Therapy. J Clin Med. 2019;9(1):15. doi:10.3390/jcm9010015
40. Parikh MP, Gupta NM, McCullough AJ. Obstructive Sleep Apnea and the Liver. Clin Liver Dis. 2019;23(2):363–382. doi:10.1016/j.cld.2019.01.001
41. Gonzalez-Ruiz K, Correa-Bautista JE, Izquierdo M, et al. Effects of an exercise program on hepatic metabolism, hepatic fat, and cardiovascular health in overweight/obese adolescents from Bogota, Colombia (the HEPAFIT study): study protocol for a randomized controlled trial. Trials. 2018;19(1):330. doi:10.1186/s13063-018-2721-5
42. Ma Z, Chu L, Liu H, et al. Beneficial effects of paeoniflorin on non-alcoholic fatty liver disease induced by high-fat diet in rats. Sci Rep. 2017;7:44819. doi:10.1038/srep44819
43. Kurstjens S, van Diepen JA, Overmars-Bos C, et al. Magnesium deficiency prevents high-fat-diet-induced obesity in mice. Diabetologia. 2018;61(9):2030–2042. doi:10.1007/s00125-018-4680-5
 © 2021 The Author(s). This work is published and licensed by Dove Medical Press Limited. The full terms of this license are available at https://www.dovepress.com/terms.php and incorporate the Creative Commons Attribution - Non Commercial (unported, v3.0) License.
By accessing the work you hereby accept the Terms. Non-commercial uses of the work are permitted without any further permission from Dove Medical Press Limited, provided the work is properly attributed. For permission for commercial use of this work, please see paragraphs 4.2 and 5 of our Terms.
© 2021 The Author(s). This work is published and licensed by Dove Medical Press Limited. The full terms of this license are available at https://www.dovepress.com/terms.php and incorporate the Creative Commons Attribution - Non Commercial (unported, v3.0) License.
By accessing the work you hereby accept the Terms. Non-commercial uses of the work are permitted without any further permission from Dove Medical Press Limited, provided the work is properly attributed. For permission for commercial use of this work, please see paragraphs 4.2 and 5 of our Terms.