")
Back to Journals » Therapeutics and Clinical Risk Management » Volume 11
Effect of fluid loading on left ventricular volume and stroke volume variability in patients with end-stage renal disease: a pilot study
Authors Kanda H , Hirasaki Y, Iida T, Kanao-Kanda M, Toyama Y, Kunisawa T , Iwasaki H
Received 27 June 2015
Accepted for publication 8 September 2015
Published 20 October 2015 Volume 2015:11 Pages 1619—1625
DOI https://doi.org/10.2147/TCRM.S91296
Checked for plagiarism Yes
Review by Single anonymous peer review
Peer reviewer comments 3
Editor who approved publication: Professor Garry Walsh
Hirotsugu Kanda,1 Yuji Hirasaki,2 Takafumi Iida,1 Megumi Kanao-Kanda,1 Yuki Toyama,1 Takayuki Kunisawa,1 Hiroshi Iwasaki1
1Department of Anesthesiology and Critical Care Medicine, Asahikawa Medical University, Asahikawa, Hokkaido, Japan; 2Department of Anatomy, The Jikei University Graduate School of Medicine, Minato-ku, Tokyo, Japan
Purpose: The aim of this study was to investigate fluid loading-induced changes in left ventricular end-diastolic volume (LVEDV) and stroke volume variability (SVV) in patients with end-stage renal disease (ESRD) using real-time three-dimensional transesophageal echocardiography and the Vigileo-FloTrac system.
Patients and methods: After obtaining ethics committee approval and informed consent, 28 patients undergoing peripheral vascular procedures were studied. Fourteen patients with ESRD on hemodialysis (HD) were assigned to the HD group and 14 patients without ESRD were assigned to the control group. Institutional standardized general anesthesia was provided in both groups. SVV was measured using the Vigileo-FloTrac system. Simultaneously, a full-volume three-dimensional transesophageal echocardiography dataset was acquired to measure LVEDV, left ventricular end-systolic volume, and left ventricular ejection fraction. Measurements were obtained before and after loading 500 mL hydroxyethyl starch over 30 minutes in both groups.
Results: In the control group, intravenous colloid infusion was associated with a significant decrease in SVV (13.8%±2.6% to 6.5%±2.6%, P<0.001) and a significant increase in LVEDV (83.6±23.4 mL to 96.1±28.8 mL, P<0.001). While SVV significantly decreased after infusion in the HD group (16.2%±6.0% to 6.2%±2.8%, P<0.001), there was no significant change in LVEDV.
Conclusion: Our preliminary data suggest that fluid responsiveness can be assessed not by LVEDV but also by SVV due to underlying cardiovascular pathophysiology in patients with ESRD.
Keywords: stroke volume variability, end-stage renal disease, three-dimensional transesophageal echocardiography, hemodialysis, goal-directed fluid therapy
Introduction
End-stage renal disease (ESRD) is a significant global health issue. More than 1.4 million patients are estimated to have ESRD worldwide and the number is steadily increasing.1 Currently, more than 500,000 patients in the United States and 300,000 patients in Japan are receiving long-term hemodialysis (HD) for ESRD.2,3
While HD has extended the life expectancy of patients with ESRD and improved their quality of life, a growing number of these patients are referred to surgery. The majority of patients with ESRD have multiple comorbidities, including diabetes mellitus, hypertension, and coronary artery disease. Hence, these patients are at higher risk for perioperative cardiovascular morbidity and mortality, and perioperative management requires special attention.4,5
Perioperative fluid management is critically important. Persistent fluid overload causes hypertension, pulmonary edema, and congestive heart failure, and is associated with a higher risk of mortality.6 Therefore, patients with ESRD often receive HD on the day before surgery to achieve their dry weight, at which point they are considered to be euvolemic. On the other hand, these patients often develop significant hypotension in response to the induction of general anesthesia. Recurrent episodes of intra-dialytic hypovolemia are associated with accelerated deterioration of residual renal function,7 vascular access function loss,8 brain atrophy,9 mesenteric infarction,10 and thus, higher morbidity and mortality.11,12 Fluid therapy should be administered in an evidence-based, goal-directed manner.13–15 Surprisingly, however, few published studies address the validity of goal-directed fluid therapy for patients with ESRD.
Among the various parameters, stroke volume variability (SVV) and left ventricular (LV) volume are frequently used to assess fluid status perioperatively to guide goal-directed fluid therapy.14,15 SVV is calculated as a %change of stroke volume to the mean derived from an arterial pulse contour analysis during a mechanical ventilation cycle. SVV greater than 13% represents fluid responsiveness, the status in which fluid therapy would increase cardiac output.14,16,17 Findings from previous studies suggest that SVV is a reliable predictor of hypovolemia and fluid responsiveness in various clinical settings.18–20 On the other hand, left ventricular end-diastolic volume (LVEDV) is frequently measured using transesophageal echocardiography (TEE) as the gold standard indicator of cardiac preload.21 These two parameters are thought to respond in a coordinated manner to changes in the intravascular fluid status in low-risk patients.22 Long-term HD, however, is associated with progressive deterioration of the cardiovascular system, including LV hypertrophy, dilatation, and vascular calcification.23,24 These morphologic changes are frequently accompanied by LV diastolic dysfunction with a preserved ejection fraction (EF).
We have encountered many cases with ESRD in which the patient was hypotensive and the arterial waveform demonstrated a significant fluctuation, and TEE revealed a significantly dilated LV. These findings imply theoretically conflicting information on the fluid status, making the therapeutic decision difficult. How goal-directed fluid therapy should be administered and how fluid loading affects these two hemodynamic parameters in this patient subset are unclear.
We hypothesized that SVV decreases and LVEDV increases after fluid bolus in patients with ESRD, as observed in low-risk patients. We, therefore, conducted the present study to elucidate the effects of fluid loading on SVV and LVEDV in patients with ESRD. The aim of this study was to investigate fluid loading-induced changes in LVEDV and SVV in patients with ESRD using real-time three-dimensional TEE (3D-TEE) and the Vigileo-FloTrac system.
Materials and methods
Study design
This study is a single center, prospective, observational study. The study protocol was approved by the Asahikawa Medical University Research Ethics Committee and registered as a clinical trial (UMIN000007223). We obtained written informed consent from all patients.
Inclusion criteria
Consecutive patients with arteriosclerosis obliterans undergoing scheduled arterial bypass procedure on lower extremity were enrolled. The candidates were screened for eligibility for participation in the study through preoperative assessment. Transthoracic echocardiography and electrocardiogram were performed to assess preoperative cardiac function. Patients with arrhythmia, significant LV systolic dysfunction (left ventricular ejection fraction [LVEF] <50%), or contraindications for TEE probe insertion were excluded.
Interventions
The patients with ESRD requiring HD were assigned to the HD group and those without ESRD were assigned to the control group. Standardized perioperative care was provided for all patients. An arterial line was placed in the radial artery and connected to the Vigileo-FloTrac system (FloTrac™ sensor and Vigileo™ monitor, software version 3.02, Edwards Lifesciences, Tokyo, Japan). Arterial line was placed in the opposite side of the arteriovenous shunt in the HD group. General anesthesia was performed using target-controlled intravenous infusion of propofol (2.0–4.0 μg/mL) and continuous infusion of remifentanil (0.2–0.3 μg/kg/min). Propofol was infused to maintain a bispectral index within the range of 40–60. Rocuronium was administered to facilitate endotracheal intubation and to provide adequate muscle relaxation during surgery when necessary. Phenylephrine (50 μg) was administered, if necessary, to maintain a mean arterial pressure of >50 mmHg. Patients were mechanically ventilated with a tidal volume between 8 and 10 mL/kg to achieve normocapnia and positive end-expiratory pressure was applied at 5 cm H2O. A 3D-TEE probe (X7-2t, Philips Medical Systems Japan, Tokyo, Japan) was placed in the mid-esophageal position for the LV volumetry.
Once the anesthesia state was stabilized, 500 mL of 6% hydroxyethyl starch with a molecular weight/molar substitution ratio of 70 KDa/0.4 (Fresenius Kabi Japan, Tokyo, Japan) was administered over a 30-minute period in both groups. A full-volume 3D-TEE dataset was obtained before and after fluid bolus for LV volumetry. Simultaneously, the vital signs (heart rate, systolic, and diastolic blood pressure) and hemodynamic parameters by arterial pulse contour analysis (SVV and cardiac output) were recorded.
Data collection and analysis
Patient background, including age, height, weight, sex, and comorbidities, was collected from the medical records. For patients in the HD group, the history of HD and the amount of fluid removed the day before surgery were recorded. Early diastolic inflow (E), early diastolic mitral annular velocity by tissue Doppler imaging (e′), and E/e′ (E/e′ is a parameter of LV diastolic function calculated by dividing E by e′) were collected from the preoperative transthoracic echocardiography (TTE) record as indices of LV diastolic function. Intraoperative data collection and TEE volumetric analyses were performed by investigators blind to the preoperative TTE results. Volumetric parameters including LVEDV, LV end-systolic volume, cardiac output, and EF were measured using a full-volume 3D-TEE dataset of the LV by quantitative analysis software (QLAB, Philips Medical Systems Japan, Tokyo, Japan, Figure 1). In this study, changes in SVV and LVEDV following fluid bolus were set as primary outcomes.
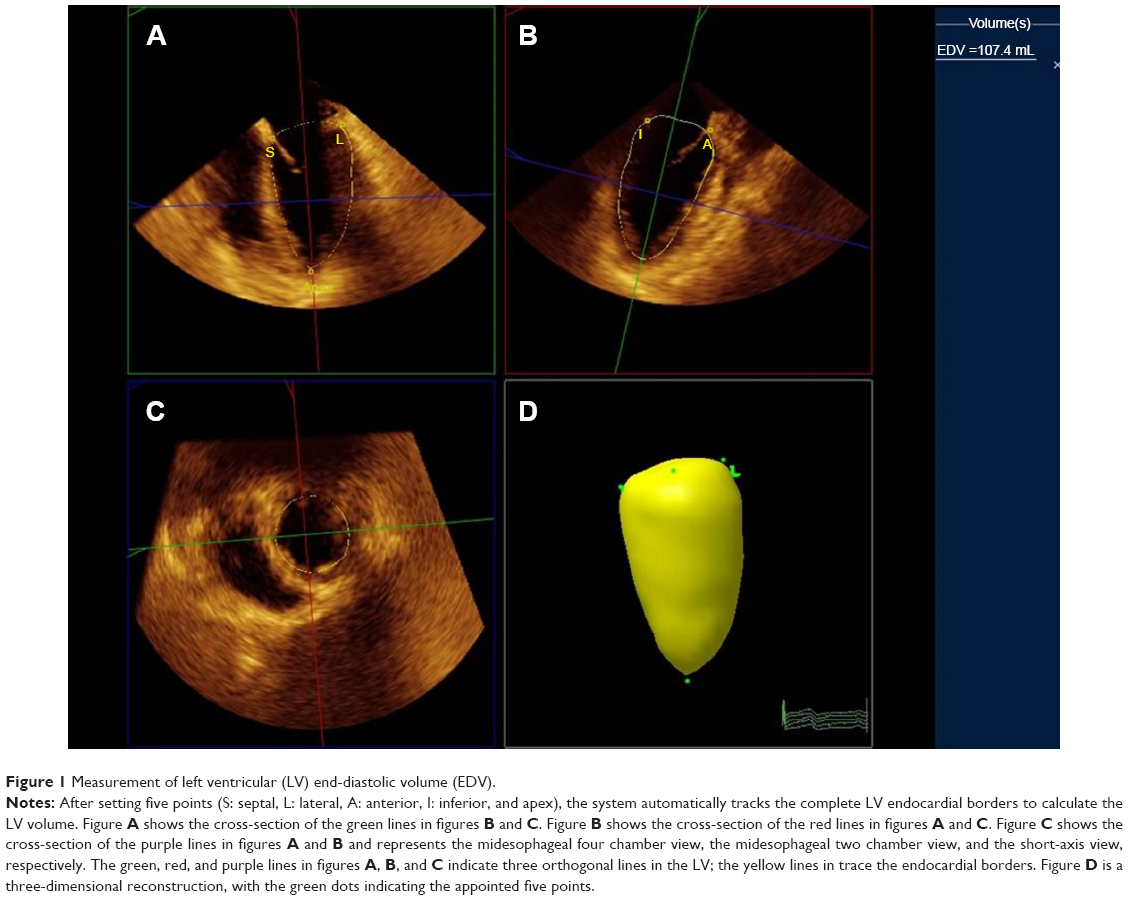 | Figure 1 Measurement of left ventricular (LV) end-diastolic volume (EDV). |
Statistics
A power analysis using G*Power (software version 3.1.7, University of Düsseldorf, Düsseldorf, Germany) indicated that a sample size of 14 patients per group would result in an approximate chance of obtaining statistical significance via a two-way repeated-measures analysis of variance (ANOVA), assuming a large effect size of 0.4 according to Cohen.25 Statistical analysis was performed using Prism (software version 5.01, GraphPad Software, La Jolla, CA, USA). Patient backgrounds were compared using Student’s t-test for continuous data and the chi-square test for categorical data. A two-way repeated-measures ANOVA followed by the Bonferroni post hoc test was performed to assess the patient vital signs and the parameters obtained by the pulse contour analysis and LV volumetry. A P-value of <0.05 was considered as statistically significant.
Results
Study cohorts
A total of 35 consecutive patients was enrolled, seven of whom were excluded for the following reasons: atrial fibrillation in four, left ventricular systolic dysfunction in two, and inadequate echocardiography imaging in one. As a result, 28 patients (14 in the HD group and 14 in the control group) were analyzed. There were no perioperative complications related to colloid infusion in both groups. The patient background is summarized in Table 1. The HD group had a significantly lower mean age and a significantly higher prevalence of diabetes. Patients in the HD group received HD and 1,700±675 mL of fluid was removed on the day before surgery. Preoperative TTE revealed that E/e′ was significantly higher in the HD group (16±3.8 vs 9.7±2.8, P=0.0012). The vital signs, arterial pulse contour parameters, and LV volumes before and after fluid loading are summarized in Table 2.
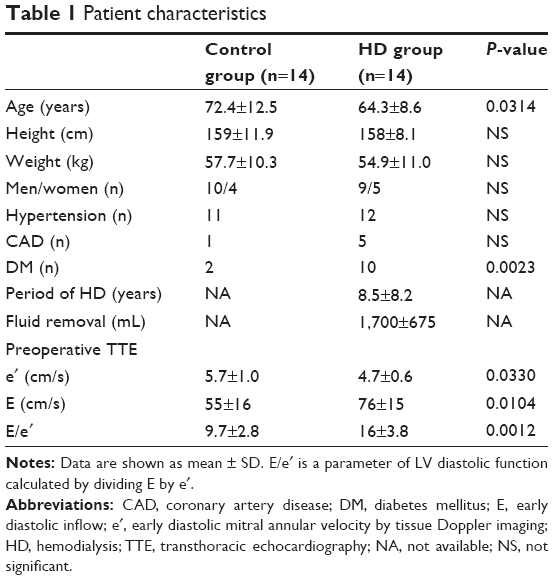 | Table 1 Patient characteristics |
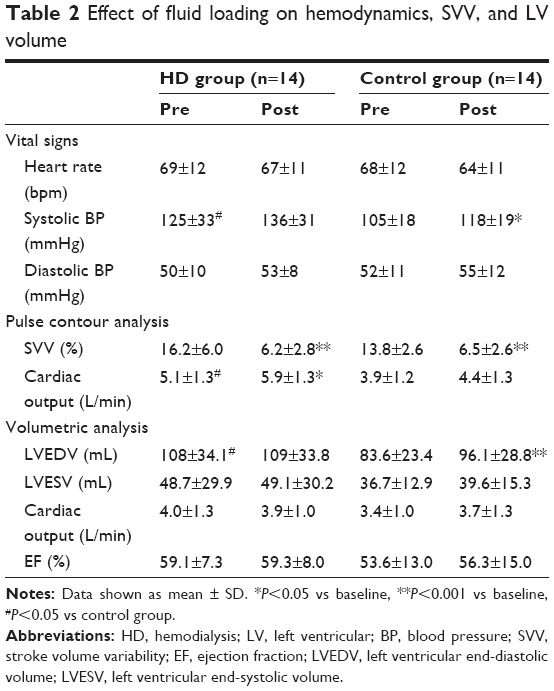 | Table 2 Effect of fluid loading on hemodynamics, SVV, and LV volume |
Change in SVV
There was a significant effect of time (F[1,26] =111.7, P<0.0001), but not of grouping on SVV. Post hoc analysis revealed that SVV significantly decreased after fluid bolus in both groups (HD group: 16.2%±6.0% to 6.2%±2.8%, P<0.001, control group: 13.8%±2.6% to 6.5%±2.6%, P<0.001) (Figure 2).
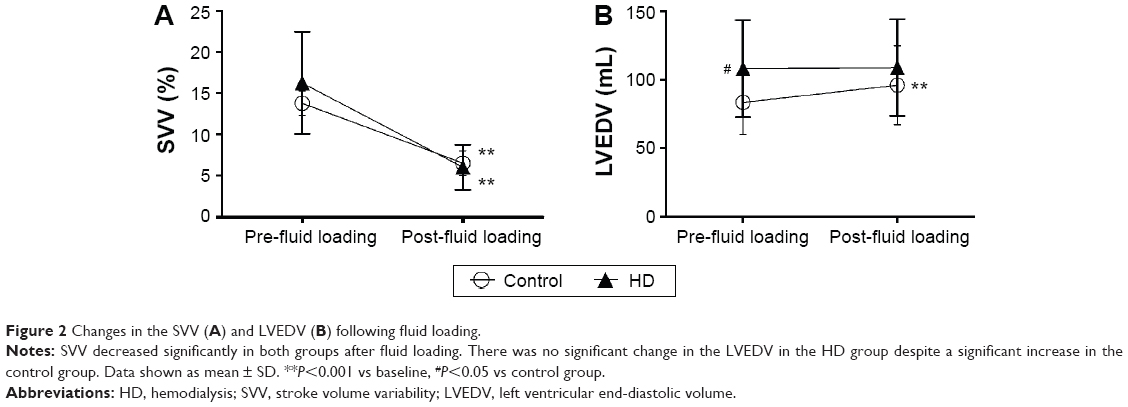 | Figure 2 Changes in the SVV (A) and LVEDV (B) following fluid loading. |
Change in LVEDV
There was a significant effect of time (F[1,26] =29.18, P<0.0001) on LVEDV. Post hoc analysis revealed that the mean LVEDV in the HD group before infusion was significantly greater than that of the control group (108±34.1 mL vs 83.6±23.4 mL, P<0.05). Furthermore, there was no significant change in LVEDV in the HD group (108±34.1 mL to 109±33.8 mL, P>0.05), while LVEDV significantly increased in the control group (83.6±23.4 mL to 96.1±28.8 mL, P<0.001) (Figure 2).
Discussion
The present study revealed a characteristic response pattern of the SVV and LVEDV associated with colloid infusion in patients with ESRD; SVV significantly decreased after infusion, but there was no change in LVEDV.
Several studies have demonstrated that SVV is a reliable predictor of fluid responsiveness in various clinical settings.26,27 In our study, patients in HD group underwent HD the day before surgery and a fair amount of fluid was removed. Therefore, it is reasonable to assume that the patients were in a relatively hypovolemic state on the day of surgery, as reflected by the high SVV. Furthermore, SVV significantly decreased in both patient groups. These findings suggest that the patients in the HD group were responsive to fluid therapy and that SVV can be used to guide intraoperative fluid therapy in HD patients.
LV area or volume is currently considered as the gold standard parameter of cardiac preload.21 Whether LVEDV predicts fluid responsiveness, however, is a matter of debate because previous studies have demonstrated conflicting results.28 These conflicting results might be due to the technical limitation of two-dimensional echocardiography to measure an accurate LV volume.28 Real-time 3D-TEE was therefore used to measure LV volumes in our study, as volumetric analysis by the real-time 3D-TEE is reportedly more accurate than two-dimensional TEE.29 In the present study, the LVEDV in HD group before colloid infusion was significantly greater than control and, to our surprise, did not increase after infusion despite SVV significantly decreased. This finding implies that there may be a pathophysiologic status in which fluid responsiveness can be assessed by SVV, but not by LVEDV.
Patients on long-term HD develop both morphologic and functional disturbances of the cardiovascular system. A study using magnetic resonance imaging reported that LV hypertrophy is frequently seen in patients with ESRD.23 Other studies demonstrated that this morphologic change of the LV is associated with LV diastolic dysfunction.30,31 In this study, E/e′ measured by preoperative TTE was used as a surrogate marker of LV diastolic function, because E/e′ is known to correlate with LV filling pressure and is relatively load independent.32–36 E/e′ greater than 15 is associated with elevated LV filling pressures.35 In the present study, the LVEDV in the HD group before colloid infusion was significantly greater than that in the control group despite preceding HD, and E/e′ in the HD group was markedly elevated and significantly greater than that in the control group. These findings suggest that patients with ESRD suffered from LV diastolic dysfunction.
Diastolic heart failure is a confusing concept.37 This concept has evolved as an attempt to discriminate between “acute vascular” and “acute congestive” heart failure.37,38 Acute vascular heart failure is caused by diastolic dysfunction, often with preserved EF, acute increases in peripheral resistance, and redistribution (rather than fluid accumulation) of blood from the peripheral to the pulmonary circulation. Moreover, adaptation of the lymph drainage from the lungs occurs in long-term ESRD patients.39 In contrast to acute vascular heart failure, fluid accumulation is considered as the essential and main mechanism of acute congestive heart failure. In our study, the baseline systolic blood pressure (SBP) in the HD group was significantly higher than that in the control group, indicating that patients with ESRD had a pathologic condition similar to diastolic heart failure, especially acute vascular heart failure. That is to say, they had an enlarged LV with subclinical diastolic dysfunction, normal systolic function, increases in peripheral resistance, and redistribution of blood from the peripheral to the pulmonary circulation. We speculate that the absence of a change in LVEDV after colloid infusion in HD patients is due to diastolic dysfunction and a subsequent redistribution of blood volume.
Our study has some limitations. First, this study was conducted as a pilot study, enrolling minimum number of patients considering a potential risk of colloid infusion in HD group. The potential confounding factors in the patient background were therefore not controlled. Furthermore, the effect of the severity of diastolic dysfunction was not stratified in the study cohort; therefore, how the severity of diastolic function affects fluid responsiveness was not addressed. Finally, hydroxyethyl starch was used as a study solution because it remains in the intravascular space and is thus more effective for fluid replacement than crystalloid. The European Medicines Agency and Food and Drug Administration of the United States, however, have issued warnings regarding the use of hydroxyethyl starch for volume expansion in critically ill patients. Although the patients in this study were all in a stable condition and there were no complications associated with colloid infusion, careful consideration is necessary in selecting the type of solution for fluid replacement in patients with ESRD.
Conclusion
In conclusion, we investigated changes in SVV and LVEDV associated with colloid infusion in patients with ESRD. In patients with ESRD, colloid infusion was associated with a significant decrease in SVV, but no significant change in LVEDV was observed. Our findings suggest that a change in blood volume can be reflected as a change in SVV, but not in LVEDV, in patients with ESRD due to underlying LV diastolic dysfunction. Diastolic function appears to be an important factor that affects fluid loading-associated changes in LV volume. Further investigation is necessary to elucidate the relationship between fluid responsiveness and LV diastolic function to establish an effective, goal-directed fluid management strategy for patients with ESRD.
Author contributions
Hirotsugu Kanda, Yuji Hirasaki, Megumi Kanao-Kanda, Takafumi Iida, Yuki Toyama, and Takayuki Kunisawa helped design the study, conduct the study, and analyze the data. Hiroshi Iwasaki conducted the study and helped analyze the data. All authors contributed toward drafting and critically revising the paper, gave final approval of the version to be published, and agree to be accountable for all aspects of the work.
Disclosure
The authors report no conflicts of interest in this work.
References
Moeller S, Gioberge S, Brown G. ESRD patients in 2001: global overview of patients, treatment modalities and development trends. Nephrol Dial Transplant. 2002;17:2071–2076. | ||
Takami Y, Tajima K, Okada N, et al. Simplified management of hemodialysis-dependent patients undergoing cardiac surgery. Ann Thorac Surg. 2009;88:1515–1519. | ||
Imai E, Matsuo S. Prevalence of chronic kidney disease in the Japanese general population. Clin Exp Nephrol. 2009;13:621–630. | ||
Trainor D, Borthwick E, Ferguson A. Perioperative management of the hemodialysis patient. Semin Dial. 2011;24(3):314–326. | ||
Eilers H, Liu KD, Gruber A, Niemann CU. Chronic kidney disease: implications for the perioperative period. Minerva Anestesiol. 2010;76:725–736. | ||
Wizemann V, Wabel P, Chamney P, et al. The mortality risk of overhydration in haemodialysis patients. Nephrol Dial Transplant. 2009;24(5):1574–1579. | ||
Jansen MA, Hart AA, Korevaar JC, Dekker FW, Boeschoten EW, Krediet RT. Predictors of the rate of decline of residual renal function in incident dialysis patients. Kidney Int. 2002;62(3):1046–1053. | ||
Puskar D, Pasini J, Savic I, Bedalov G, Sonicki Z. Survival of primary arteriovenous fistula in 463 patients on chronic hemodialysis. Croat Med J. 2002;43(3):306–311. | ||
Mizumasa T, Hirakata H, Yoshimitsu T, et al. Dialysis-related hypotension as a cause of progressive frontal lobe atrophy in chronic hemodialysis patients: a 3-year prospective study. Nephron Clin Pract. 2004;97(1):c23–c30. | ||
John AS, Tuerff SD, Kerstein MD. Nonocclusive mesenteric infarction in hemodialysis patients. J Am Coll Surg. 2000;190(1):84–88. | ||
Shoji T, Tsubakihara Y, Fujii M, Imai E. Hemodialysis-associated hypotension as an independent risk factor for two-year mortality in hemodialysis patients. Kidney Int. 2004;66(3):1212–1220. | ||
Tisler A, Akocsi K, Harshegyi I, et al. Comparison of dialysis and clinical characteristics of patients with frequent and occasional hemodialysis-associated hypotension. Kidney Blood Press Res. 2002;25(2):97–102. | ||
Gan TJ, Soppitt A, Maroof M, et al. Goal-directed intraoperative fluid administration reduces length of hospital stay after major surgery. Anesthesiology. 2002;97:820–826. | ||
Gutierrez MC, Moore PG, Liu H. Goal-directed therapy in intraoperative fluid and hemodynamic management. J Biomed Res. 2013;27(5):357–365. | ||
Davies SJ, Minhas S, Wilson RJ, Yates D, Howell SJ. Comparison of stroke volume and fluid responsiveness measurements in commonly used technologies for goal-directed therapy. J Clin Anesth. 2013;25:466–474. | ||
Reuter DA, Felbinger TW, Schmidt C, et al. Stroke volume variations for assessment of cardiac responsiveness to volume loading in mechanically ventilated patients after cardiac surgery. Intensive Care Med. 2002;28:392–398. | ||
Cannesson M, Musard H, Desebbe O, et al. The ability of stroke volume variations obtained with Vigileo/FloTrac system to monitor fluid responsiveness in mechanically ventilated patients. Anesth Analg. 2009;108:513–517. | ||
Marx G, Cope T, McCrossan L. Assessing fluid responsiveness by stroke volume variation in mechanically ventilated patients with severe sepsis. Eur J Anaesthesiol. 2004;21:132–138. | ||
Reuter DA, Kirchner A, Felbinger TW. Usefulness of left ventricular stroke volume variation to assess fluid responsiveness in patients with reduced cardiac function. Crit Care Med. 2003;31:1399–1404. | ||
Wiesenack C, Fiegl C, Keyser A, Prasser C, Keyl C. Assessment of fluid responsiveness in mechanically ventilated cardiac surgical patients. Eur J Anaesthesiol. 2005;22:658–665. | ||
Tousignant CP, Walsh F, Mazer CD. The use of transesophageal echocardiography for preload assessment in critically ill patients. Anesth Analg. 2000;90:351–355. | ||
Kungys G, Rose DD, Fleming NW. Stroke volume variation during acute normovolemic hemodilution. Anesth Analg. 2009;109(6):1823–1830. | ||
Patel RK, Oliver S, Mark PB, et al. Determinants of left ventricular mass and hypertrophy in hemodialysis patients assessed by cardiac magnetic resonance imaging. Clin J Am Soc Nephrol. 2009;4:1477–1483. | ||
Goodman WG, Goldin J, Kuizon BD, et al. Coronary-artery calcification in young adults with end-stage renal disease who are undergoing dialysis. N Engl J Med. 2000;342:1478–1483. | ||
Cohen J. Statistical Power Analysis for the Behavioral Sciences. 2nd ed. Hillsdale, NJ: Erlbaum; 1988. | ||
Lahner D, Kabon B, Marschalek C, et al. Evaluation of stroke volume variation obtained by arterial pulse contour analysis to predict fluid responsiveness intraoperatively. Br J Anaesth. 2009;103:346–351. | ||
Mailloux PT, Friderici J, Freda B, McGee WT. Establishing goals of volume management in critically ill patients with renal failure. J Nephrol. 2012;25(6):962–968. | ||
Bendjelid K, Romand JA. Fluid responsiveness in mechanically ventilated patients: a review of indices used in intensive care. Intensive Care Med. 2003;29:352–360. | ||
Jacobs LD, Salgo IS, Goonewardena S, et al. Rapid online quantification of left ventricular volume from real-time three-dimensional echocardiographic data. Eur Heart J. 2006;27:460–468. | ||
Nette RW, van den Dorpel MA, Krepel HP, et al. Hypotension during hemodialysis results from an impairment of arteriolar tone and left ventricular function. Clin Nephrol. 2005;63:276–283. | ||
Hung MJ, Yang NI, Wu IW, Cheng CW, Wu MS, Cherng WJ. Echocardiographic assessment of structural and functional cardiac remodeling in patients with predialysis chronic kidney disease. Echocardiography. 2010;27:621–629. | ||
Pecoits-Filho R, Bucharles S, Varberato SH. Diastolic heart failure in dialysis patients: mechanisms, diagnostic approach, and treatment. Semin Dial. 2012;25:35–41. | ||
Sohn D, Chai L, Lee D, et al. Assessment of mitral annulus velocity by Doppler tissue imaging in the evaluation of left ventricular diastolic function. J Am Coll Cardiol. 1997;30:474–480. | ||
Nagueh SF, Middleton KJ, Kopelen HA, Zoghbi WA, Quiñones MA. Doppler tissue imaging: a noninvasive technique for evaluation of left ventricular relaxation and estimation of filling pressures. J Am Coll Cardiol. 1997;30:1527–1533. | ||
Ommen SR, Nishimura RA, Appleton CP, et al. Clinical utility of Doppler echocardiography and tissue Doppler imaging in the estimation of left ventricular filling pressures: a comparative simultaneous Doppler-catheterization study. Circulation. 2000;102:1788–1794. | ||
Kasner M, Westermann D, Steendijk P. Utility of Doppler echocardiography and tissue Doppler imaging in the estimation of diastolic function in heart failure with normal ejection fraction: a comparative Doppler-conductance catheterization study. Circulation. 2007;116:637–647. | ||
Dorhout Mees EJ. Diastolic heart failure: a confusing concept. Heart Fail Rev. 2013;18(4):503–509. | ||
Cotter G, Felker GM, Adams KF, Milo-Cotter O, O’Connor CM. The pathophysiology of acute heart failure – is it all about fluid accumulation? Am Heart J. 2008;155(1):9–18. | ||
Szidon JP. Pathophysiology of the congested lung. Cardiol Clin. 1989;7(1):39–48. |
 © 2015 The Author(s). This work is published and licensed by Dove Medical Press Limited. The full terms of this license are available at https://www.dovepress.com/terms.php and incorporate the Creative Commons Attribution - Non Commercial (unported, v3.0) License.
By accessing the work you hereby accept the Terms. Non-commercial uses of the work are permitted without any further permission from Dove Medical Press Limited, provided the work is properly attributed. For permission for commercial use of this work, please see paragraphs 4.2 and 5 of our Terms.
© 2015 The Author(s). This work is published and licensed by Dove Medical Press Limited. The full terms of this license are available at https://www.dovepress.com/terms.php and incorporate the Creative Commons Attribution - Non Commercial (unported, v3.0) License.
By accessing the work you hereby accept the Terms. Non-commercial uses of the work are permitted without any further permission from Dove Medical Press Limited, provided the work is properly attributed. For permission for commercial use of this work, please see paragraphs 4.2 and 5 of our Terms.