")
Back to Journals » Drug Design, Development and Therapy » Volume 11
Effect of echinacoside on kidney fibrosis by inhibition of TGF-β1/Smads signaling pathway in the db/db mice model of diabetic nephropathy
Authors Tang FJ , Hao YR, Zhang X, Qin J
Received 12 June 2017
Accepted for publication 4 August 2017
Published 21 September 2017 Volume 2017:11 Pages 2813—2826
DOI https://doi.org/10.2147/DDDT.S143805
Checked for plagiarism Yes
Review by Single anonymous peer review
Peer reviewer comments 2
Editor who approved publication: Dr Qiongyu Guo
Fengjuan Tang,1 Yarong Hao,1 Xue Zhang,1 Jian Qin2
1Department of Geriatrics, 2Central Laboratory, Renmin Hospital of Wuhan University, Hubei, People’s Republic of China
Abstract: Kidney fibrosis and renal tubular epithelial-to-mesenchymal transition (EMT) are the main pathological changes of diabetic nephropathy (DN), which eventually leads to end-stage renal disease. Previous studies have suggested that echinacoside (ECH) is antifibrotic in the liver. However, the effect of ECH on kidney fibrosis in DN and its mechanisms are unknown. This study was performed to explore the effect of ECH on kidney fibrosis and also the molecular mechanisms of ECH in a db/db mice model of DN. Our results showed that, relative to db/db mice, the mice in the ECH group had an improved general state and reduced blood glucose and 24-hour urinary protein levels. The deterioration of renal function was delayed due to treatment with ECH. We also observed that ECH can improve histopathological findings in the kidneys of db/db mice, including collagen deposition, mesangial cell and mesangial matrix hyperplasia, basement membrane thickening, and podocyte reduction. Moreover, ECH inhibited the TGF-β1/Smads signaling pathway, downregulated fibronectin (FN), collagen IV, and alpha-smooth muscle actin (α-SMA) levels, and upregulated E-cadherin level in the db/db mice model of DN. Our findings indicate that ECH has a therapeutic effect on DN, including the inhibition of renal tubular EMT and kidney fibrosis. Furthermore, ECH inhibits kidney fibrosis through regulation of the TGF-β1/Smads signaling pathway.
Keywords: diabetic nephropathies, echinacoside, db/db mice, kidney fibrosis, EMT, TGF-β1/Smads signaling pathway
Introduction
Diabetic nephropathy (DN) is one of the most common and most serious complications of diabetes and eventually leads to end-stage renal disease (ESRD),1 being the most important cause of death in diabetic patients. In recent times, with changes in lifestyle and eating habits, the morbidity of diabetes has increased year by year. A relevant epidemiological survey2 shows that adult diabetic patient numbers will increase from 285 million in 2010 to 439 million in 2030; that is, by 2030, global diabetes levels compared with 2010 will be almost 1.5 times. Currently, the continued progress of diabetes treatments means that deaths due to acute complications of diabetes have been greatly reduced; however, the incidence of various chronic complications of diabetes has significantly increased, and nearly one-third of type 1 or 2 diabetic patients will eventually develop DN.
DN is characterized by a progressive increase in persistent albuminuria. Typical renal morphological changes include the following: glomerular basement membrane (GBM) thickening, mesangial matrix widening, glomerular sclerosis, podocyte loss, renal tubular basement membrane thickening, tubular atrophy and increased apoptosis, renal inflammatory infiltration, renal interstitial fibrosis, periosteal capillaries becoming sparse, the wall of efferent arteriole and afferent arteriole are hyaline degeneration, especially the efferent arteriole.3 There are several risk factors for the development of DN: persistent long-term diabetes, age, race, systemic or glomerular-derived hypertension, poor glycemic control, genetic kidney disease susceptibility, and diet;4 when the pathogenesis of DN is not clear, renal fibrosis often occurs with DN, ultimately leading to end-stage renal failure. Renal fibrosis is the result of an excessive accumulation of extracellular matrix (ECM), in which TGF-β is believed to be a major regulator of epithelial-to-mesenchymal transition (EMT). At the same time, TGF-β may promote the production of fibrosis through a variety of intracellular signals such as protein kinase and cytokine, so TGF-β plays a very important role in the development of DN.5
Currently, the treatment of DN is mainly to control blood sugar, lower blood pressure, reduce urinary protein, control hyperlipidemia, eat a low-protein diet, and to correct water and electrolyte metabolism disorders, and also other treatments; these treatments can delay the progress of DN but cannot stop ESRD from occurring.6 Echinacoside (ECH; Figure 1) is a natural phenylethanol isolated from Cistanche, which is a commonly used drug in traditional Chinese medicine; its use in this study is a breakthrough in the use of traditional Chinese medicine for the treatment of DN.7 It is mainly used to enhance renal function and in the treatment of impotence, premature ejaculation and male infertility, vaginal discharge, blood clots, and chronic constipation in the elderly.8 Investigations of ECH have found that it provides liver protection and has anti-fibrosis, anti-oxidation, and anti-apoptosis qualities.9–11 You et al9 have shown that echinacea can inhibit the activation of hepatic stellate cells by blocking TGF-β1/Smads signaling pathway, thereby inhibiting hepatic fibrosis. In this study, type 2 diabetic mice were used as the research model to explore the protective effect of ECH on kidneys in DN and to explore possible mechanisms of action of ECH, so providing a theoretical basis for the treatment of DN.
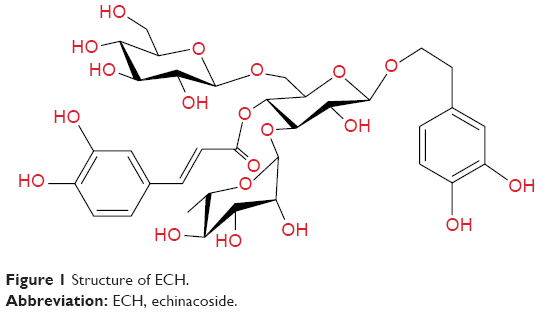 | Figure 1 Structure of ECH. |
Materials and methods
Chemicals and reagents
ECH powder was purchased from Shanghai Winherb Medical Science Co., Ltd. (Shanghai, People’s Republic of China). It is a white crystalline power with ECH purity of 94%, as analyzed by high-performance liquid chromatography. ECH was dissolved in methanol, ethanol, and water.
Experimental animals and treatment
All experiments were performed according to the National Institutes of Health guidelines (NIH Pub. No 85-23, revised 1996) concerning the care and treatment of experimental animals and approved by the experimental animal ethics committee of Renmin Hospital of Wuhan University affiliated to the animal feeding center of Renmin Hospital of Wuhan University. A total of 20 male db/db mice (6 weeks of age) weighing 40–45 g and nine db/m mice (6 weeks of age) weighing 20–25 g with genetic background C57BLKS/J were purchased from Nanjing University – Nanjing Biomedical Research Institute (Nanjing, People’s Republic of China) and were raised in animal houses at the Renmin Hospital of Wuhan University (Wuhan, People’s Republic of China).
All animals were kept in the following conditions: at room temperature of 18°C–24°C, relative humidity 60%, daily light of 12 hours, free feeding during the experiment, with drinking water, feeding on ordinary feed, and not being given any hypoglycemic drugs. The mice were quarantined for 1 week and adapted for 1 week. db/db mice were randomly divided into the model group (db/db, n=10) and the treatment group (db/db + ECH, n=11), and db/m mice were used as the normal control group (db/m, n=9). All mice were given intervention at 8 weeks of age: the db/m group and the db/db group were treated with 0.05 mL/10 g body weight saline for 10 weeks; the db/db + ECH group was treated with ECH 300 mg/(kg·day) by body weight, for a total of 10 weeks. Body weight measurements were conducted every 2 weeks. Blood samples for the determination of blood glucose levels were taken from tail tip every 2 weeks using the Johnson & Johnson blood glucose meter and test strips (Johnson & Johnson, New Brunswick, NJ, USA), after the mice had fasted for 8 hours. The 24-hour urine sample was collected from the mice in metabolic cages every 4 weeks, beginning when the mice were at the age of 10 weeks, to detect urinary protein and creatinine (Cr). After 10 weeks of intervention, all the mice were anesthetized with an intraperitoneal injection of 2% pentobarbital sodium (0.1 mL/10 g). Blood was retro-orbitally collected, stored for 2 hours at 4°C, and centrifuged (2,500 rpm) for 20 minutes at 4°C; the upper layer of serum was collected and stored at −80°C until analysis. After heart perfusion, separation of the kidneys on both sides of the kidneys, observation of the general situation, stripping of the renal capsule, and weighting the left kidney with an electronic balance. The kidneys were cut into sections and fixed in 1 mL electrosurgical fluid. The remaining left kidney were fixed with 4% paraformaldehyde for paraffin sectioning. The right kidney was stored in liquid nitrogen for 1 hour and then stored at −80°C, before being used for Western blotting and real-time polymerase chain reaction (RT-PCR).
Metabolic and biochemical parameters
At 18 weeks of age, all mice were deprived of food pellets for 12 hours, and blood was retro-orbitally collected. Blood urea nitrogen (BUN) and plasma Cr levels were measured using an automated biochemical analyzer (Hitachi Ltd., Tokyo, Japan).
Urinary albumin and urinary Cr analysis
Mice were transferred to metabolic cages for 24 hours to collect urine samples every 4 weeks; these samples were centrifuged (3,000 rpm) for 15 minutes at 4°C, and the upper layer of serum was collected. Urine albumin and urinary Cr were measured using an automated biochemical analyzer (Johnson & Johnson).
Kidney histology
Kidney sections were fixed in 4% neutral buffer paraformaldehyde, embedded in paraffin, and cut into 4 μm-thick sections, which were then prepared for hematoxylin and eosin (HE), Masson’s modified trichrome histological, and periodic acid–Schiff (PAS) staining. For HE staining, paraffin sections were dewaxed in conventional dewaxing water, immersed in hematoxylin for 1 minute, subjected to liquid differentiation for 5 seconds, and immersed in eosin for 2 minutes, followed by neutral gum sealing. Kidney tissues were stained in Weigert’s iron hematoxylin solution (50 mL alcoholic hematoxylin and 50 mL acidified ferric chloride solution) for 10 minutes. The tissues were then rinsed in tap water for 10 minutes followed by 1% hydrochloric acid alcohol differentiation for 1 minute. They were then washed in water for several minutes followed by immersion in Li Chun red acid red wine dye for 5–10 minutes; they were then washed slightly with distilled water and 1% phosphomolybdic acid aqueous solution for approximately 5 minutes. This was followed directly with aniline blue liquid or green liquid complex for 5 minutes, 1% glacial acetic acid for 1 minute, and then neutral gum sealing. For PAS staining, kidneys obtained from each group were embedded in paraffin after fixation and cut into 4 μm sections. The paraffin sections were stained with PAS reagent (Baso, Zhuhai, People’s Republic of China) and observed under the microscope after counterstaining with hematoxylin. The paraffin sections were scored according to a reference standard for the density of collagen fibers, based on the percentage of collagen fibers throughout the total area. The data were recorded and analyzed after scoring. Stained sections were examined at 400× magnification by an observer blinded to the treatment group from which the tissue slices originated. The ratio of the mesangial matrix area to total glomerular area in PAS-stained sections and the ratio of area with collagen accumulation to total glomerular area in Masson’s trichrome-stained sections were determined using the Image-Pro Plus quantitative software as previously described (Pax-it; Paxcam, Villa Park, IL, USA).12 In each section, 20 glomeruli were randomly selected, and positive signals within the selected glomerulus were highlighted and measured, with the positive area quantified as a percentage of the entire glomerulus.13
Electron microscopy
Three specimens in each group were cut into small pieces (1 mm ×1 mm ×1 mm). These pieces were washed with sodium chloride physiological solution, fixed in 3.75% glutaraldehyde, dehydrated with a graded series of ethanol, sectioned with an ultramicrotome, and stained with saturated uranium acetate. Transmission electron microscopy was performed using a JEM 100CX electron microscope (JEOL, Tokyo, Japan).
Immunohistochemistry
Kidney tissues were fixed in 4% neutral buffer paraformaldehyde, embedded in paraffin, sliced (3 μm), dewaxed, washed three times with phosphate-buffered saline (PBS) for 5 minutes each time, incubated in 0.01% Triton for 8 minutes and in 3% hydrogen dioxide solution for 10 minutes, antigen repaired with citrate buffer solution in a microwave, blocked with 10% goat serum, and incubated with primary antibodies against fibronectin (FN; 1:100 dilution; Abcam, Cambridge, UK), collagen IV (1:100 dilution; Abcam), E-cadherin (1:100 dilution; Abcam), and alpha-smooth muscle actin (α-SMA; 1:200 dilution; Abcam). The sections were washed three times with PBS for 5 minutes, after which they were incubated in goat anti-rabbit IgG (1:1,000 dilution; Abcam) bound to horseradish peroxidase (HRP; 1:1,000 dilution; Abcam) for 30 minutes, washed three times with PBS, and stained with diaminobenzidine for 5–10 minutes. Images were obtained using a light microscope (Ni-U; Nikon Corporation, Tokyo, Japan). The images were analyzed quantitatively by Image-Pro Plus 6.0 (Media Cybernetics, Inc., Washington, DC, USA). For each group, 8–12 fields were randomly selected to determine the optical density value.
Western blot analysis
Renal tissues (~100 mg) were collected and lysed with radio-immunoprecipitation assay and phenylmethylsulfonyl fluoride (PMSF) buffer; the product was clarified by centrifugation, and the supernatants were collected. Protein concentrations were determined using the bicinchoninic acid protein assay. Equivalent amounts of protein (30 μg) were resolved on sodium dodecyl sulfate polyacrylamide gels and transferred by electroblotting to polyvinylidene difluoride membranes. The membranes were blocked in 5% (w/v) nonfat milk (Erie Inc., Hubei, People’s Republic of China) at room temperature for 1 hour, after which they were incubated overnight at 4°C with specific primary antibodies against TGF-β1 (1:1,000 dilution; CST, Danvers, MA, USA), Smad2 (1:1,000 dilution; CST), Smad3 (1:1,000 dilution; CST), Smad4 (1:1,000 dilution; CST), FN (1:1,000 dilution; Abcam), collagen IV (1:1,000 dilution; Abcam), and α-SMA (1:1,500 dilution; Abcam, Cambridge, MA, USA). The membranes were washed in Tris-buffered saline (TBS)-T (Tween 20) buffer (0.1% TBS-T; TBS with 0.1% Tween 20) three times for 8 minutes each time and in TBS one time for 8 minutes and incubated with HRP-linked anti-mouse secondary antibodies (1:10,000 dilution; CST) or anti-rabbit secondary antibodies (1:10,000 dilution; CST). The membranes were washed in 0.1% TBS-T and TBS, after which the immunolabeled proteins were detected using Odyssey two-color infrared fluorescence imaging system (LICOR Inc., Washington, DC, USA). The density of the detected bands was analyzed using ImageJ software (NIH, Bethesda, MD, USA).
RT-PCR
Total RNA was isolated using TRIzol reagent (Thermo Fisher Scientific, Waltham, MA, USA) according to the manufacturer’s instructions. Then, the RNA was reverse transcribed into complementary DNA using the Reverse Transcription System (Takara, Tokyo, Japan). Relative mRNA levels were examined by SYBR Green RT quantitative reverse transcription-PCR (ABI 7500; Thermo Fisher Scientific) and were calculated using the 2−ΔΔCt method. The primer sequence is provided in Table 1.
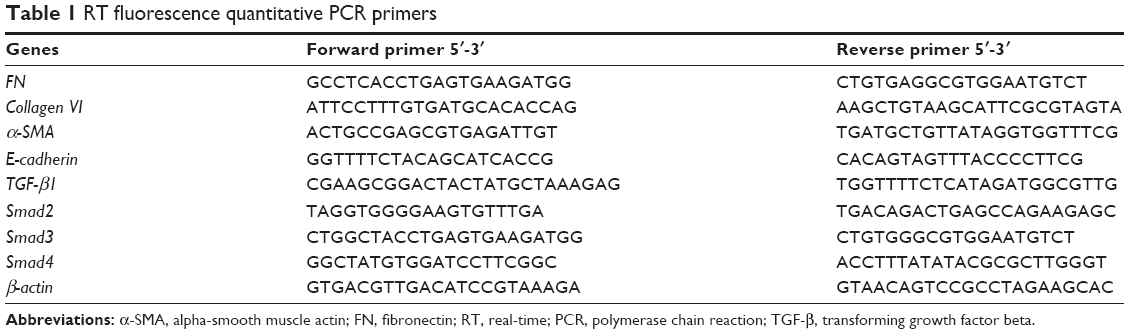 | Table 1 RT fluorescence quantitative PCR primers |
Statistical analyses
Data are presented as mean ± SD. Statistical analyses were performed using SPSS 21.0 (IBM Corporation, Armonk, NY, USA). The differences among multiple groups were evaluated by one-way analyses. When comparing the two, the data are homogeneous using the least significant difference (LSD) method, and the date of non-normal distribution is used by Dunnett’s test. P<0.05 was considered statistically significant.
Results
Effect of ECH on the general state of db/db mice
Continually, db/db mice appeared listless, exhibited reduced activity, consumed more food and water, and had a greater urinary output. In this experiment, the blood glucose level of the mice was detected every week. As shown in Figure 2A, over the time period of the experiment, the fasting blood glucose (FBG) of the db/db and db/db + ECH group increased, and there was a significant difference to db/m mice (P<0.01). Although the FBG of the mice in the db/db + ECH group also increased, after 10 weeks of intervention, the FBG of the db/db + ECH group was significantly reduced relative to the db/db group (P<0.01). In addition, the mice were weighed every week. As shown in Figure 2B, over the time period of the experiment, the body weight of the db/db and db/db + ECH mice gradually increased, and there was a significant difference to db/m mice. After 10 weeks of treatment, the weight of the db/db + ECH group was significantly reduced relative to the db/db group (P<0.01).
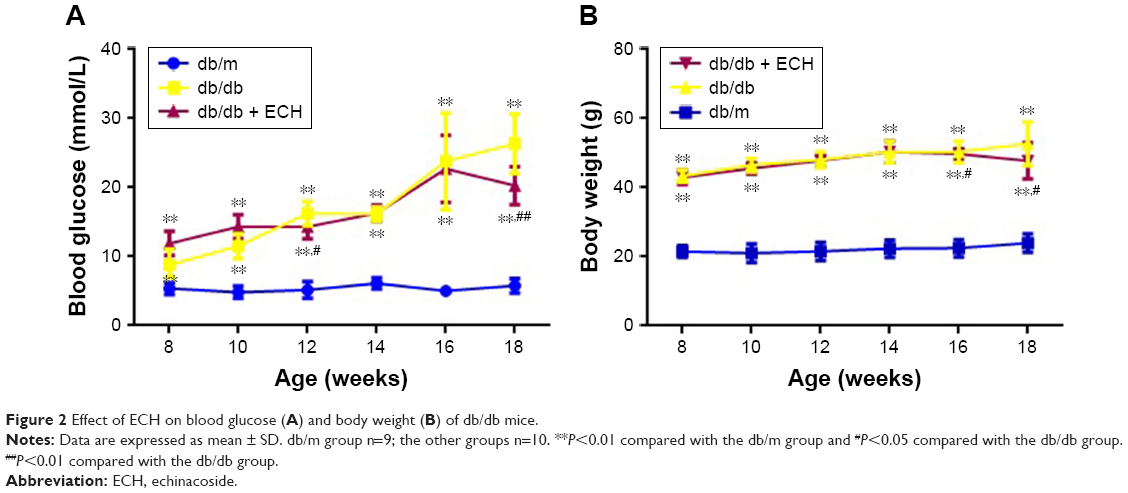 | Figure 2 Effect of ECH on blood glucose (A) and body weight (B) of db/db mice. |
Effect of ECH on the biochemical parameters of db/db mice
Kidney weight in the db/db group was significantly higher than the db/m group (Table 2; P<0.01), and the kidney weight of the db/db + ECH group was significantly reduced compared with the db/db group (Table 2; P<0.01), after 10 weeks of treatment. At the end of week 18, blood serum Cr and BUN were significantly reduced in the db/db + ECH group relative to the db/db group (Table 1; P<0.01). All the abovementioned results indicate that ECH has a protective effect on kidney function in db/db mice.
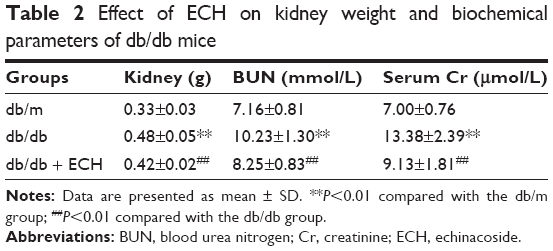 | Table 2 Effect of ECH on kidney weight and biochemical parameters of db/db mice |
Effect of ECH on albuminuria in db/db mice
The 24-hour urinary protein was detected every 4 weeks (Table 3). As time progressed, the 24-hour urinary protein of the db/db group gradually increased, and it was significantly higher than that of the db/m group at 10 weeks (Table 3; P<0.01). Relative to the db/db group, the 24-hour urinary protein in the db/db + ECH group was significantly decreased at 14 weeks (Table 3; P<0.05). Although the urinary protein was increased at week 18 in the db/db + ECH group, it was significantly lower than that in the db/db group (Table 3; P<0.05). The abovementioned data indicate that ECH can protect renal function.
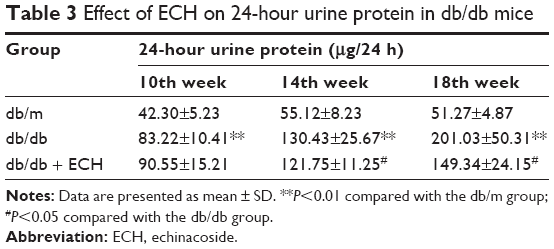 | Table 3 Effect of ECH on 24-hour urine protein in db/db mice |
Effect of ECH on the morphologic changes in the kidneys of db/db mice
Kidney tissues were collected for HE, Masson, and PAS staining at the end of the experiment, and structural changes under the light microscope are shown for each group in Figure 3. Both HE and PAS staining demonstrated that, compared with the db/m group, db/db mice had notable glomerular hypertrophy, mesangial matrix expansion, and partial renal tubular atrophy (Figure 3A and B). Treatment with ECH significantly ameliorated those changes. The ratio of the mesangial matrix area to total glomerular area (M/G) in PAS-stained sections showed that M/G ratios were higher in db/db mice than in db/m mice, whereas treatment with ECH significantly lowered the M/G ratio (Figure 3E; P<0.05). Masson staining revealed collagen fiber deposition in the glomerular and renal tubules of db/db mice (Figure 3C). After the 10-week treatment with ECH, fibrosis and collagen development in db/db mice were significantly inhibited. According to the statistical assessment of fibrosis levels (Figure 3D), the area of interstitial fibrosis in db/db mice was significantly larger than in db/m mice, although ECH treatment significantly reduced the fibrosis area (P<0.05). All the abovementioned findings confirm the therapeutic effect of ECH.
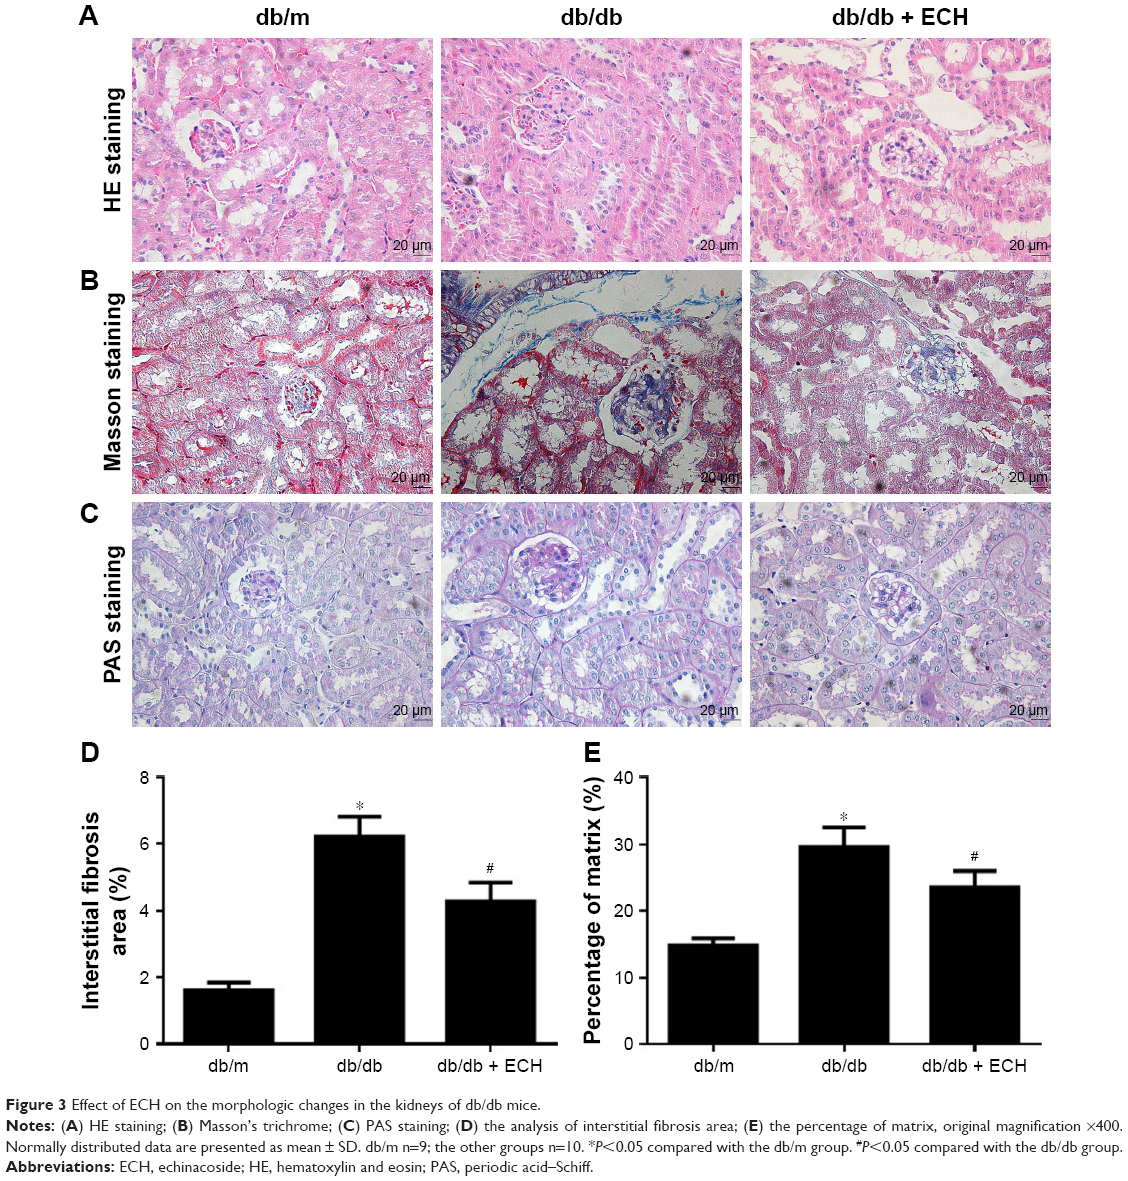 | Figure 3 Effect of ECH on the morphologic changes in the kidneys of db/db mice. |
Effect of ECH on renal ultrastructural pathology in db/db mice
To prove the success of the DN model and the effect of ECH on DN, we used electron microscopy to detect changes in kidney tissues (Figure 4). This revealed that the number and morphology of renal podocytes in the db/m group were normal, and the mesangial cells and mesangial matrix were also normal, with no thickening of the GBM (Figure 4A and B). The number of podocytes in the kidneys of the db/db group was decreased, and the morphology was abnormal. In addition, there was podocyte fusion. There was no obvious abnormality in the glomerular endothelial cells, and the glomerular GBM was irregularly thickened. There was no significant difference in the number of podocytes and GBM thickness between the db/db + ECH group and the db/m group. The mesangial cells and mesangial matrix hyperplasia were significantly less than in the db/db group.
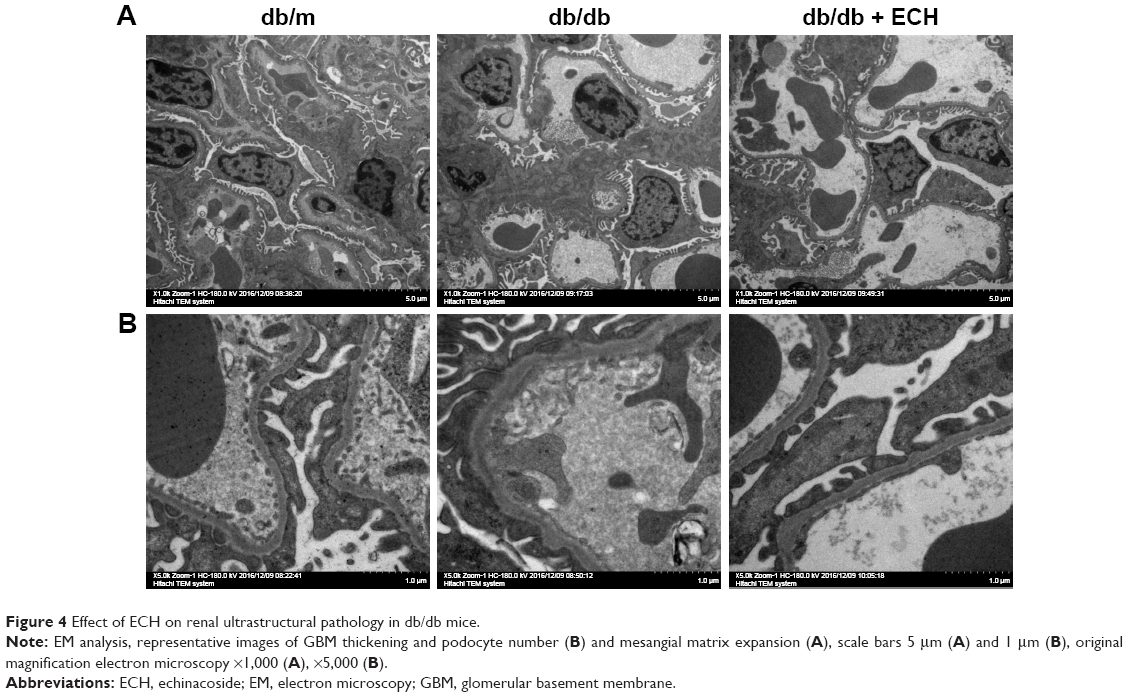 | Figure 4 Effect of ECH on renal ultrastructural pathology in db/db mice. |
ECH inhibits renal tubular EMT in db/db mice by upregulating the expression of E-cadherin and downregulating the expression of α-SMA
To combat damage and avoid potential apoptosis, some renal tubular epithelial cells lose their epithelial cell markers, change their morphology, become muscle fibroblasts, and produce the mesenchymal cell marker α-SMA in DN. Therefore, α-SMA is a mesenchymal cell marker, and E-cadherin is a marker of epithelial cells. To investigate the effects of ECH on inhibition of EMT in db/db mice, E-cadherin and α-SMA protein expression were detected by immunohistochemistry and Western blot (Figure 5A–C, F, and G). Relative to the db/m group, E-cadherin was significantly reduced in db/db mice (P<0.01; Figure 5B and F); however, α-SMA was increased (P<0.01; Figure 5C and G). ECH can decrease α-SMA expression and upregulate E-cadherin expression (P<0.01; Figure 5A–C, F, and G). The mRNA expression level of E-cadherin was significantly reduced in the db/db group relative to the db/m group (P<0.01; Figure 5D), and the mRNA expression of α-SMA was significantly increased in the db/db group (P<0.01; Figure 5E). ECH reduced α-SMA protein expression and relative mRNA level and increased the E-cadherin protein and relative mRNA levels in db/db mice (P<0.01; Figure 5), which suggests that ECH can inhibit renal tubular EMT in db/db mice.
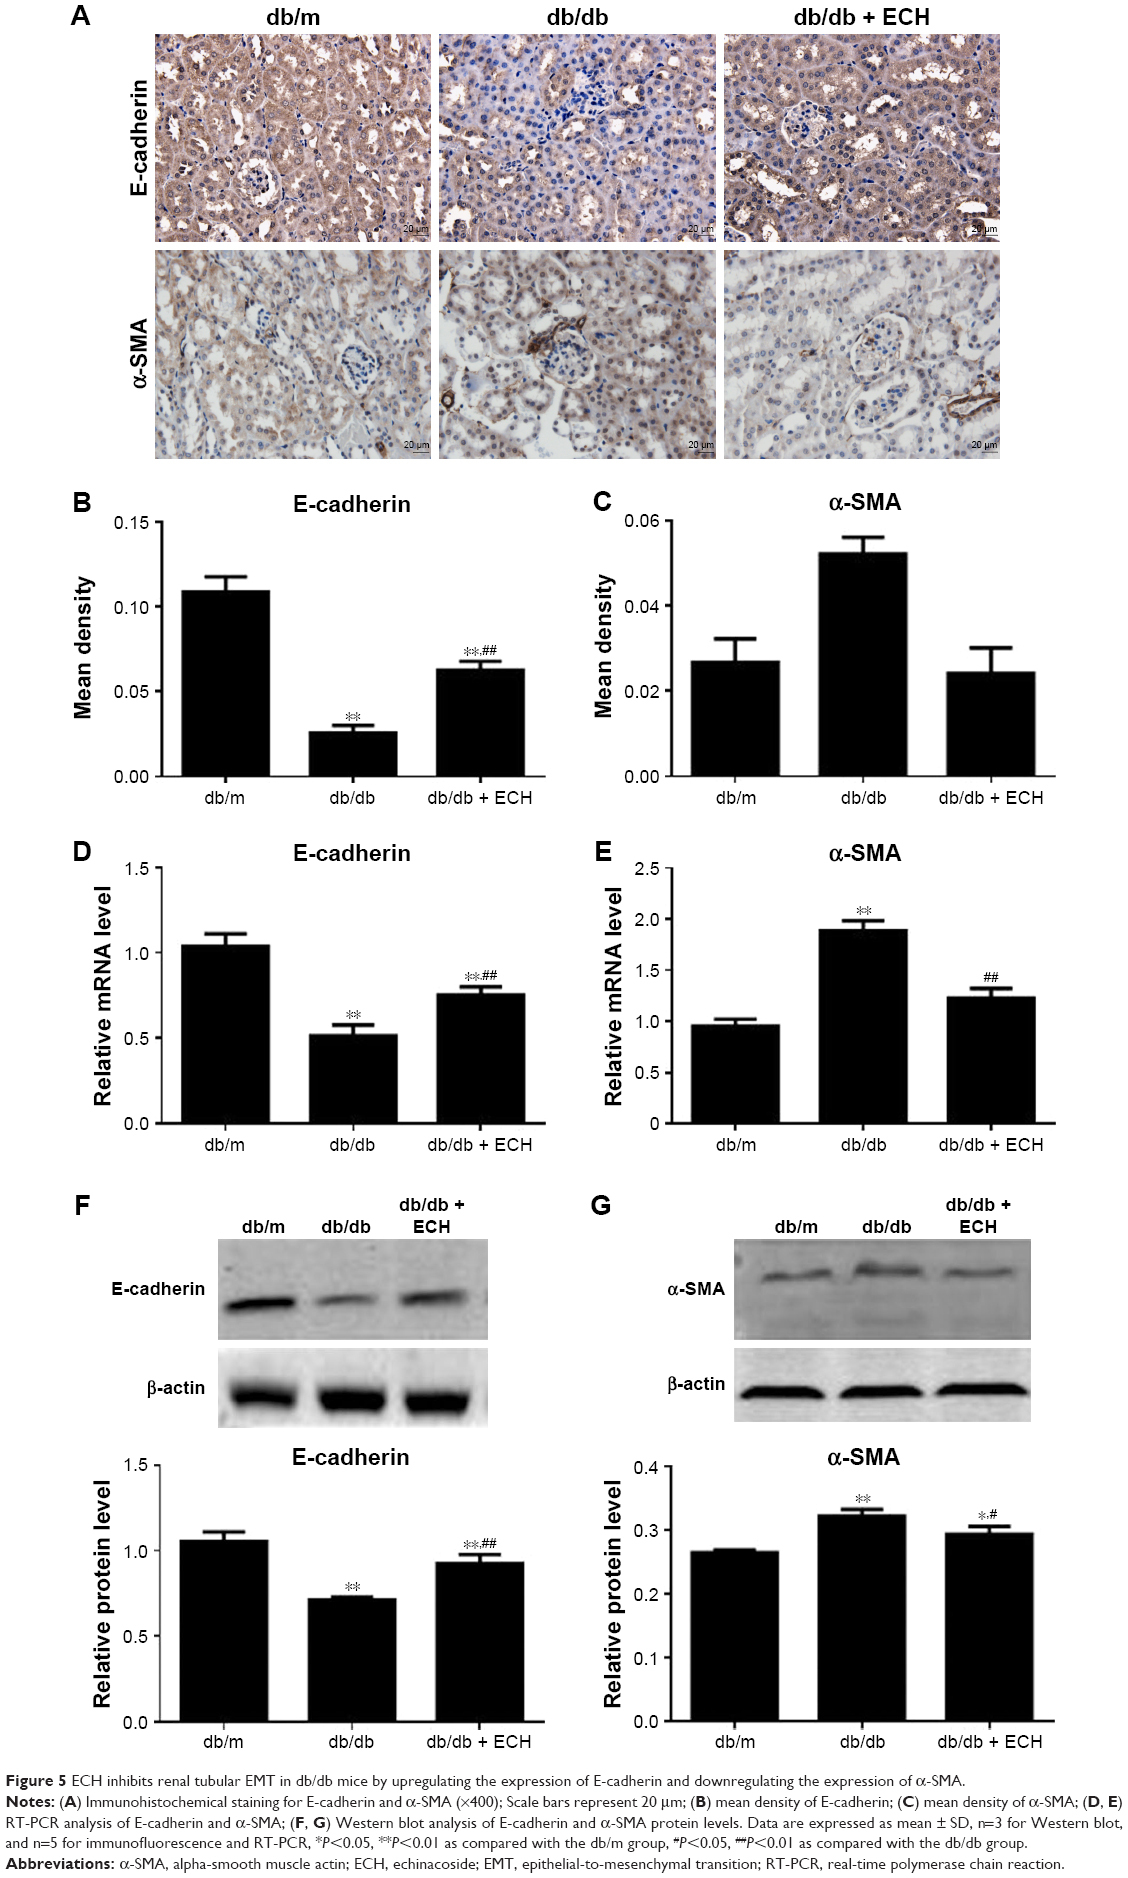 | Figure 5 ECH inhibits renal tubular EMT in db/db mice by upregulating the expression of E-cadherin and downregulating the expression of α-SMA. |
ECH reduces the expression of FN and collagen IV in db/db mice
The current study investigated the expression of FN and collagen IV, which are two typical markers of diabetic renal injury. Immunohistochemistry and Western blot analysis revealed that the protein expression of FN and collagen IV was significantly increased in db/db mice compared with db/m mice (P<0.01; Figure 6A–C, F, and G). However, in the db/db + ECH group, the protein expression of FN and collagen IV was markedly decreased (P<0.01; Figure 6A–C, F, and G). The mRNA expression level of FN and collagen IV was significantly increased in the db/db group (P<0.01; Figure 6D and E). ECH can reduce the relative mRNA levels of FN and collagen IV in db/db mice (P<0.01; Figure 6D and E). These results indicate that ECH may limit the expression of ECM components to protect renal function.
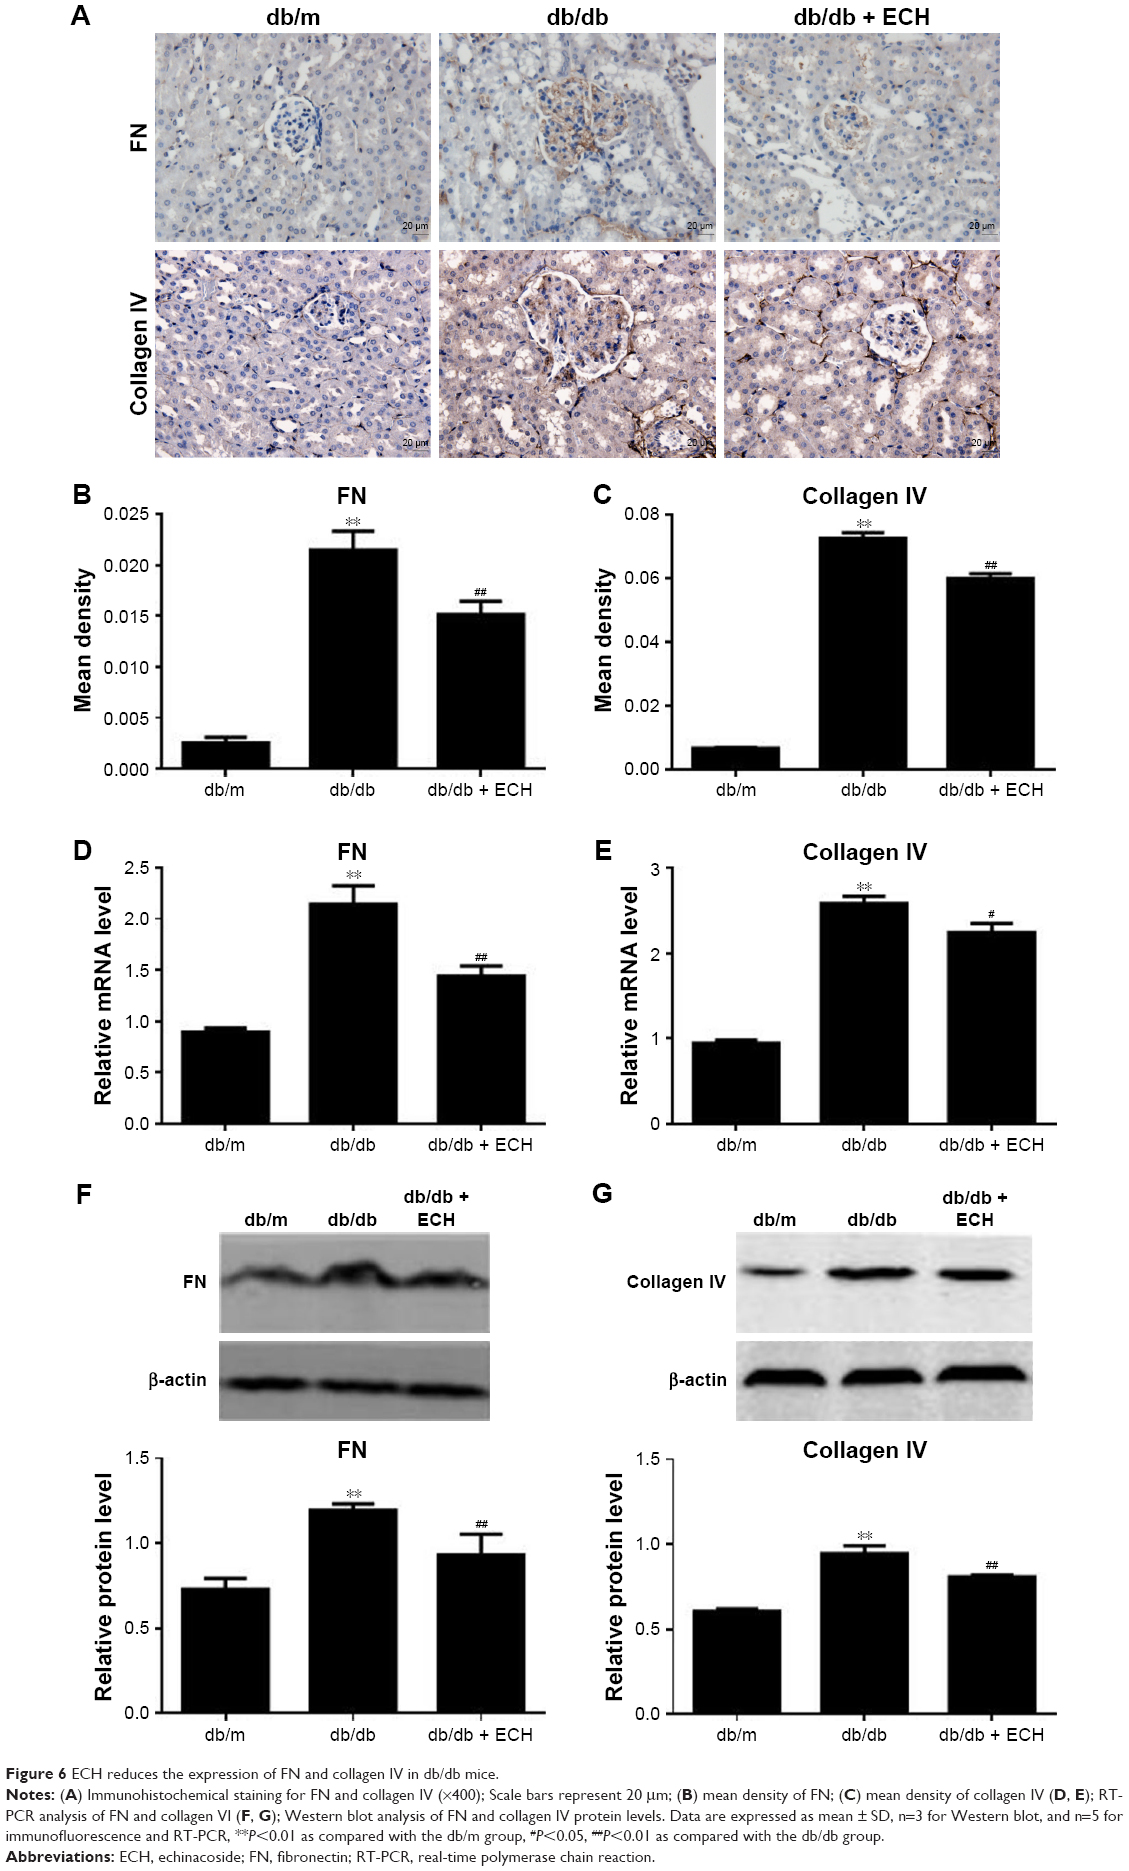 | Figure 6 ECH reduces the expression of FN and collagen IV in db/db mice. |
ECH inhibits the renal TGF-β1/Smad signaling pathway in db/db mice
It is well known that activation of the Smad pathway and its subsequent nuclear translocation are critical steps in TGF-β1-mediated renal fibrosis in DN. In our study, TGF-β1, Smad2, Smad3, and Smad4 expression was detected by Western blot (Figure 7E–G), while their mRNA levels were detected by RT-PCR (Figure 7A–D). The results showed that TGF-β1, Smad2, Smad3, and Smad4 protein and mRNA levels in the db/db group were higher than in the db/m group, suggesting that the TGF-β1/Smads signaling pathway was activated in the db/db group (P<0.05; Figure 7). The protein and mRNA levels of TGF-β1, Smad2, Smad3, and Smad4 were decreased after 10 weeks of treatment with ECH (P<0.05; Figure 7), indicating that ECH can inhibit the renal TGF-β1/Smads signaling pathway in db/db mice.
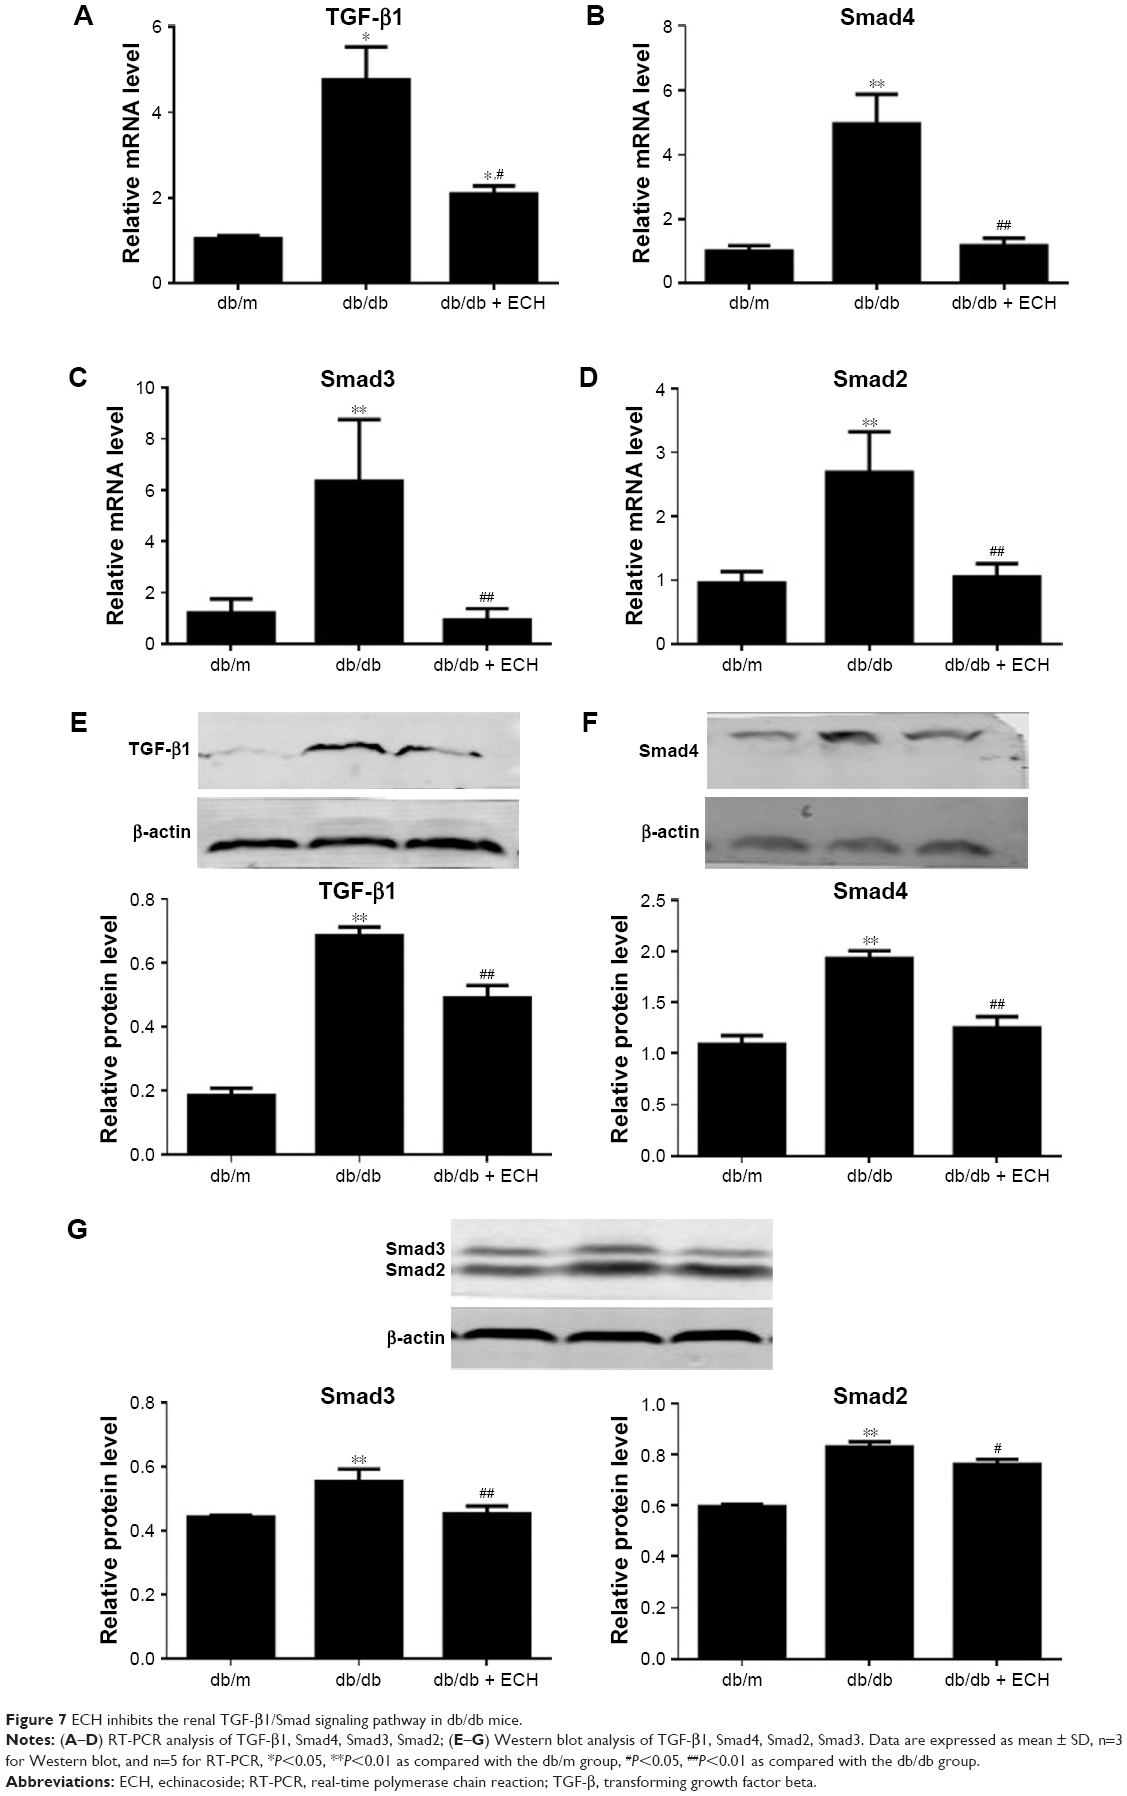 | Figure 7 ECH inhibits the renal TGF-β1/Smad signaling pathway in db/db mice. |
Discussion
Traditional herbal compounds have been widely used in the treatment of DN in the People’s Republic of China and are recognized as effective alternatives to conventional medicine.7,14 In our study, we used the db/db mouse model of type 2 diabetes. db/db mice are the most widely used type 2 diabetes model, and the cause of the disease is due to abnormal clipping in the leptin receptor gene leading to mutations causing the deletion of leptin receptor.15 For the C57BLKS/J background of the db/db mouse, kidney histopathological changes included glomerular fibrosis, basement membrane thickening, podocyte reduction, and mesangial stromal hyperplasia in a large number of experimental studies.16,17 db/db mice have an oxidative stress and inflammatory response in the kidneys, which are similar to the early pathological changes of DN, so db/db is a better model for DN.18 The results of this experiment show that, in week 8, db/db mice had significantly greater body weight than db/m mice, while blood glucose was significantly higher than the control group, along with polydipsia, polyuria, and increased food intake. This proves that the diabetes model has been successful. Mice were intervened with ECH at 8-weeks (300 mg·kg-1·day-1) to observe its protective effect on the kidneys.
Long-term hyperglycemia is a necessary condition for kidney dysfunction in diabetic patients.19 Strict control of blood glucose can reduce the risk of developing albuminuria in diabetic patients,20 while strict control of blood glucose can reduce mortality in patients with DN,21 and therefore the current strict control of blood sugar is one of the important principles of treatment of DN. The results of this study show that blood glucose in untreated db/db mice increased from 8 weeks, while the blood glucose of db/db mice which were treated with ECH began to decline after 10 weeks of treatment. These results indicate that ECH can reduce blood glucose levels in DN mice, suggesting that ECH has a certain role in reducing renal injury in diabetic patients. Relative to the db/m group, the blood serum Cr and BUN of the db/db group increased significantly, whereas they reduced in the db/db + ECH group. As is well known, the emergence of urinary microalbumin is a necessary indicator for the diagnosis of DN, and urinary albumin increase is an important indicator of the deterioration of DN.22 Studies have shown that in patients with type 2 diabetes, 24-hour urinary protein (urinary albumin excretion rate) ≥30 mg/24 hours increased the risk of cardiovascular events, DN, and death by 2.20 times, 6.76 times, and 2.47 times.23 Therefore, for the treatment of DN, it is important to reduce urinary protein excretion. In this study, the urinary protein content of db/db mice was higher than that of the control group at the beginning of the 8th week, and the UAE of db/db mice was significantly lower than that of the model group after 10 weeks of ECH treatment. This indicated that ECH can reduce urinary protein level in db/db mice.
HE and PAS staining showed that a variety of DN-induced changes in renal morphology were detected in the pathology results from the db/db group, including glomerular hypertrophy, mesangial matrix expansion, and partial renal tubular atrophy. Masson staining revealed collagen fiber deposition in the glomerular and renal tubules in the db/db group. Furthermore, ultrastructural analyses revealed that the number of podocytes in the kidneys was decreased, the morphology was abnormal, and there was podocyte fusion and irregular thickening of the glomerular GBM in the db/db group. In summary, the differences between the db/db group and the db/m group indicated that the db/db mouse model of DN was successful.
In our study, accumulating evidence from biochemical parameters and morphologic changes indicated that ECH is useful to protect renal function in DN. The mechanism of the protective effect of ECH on the kidneys is very complex. In the current study, it was found that more than one-third of interstitial fibroblasts were derived from the EMT of renal tubular epithelial cells, and EMT is a major source of myofibroblasts in DN.24 Inhibiting the EMT of renal tubular epithelial cell differentiation is an important target for delaying the progress of DN.25 In this study, it was confirmed that db/db mice had changes in EMT markers, such as decreased E-cadherin and increased α-SMA, relative to db/m mice. However, in the db/db + ECH group, α-SMA was decreased and E-cadherin was increased relative to the db/db group. It was also demonstrated that ECH could decrease FN and collagen IV expression, and these are two typical markers of fibrosis. Furthermore, this experiment also explored the molecular mechanism through which ECH inhibits the EMT and fibrosis. TGF-β1 is a multifunctional cytokine that controls numerous biological processes.26 A number of previous studies have demonstrated that TGF-β1 promotes the development of diabetic albuminuria.27 Previous studies have also shown that neutralizing anti-TGF-β antibodies prevented glomerulosclerosis and interstitial fibrosis and reduced the expression of ECM genes, including FN and type IV collagen, in mice with type 1 and type 2 diabetes, suggesting that TGF-β signaling plays a critical role in ECM accumulation in DN.26 Another study demonstrated that TGF-β1 stimulates the transcription of the components of ECM, including collagen, FN, and laminin,28 and the signaling of TGF-β1 has been suggested to be involved in the development of DN.29 TGF-β1 has also been demonstrated to induce EMT in proximal tubules, collecting duct cells, glomerular podocytes, and glomerular parietal epithelial cells.26 Increasing evidence indicates that TGF-β1 is the primary mediator of EMT and that the TGF-β1/Smad3 signaling pathway is important in the EMT process.30,31 Our current study indicates that the expression of TGF-β1 mRNA and protein was markedly upregulated in the kidneys of db/db mice, and treatment with ECH inhibited TGF-β1 expression. In addition, ECH treatment was shown to decrease Smad2, Smad3, and Smad4 mRNA and protein expression in the kidneys of db/db mice. These results suggest that ECH negatively regulates the TGF-β1/Smads pathway to control renal EMT and fibrosis in DN.
Conclusion
We speculate that ECH could suppress renal EMT and fibrosis, so delaying the progress of DN. ECH may have an effect on the TGF-β1/Smads pathway, which might be a mechanism underlying the protective effect of ECH in the db/db mice model of DN. Even if we confirmed our assumption, there may still be certain limitations to our research. Although ECH has an effect on kidney fibrosis in DN, more and larger investigations and clinical trials are still necessary for further verification.
Acknowledgment
This study was supported by the Hubei Natural Science Foundation of China (number 2013CFB251 2016CFB673).
Disclosure
The authors report no conflicts of interest in this work.
References
Adeshara KA, Diwan AG, Tupe RS. Diabetes and complications: cellular signaling pathways, current understanding and targeted therapies. Curr Drug Targets. 2016;17(11):1309–1328. | ||
Reutens AT, Atkins RC. Epidemiology of diabetic nephropathy. Contrib Nephrol. 2011;170:1–7. | ||
Hoshino J, Mise K, Ueno T, et al. A pathological scoring system to predict renal outcome in diabetic nephropathy. Am J Nephrol. 2015;41(4–5):337–344. | ||
Badal SS, Danesh FR. Diabetic nephropathy: emerging biomarkers for risk assessment. Diabetes. 2015;64(9):3063–3065. | ||
Sutariya B, Jhonsa D, Saraf MN. TGF-beta: the connecting link between nephropathy and fibrosis. Immunopharmacol Immunotoxicol. 2016;38(1):39–49. | ||
Gaede P, Lund-Andersen H, Parving HH, Pedersen O. Effect of a multifactorial intervention on mortality in type 2 diabetes. N Engl J Med. 2008;358(6):580–591. | ||
Sun GD, Li CY, Cui WP, et al. Review of herbal traditional Chinese medicine for the treatment of diabetic nephropathy. J Diabetes Res. 2016;2016:5749857. | ||
Tu PF, Wang B, Deyama T, Zhang ZG, Lou ZC. [Analysis of phenylethanoid glycosides of Herba Cistanchis by RP-HPLC]. Yao Xue Xue Bao. 1997;32(4):294–300. Chinese. | ||
You SP, Ma L, Zhao J, et al. Phenylethanol glycosides from Cistanche tubulosa suppress hepatic stellate cell activation and block the conduction of signaling pathways in TGF-beta1/smad as potential anti-hepatic fibrosis agents. Molecules. 2016;21(102):1–15. | ||
Jia C, Shi H, Jin W, et al. Metabolism of echinacoside, a good antioxidant, in rats: isolation and identification of its biliary metabolites. Drug Metab Dispos. 2009;37(2):431–438. | ||
Deng M, Zhao JY, Tu PF, Jiang Y, Li ZB, Wang YH. Echinacoside rescues the SHSY5Y neuronal cells from TNFalpha-induced apoptosis. Eur J Pharmacol. 2004;505(1–3):11–18. | ||
Summy-Long JY, Hu S. Peripheral osmotic stimulation inhibits the brain’s innate immune response to microdialysis of acidic perfusion fluid adjacent to supraoptic nucleus. Am J Physiol Regul Integr Comp Physiol. 2009;297(5):R1532–R1545. | ||
Ka SM, Yeh YC, Huang XR, et al. Kidney-targeting Smad7 gene transfer inhibits renal TGF-beta/MAD homologue (SMAD) and nuclear factor kappaB (NF-kappaB) signalling pathways, and improves diabetic nephropathy in mice. Diabetologia. 2012;55(2):509–519. | ||
Xu ZJ, Shu S, Li ZJ, et al. Liuwei Dihuang pill treats diabetic nephropathy in rats by inhibiting of TGF-beta/SMADS, MAPK, and NF-kB and upregulating expression of cytoglobin in renal tissues. Medicine (Baltimore). 2017;96(3):e5879. | ||
Tesch GH, Lim AK. Recent insights into diabetic renal injury from the db/db mouse model of type 2 diabetic nephropathy. Am J Physiol Renal Physiol. 2011;300(2):F301–F310. | ||
Lu M, Yin N, Liu W, Cui X, Chen S, Wang E. Curcumin ameliorates diabetic nephropathy by suppressing NLRP3 inflammasome signaling. Biomed Res Int. 2017;2017:1516985. | ||
Wang XX, Levi J, Luo Y, et al. SGLT2 expression is increased in human diabetic nephropathy: SGLT2 inhibition decreases renal lipid accumulation, inflammation and the development of nephropathy in diabetic mice. J Biol Chem. 2017;292(13):5335–5348. | ||
Kitada M, Ogura Y, Koya D. Rodent models of diabetic nephropathy: their utility and limitations. Int J Nephrol Renovasc Dis. 2016;9:279–290. | ||
Mauer SM, Goetz FC, McHugh LE, et al. Long-term study of normal kidneys transplanted into patients with type I diabetes. Diabetes. 1989;38(4):516–523. | ||
Fioretto P, Bruseghin M, Berto I, Gallina P, Manzato E, Mussap M. Renal protection in diabetes: role of glycemic control. J Am Soc Nephrol. 2006;17(4 suppl 2):S86–S89. | ||
Agarwal P. Management of diabetic kidney disease: recent advances. Indian J Endocrinol Metab. 2013;17(suppl 1):S55–S58. | ||
Hunt LP, Short CD, Mallick NP. Prognostic indicators in patients presenting with the nephrotic syndrome. Kidney Int. 1988;34(3):382–388. | ||
Viana LV, Gross JL, Camargo JL, Zelmanovitz T, da Costa Rocha EP, Azevedo MJ. Prediction of cardiovascular events, diabetic nephropathy, and mortality by albumin concentration in a spot urine sample in patients with type 2 diabetes. J Diabetes Complications. 2012;26(5):407–412. | ||
Loeffler I, Wolf G. Epithelial-to-mesenchymal transition in diabetic nephropathy: fact or fiction? Cells. 2015;4(4):631–652. | ||
Yang G, Zhao Z, Zhang X, et al. Effect of berberine on the renal tubular epithelial-to-mesenchymal transition by inhibition of the Notch/snail pathway in diabetic nephropathy model KKAy mice. Drug Des Devel Ther. 2017;11:1065–1079. | ||
Chang AS, Hathaway CK, Smithies O, et al. Transforming growth factor-beta1 and diabetic nephropathy. Am J Physiol Renal Physiol. 2016;310(8):F689–F696. | ||
Kokudo T, Suzuki Y, Yoshimatsu Y, Yamazaki T, Watabe T, Miyazono K. Snail is required for TGFbeta-induced endothelial-mesenchymal transition of embryonic stem cell-derived endothelial cells. J Cell Sci. 2008;121(pt 20):3317–3324. | ||
Ignotz RA, Massague J. Transforming growth factor-beta stimulates the expression of fibronectin and collagen and their incorporation into the extracellular matrix. J Biol Chem. 1986;261(9):4337–4345. | ||
Fan Y, Li X, Xiao W, et al. BAMBI elimination enhances alternative TGF-beta signaling and glomerular dysfunction in diabetic mice. Diabetes. 2015;64(6):2220–2233. | ||
Roberts AB, Tian F, Byfield SD, et al. Smad3 is key to TGF-beta-mediated epithelial-to-mesenchymal transition, fibrosis, tumor suppression and metastasis. Cytokine Growth Factor Rev. 2006;17(1–2):19–27. | ||
Wang A, Ziyadeh FN, Lee EY, et al. Interference with TGF-beta signaling by Smad3-knockout in mice limits diabetic glomerulosclerosis without affecting albuminuria. Am J Physiol Renal Physiol. 2007;293(5):F1657–F1665. |
 © 2017 The Author(s). This work is published and licensed by Dove Medical Press Limited. The full terms of this license are available at https://www.dovepress.com/terms.php and incorporate the Creative Commons Attribution - Non Commercial (unported, v3.0) License.
By accessing the work you hereby accept the Terms. Non-commercial uses of the work are permitted without any further permission from Dove Medical Press Limited, provided the work is properly attributed. For permission for commercial use of this work, please see paragraphs 4.2 and 5 of our Terms.
© 2017 The Author(s). This work is published and licensed by Dove Medical Press Limited. The full terms of this license are available at https://www.dovepress.com/terms.php and incorporate the Creative Commons Attribution - Non Commercial (unported, v3.0) License.
By accessing the work you hereby accept the Terms. Non-commercial uses of the work are permitted without any further permission from Dove Medical Press Limited, provided the work is properly attributed. For permission for commercial use of this work, please see paragraphs 4.2 and 5 of our Terms.