")
Back to Journals » Diabetes, Metabolic Syndrome and Obesity » Volume 8
Effect of different exercise intensities on the pancreas of animals with metabolic syndrome
Authors Amaral F, Lima N, Ornelas E, Simardi L, Fonseca FLA, Mesiano Maifrino LB
Received 16 September 2014
Accepted for publication 5 November 2014
Published 13 February 2015 Volume 2015:8 Pages 115—120
DOI https://doi.org/10.2147/DMSO.S74436
Checked for plagiarism Yes
Review by Single anonymous peer review
Peer reviewer comments 3
Editor who approved publication: Professor Ming-Hui Zou
Fernanda Amaral,1 Nathalia EA Lima,1 Elisabete Ornelas,1 Lucila Simardi,2 Fernando Luiz Affonso Fonseca,2,3 Laura Beatriz Mesiano Maifrino1,4
1Laboratório de Estudos Morfoquantitativo e Imunohistoquímico, Universidade São Judas Tadeu, São Paulo, Brazil; 2Faculdade de Medicina do ABC, Santo André, São Paulo, Brazil; 3Departamento de Ciências Biológicas, Universidade Federal de São Paulo, São Paulo, Brazil; 4Instituto Dante Pazzanese de Cardiologia, São Paulo, Brazil
Introduction: Metabolic syndrome (MS) comprises several metabolic disorders that are risk factors for cardiovascular disease and has its source connected to the accumulation of visceral adipose tissue (VAT) and development of insulin resistance. Despite studies showing beneficial results of exercise on several risk factors for cardiovascular disease, studies evaluating the effects of different intensities of exercise training on the pancreas with experimental models are scarce.
Methods: In total, 20 Wistar rats were used, divided into four groups: control (C), metabolic syndrome (MS and without exercise), metabolic syndrome and practice of walking (MSWalk), and metabolic syndrome and practice of running (MSRun). The applied procedures were induction of MS by fructose in drinking water; experimental protocol of walking and running; weighing of body mass and VAT; sacrifice of animals with blood collection and removal of organs and processing of samples for light microscopy using the analysis of volume densities (Vv) of the studied structures.
Results: Running showed a reduction of VAT weight (–54%), triglyceride levels (–40%), Vv[islet] (–62%), Vv[islet.cells] (–22%), Vv[islet.insterstitial] (–44%), and Vv[acinar.insterstitial] (–24%) and an increase of Vv[acini] (+21%) and Vv[acinar.cells] (+22%). Regarding walking, we observed a decrease of VAT weight (–34%) and triglyceride levels (–27%), an increase of Vv[islet.cells] (+72%) and Vv[acinar.cells] (+7%), and a decrease of Vv[acini] (–4%) and Vv[acinar.insterstitial] (–16%) when compared with those in the MS group.
Conclusion: Our results suggest that the experimental model with low-intensity exercise (walking) seems to be more particularly recommended for preventing morphological and metabolic disorders occurring in the MS.
Keywords: metabolic syndrome, pancreas, exercise, visceral adipose tissue, insulin resistance
Introduction
Studies have shown that fructose consumption induces insulin resistance, obesity, hypertension, and abnormalities in lipid profile, which are changes that characterize the metabolic syndrome (MS), both in humans and in experimental animals.1,2
The abnormal fat storage in the abdominal region is directly related to ectopic fat accumulation in key metabolic organs such as liver and pancreas. Insulin resistance acts in synergy with excess adipose tissue, promoting changes in adipoinsular axis, generating metabolic disorders such as the MS, which has increasing prevalence worldwide.3,4
Insulin resistance is a state of reduced responsiveness to normal levels of this hormone. Generally, this condition develops as a first indicator of type 2 diabetes (T2DM). Pancreas can compensate the reduced response to insulin by increasing its secretion, in an attempt to control the concentration of blood glucose. The continuous hypersecretion may lead to changes in pancreatic islets and failure of pancreatic β cells, associated with mass loss of these cells by apoptosis, resulting in lower production of this hormone and the manifestation of T2DM. There are also reports on the association of hyperinsulinism with sleep-related breathing disorders.5–8
Physical exercise helps reducing waist circumference and visceral fat, lowers blood pressure, increases HDL (high-density lipoprotein) cholesterol, lowers plasma triglyceride concentrations, and mainly promotes increase of Glut 4 protein in the membrane of muscle fibers, improving the transport of glucose from the blood to the muscles, which decreases blood glucose.9
Some factors cited above are known to increase the risk of cardiovascular disease, it is necessary to understand the behavior of pancreas in a condition of MS and how different intensities of exercise can minimize these changes in the pancreas.
Materials and methods
Animals
The sample consisted of 20 male rats of Wistar strain, aged 4 weeks and obtained from the Animal House of the São Judas Tadeu University, São Paulo, Brazil. The animals were kept in controlled conditions of temperature (22°C–24°C) and lighting (cycles of 12-hour light and 12-hour dark) and received a commercial diet (Nuvital®, Nuvital, Inc., Shelbyville, MI, USA) and water ad libitum.
The experimental protocol was approved by the Ethical Committee in Research of the Universidade São Judas Tadeu (CEP–Protocol: 063/2006), and this investigation was conducted in accordance with the Principles of Laboratory Animal Care formulated by the National Institutes of Health.10 The model of MS was obtained by fructose intake in the drinking water (d-fructose, 100 g/L), for 18 weeks.11 The animals were divided into four groups: control (C), metabolic syndrome (MS), metabolic syndrome and practice of walking (MSWalk), and metabolic syndrome and practice of running (MSRun).
Training protocol
The experimental exercise protocol for both groups was performed on a treadmill (Imbramed TK-01) from the 9th week of the induction of MS, lasting 60 minutes, 5 days a week, for 9 weeks. All animals were adapted to the treadmill (10 minutes at 0.3 km/h) for 3 days. Then the maximal exercise test was carried out, consisting of a scaled protocol with speed increments every 3 minutes until the maximum speed supported by the animals was reached.12 The test was the basis for prescribing the physical training protocol for trained groups. The MSRun group was subjected to a training of moderate intensity (50%–60% of maximum speed achieved), with progressive speed and load. The MSWalk group performed the exercise with constant speed of 0.3 km/h until the end of the protocol (training of light intensity).
Biometric and biochemical analyzes
An analytical balance (Ohaus brand) was used to weigh the animals once a week, during the 18 weeks of the protocol. At the beginning (1st week), middle (9th week), and end (18th week) of the protocol, all animals underwent a 4-hour fasting; then a drop of tail blood was taken for analysis of plasma glucose by a glucometer (Accucheck, Hoffman-La Roche Ltd, Basel, Switzerland) and another drop for measuring the triglyceride levels with the Accutrend GTC Roche device. For insulin resistance testing, the animals were anesthetized with sodium pentobarbital (40 mg/kg) and received an intravenous injection of insulin (0.75 U/kg body weight). Plasma glucose was measured from blood samples obtained from the tail vein using a glucometer (Accucheck) at 0, 4, 8, 12, and 16 minutes after the insulin injection. The blood glucose levels of 4–16 minutes were used to calculate steady fall in plasma glucose (Kitt) according to the description of Bonora et al.13
Tissue sample preparation
At the end of the experiments, rats in all groups were starved overnight for 12 hours and sacrificed by decapitation. Blood samples were collected by a heparinized syringe for biochemical analyzes. Then, the abdominal cavity was open, the visceral adipose tissue (VAT) and pancreas were removed, and the weight of both was measured. Pancreatic samples were sectioned, fixed in 10% formalin solution in phosphate buffer for 48 hours, dehydrated, and embedded in paraffin. Five nonconsecutive 6 μm thick histological sections per animal were cut, and then stained with hematoxylin and eosin (H&E) for examination by light microscopy.
Morphometric analysis
For calculating the pancreatic sectional area, five images were captured per animal through a stereoscopic microscope (Feldmann Wild Leitz, São Paulo, Brazil) with 15× magnification. The image was calibrated in mm², transformed into 8 bit, and through the threshold command decomposed in black and white, allowing the calculation of its area using the Image J program.14 The numerical density of islets of each section was quantified in 50× magnification.
A total of 25 images per animal, with 100× magnification, were captured through a light microscope coupled to a microcamera, and transferred to the image analysis program (software Axio Vision, Zeiss), in which were taken measures of the largest and smaller diameters, and the area of pancreatic islets. The images were also used for stereological analysis by calculating the volume densities of islets, islet cells and interstitium, acini, acinar cells and interstitium, and ducts and vessels. To analyze the variables of volume density,15 we used a test system of 254 points with the aid of Image J software.
Statistical analysis
The analysis of variance (ANOVA) and Tukey tests were used for the statistical analysis. All data are presented as mean ± standard error of the mean. P-values <0.05 were considered significant.
Results
Biometric and biochemical parameters
No significant difference was observed in body mass weight among the groups of animals at all stages of the study. The consumption of fructose caused a significant increase in VAT in sedentary animals (MS group). The exercise groups showed a decrease in VAT, compared with that in the MS group. There was no significant difference between the running and walking groups, compared with the control group (Table 1).
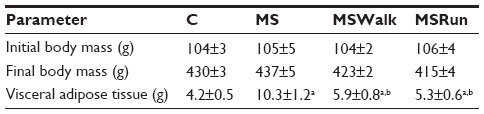 | Table 1 Biometric parameters of animals |
Blood glucose levels remained within the normal range. There was no significant difference among the groups over the 18 weeks. The animals in groups receiving fructose overload (MS, MSWalk, and MSRun) showed a significant increase in triglyceride levels when compared to the control group. The triglyceride values of the MSWalk group were smaller than those of the MS group and higher than those of the MSRun group. The restoring of the response of insulin resistance was observed in animals that received fructose and underwent physical training (Table 2).
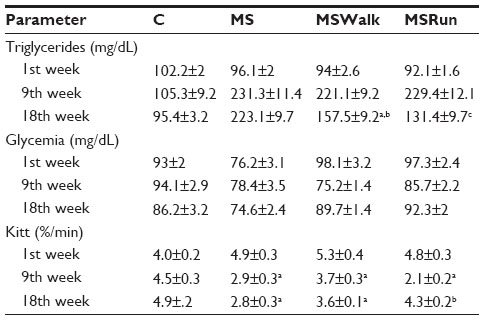 | Table 2 Biochemical parameters of animals |
Morphoquantitative analysis
Volume densities (exocrine part)
The exocrine part of the pancreas (or acini) in the MS group showed a significant increase of 6% in volume density of acini when compared with the control group. Comparing the volume density of acinar cells among all groups, the MSRun group had an increased volume than the control and MSWalk groups. The MSWalk group had a reduced volume when compared with the MS group. No significant difference was found in the volume density of the interstitium among groups (Table 3).
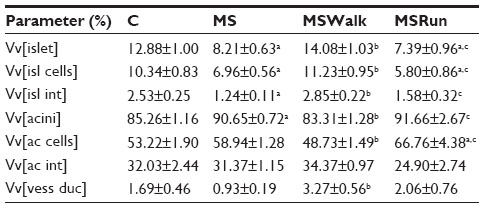 | Table 3 Mean values of volume densities (Vv) (%) of the islets, islet cells, interstitium of the islets, acini, acinar cells, interstitium of the acini, and vessels and ducts |
Volume density of vessels and ducts
There was a significant increase of 251% in volume density of vessels and ducts in the MSWalk group when compared to the MS group. No other comparison showed significant difference (P>0.05) (Table 3).
Volume densities (endocrine part)
We found that fructose intake (MS) caused a significant decrease in volume densities of the islets (36%), islet cells (33%), and islet interstitium (51%), compared to the control group. The mild exercise (MSWalk) reversed the changes promoted by MS, with results approaching those of the control group. Moderate exercise (MSRun), in its turn, showed results similar to those of the MS group (Table 3).
Area and average diameter of the islet and numeric density by tissue section
It was found that in relation to area, the dimensions of the pancreatic islets constitute a heterogeneous population, ranging from 1,010.15 to 83,910.60 μm². The average area of islets showed no significant changes among the C, MS, and MSWalk groups. Only the MSRun group showed a significant decrease of 19% when compared with the MSWalk group. An average increase of 117% was observed in the numeric density of islets by section in the MSWalk group, compared with the other groups. As for the average diameter of the islets, no significant differences were observed among groups. Regarding the numeric density of islets per section, a significant increase of 83% was observed in the MSRun group, compared to the control group (Figure 1 and Table 4).
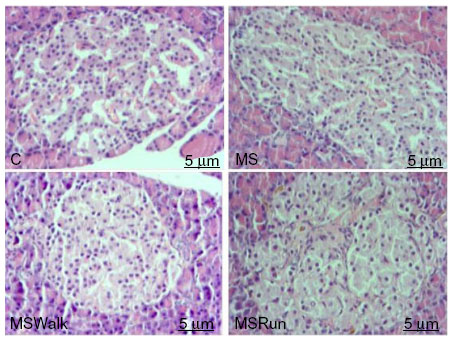 | Figure 1 Photo to micrographs of the pancreas. |
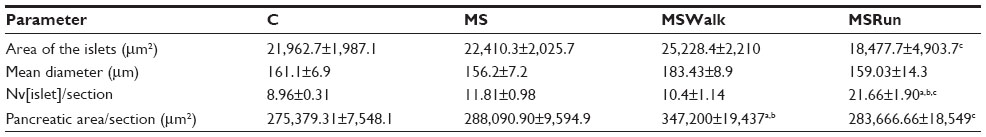 | Table 4 Mean values of islets area, mean diameter, numeric density of islets per section (Nv[islet]/section), and pancreatic area/section |
Figure 2 is a histogram showing the frequency distribution (%) of the mean diameter of the pancreatic islets in small (38–100 μm), medium (101–200 μm), and large (201–337 μm) of the percentage values of the mean diameter. It was observed that 10% of islets in the C group were small, 68% were medium, and 22% were large; in the MS group, 19% were small, 58% medium, and 23% large; in the MSWalk group, 5% were small, 62% medium, and 33% large; and in the MSRun group, 30% were small, 43% medium, and 27% large.
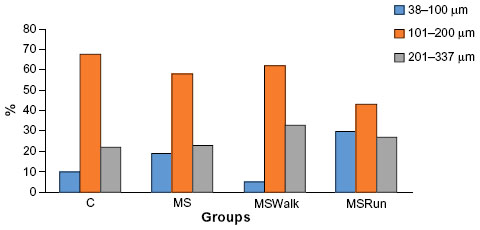 | Figure 2 Histogram of the percentage values of the mean diameter of pancreatic islets in the studied groups. |
Discussion
In our study, we found no changes of final body mass among the studied groups. However, there was an increase in the mass of VAT in the groups receiving fructose intake (158%), compared with the control group. Interestingly, the exercise decreased the mass of VAT in the MSWalk (43%) and MSRun (49%) groups, compared with the MS group. Similar data were found by Leite et al16 in obese animals that practiced moderate exercise, and this caused a decrease in VAT.
It is known that excess of adipose tissue, especially visceral, is the basis for the establishment of MS, significantly increasing the risk of developing T2DM, cardiovascular diseases, as well as certain types of cancer.17 The adipose tissue acts not only as a store of fat but also as an endocrine organ producing peptide hormones. We know that leptin produced by adipocytes and insulin produced in the endocrine part of the pancreas are known as regulators of body weight over the long term, and that this interconnection of peripheral signals with the central signaling controls the energy balance.16
Additionally, throughout 18 weeks of the studied experimental model, no changes were observed in blood glucose in all groups, which remained within the normal range, showing that the presence of physical training and/or fructose did not affect the glycemic rate when compared to the studied groups. Cunha et al,18 Song et al,19 and Galipeau et al,20 studying male rats and mice, have shown that fructose overload induces hypertriglyceridemia, elevated blood glucose, hyperinsulinemia, and insulin resistance. In our study, we observed no differences in blood glucose levels, but found that fructose consumption induced increases of blood triglycerides and insulin resistance in sedentary mice, evidenced by reduced insulin sensitivity.
Recently, Huang et al21 showed that fructose disrupts the hepatic glucose metabolism and culminates in the accumulation of triglycerides in the liver associated with reductions in hepatic enzyme expression: phosphorylated acetyl-CoA carboxylase, phosphorylated hormone-sensitive lipase, and also the total adipose triglyceride lipase (ATGL). The authors found that fructose causes de novo synthesis of fatty acids and releases triglycerides.21 In our study, when compared with the control group, we found that groups which received fructose (MS, MSWalk, and MSRun) showed significant increases in amounts of circulating triglycerides in the 9th and 18th weeks, respectively, in relation to the values observed at baseline.
Physical exercise reversed triglyceride levels both in the MSWalk group and in the MSRun group. These data are in accordance with the results from the work of Giannopoulou et al,22 in which physical training reduced metabolic parameters in postmenopausal women with T2DM. Moreover, a study that evaluated men and women after physical training associated with diet showed favorable results in the LDL (low-density lipoprotein) cholesterol concentration, compared to the control group, even without changes in body weight.23 Leite et al16 studying the Wistar model/MSG (monosodium glutamate), found an increase in triglycerides in the sedentary MSG group, compared to the sedentary control group, and a reduction of triglycerides in the groups that underwent exercise, compared to the sedentary MSG group.24
In our study, the groups showed insulin resistance from the 9th week of treatment, as was expected, since some studies have shown that chronic ingestion of fructose promotes a number of metabolic abnormalities, including insulin resistance.25–28 We found that exercise training attenuated insulin resistance at the end of the 18-week protocol in both groups (MSWalk and MSRun), and in the MSRun group it was more effective, strengthening the role of exercise in improving the metabolic profile. Similar results were found in females and males treated with fructose, in which physical training improved insulin sensitivity.29,30
In our study, the use of morphometric analysis, which is important for objective quantification, allowed us to verify that groups with fructose intake (MS) that practiced running (MSRun) showed similar behavior. There was a decrease in volume density of pancreatic islets and of cells and interstitium of the pancreatic islets, and an increase of 72% and 223%, respectively, of small islets, when compared with the control group. However, we found that the group that practiced walking showed normalization of the endocrine part of the pancreas.
Few studies have reported the beneficial effects of physical training on the pancreas alone. Studies in Zucker and ZDF animal models show preservation of β-cell mass after training, with action in the plasma insulin concentrations. The effects of exercise on insulin concentrations can somehow preserve the exhaustion of the pancreatic endocrine part by acting indirectly.31,32
Our results suggest that there is a direct action on the endocrine part, since there was a difference in results depending on whether groups practiced walking or running. Perhaps the benefit found on the pancreatic endocrine part with walking can be attributed to the anti-inflammatory effect of this practice, because running can accentuate the presence of inflammation in the pancreas with increases of cytokines and oxidative stress.33
The evidence that physical exercise acts directly within the pancreas is also supported by studies on the exocrine part of animals with MS. The MSWalk group showed decreased acini, compared with the MSRun group, and compatible results with the control group. Acinar rise and hypertrophy has been reported by Minato et al33 when they noticed acinar hypertrophy and increased zymogen granules in rats subjected to chronic physical exercise.
Finally, our results suggest that in the experimental model for induction of MS with fructose intake in Wistar rats, there are pancreatic morphoquantitative changes both in the endocrine and in the exocrine parts. Physical exercise has direct action on both pancreatic functions, and positive results were still found when it was applied in the form of walking on the studied animals.
Disclosure
The authors report no conflicts of interest in this work.
References
Basciano H, Federico L, Adeli K. Fructose, insulin resistance, and metabolic dyslipidemia. Nutr Metab. 2005;2:2–5. | |
Tran LT, Yuen VG, Mcneill JH. The fructose-fed rat: a review on the mechanisms of fructose-induced insulin resistance and hypertension. Mol Cell Biochem. 2009;332:145–159. | |
Eckel RH, Grundy SM, Zimmet Z. The metabolic Syndrome. Lancet. 2005;365(9468):1415–1428. | |
Despres JP, Lemieux E. Review article abdominal obesity and metabolic syndrome Nature. 2006;444:881–887. | |
Bilal O, Giovanni P, Bo A. Differential development of glucose intolerance and pancreatic islet adaptation in multiple diet induced obesity models. Nutrients. 2012;4:1367–1381. | |
Avramoglu KR, Basciano H, Adeli K. Lipid and a lipoprotein dysregulation in insulin resistant states. Clin Chim Acta. 2006;368:1–19. | |
Srinivasan K, Viswanad B, Asrat L, Kaul CL, Ramarao P. Combination of high-fat diet and low-dose of streptozotocin treated rat: a model for type 2 diabetes and pharmacological screening. Pharmacol Res. 2005;52:313–320. | |
Carotenuto M, Santoro N, Grandone A, et al. The insulin gene variable number of tandemrepeats (INS VNTR) genotype and sleep disordered breathing in childhood obesity. J Endocrinol Invest. 2009;32(9):752–755. | |
Sociedade Brasileira de Hipertensão, Sociedade Brasileira de Cardiologia. I Diretriz brasileira de diagnóstico e tratamento da síndrome metabólica [I Brazilian guidelines on diagnosis and treatment of metabolic syndrome]. Arq Bras Cardiol. 2005;84(Suppl 1):1–28. Portuguese. | |
National Institutes of Health. Principles of Laboratory Animal Care (NIH Publication No 96-23); Revised 1996. | |
Suzuki M, Nomura C, Odaka H, Ikeda H. Effect of an insulin sensitizer, pioglitazone, on hypertension in fructose-drinking rats. Jpn J Pharmacol. 1997;74:297–302. | |
Brooks GA, White TP. Determination of metabolic and heart rate responses of rats to treadmill exercise. J Appl Physiol. 1978;45(6):1009–1015. | |
Bonora E, Moguetti P, Zancanaro C, et al. Estimates in vivo insulin action in man: comparison of insulin tolerance tests with euglycemic and hyperglycemic glucose clamp studies. J Clin Endocrinol Metab. 1989;68:374–378. | |
Collins F. Image J Program (version 1.47). Bethesda, MI: National Institutes of Health; 2007. | |
Mandarin-de-lacerda CA. Stereological tools in biomedical research. An Acad Bras Cienc. 2003;75(4):469–486. | |
Leite CN, Ferreira TR, Rickli S, et al. Glycolytic and mitochondrial metabolism in pancreatic islets from MSG-treated obese rats subjected to swimming training. Cell Physiol Biochem. 2013;31:242–256. | |
Schelbert KB. Comorbidities of obesity. Prim Care. 2009;36(2):271–285. | |
Cunha TS, Farah V, Paulini J, Pazzine M, Elased KM, Marcondes FK. Relationship between renal and cardiovascular changes in a murine model of glucose intolerance. Regul Pept. 2007;139(1–3):1–4. | |
Song D, Arikawa E, Galipeau D, Battell M, McNeill JH. Androgens are necessary for the development of fructose-induced hypertension. Hypertension. 2004;43:667–672. | |
Galipeau D, Verma S, McNeill JH. Female rats are protected against fructose induced changes in metabolism and blood pressure. Am J Physiol Heart Circ Physiol. 2002;283:2478–2484. | |
Huang HH, Farmer K, Windscheffel J, et al. Exercise increases insulin content and basal secretion in pancreatic islets in type 1 diabetic mice. Exp Diabetes Res. 2011;2011:1–10. | |
Giannopoulou I, Ploutz-Snyder LL, Carhart R, et al. Exercise is required for visceral fat loss in postmenopausal women with type 2 diabetes. J Clin Endocrinol Metab. 2005;90:1511–1518. | |
Stefanick ML, Mackey S, Sheehan M, Ellsworth N, Haskell WL, Wood PD. Effects of diet and exercise in men and postmenopausal women with low level of HDL cholesterol and high levels of LDL cholesterol. N Engl J Med. 1998;339:12–20. | |
Harati M, Ani M, Messripour M. Effect of vanadyl sulfate on fructose-induced insulin resistance rat. Iranian Biomed J. 2003;4:179–182. | |
Zavaroni I, Sander S, Scott S, Reaven GM. Effect of fructose feeding on insulin secretion and insulin action in the rat. Metabolism. 1980;29: 970–973. | |
Hallfrisch J, Lazar F, Jorgensen C, Reiser S. Insulin and glucose responses in rats fed sucrose or starch. Am J Clin Nutr. 1979;32:787–793. | |
Reiser S, Hallfrisch J. Insulin sensitivity and adipose tissue weight of rats fed starch or sucrose diets ad libitum or in meals. J Nutr. 1977;107: 147–155. | |
Brito JO, De Angelis K. Sobrecarga de frutose induz disfunção metabólica e cardiovascular em ratas [Fructose overload induces metabolic and cardiovascular dysfunction in rats]. X Simpósio Brasileiro de Fisiologia Cardiovascular, Ribeirão Preto, São Paulo, Brazil; 2006. Portuguese. | |
Morvan E, Lima NE, Machi JF, et al. Metabolic, hemodynamic and structural adjustments to low intensity exercise training in a metabolic syndrome model. Cardiovasc Diabetol. 2013;12(89):2–10. | |
Lemos ET, Oliveira J, Pinheiro JP, Reis F. Regular physical exercise as a strategy to improve antioxidant and anti-inflammatory status: benefits in type 2 diabetes mellitus. Oxid Med Cell Longev. 2012;2012:1–15. | |
Rawal S, Huang HH, Novikova L, Hamedi T, Smirnova IV. Effect of exercise on pancreatic islets in zucker diabetic fatty rats. J Diabetes Metab. 2013;S10:1–7. | |
Pedersen BK. The diseasome of physical inactivity – and the role of myokines in muscle-fat cross talk. J Physiol. 2009;587(23):5559–5568. | |
Minato K, Shiroya Y, Nakae Y, Kondo T. The effect of chronic exercise on the rat pancreas. Int J Pancreato. 2000;27(2):151–156. |
 © 2015 The Author(s). This work is published and licensed by Dove Medical Press Limited. The full terms of this license are available at https://www.dovepress.com/terms.php and incorporate the Creative Commons Attribution - Non Commercial (unported, v3.0) License.
By accessing the work you hereby accept the Terms. Non-commercial uses of the work are permitted without any further permission from Dove Medical Press Limited, provided the work is properly attributed. For permission for commercial use of this work, please see paragraphs 4.2 and 5 of our Terms.
© 2015 The Author(s). This work is published and licensed by Dove Medical Press Limited. The full terms of this license are available at https://www.dovepress.com/terms.php and incorporate the Creative Commons Attribution - Non Commercial (unported, v3.0) License.
By accessing the work you hereby accept the Terms. Non-commercial uses of the work are permitted without any further permission from Dove Medical Press Limited, provided the work is properly attributed. For permission for commercial use of this work, please see paragraphs 4.2 and 5 of our Terms.