")
Back to Journals » Breast Cancer: Targets and Therapy » Volume 14
Effect of Chemotherapy on the Gut Microbiome of Breast Cancer Patients During the First Year of Treatment
Authors Wu AH, Vigen C, Tseng C, Garcia AA, Spicer D
Received 21 September 2022
Accepted for publication 26 November 2022
Published 9 December 2022 Volume 2022:14 Pages 433—451
DOI https://doi.org/10.2147/BCTT.S305486
Checked for plagiarism Yes
Review by Single anonymous peer review
Peer reviewer comments 2
Editor who approved publication: Professor Pranela Rameshwar
Anna H Wu,1 Cheryl Vigen,2 Chiuchen Tseng,1 Agustin A Garcia,3 Darcy Spicer4
1Department of Population and Public Health Sciences, Keck School of Medicine, University of Southern California, Los Angeles, CA, USA; 2Mrs. TH Chan Division of Occupational Science and Occupational Therapy, University of Southern California, Los Angeles, CA, USA; 3Department of Medicine, Louisiana State University School of Medicine, New Orleans, LA, USA; 4Department of Medicine, Keck School of Medicine, University of Southern California, Los Angeles, CA, USA
Correspondence: Anna H Wu, Department of Population and Public Health Sciences, University of Southern California Keck School of Medicine, 1441 Eastlake Avenue, Rm 4443, Los Angeles, CA, 90089, USA, Tel +1 323 865-0484, Email [email protected]
Introduction: There is accumulating information of the effects of chemotherapy and weight changes on the gut microbiome of breast cancer patients.
Methods: In this 1-year follow-up study, we investigated gut microbiome of 33 breast cancer patients who donated fecal samples at baseline and after completion of treatment. We compared alpha diversity and mean taxa abundance at baseline and absolute taxa abundance changes (final-baseline) by treatment (16 neoadjuvant [neoADJ], 13 adjuvant [ADJ], 4 no chemotherapy [noC]) and specific chemotherapy agent using Wilcoxon rank sum and negative binomial mixed model (NBMM) analysis.
Results: All four gut alpha diversity measures changed in association with chemotherapy treatment; they increased in the neoADJ (+16.4% OTU p = 0.03; +51.6% Chao1 p = 0.03; +7.0% Shannon index p = 0.02; +11.0% PD whole tree p = 0.09) but not in the ADJ and noC group (ADJ+noC). The difference in Chao1 index change between groups was statistically significant (pneoADJ vs. ADJ+noC=0.04). Wilcoxon p values of 0.03– 0.003 were observed for five taxa. In NBMM analysis, changes in taxa abundance differed (Bonferroni-adjusted p ≤ 0.0007) for two Bacteroidetes taxa (g_Alistipes, f_S24-7) and two Firmicutes taxa (g_Catenibacterium, g_Eubacterium). NBMM analysis results remained unchanged with adjustment for weight changes. Alpha diversity changes were also found by receipt of chemotherapy agents. Consistent increases in alpha diversity were observed among those treated with TCHP (OTU p = 0.009; Chao1 p = 0.02; Shannon p = 0.02; PD whole tree p = 0.05) but not AC, Taxol or Herceptin. Those treated with TCHP or Herceptin showed increases in Verrucomicrobia (g_Akkermansia) but decreases of Bacteroidetes(g_Alistipes); the differences in changes in taxa abundance were statistically significant.
Conclusion: Results from this pilot longitudinal study support an effect of chemotherapy, particularly neoADJ on the gut microbiome of breast cancer patients even after adjustment for weight changes. Further investigations are needed to confirm these findings in larger studies and with longer follow-up and to assess the impact of these microbiome changes on patient outcome.
Keywords: neoadjuvant, adjuvant chemotherapy, gut microbiome, alpha diversity, breast cancer
Background
Advances in sequencing technologies coupled with new bioinformatics developments have produced enormous new information on the role of the gut microbiota in human health, suggesting intriguing links between the microbiota and risk of obesity, metabolic diseases and inflammatory responses1–3 There is accumulating literature that has examined the role of the gut microbiome and risk of breast cancer risk development. Since the initial report in a Kaiser-based case-control study of significantly lower gut microbiome alpha diversity in postmenopausal breast cancer patients (n = 48) compared to postmenopausal control (n = 48),4 lower alpha diversity in breast cancer cases than control women was confirmed in three other studies,5–7 but no difference was reported in two studies8,9 while higher alpha diversity in postmenopausal breast cancer cases than in postmenopausal control women was reported in one study.10 These seemingly mixed results may be due to small numbers in most studies and other study characteristics (e.g., use of antibiotics), but results from the larger studies were generally consistent.6,7 Specifically, in the Ghana study, the largest study to date with 379 breast cancer patients (43.8% premenopausal) and 414 control women (57.2% premenopausal), the odds of breast cancer risk were significantly lower by 43% to 56% for women in the upper two tertiles of Shannon index compared to those in the lowest tertile after adjustment for relevant potential confounders. The inverse association between breast cancer risk and alpha diversity was observed irrespective of age, menopausal status, body mass index (BMI), tumor grade, estrogen receptor (ER) status, and molecular subtype.6 In addition, Ghana women with nonmalignant breast diseases (n = 102) showed significantly lower alpha diversity measures compared to control women but did not differ from women with breast cancer. Although 12 taxa were statistically significantly associated with breast cancer risk in the Ghana study, it remains to be determined which specific commensals might be associated with breast cancer risk.6
Because microbiome bacteria can interfere or enhance chemotherapy and radiotherapy treatment of cancer patients,11–14 several studies of breast cancer patients explored whether gut microbiome alpha diversity and composition might differ before and after chemotherapy treatment and between responders and nonresponders. In a study of postmenopausal Dutch women with ER+ breast cancer who were treated with 4 cycles of adjuvant (ADJ; n = 26) or neoadjuvant (neoADJ; n = 18) chemotherapy (AC followed by 4 cycles of docetaxel), alpha diversity measures (observed richness and Shannon index) were lower (p values were 0.08 and 0.10) after completion of chemotherapy than before chemotherapy. Levels of several taxa (e.g., Ruminococcaceae, Christensellaceae, unclassified Enterobacterales) decreased after completion of chemotherapy while levels of Lactobacillus increased.8,15 However, among breast cancer patients from the CANTO (CANcer Toxicities) cohort with paired samples before and after chemotherapy (35 ADJ, 10 neoADJ), alpha diversity measures increased after chemotherapy compared to before chemotherapy (p = 0.033). There was a shift of the microbiome composition towards increases in Methanobacteria species and reductions in the abundance of species such as Veillonella that have been associated with worse prognosis.16 In a study of HER2 positive breast cancer patients who were treated with Trastuzumab neoADJ, gut alpha diversity measures assessed before the beginning of treatment showed significantly higher alpha diversity in responders (n = 16) than in nonresponders (n = 7). Responders also showed a microbiota that was enriched in bacteria from the Clostridiales (i.e., Lachnospiraceae), Bifidobacteriaceae, Turicibacteriaceae, and Prevotellaceae taxa whereas Bacteroides commensals were more abundant in nonresponders.17 These results suggest that chemotherapy may impact breast and gut microbiome changes but the direction of these changes and the specific microbes that might interfere or enhance cancer treatment are yet to be established.
A large proportion of women with breast cancer receive ADJ or neoADJ chemotherapy as part of standard care.18 Weight gain in association with ADJ and neoADJ is well-documented and high BMI is associated with worse outcome.19–21 We conducted a 1 year follow-up study of 38 breast cancer patients with the objective of adding to the above literature and investigating whether the gut microbiome of breast cancer patients was altered in association with type of chemotherapy treatment (ADJ vs. neoADJ), specific chemotherapy agents, and weight changes. Baseline characteristics of these participants have been reported previously.22 Based on published reports suggesting that higher alpha diversity may be associated with better health habits including diet and body composition,23–25 we hypothesize that alpha diversity will increase among those who did not gain weight after chemotherapy. We also hypothesize that changes in alpha diversity and taxa abundance may differ by chemotherapy treatment on the basis that different chemotherapy agents have been found to influence taxa abundance14,26,27 although additional studies are needed to identify which specific taxa or the direction of changes. In this paper, we investigated whether changes in alpha diversity and taxa abundance differed by weight changes and whether these changes were affected by chemotherapy regimen.
Materials and Methods
Data and Specimen Collection
This 1 year longitudinal study was conducted at the University of Southern California (USC) Norris Comprehensive Cancer Center (NCCC) and at the Los Angeles County + USC Medical Center. Women of all race and ethnicities, newly diagnosed with incident invasive breast cancer were considered potentially eligible. Exclusionary criteria included recurrent breast cancer, a history of other cancers (other than non-melanoma skin cancer), celiac or inflammatory bowel disease, bariatric surgery, recent pregnancy or nursing (within past 12 months), past treatment with chemotherapy, recent antibiotic use (defined as one week or more during the month prior to baseline fecal sample collection), or use of probiotic supplements or prednisone.
After signing informed consent, eligible and willing patients donated up to four fecal specimens and completed up to four clinical visits during an average of 1 year of follow-up. When possible, we scheduled the final fecal sample collection after completion of chemotherapy (and radiation therapy, if applicable) to coincide with the participant’s routine follow-up appointment. Figure 1 shows the timing of baseline and final fecal sample collections with respect to diagnosis and treatment. For the neoADJ group, baseline fecal samples were collected 2.5 ± 3.9 days before chemotherapy started and the final samples were collected 178.4 ± 85.0 days after chemotherapy ended. For the ADJ group, baseline fecal samples were collected 3.5 ±3.1 days before chemotherapy started and the final samples were collected 138.5 ± 55.4 days after completion of chemotherapy. For the no chemotherapy (noC) group, baseline samples were collected 52.5 ± 15.7 days after surgery and the final samples were collected 127.3 ± 46.9 days after completion of radiation. The interval between date of diagnosis and the final fecal sample collection was 370.4 ± 64.0 days for the neoADJ group, 362.1 ± 90.4 days for the ADJ group, and 289.8 ± 21.3 days for the noC group. As described previously, participants used pre-labeled collection devices and tubes containing the nucleic acid preservative RNAlater which we provided.22 They collected and stored fecal samples in their home freezers until they were brought to USC at their clinic visit or the samples were picked up by the study staff. These fecal samples were stored in the −80°C freezers at USC until they were sent for microbiome analysis at the completion of the study (see below). Participants had two dual-energy X-ray absorptiometry (DXA) scans at USC facilities; a baseline scan at the first clinic visit and a second scan on the same day or around the time of the last clinic visit. Participants also completed a baseline questionnaire which assessed menstrual and reproductive history, medical history (e.g., diabetes, hypertension), family history of cancer, use of medications and vitamin supplements, and usual diet based on the Block2005 food frequency questionnaire (English and Spanish). Information on lifestyle and medical history was updated at each of the clinic visits.
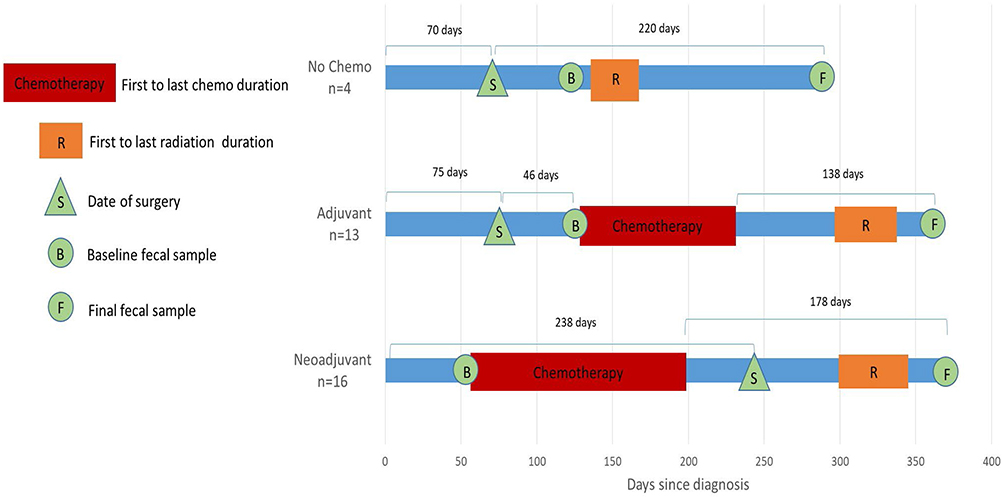 |
Figure 1 Timing of baseline (B) and final (F) fecal sample collection in relation to date of diagnosis and standard treatment. |
Fecal Specimen Processing and Microbiome Analyses
Microbiome analyses were conducted in the laboratory of Dr. Jacques Ravel using validated and published procedures.28,29 An average of 150 mg of stool was extracted from each fecal sample, between 5 and 10 µg of high quality whole genomic DNA was extracted and used to amplify 16S rRNA genes. The 16S rRNA gene amplification used the two barcoded universal primers 319F and 806R for PCR amplification of the V3 and V4 hypervariable regions and sequenced the amplicons on the Illumina MiSeq platform. The 16S rRNA genes were amplified in 96-well microtiter plates. Negative controls without a template were processed for each primer pair. Sequence read quality was performed using a bioinformatics pipeline that is in accordance with standard operating procedures of the NIH Human Microbiome Project.30,31 The taxonomic assignments of sequences were performed using the Ribosomal Database Project Bayesian classifier, and as implemented in QIIME, using the GreenGene taxonomic database as reference.32–34 Taxa abundance and read counts tables were generated for each of the 144 fecal samples collected from 38 breast cancer patients. Fourteen samples failed (i.e., < 100 read counts); 4 were from one patient who was excluded from all analyses. Of the other failed samples from 37 patients, two were baseline and two were last samples from four different patients (the two subjects with low baseline read counts did not contribute to analysis on alpha diversity but contributed baseline analysis on taxa abundance35 This current analysis on baseline and last fecal samples was based on 33 breast cancer patients (Table 1). The study protocol was approved by the USC Institutional Review Board.
 |
Table 1 Characteristics of 33 Breast Cancer Patients by Treatment with Baseline and End of Study Fecal Samples |
Statistical Analyses
The patient population is described and differences in characteristics between neoADJ and ADJ patients were evaluated using Wilcoxon rank sum tests, t-tests, or chi-square or Fisher exact tests, as appropriate, while differences in characteristics between neoADJ, ADJ, and noC groups were evaluated using Kruskal Wallis, chi-square or Fisher exact tests.
Microbiome alpha diversity was estimated after rarefaction. We used Wilcoxon signed rank tests to determine the significance of change in four alpha diversity measures (number of observed species, Chao1, Shannon, and PD whole tree) and BMI for subgroups of patients defined by treatment and change in BMI. We then used Wilcoxon rank sum tests to examine if baseline alpha diversity or BMI or changes in alpha diversity or BMI during the 9 months of follow-up varied by chemotherapy treatment (16 neoADJ vs. 17 non-neoADJ (13 ADJ + 4 noC); 16 neoADJ vs. 13 ADJ) and by BMI change (16 lost weight vs. 17 gained weight). We repeated alpha diversity and BMI change analyses using mixed effects regression methods (proc mixed), adjusting chemotherapy models for weight changes, and adjusting BMI gain/loss models for chemotherapy. Changes in alpha diversity by chemotherapy agents were also investigated: 15 yes AC (Adriamycin (Doxorubicin) + Cyclophosphamide) vs. 18 no AC; 14 yes Taxol vs. 19 no Taxol; 8 yes TCHP (Docetaxel + Carboplatin+ Pertuzumab+ Trastuzumab) vs. 25 no TCHP; and 11 yes Herceptin vs. 22 no Herceptin. Data were analyszed using SAS 9.4 (SAS, Cary, NC).
We conducted permutational multivariate analysis of variance (PERMANOVA) to test statistical significance of overall composition between baseline vs. final samples (n = 33) by treatment, chemotherapy agent, and BMI change.36 The relationship of overall gut microbiome composition by treatment and BMI change was assessed by principal coordinate analysis (PCoA) based on the unweighted and weighted phylogenetic UniFrac distance matrix.37 PCoA plots were generated using the first two principal components by treatment and BMI change. The data were analyzed using R (R Foundation for Statistical Computing, Vienna, Austria).
Turning to taxonomy, we conducted analyses to examine relationships of specific taxa to treatment, chemotherapy agent, and BMI change during the follow-up. We calculated change in the relative abundance of 74 specific taxa that had levels above zero, by subtracting relative abundance of baseline values from final (end of study) values. Statistical tests by Wilcoxon rank sum were used to compare results for neoADJ vs. non-neoADJ (ADJ + noC) and for neoADJ vs. ADJ groups (SAS 9.4, SAS, Cary, NC). In addition, to accommodate the sparse, non-normally distributed count data, we repeated analyses using negative binomial mixed models (NBMM) analysis for longitudinal microbiome data35 with adjustment for age (continuous), race (Hispanic or not Hispanic), total number of reads, without adjustment (Model 1) and with adjustment for BMI change (Model 2). To correct for multiple comparisons,38 Bonferroni-adjusted significance levels were set for 74 genera (0.05/74, p ≤ 0.0007). Because of the modest sample sizes of this pilot study, we also considered the differences in change in genera to be suggestive if 0.0007 < p ≤ 0.007.
Sensitivity Analyses: While the duration between baseline and final fecal sample collection was a median of 246 days, this duration differed by chemotherapy treatment (Figure 1). Therefore, we also conducted NBMM analyses adjusted for duration (≤ 246 vs. > 246 days) of sample collection days (Model 3). Although none of the subjects were antibiotic users prior to baseline fecal sample collection, there was some antibiotics use during the follow-up period but most were short (14 used it for 1 day, 5 used it for 4–7 days) and almost all were taken long before the last sample collection (107–221 days before last sample collection for 10 subjects, 56–95 days for 6 subjects, and 14–38 days for 3 subjects). A coded variable on antibiotic use (no use, last used > 200 days, 100–199 days, 50–99 days, 1–49 days before final fecal collection) was derived and adjusted for (Model 4). R (R Foundation for Statistical Computing, Vienna, Austria) was used.
Wilcoxon rank sum tests were conducted to assess differences in alpha diversity measures and in relative abundance levels of select taxa by the receipt (yes/no) of four specific chemotherapy agents (AC, taxol, TCHP, Herceptin).
We compared baseline mean taxa abundance and absolute changes (final-baseline) in taxa abundance between the weight loss (n = 16) and weight gain (n = 17) groups using Wilcoxon and NBMM. We also compared baseline mean taxa abundance and absolute changes (final-baseline) in taxa abundance between short duration vs. long duration (≤ 246 vs. > 246 days) between baseline and final fecal sample collection.
Lastly, assessment of cancer status and vital status through June 2022 was used to determine if outcome differed by treatment (neoADJ, ADJ, noC) or by alpha diversity measures at either the baseline or the final fecal sample collection using proportional hazards regression models. Two different outcomes were used: (1) alive vs. dead; and (2) alive and cancer-free vs. dead or recurrence/new cancer. These data were analyzed using SAS 9.4 (SAS, Cary, NC).
Results
Characteristics of Breast Cancer Patients
The 33 breast cancer patients with baseline and final (end of study) fecal samples were ages 51.7 ± 12.4 years, obese (mean baseline BMI of 31.4 ± 8.0 kg/m2), mostly Hispanics (73%), about half (52%) were premenopausal and had early (stage I/II) breast cancers that were mostly hormone receptor (HR) positive (ER+PR+) (63.6%) and HER2 negative (72.7%) (17 ER+PR+HER2 negative; 7 Triple negative) (Table 1). About half (n = 16, 48.5%) received neoADJ, 13 (39.4%) received ADJ, and 4 (12.1%) had noC. The three treatment groups were similar in distribution by HR status but all four patients requiring noC had early (I/II) stage cancer compared with 61.5% (8 of 13) in the ADJ and 37.5% (6 of 16) in the neoADJ group (p2df = 0.07). Although baseline BMI did not differ by treatment and there were no overall significant changes in weight during follow-up, 17 women gained an average of 3.7± 0.5 kg while 16 women lost an average of 4.7± 1.2 kg. Weight change was not uniform by treatment; the mean weight gain was 1.0 ± 3.6 kg in the ADJ and 0.33 ± 3.4 kg in the noC groups while there was a mean weight loss of 1.5 ± 7.0 kg in the neoADJ group.
Alpha Diversity Changes by Chemotherapy and Weight Changes
Baseline alpha diversity measures (operational taxonomic units [OTU], Chao1, Shannon index, phylogenetic diversity [PD]_whole tree) did not differ by treatment (Table 2). However, alpha diversity measures changed nonuniformly by treatment during follow-up (Figure 2). Women in the neoADJ group showed increases in all four measures: +16.4% in OTU p = 0.03; +51.6% in Chao1 p = 0.03; +7.0% in Shannon index p = 0.02; +11.0% in PD whole tree p = 0.09. Alpha diversity measures increased minimally (1.6% to 2.4%) in the ADJ group and and decreased 4.4% to 11.3% in the noC groups; none of these changes were statistically significant. A suggestive difference in change in Chao 1 index between neoADJ and non-neoADJ (ADJ + noC) group was observed (p = 0.04). Suggestive differences remained after also adjusting for weight changes (Table 2). Baseline alpha diversity measures did not differ between the weight loss and weight gain groups but changes in alpha diversity measures appeared to differ between the two groups (Figure 2). The weight loss group (n = 16, BMI decreased 2.03 ± 0.55 kg/m2) showed increases in OTU (+17.1% p = 0.02), Chao I index (+40.6% p = 0.03), PD_whole tree (+15.4% p = 0.04), and Shannon index (+6.7% p = 0.06) while the weight gain group (n = 17, BMI increased 1.49 ± 0.19 kg/m2) showed nonsignificant decreases in alpha diversity measures. The differences in changes in alpha diversity measures between the two groups were suggestive: OTU(p = 0.06), Chao 1 index (p = 0.04), and PD_whole tree (p = 0.08).These differences remained with adjustment for chemotherapy (Table 2).
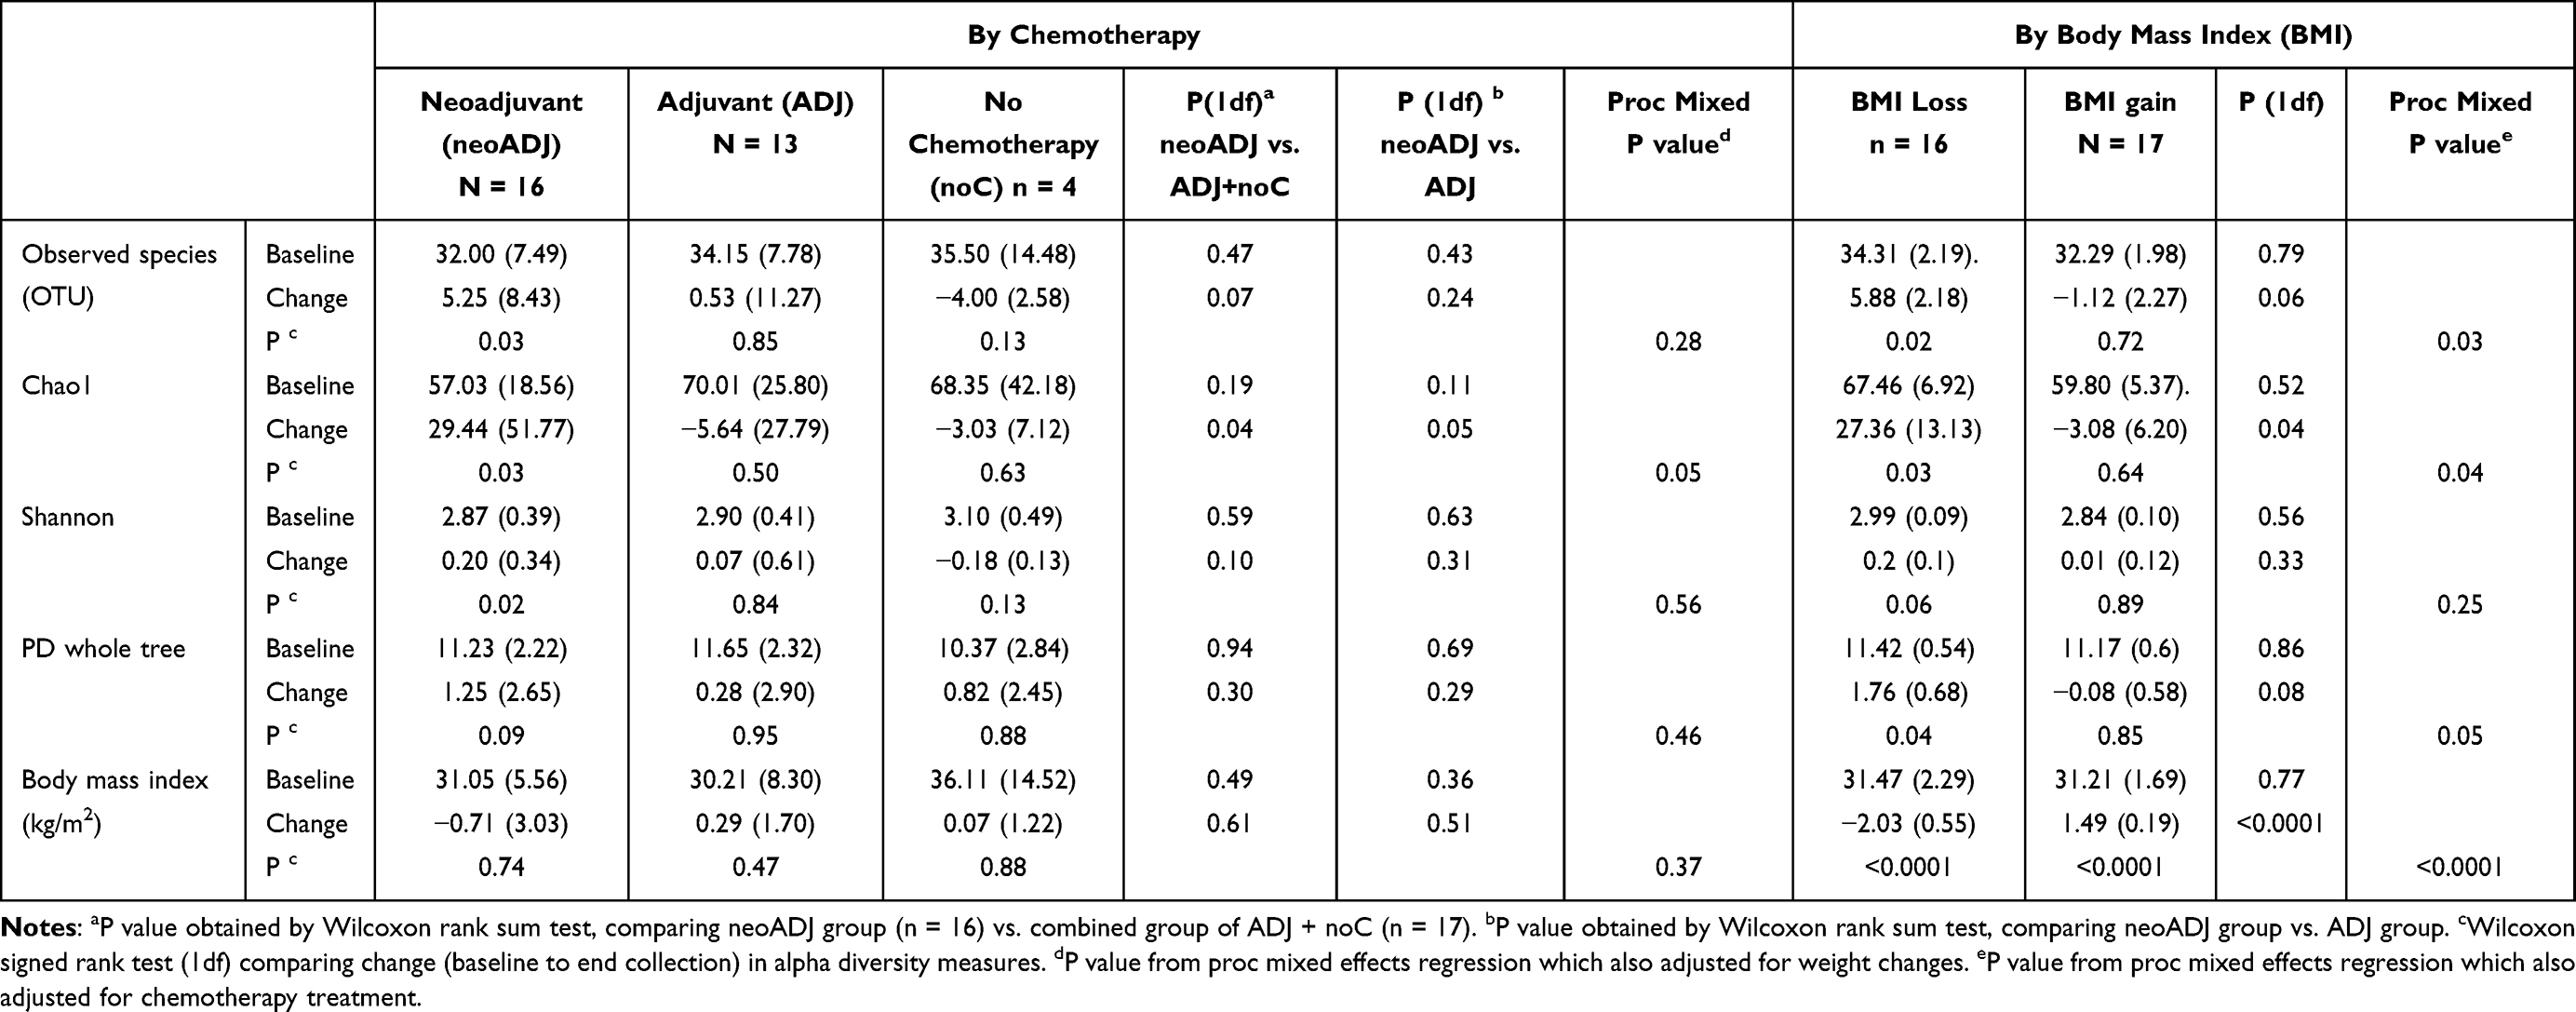 |
Table 2 Alpha Diversity Measures and BMI at Baseline and Changes Over Time by Chemotherapy Treatment and by BMI |
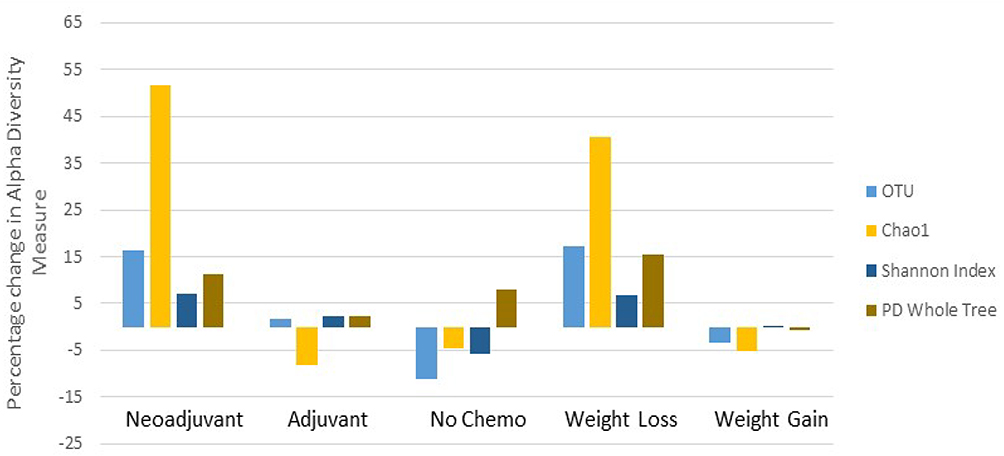 |
Figure 2 Percentage change in alpha diversity measures (OTU, Chao 1 index, Shannon index, and PD Whole tree) by chemotherapy treatment (neoADJ n = 16, ADJ n = 13, noC n = 4), and by weight changes (weight loss n = 16; weight gain n = 17). |
Beta-Diversity Changes by Chemotherapy and Weight Changes
Supplementary Figure 1 showed that the neoADJ and non-neoADJ group did not differ in beta diversity at baseline or final collection using the unweighted UniFrac distance (Panel A and B). Similarly, the weight loss and weight gain groups did not differ in their baseline or final microbiome (Panel C and D). None of the differences were statistically significant using weighted UniFrac distance (data not shown).
Gut Microbiome Composition Changes by Chemotherapy
We compared mean taxa abundance at baseline and absolute changes (final-baseline) in taxa abundance between neoADJ (n = 16) and non-neoADJ (n = 17) using Wilcoxon rank sum and NBMM analyses (Table 3). The smallest Wilcoxon P values were between 0.03 to 0.003 for five taxa: Bacteroidetes (g_Alistipes), Firmicutes (g_Clostridium, g_Eubacterium, g_Bilophila) and Proteobacteria g_Haemophilus). In NBMM analyses without adjustment for weight changes, changes in abundance of four taxa differed at p values ≤ 0.0007 and this included two Bacteroidetes taxa (g_Alistipes p = 0.00003; f_S24-7 p = 0.0004) and two Firmicutes taxa (g_Catenibacterium p = 7.0E-06; g_Eubacterium p = 0.0005). Changes in eight other taxa were suggestive (0.0007 < p ≤ 0.007):Actinobacteria (g_Slackia), Bacteroidetes (f_Rikenellaceae), Euryarchaeota (g_Methanobrevibacter), Firmicutes (f_Germellaceae, g_Turicibacter, f_Clostridiaceae; g_Acidaminococcus) and Verrucomicrobia (g_Akkermansia). Results were similar with adjustment for BMI changes; p values were ≤ 0.0007 for four taxa: Actinobacteria (g_Slackia), Bacteroidetes (f_Rikenellaceae; g_Alistipes), Firmicutes (f_Clostridiaceae) and were 0.0007 < p< 0.007 for seven taxa: Bacteroidetes (f_S247), Euryarchaeota (g_Methanobrevibacter), Firmicutes (f_Germellaceae, g_Turicibacter, g_Acidaminococcus; g_Eubacterium) and Verrucomicrobia (g_Akkermansia). With BMI adjustment, only the difference in abundance of Firmicutes (g_Catenibacterium) was no longer observed. Results changed little when we further adjusted for number of days between baseline and final fecal sample collection (model 3) and for last antibiotics use before final fecal sample collection (model 4). The p values obtained from NBMM analyses for model 1 (no adjustment) and model 4 (fully adjusted) are shown in Figure 3. Results were mostly similar comparing neoADJ to ADJ groups (Supplementary Table 1).
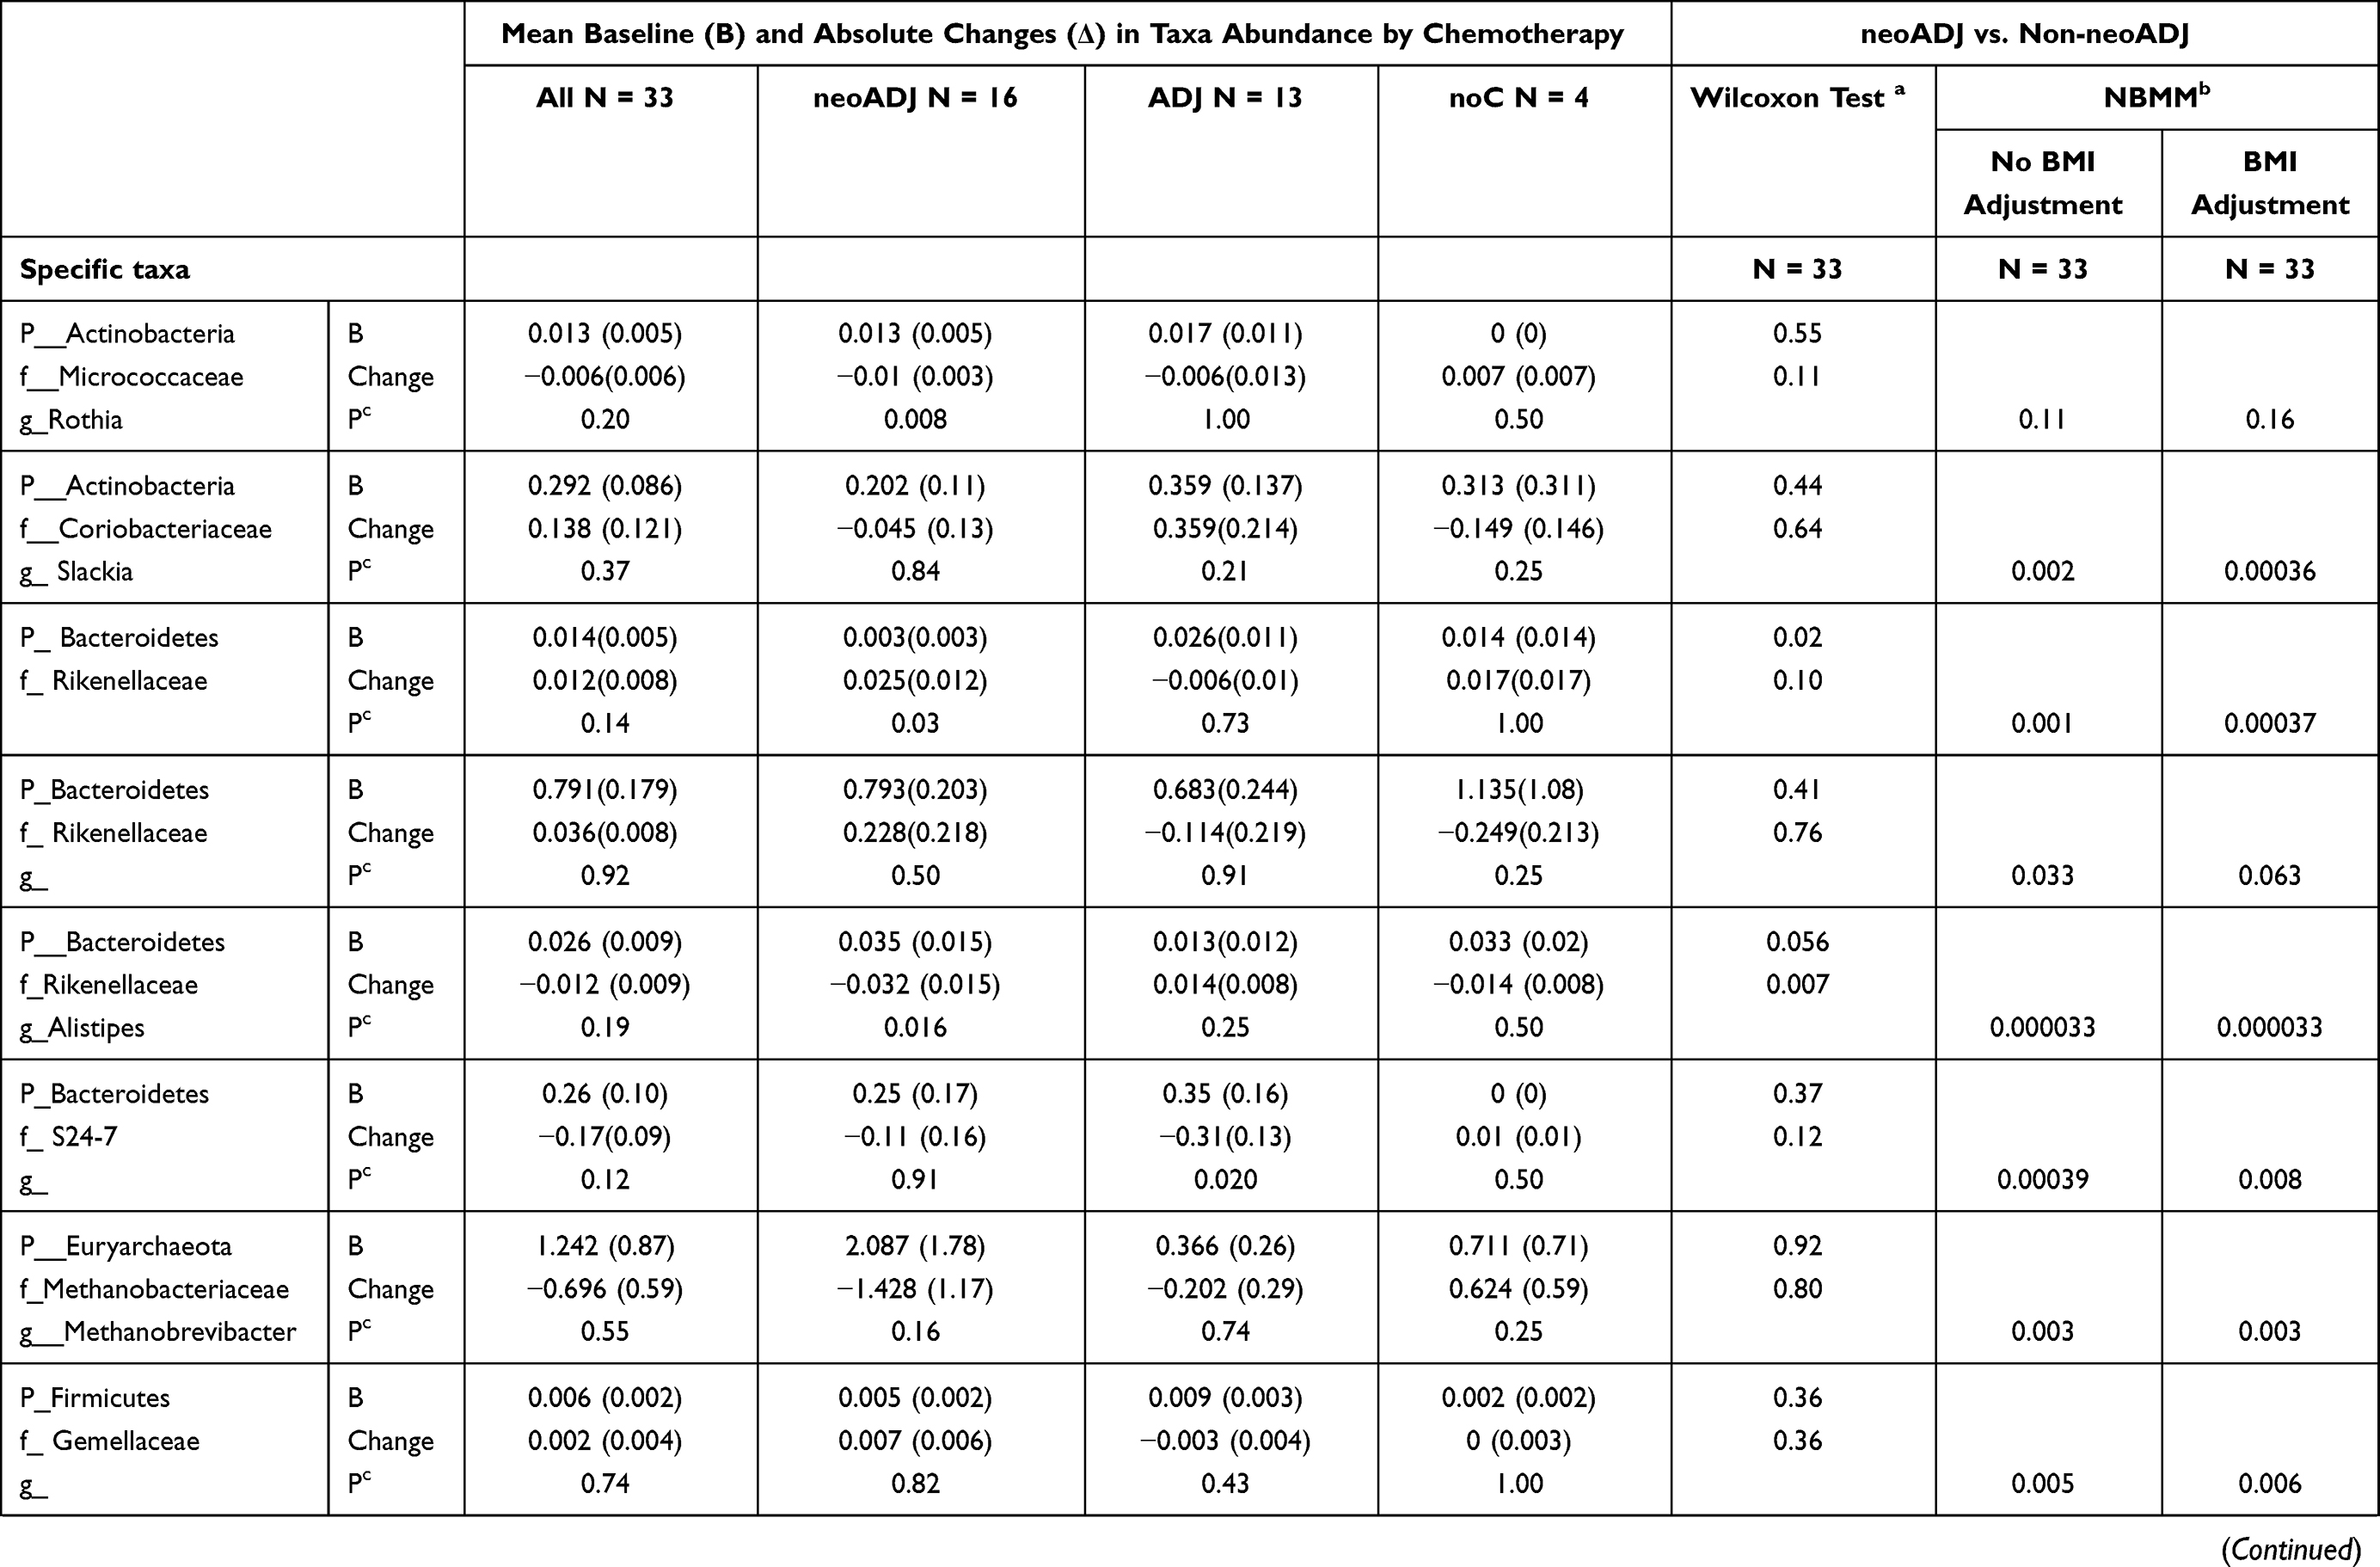 | 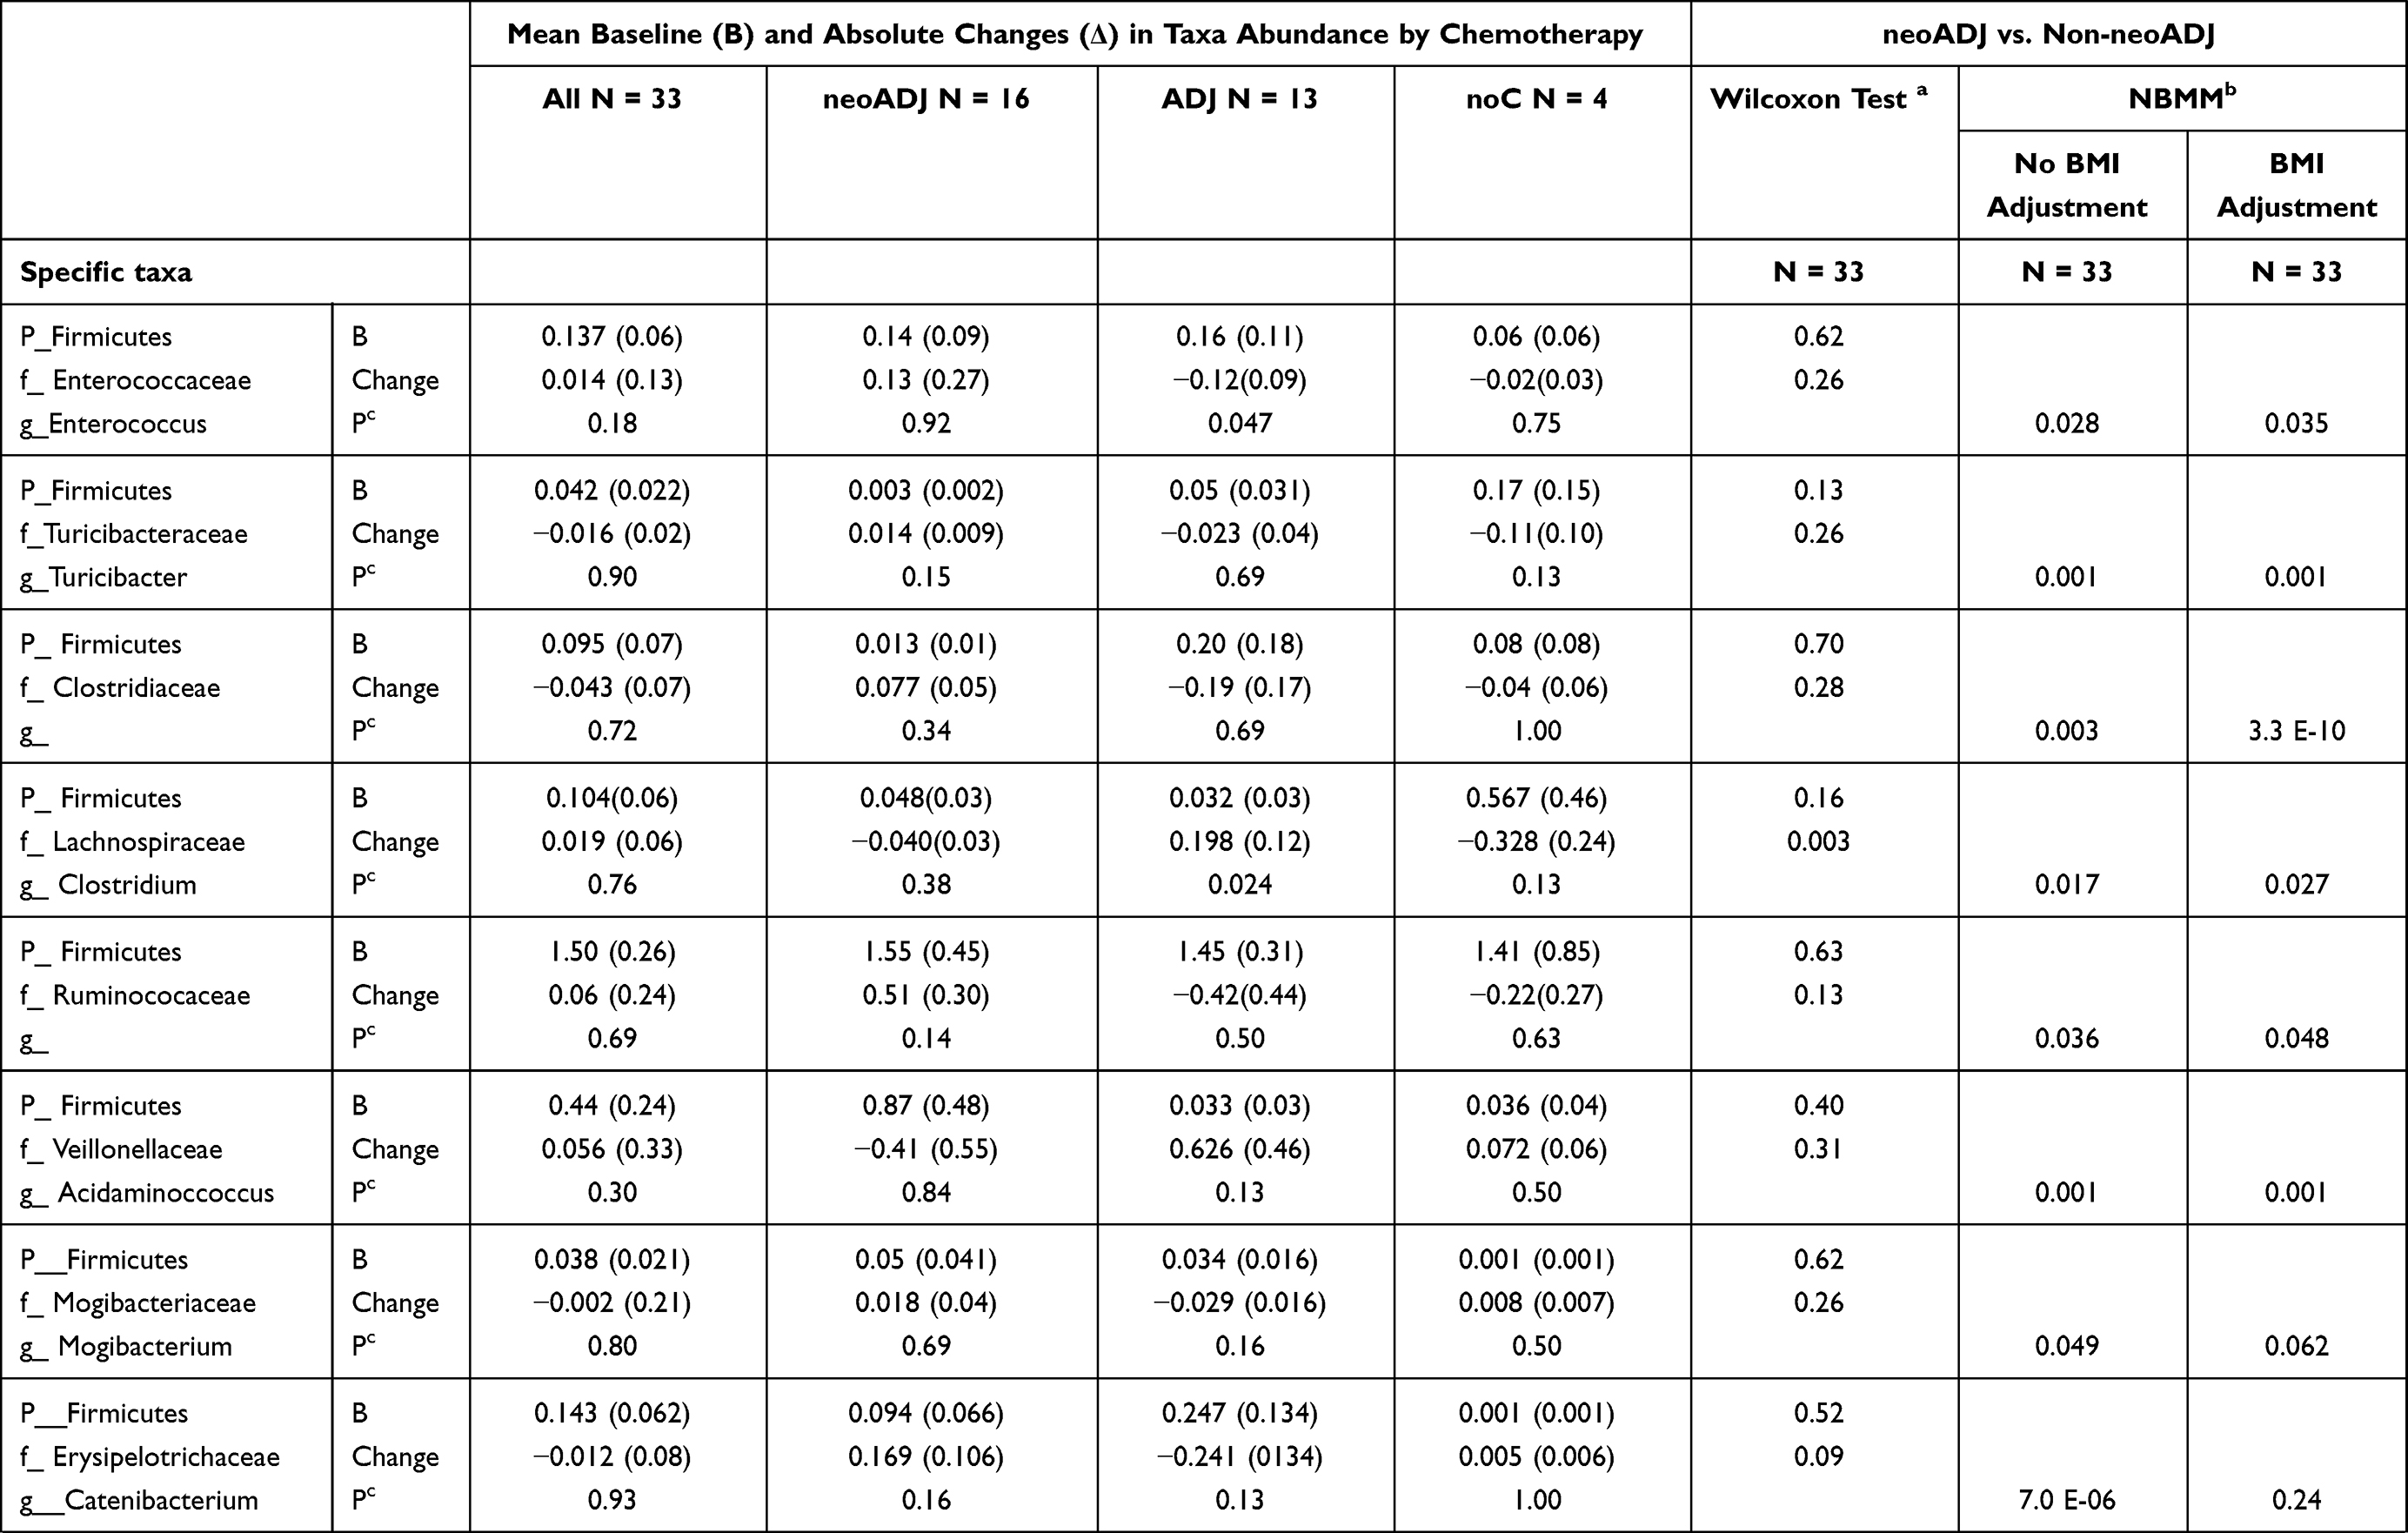 | 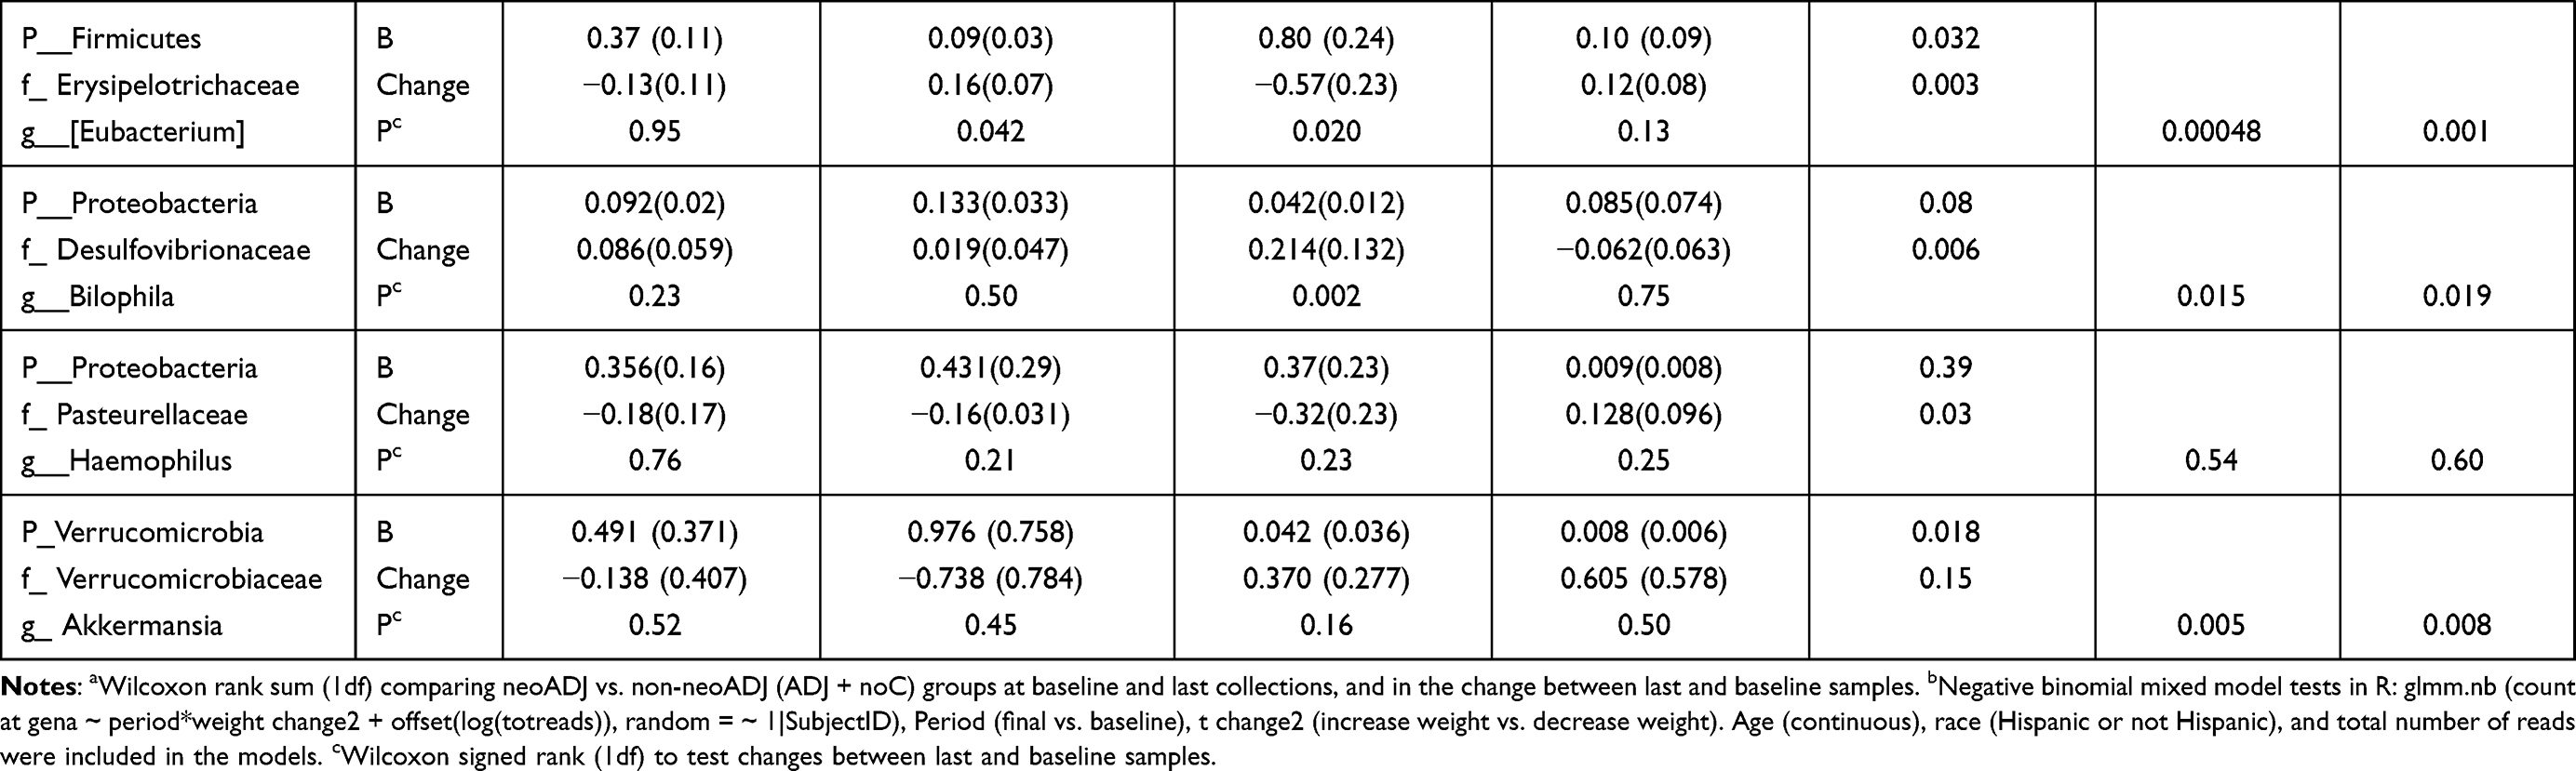 |
Table 3 Wilcoxon and NBMM Analyses to Examine Changes in Select Taxa Abundance Between Baseline and Final Fecal Sample by Chemotherapy Treatment: neoADJ vs. Non-neoADJ (ADJ+ noC) |
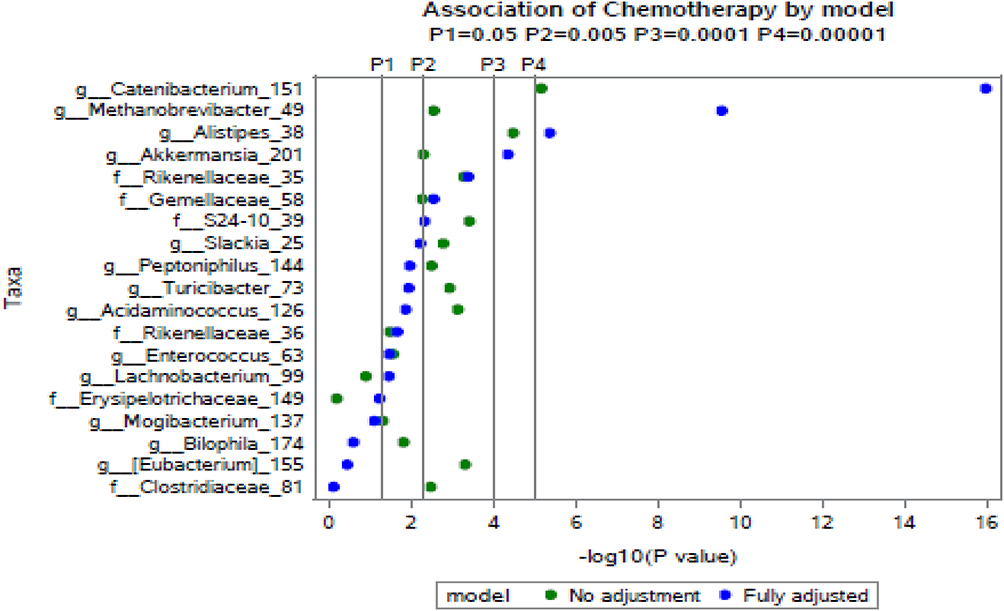 |
Figure 3 Significantly differentially abundant taxa (p < 5% significance threshold) between the neoADJ (n = 16) vs. non-neoADJ groups (n = 17). The x-axis indicates the minus log transformed p values, so that values further to the right indicate greater statistical significance. NBMM analyses were used in both models: the unadjusted (model 1, green) and fully adjusted (adjusted for weight changes, days between baseline and final fecal collection, and last antibiotics use) (model 4, blue). |
Gut Microbiome Composition Changes by Specific Chemotherapy Agents
There were changes in alpha diversity measures by receipt of specific chemotherapy agents (Table 4). All four alpha diversity measures increased significantly after TCHP treatment and the changes differed significantly between those treated with TCHP and not treated with TCHP (OTU p = 0.009; Chao1 p = 0.02; Shannon p = 0.02; PD whole tree p = 0.05). Treatment with Taxol was associated with decreases in Chao1 and the change between the Taxol treated and not treated group was statistically significant (p = 0.03). Receipt of AC and Herceptin was not associated with differences in changes of alpha diversity measures. Changes in taxa abundance by specific chemotherapy regimen are also shown in Table 3. Abundance of one taxa (Firmicutes g_Acidaminococcus) changed in relation to all four chemotherapy agents, showing increases among those treated with AC and Taxol but decreases among those treated with TCHP and Herceptin; the respective p values associated with changes in this taxa were 0.03, 0.10, < 0.01 and 0.02. Those treated with TCHP or Herceptin showed increases in abundance of Verrucomicrobia (g_Akkermansia) but decreases in the abundance of Bacteroidetes (g_Alistipes); the differences in changes in taxa abundance were statistically significant. In addition, women treated with TCHP showed increases in Firmicutes (g_SMB53) (p value for change = 0.01). Abundance of Actinobacteria (g_Actinomyces), Firmicutes (g_Coprococcus, g_Ruminococcus) decreased among those treated with AC (p values for change ranged from 0.01 to 0.03) while abundance of Actinobacteria (g_Actinomyces, g_Rothia) and Firmicutes (g_Lactobacillus, g_Streptococcus) decreased among those treated with Taxol (p values for change ranged from 0.02 to < 0.01). However, beta-diversity at baseline or final collection using unweighted UniFrac distance did not differ by receipt (no/yes) of AC, Taxol, TCHP or Herceptin; results were similar using weighted UniFrac distance (data not shown).
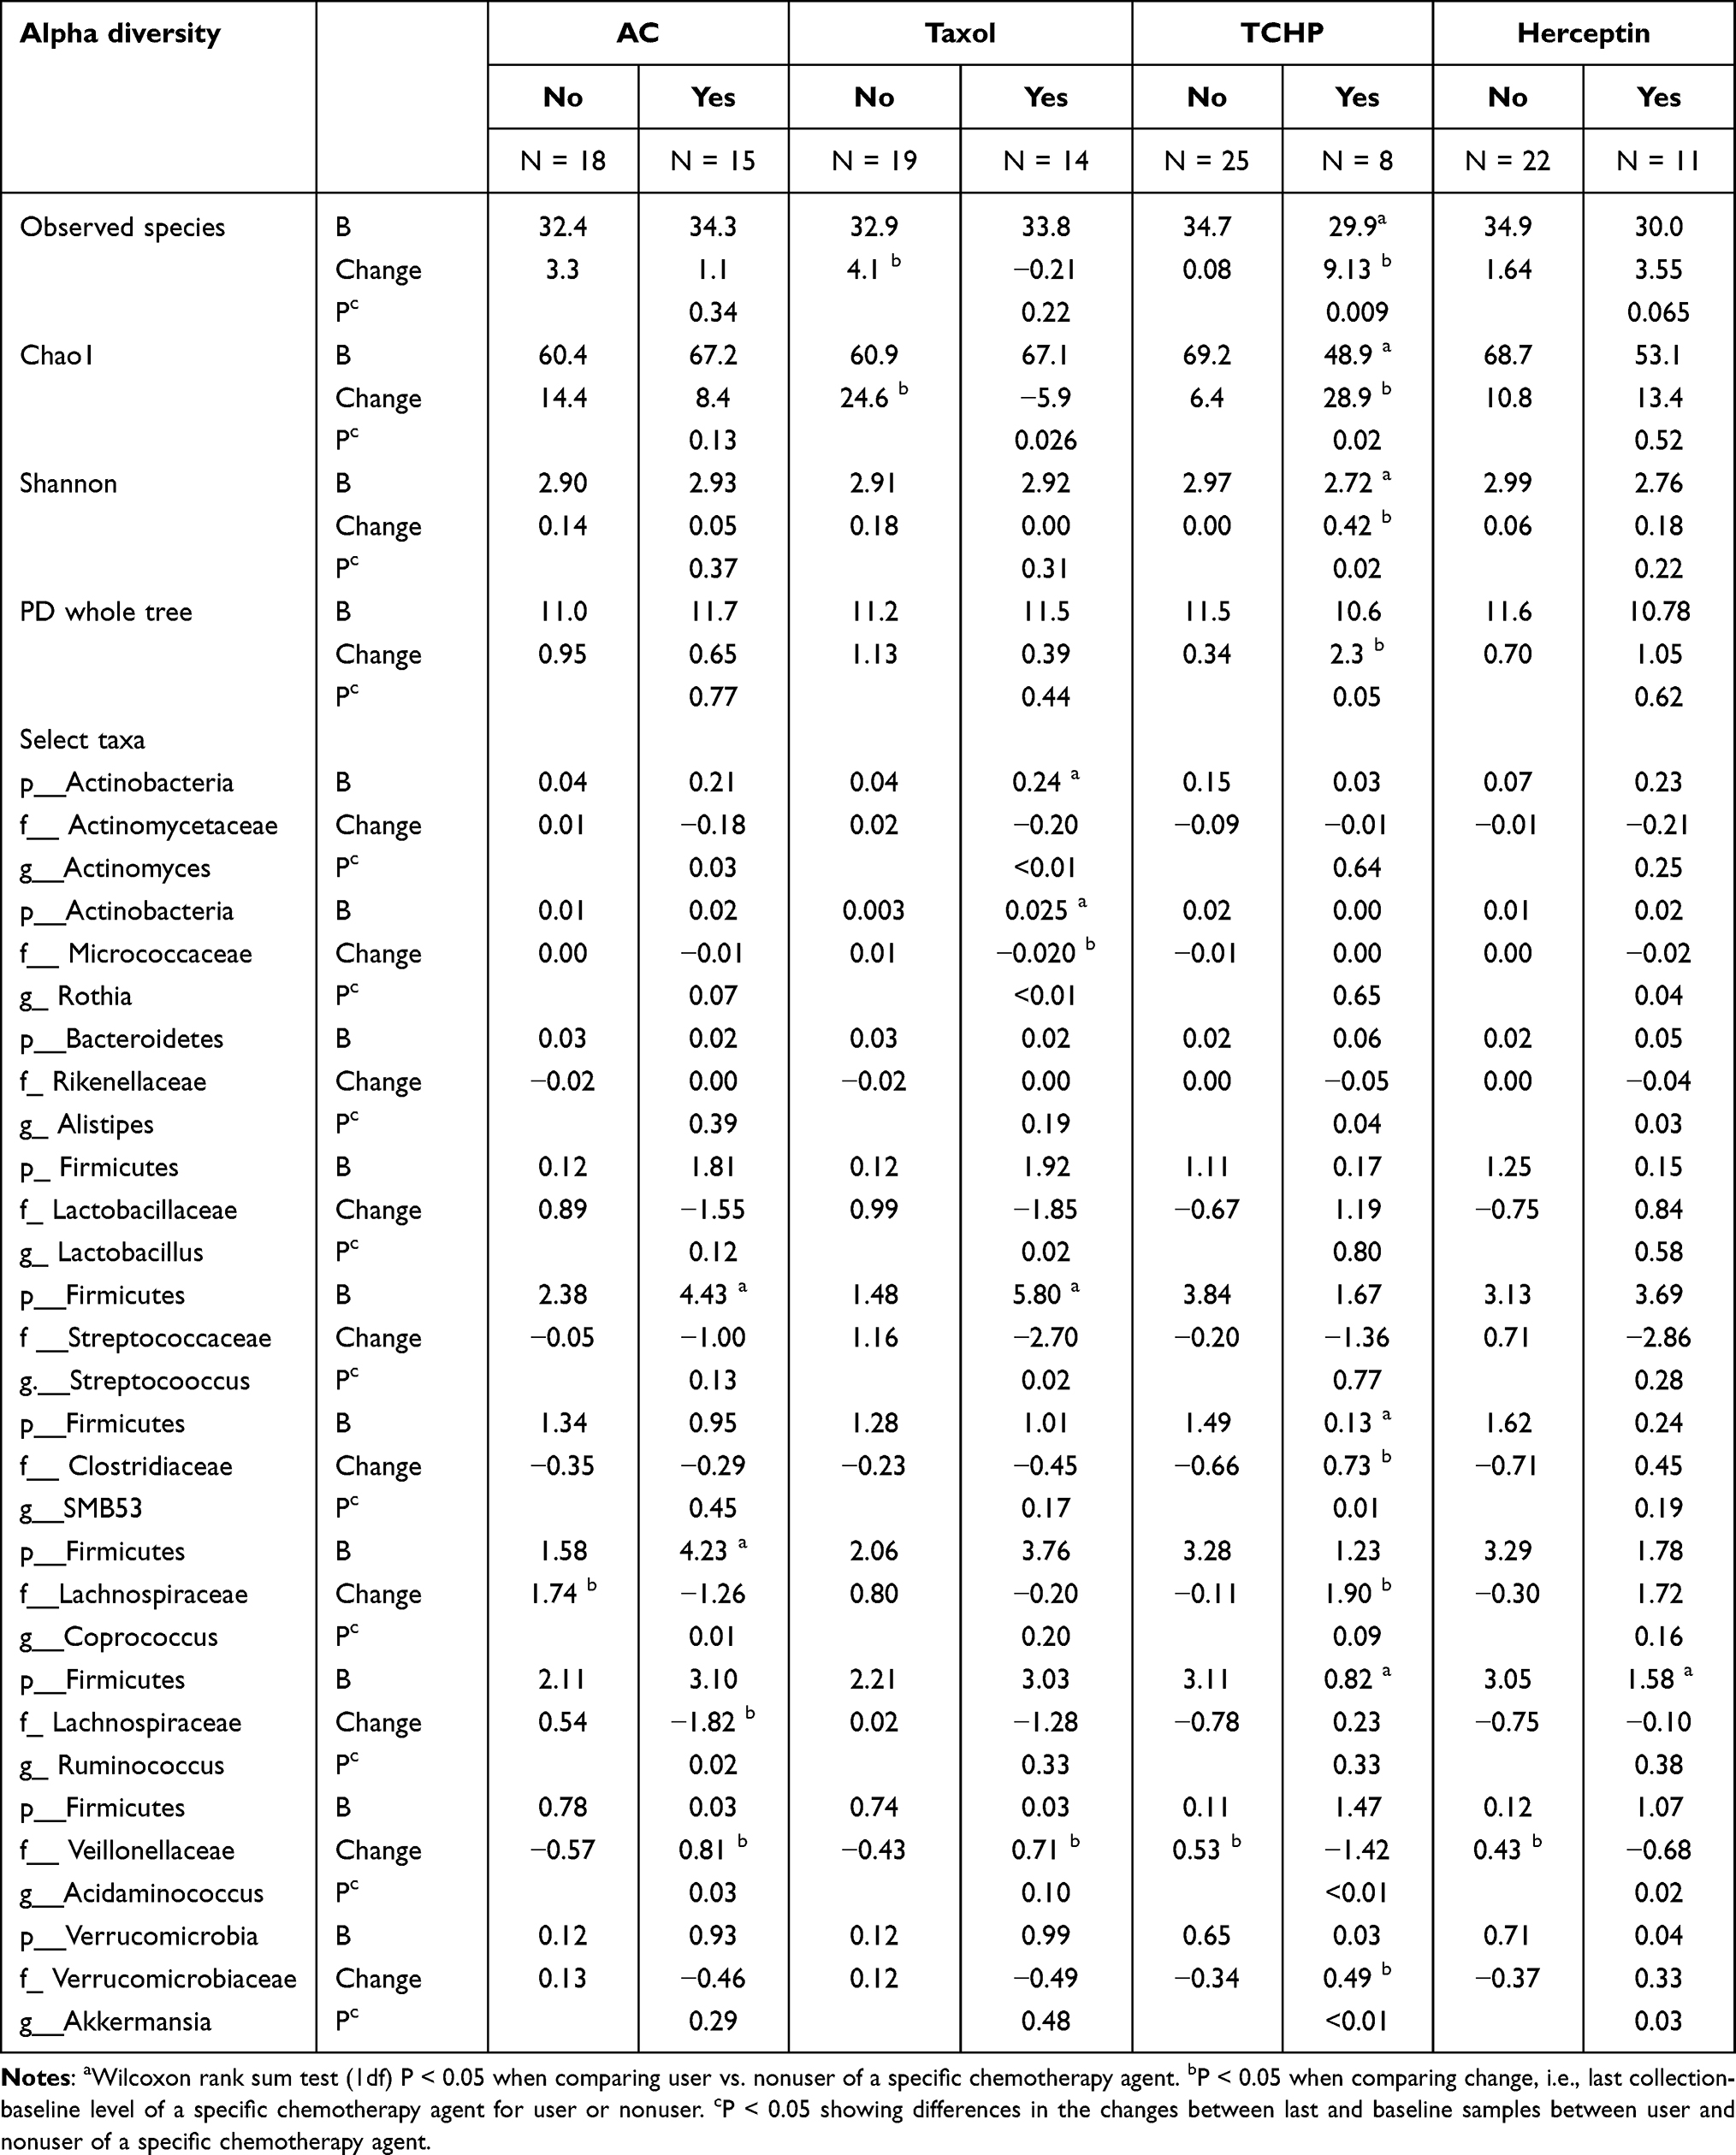 |
Table 4 Mean Baseline (B) and Absolute Changes (Δ) in Alpha Diversity Measures and Relative Abundance Levels of Select Taxa by Specific Chemotherapy Agents |
Gut Microbiome Composition Changes by Weight Changes
We compared baseline mean taxa abundance and absolute changes (final-baseline) in taxa abundance between the groups using Wilcoxon and NBMM. None of the taxa showed changes in abundance by weight loss (n = 16) and weight gain (n = 17) that met the p < 0.0007 threshold. However, one taxa, Firmicutes (g_Lachnobacterium) emerged in all three tests (Wilcoxon p = 0.007; NBMM p = 0.002 without adjustment for chemotherapy; and p = 0.006 with adjustment for chemotherapy) (Supplementary Table 2). Four taxa showed changes in abundance by short (≤ 246 days, n = 16) vs. long (> 246 days, n = 17) duration between baseline and final fecal collection with p values between 0.02 and < 0.0001; only one taxa remained significant at p = 0.001 after adjusting for chemotherapy treatment (data not shown).
As of June 2022, there are 5 deaths (3 neoADJ, 1 ADJ, 1 noC), 4 lost to follow-up (1 probably dead, 3 do not know; all 4 are neoADJ). An additional 5 women who are still alive have had a recurrence or a cancer at a new site. Treatment with neoADJ was associated with an increase risk of death (p = 0.05) but not with the composite outcome of death or recurrence/new cancer. None of the alpha diversity measures were associated with either survival outcome (p > 0.15 for all).
Discussion
This pilot study of breast cancer patients with preplanned analyses to examine changes in gut microbiome during their first year of treatment in relation to type of chemotherapy adds to the growing literature on the role of gut microbiome in relation to breast cancer development and outcome. In all three groups, the final fecal sample was collected more than 100 days after the end of chemotherapy (for neoADJ and ADJ groups) or radiation (for noC group), representing a recovery period. Although there were no differences in baseline gut alpha diversity measures between ADJ, neoADJ and noC group, we found striking differences in gut alpha diversity changes by treatment, increases in all four alpha diversity measures in the neoADJ group that was not observed in the ADJ or noC groups. Nonsignificant increases in alpha diversity were also observed in the weight loss but not in the weight gain groups. We found suggestive gut microbiome changes by chemotherapy agents; specifically increases in alpha diversity measures among those treated with TCHP.
Three studies of breast cancer patients offered intriguing information on gut microbiome of breast cancer patients by chemotherapy treatment. In a Dutch study, baseline gut microbiome Shannon index was 5% higher among breast cancer patients in the neoADJ (n = 18) than those in ADJ (n = 63) groups (p = 0.057).8 In contrast, baseline alpha diversity measures in our study were lower in the neoADJ than ADJ group (Table 2) but the ADJ group in the previous study was ~5 times larger while the sample size of the neoADJ in the two studies were similar. A second study based on the CANTO cohort collected fecal samples before (n = 76) and after (n = 45) chemotherapy from breast cancer patients and performed analyses combining the neoADJ and ADJ groups16. In the Dutch study, alpha diversity decreased after completion of chemotherapy (observed species decreased 9.6% [p = 0.042] and Shannon index decrease 2.5% [p = 0.21])15 whereas in the CANTO study, species richness increased (p = 0.033) after completion of chemotherapy (p = 0.033).16 However, because these two previous studies did not investigate changes in alpha diversity separately by type of chemotherapy and our results suggest increased in alpha diversity in the neoADJ group but decreases in the AD group, additional studies by type of chemotherapy will be needed. It should be noted that the last fecal sample was collected ~100 days after completion of chemotherapy in our study but it is not clear when the fecal sample was collected after completion in the previous two studies.15,16 It is reasonable to speculate that changes in the gut microbiome immediately after completion of chemotherapy may differ from gut microbiome assessed a few months after completion of chemotherapy. A third study included 24 breast cancer patients with HER2+ disease who received neoADJ trastuzumab-based chemotherapy. Results showed that baseline alpha diversity measures (Chao1, Shannon, Simpson indexes) were significantly higher in the 16 responders (pathologic complete response) than in the 8 nonresponders who had residual disease at surgery.17 Although our study was not designed to assess microbiome changes by treatment response, we found no significant changes in alpha diversity in relation to risk of recurrence/metastases.
Changes in taxa abundance appeared to differ by treatment (neoADJ vs. ADJ) in this pilot study. One taxa, p Bacteroidetes (g_Alistipes) showed decreases in the neoADJ group but not in the ADJ group after completion of treatment; this difference in taxa changes reached the Bonferroni threshold of p < 0.0007. In the TCHP and Herceptin treated groups, abundance of g_Alistipes also decreased and the changes in abundance differed from those who did not receive TCHP or Herceptin.The significance of our finding on Alistipes is unclear but this genus with at least 13 species has been found to be correlated with healthy phenotypes as well as having pathogenic roles39 in colorectal cancer,40 liver diseases,41 and gut-brain axis such as depression.42 In a study of 26 cancer patients (7 with breast cancer) who were treated with chemotherapy or a combination of chemotherapy with immunotherapy, Shannon index was higher in responders than in nonresponders, who also displayed higher abundance of Alistipes.43 Lung cancer patients who were responsive to immune checkpoint inhibitors also showed higher gut microbiome diversity as well as enrichment of Alistipes.44
We found suggestive differences in changes in taxa of select Erysipelotrichaceae genera (Catenibacterium, Eubacterium and Clostridium), abundance increased in the neoADJ but decreased in the non-neoADJ groups. In a study of breast or gynecological cancer patients, Erysipelotrichaceae abundance increased but this was mainly among women who gained weight following treatment.45 The immunogenic properties of some members of the Erysipelotrichaceae family may lead to gut inflammation and weight gain46 Our findings on changes in taxa abundance of Verrucomicrobia (g_Akkermansia), in particular, a reduction in abundance in the neoADJ group but an increase in the non-neoADJ group, and increases in the TCHP and Herceptin treated groups, adds to the literature of the potential beneficial properties of this butyrate-producing bacteria.47,48 Abundance of Akkermansia muciniphila has been reported among responder patients,49 and appeared to be associated with alpha diversity measures and fat mass among obese women with breast cancer (see below)50 further supporting its likely functional impact.
Alpha diversity measures have been associated with modifiable health measures including body composition, and low gut alpha diversity has been associated with obesity in some studies.25,51 We found few changes in taxa differences between the weight loss and weight gain groups, but one taxa, p_Firmicutes (g_Lachnobacterium) showed changes that were consistent in all three statistical analyses. Although average weight changes were modest during this first year of treatment, our finding of a significant increase in alpha diversity measures in the neoADJ group may be related in part, to weight loss in the neoADJ group (−1.48 kg) but weight gain in the ADJ (+1.01 kg) and noC (+0.33 kg) groups. Only a few previous studies examined the relationship between weight/BMI and alpha diversity among breast cancer patients. In the cross-sectional analysis of French women with mostly early stage (0/I, 71%) breast cancer, total bacteria number, Firmicutes and select taxa (F. prausnitzii, Blautia, E. Lenta) were less abundant in overweight or obese (BMI > 25 kg/m2) patients than those with normal BMI.52 In a study of all obese breast cancer patients (mean BMI of 33.3 to 36.3 kg/m2), those with high abundance levels of Akkermansia muciniphila (n = 16) (6.72%) compared to those with low abundance levels (n = 16) (0.04%) had significantly higher alpha diversity measures and lower fat mass measures.50 Our finding of a difference in the abundance of Lachnobacterium between the weight gain and weight loss groups needs confirmation as there is scant information on this genus. A Swedish cross-sectional study found that high intake of sugar and sweet beverages was significantly inversely associated with abundance of Lachnobacterium.53 However, another cross-sectional study found abundance levels of Lachnobacterium was higher in obese subjects than normal weight subjects and higher among individuals with low physical activity than those with high physical activity.54 We plan to further investigate gut microbiome changes by body composition changes (lean mass, fat mass, etc.) and chemotherapy in this group of breast cancer patients in the future.
Strengths of this pilot study include the longitudinal collection of gut microbiome data on 33 breast cancer patients at multiple (baseline, during, and at the completion) time points during the first year of treatment with either neoADJ, ADJ, or noC treatment. In addition to the detailed information on breast cancer treatment, tumor characteristics, and lifestyle information that was updated at each clinic visit, body composition was assessed using DXA at baseline and at the completion of study. Our results on gut microbiome changes were analyzed using complementary statistical methods, Wilcoxon rank sum test and NBMM analyses suitable for longitudinal microbiome data with adjustment for select covariates including changes in weight, duration of days between baseline and final fecal sample collection, and last use of antibiotics before final fecal collection. We also considered multiple comparisons and used a Bonferroni-adjusted type I error rate to evaluate p-values. Participants included whites and nonwhites, reflecting the catchment area of USC. However, we are limited by a modest sample size and the noC group was based on only 4 patients. Although we conducted results separately for the three treatment groups, our main analysis was based on comparing neoADJ to non-neoADJ groups (i.e., ADJ + noC). Because of the inherent differences in timing of treatment between neoADJ, ADJ, and noC groups, we were not able to collect fecal samples at a standardized interval and the period of enrollment and length of follow-up were not identical in the three groups (Figure 1). Nevertheless, the baseline fecal samples were collected before initiation of chemotherapy for the neoADJ and ADJ groups or radiation for the noC group and the final fecal samples were collected when there was a recovery period of at least 100 days after completion of chemotherapy or radiation. To rule out the potential confounding effects of differences in duration between baseline and final fecal sample collection, we conducted analyses to assess whether there were taxa differences by median time of sample collection (≤ 246 vs. > 246 days) and found only 1 significant p value (< 0.001) after adjusting for chemotherapy. Moreover, the results from NBMM analysis comparing neoADJ vs. non-neoADJ (ADJ +noC) groups largely remained after we adjusted for weight changes, number of days between baseline and final fecal collection, and use of antibiotics (Figure 3).
However, in this pilot study, we only monitored patients during the first year of treatment and did not collect information on additional treatment (e.g., hormone therapy) and the study was not designed and extremely underpowered to examine patient outcome in relation to baseline or changes in microbiome composition and diversity. Information on side effects (such as diarrhea and other gut toxicities) in association with chemotherapy was not assessed. While we tried to collect additional information on patient outcome by chart review, this information lacked details and may be incomplete. Body weight changes were also modest in this relatively short follow-up study. Our gut microbiome analysis was based on 16s sequencing approach using the Greengenes database that has not been updated since 2019. Given the large number and variety of bacteria included, interpretation of changes of specific phyla or genera is challenging especially when information on function is lacking. Inclusion of more advanced sequencing or databases or to conduct exome sequencing will help to address our current limited resolution which has led to lack of species identification of microbes and ability to only conduct analyze down to the genus level. Host genetics as a possible determinant of weight changes during chemotherapy treatment may also be another area for future examination. Finally, the sample size of this study was very modest and thus our results have to be considered as preliminary requiring confirmation in larger studies. The biostatistics analyses of longitudinal microbiome data are complex and this is an area of continued development. Our results based on Wilcoxon and NBMM represent one approach to analyze this small dataset and we consider the ability to adjust for covariates using NBMM an important advantage, but other analytic approaches such as Linear Discriminate Analysis (LDA) effect size (LEfSe) methods,55 ANCOM56 and other methods should be explored and compared in the future.
Nevertheless, results from this small pilot together, in combination with the published studies suggest that it is important for future investigations to consider specific study design issues to facilitate comparisons of results between studies and to allow meta-analyses or pooled analyses in the future. With the exception of a few studies,6,7 this study as most of the previous studies was small and included a heterogenous study population. It will be important to design studies with adequate sample size, and paying attention to characteristics of breast cancer patients in terms of demographic (age, menopausal status, race and ethnicity) and lifestyle factors (BMI, history of diabetes and other conditions), use of antibiotics (frequency and duration of use prior to fecal sample collection), as well as breast cancer tumor characteristics (stage, grade, molecular subtype) since these factors, individually and jointly, may influence gut microbiome diversity and composition. In addition, the timing of collection of fecal samples before and after chemotherapy needs to be specified (e.g., days or months before and after last chemotherapy or radiation or surgery) and the type of chemotherapy treatment (e.g., duration of treatment, specific agents) should be considered in the analyses.
In conclusion, this pilot longitudinal study found significant increases in gut microbiome alpha diversity measures in the neoADJ group and in the TCHP treated group, but not in the non-neoADJ group, and also found intriguing changes in select Bacteroidetes, Firmicutes, and Verrucomicrobia taxa. The dynamic nature of the gut microbiome in association with chemotherapy and weight changes highlight the need to better understand the significance of these findings and how to harness this information to identify a gut microbiome profile that would have lasting beneficial effects among women with breast cancer. Given the very modest sample size of this pilot study, we view these taxa changes as suggestive and worthy of investigation in future studies with larger sample sizes of breast cancer patients and with longer duration of follow-up.
Abbreviations
AC, Adriamycin (Doxorubicin) + Cyclophosphamide; ADJ, adjuvant; BMI, body mass index; DXA, dual-energy X-ray absorptiometry; ER/PR, estrogen/progesterone receptor; HR, hormone receptor; HER2, human epidermal growth factor receptor 2; NBMM, negative binomial mixed model; neoADJ, neoadjuvant; noC, no chemotherapy; OTU, operational taxonomic units; PERMANOVA, permutational multivariate analysis of variance; PD, phylogenetic distance; PCoA, principal coordinate analysis; rRNA, ribosomal RNA; TCHP, Docetaxel + Carboplatin+ Pertuzumab+ Trastuzumab; USC, University of Southern California.
Data Sharing Statement
Request for the data used in this analysis as well as analysis codes and other details of the data used in this manuscript can be directed to the corresponding author.
Ethics Approval and Consent to Publish
Informed consent was obtained from all individual participants included in this study. All procedures performed in studies involving human participants were in accordance with the ethical standards of the institutional and/or national research committee and with the 1964 Helsinki declaration and its later amendments or comparable ethical standards. The study protocol was approved by the USC Institutional Review Board.
Acknowledgments
We gratefully acknowledge all the women who participated in this study, Wendy Cheng for coordinating this study, Diana Chingos for serving as patient advocate, and invaluable advice from Dr. Wendy Cozen and Dr. Jacques Ravel during the early planning phase of the study. We especially acknowledge the support from Dr. Jacques Ravel and Dr. Mike Humphrys at the University of Maryland who performed the 16S rRNA gene sequencing work.
Author Contributions
All authors made a significant contribution to the work reported, whether that is in the conception, study design, execution, acquisition of data, analysis and interpretation, or in all these areas; took part in drafting, revising or critically reviewing the article; gave final approval of the version to be published; have agreed on the journal to which the article has been submitted, and agree to be accountable for all aspects of the work.”.
Funding
This study was funded by the California Breast Research Program (20IB-0105) and supported by the USC Norris Comprehensive Cancer Center Core Support grant (P30 CA14089) (Wu).
Disclosure
Dr Agustin A Garcia is a Member of Advisory Board in Biotheranostics, outside the submitted work. The authors declare that they have no other competing interests.
References
1. Ley RE. Obesity and the human microbiome. Curr Opin Gastroenterol. 2010;26(1):5–11. doi:10.1097/MOG.0b013e328333d751
2. Tilg H, Kaser A. Gut microbiome, obesity, and metabolic dysfunction. J Clin Invest. 2011;121:2126–2132. doi:10.1172/JCI58109
3. Tremaroli V, Kovatcheva-Datchary P, Backhed F. A role for the gut microbiota in energy harvesting? Gut. 2010;59:1589–1590. doi:10.1136/gut.2010.223594
4. Goedert JJ, Jones G, Hua X, et al. Investigation of the association between the fecal microbiota and breast cancer in postmenopausal women: a population-based case-control pilot study. J Natl Cancer Inst. 2015;2:107.
5. Bobin-Dubigeon C, Luu HT, Leuillet S, et al. Faecal microbiota composition varies between patients with breast cancer and healthy women: a comparative case-control study. Nutrients. 2021;13(8):2705. doi:10.3390/nu13082705
6. Byrd DA, Vogtmann E, Wu Z, et al. Associations of fecal microbial profiles with breast cancer and nonmalignant breast disease in the Ghana Breast Health Study. Int J Cancer. 2021;148:2712–2723. doi:10.1002/ijc.33473
7. Hou MF, Ou-Yang F, Li CL, et al. Comprehensive profiles and diagnostic value of menopausal-specific gut microbiota in premenopausal breast cancer. Exp Mol Med. 2021;53:1636–1646. doi:10.1038/s12276-021-00686-9
8. Aarnoutse R, Hillege LE, Ziemons J, et al. Intestinal microbiota in postmenopausal breast cancer patients and controls. Cancers. 2021;13(24):6200. doi:10.3390/cancers13246200
9. He C, Liu Y, Ye S, et al. Changes of intestinal microflora of breast cancer in premenopausal women. Eur J Clin Microbiol Infect Dis. 2021;40(3):503–513. doi:10.1007/s10096-020-04036-x
10. Zhu J, Liao M, Yao Z, et al. Breast cancer in postmenopausal women is associated with an altered gut metagenome. Microbiome. 2018;6:136. doi:10.1186/s40168-018-0515-3
11. Alexander JL, Wilson ID, Teare J, et al. Gut microbiota modulation of chemotherapy efficacy and toxicity. Nat Rev Gastroenterol Hepatol. 2017;14(6):356–365. doi:10.1038/nrgastro.2017.20
12. Miko E, Kovacs T, Sebo E, et al. Microbiome-microbial metabolome-cancer cell interactions in breast cancer-familiar, but unexplored. Cells. 2019;8:293. doi:10.3390/cells8040293
13. Sampsell K, Hao D, Reimer RA. The gut microbiota: a potential gateway to improved health outcomes in breast cancer treatment and survivorship. Int J Mol Sci. 2020;21(23):9239. doi:10.3390/ijms21239239
14. Viaud S, Saccheri F, Mignot G, et al. The intestinal microbiota modulates the anticancer immune effects of cyclophosphamide. Science. 2013;342(6161):971–976. doi:10.1126/science.1240537
15. Aarnoutse R, Ziemons J, Hillege LE, et al. Changes in intestinal microbiota in postmenopausal oestrogen receptor-positive breast cancer patients treated with (neo)adjuvant chemotherapy. NPJ Breast Cancer. 2022;8(1):89. doi:10.1038/s41523-022-00455-5
16. Terrisse S, Derosa L, Iebba V, et al. Intestinal microbiota influences clinical outcome and side effects of early breast cancer treatment. Cell Death Differ. 2021;28(9):2778–2796. doi:10.1038/s41418-021-00784-1
17. Di Modica M, Gargari G, Regondi V, et al. Gut Microbiota Condition the Therapeutic Efficacy of Trastuzumab in HER2-Positive Breast Cancer. Cancer Res. 2021;81:2195–2206. doi:10.1158/0008-5472.CAN-20-1659
18. Jonat W, Pritchard KI, Sainsbury R, et al. Trends in endocrine therapy and chemotherapy for early breast cancer: a focus on the premenopausal patient. J Cancer Res Clin Oncol. 2006;132(5):275–286. doi:10.1007/s00432-006-0082-z
19. Kogawa T, Fujii T, Fouad TM, et al. Impact of change in body mass index during neoadjuvant chemotherapy and survival among breast cancer subtypes. Breast Cancer Res Treat. 2018;171:501–511. doi:10.1007/s10549-018-4853-4
20. Schvartsman G, Gutierrez-Barrera AM, Song J, et al. Association between weight gain during adjuvant chemotherapy for early-stage breast cancer and survival outcomes. Cancer Med. 2017;6(11):2515–2522. doi:10.1002/cam4.1207
21. van den Berg MM, Winkels RM, de Kruif JT, et al. Weight change during chemotherapy in breast cancer patients: a meta-analysis. BMC Cancer. 2017;17:259. doi:10.1186/s12885-017-3242-4
22. Wu AH, Tseng C, Vigen C, et al. Gut microbiome associations with breast cancer risk factors and tumor characteristics: a pilot study. Breast Cancer Res Treat. 2020;182:451–463. doi:10.1007/s10549-020-05702-6
23. Lin D, Peters BA, Friedlander C, et al. Association of dietary fibre intake and gut microbiota in adults. Br J Nutr. 2018;120:1014–1022. doi:10.1017/S0007114518002465
24. Shively CA, Register TC, Appt SE, et al. Consumption of mediterranean versus western diet leads to distinct mammary gland microbiome populations. Cell Rep. 2018;25:47–56 e3. doi:10.1016/j.celrep.2018.08.078
25. Sze MA, Schloss PD. Looking for a Signal in the Noise: revisiting Obesity and the Microbiome. mBio. 2016;7. doi:10.1128/mBio.01018-16
26. Guan X, Ma F, Sun X, et al. Gut Microbiota Profiling in Patients With HER2-Negative Metastatic Breast Cancer Receiving Metronomic Chemotherapy of Capecitabine Compared to Those Under Conventional Dosage. Front Oncol. 2020;10:902. doi:10.3389/fonc.2020.00902
27. Montassier E, Gastinne T, Vangay P, et al. Chemotherapy-driven dysbiosis in the intestinal microbiome. Aliment Pharmacol Ther. 2015;42:515–528. doi:10.1111/apt.13302
28. Flores R, Shi J, Gail MH, et al. Assessment of the human faecal microbiota: II. Reproducibility and associations of 16S rRNA pyrosequences. Eur J Clin Invest. 2012;42(8):855–863. doi:10.1111/j.1365-2362.2012.02659.x
29. Flores R, Shi J, Gail MH, et al. Association of fecal microbial diversity and taxonomy with selected enzymatic functions. PLoS One. 2012;7:e39745. doi:10.1371/journal.pone.0039745
30. Kuczynski J, Stombaugh J, Walters WA, et al. Using QIIME to analyze 16S rRNA gene sequences from microbial communities. Curr Protoc Bioinformatics. 2011; 1. doi:10.1002/0471250953.bi1007s36
31. Wang Q, Garrity GM, Tiedje JM, et al. Naive Bayesian classifier for rapid assignment of rRNA sequences into the new bacterial taxonomy. Appl Environ Microbiol. 2007;73:5261–5267. doi:10.1128/AEM.00062-07
32. DeSantis TZ, Hugenholtz P, Larsen N, et al. Greengenes, a chimera-checked 16S rRNA gene database and workbench compatible with ARB. Appl Environ Microbiol. 2006;72:5069–5072. doi:10.1128/AEM.03006-05
33. Liu CM, Aziz M, Kachur S, et al. BactQuant: an enhanced broad-coverage bacterial quantitative real-time PCR assay. BMC Microbiol. 2012;12:56. doi:10.1186/1471-2180-12-56
34. Matsen FA, Kodner RB, Armbrust EV. pplacer: linear time maximum-likelihood and Bayesian phylogenetic placement of sequences onto a fixed reference tree. BMC Bioinform. 2010;11:538. doi:10.1186/1471-2105-11-538
35. Zhang X, Pei YF, Zhang L, et al. Negative binomial mixed models for analyzing longitudinal microbiome data. Front Microbiol. 2018;9:1683. doi:10.3389/fmicb.2018.01683
36. Anderson MJ, Willis TJ. Canonical analysis of principal coordinates: a useful method of constrained ordination for ecology. Ecology. 2003;84(2):511–525. doi:10.1890/0012-9658(2003)084[0511:CAOPCA]2.0.CO;2
37. Lozupone C, Knight R. UniFrac: a new phylogenetic method for comparing microbial communities. Appl Environ Microbiol. 2005;71(12):8228–8235. doi:10.1128/AEM.71.12.8228-8235.2005
38. Benjamini YHY. Controlling the false discovery rate: a practical and powerful approach to multiple testing. J R Stat Soc. 1995;B:289–300.
39. Parker BJ, Wearsch PA, Veloo ACM, et al. The genus alistipes: gut bacteria with emerging implications to inflammation, cancer, and mental health. Front Immunol. 2020;11:906. doi:10.3389/fimmu.2020.00906
40. Moschen AR, Gerner RR, Wang J, et al. Lipocalin 2 Protects from Inflammation and Tumorigenesis Associated with Gut Microbiota Alterations. Cell Host Microbe. 2016;19:455–469. doi:10.1016/j.chom.2016.03.007
41. Scorletti E, Afolabi PR, Miles EA, et al. Synbiotics Alter Fecal Microbiomes, But Not Liver Fat or Fibrosis, in a Randomized Trial of Patients With Nonalcoholic Fatty Liver Disease. Gastroenterology. 2020;158:1597–1610 e7. doi:10.1053/j.gastro.2020.01.031
42. Knuesel T, Mohajeri MH. The role of the gut microbiota in the development and progression of major depressive and bipolar disorder. Nutrients. 2021;14. doi:10.3390/nu14010037
43. Heshiki Y, Vazquez-Uribe R, Li J, et al. Predictable modulation of cancer treatment outcomes by the gut microbiota. Microbiome. 2020;8:28. doi:10.1186/s40168-020-00811-2
44. Jin Y, Dong H, Xia L, et al. The Diversity of Gut Microbiome is Associated With Favorable Responses to Anti-Programmed Death 1 Immunotherapy in Chinese Patients With NSCLC. J Thorac Oncol. 2019;14:1378–1389. doi:10.1016/j.jtho.2019.04.007
45. Uzan-Yulzari A, Morr M, Tareef-Nabwani H, et al. The intestinal microbiome, weight, and metabolic changes in women treated by adjuvant chemotherapy for breast and gynecological malignancies. BMC Med. 2020;18:281. doi:10.1186/s12916-020-01751-2
46. Kaakoush NO. Insights into the Role of Erysipelotrichaceae in the Human Host. Front Cell Infect Microbiol. 2015;5:84. doi:10.3389/fcimb.2015.00084
47. Dao MC, Everard A, Aron-Wisnewsky J, et al. Akkermansia muciniphila and improved metabolic health during a dietary intervention in obesity: relationship with gut microbiome richness and ecology. Gut. 2016;65:426–436. doi:10.1136/gutjnl-2014-308778
48. Hills RD, Pontefract BA, Mishcon HR, et al. Gut microbiome: profound implications for diet and disease. Nutrients. 2019;11(7):1613. doi:10.3390/nu11071613
49. Routy B, Le Chatelier E, Derosa L, et al. Gut microbiome influences efficacy of PD-1-based immunotherapy against epithelial tumors. Science. 2018;359:91–97. doi:10.1126/science.aan3706
50. Fruge AD, Van der Pol W, Rogers LQ, et al. Fecal Akkermansia muciniphila Is Associated with Body Composition and Microbiota Diversity in Overweight and Obese Women with Breast Cancer Participating in a Presurgical Weight Loss Trial. J Acad Nutr Diet. 2020;120(4):650–659. doi:10.1016/j.jand.2018.08.164
51. Peters BA, Shapiro JA, Church TR, et al. A taxonomic signature of obesity in a large study of American adults. Sci Rep. 2018;8:9749. doi:10.1038/s41598-018-28126-1
52. Luu TH, Michel C, Bard JM, et al. Intestinal Proportion of Blautia sp. is Associated with Clinical Stage and Histoprognostic Grade in Patients with Early-Stage Breast Cancer. Nutr Cancer. 2017;69:267–275. doi:10.1080/01635581.2017.1263750
53. Ramne S, Brunkwall L, Ericson U, et al. Gut microbiota composition in relation to intake of added sugar, sugar-sweetened beverages and artificially sweetened beverages in the Malmo Offspring Study. Eur J Nutr. 2021;60:2087–2097. doi:10.1007/s00394-020-02392-0
54. Galle F, Valeriani F, Cattaruzza MS, et al. Mediterranean Diet, Physical Activity and Gut Microbiome Composition: a Cross-Sectional Study among Healthy Young Italian Adults. Nutrients. 2020;12(7):2164. doi:10.3390/nu12072164
55. Segata N, Izard J, Waldron L, et al. Metagenomic biomarker discovery and explanation. Genome Biol. 2011;12:R60. doi:10.1186/gb-2011-12-6-r60
56. Lin H, Peddada SD. Analysis of compositions of microbiomes with bias correction. Nat Commun. 2020;11:3514. doi:10.1038/s41467-020-17041-7
 © 2022 The Author(s). This work is published and licensed by Dove Medical Press Limited. The full terms of this license are available at https://www.dovepress.com/terms.php and incorporate the Creative Commons Attribution - Non Commercial (unported, v3.0) License.
By accessing the work you hereby accept the Terms. Non-commercial uses of the work are permitted without any further permission from Dove Medical Press Limited, provided the work is properly attributed. For permission for commercial use of this work, please see paragraphs 4.2 and 5 of our Terms.
© 2022 The Author(s). This work is published and licensed by Dove Medical Press Limited. The full terms of this license are available at https://www.dovepress.com/terms.php and incorporate the Creative Commons Attribution - Non Commercial (unported, v3.0) License.
By accessing the work you hereby accept the Terms. Non-commercial uses of the work are permitted without any further permission from Dove Medical Press Limited, provided the work is properly attributed. For permission for commercial use of this work, please see paragraphs 4.2 and 5 of our Terms.