")
Back to Journals » Integrated Pharmacy Research and Practice » Volume 9
Effect of Auditable Pharmaceutical Services and Transaction System on Pharmaceutical Service Outcomes in Public Hospitals of SNNPR, Ethiopia
Authors Beyene D, Abuye H , Tilahun G
Received 18 August 2020
Accepted for publication 30 September 2020
Published 13 October 2020 Volume 2020:9 Pages 185—194
DOI https://doi.org/10.2147/IPRP.S277080
Checked for plagiarism Yes
Review by Single anonymous peer review
Peer reviewer comments 3
Editor who approved publication: Professor Jonathan Ling
Deginet Beyene,1 Habtamu Abuye,2 Gizachew Tilahun3
1Pharmaceutical Supply Chain Management, Pharmacy Department Unit, Doctor Bogalech Gebre Memorial General Hospital, Durame, Ethiopia; 2Department of Pharmacy, College of Medicine and Health Sciences, Wachemo University, Hossana, Ethiopia; 3Pharmacoepidemiology and Social Pharmacy Department, School of Pharmacy, Institute of Health Sciences, Jimma University, Jimma, Ethiopia
Correspondence: Habtamu Abuye
Wachemo University, P.O. Box: 667, Tel +521 913571974
Fax +251-46-555-19-30
Email [email protected]
Background: Auditable pharmaceuticals service and transaction system (APTS) is unique in its systems strengthening approach. It is a data-driven package of interventions designed to establish accountable, transparent, and responsible pharmacy practice. The objective of this study was to assess the outcome performance of pharmaceuticals services among selected hospitals with and without the APTS system in SNNPR, Ethiopia.
Methods: A cross-sectional comparative facility-based study was conducted at public hospitals by using an intervention and control approach to estimate the significance of the difference between average performances of APTS and non-APTS hospitals. A case-to-control ratio was applied to decide the number of sites and a simple random lottery sampling technique was employed to select control sites. The sample size formula was used to determine the proposed population for patient care indicator assessment. Epidata version 3.1 and SPSS version 23 were used for analysis. The study was conducted from March 1 to 30, 2019.
Results: APTS implemented hospitals attained 92.3% patient satisfaction on the overall pharmacy services compared to 47.5% for non-APTS hospitals. They have improved essential drugs (EDs) availability, minimum stock-outs, and reduced wastage rates, unlike control groups. They undertook workload analysis to assess human power sufficiency; generate reliable information from accurate recording culture for decision making; practiced transparency and accountability through conducting physical inventory and daily sales tracking/management system; and made budget utilization rationale applying ABC analysis, VEN analysis, ABC/VEN reconciliation, and stock status analysis (SSA) that non-APTS hospitals did less/not.
Conclusion: In general, higher performances were observed in APTS implemented hospitals than non-APTS hospitals regarding patient knowledge, satisfaction, and medicine availability at stores. In all cases, it needs improvement to achieve target values.
Keywords: APTS, transparency, accountability, satisfaction, availability, stock out duration, wastage rate
Background
Health is a fundamental human right.1 Access to health care, which includes access to essential drugs (EDs), is a prior condition for realizing that right. Availability, accessibility, acceptability, affordability, and quality of EDs help to measure the readiness of health facilities to provide healthcare services.2,3 Availability of pharmaceuticals is a major determinant of where patients go for health care and how satisfied they are with that care.4 Besides, irregular availability can be a greater constraint on health facilities’ effectiveness. It is run and administered under pharmaceutical services units/departments.
Pharmaceutical expenditures account for 25%-67% of total health expenditure in low and middle-income countries.5 In Ethiopia, pharmaceutical services remained inadequate although it accounts for ≥ 70% of the country’s health care expenses.6 Poor governance and lack of auditing practices, transparency, and accountability in the pharmaceutical system reduces access to EDs; increase drug prices, raise health expenditure, and damage limited health system resources.7 They contributed the main share for more than 50% inappropriately prescribed, dispensed, or sold medicines worldwide.8
The health facility pharmaceutical operations should be carried out in a way that enhances the performance of healthcare workers and patient convenience and satisfaction. Its service quality should also be measured in terms of medicine wastage due to expiry and damage.6,9 Since, the eventual success of health facility pharmaceutical service is achieving overall desired health outcomes of the patient through expanded and inclusive health coverage in a way that convenient and simple pharmaceutical services can be delivered to maintain patient satisfaction.10 To bring this to the sector, Ethiopia introduced a new initiative called auditable pharmaceutical transaction and system-APTS.
The standard pharmacy services at health facilities in the country are not supported by systems and tools that ensure transparency and accountability.11 They unable to generate adequate, reliable, and consistent information which is quite crucial for effective auditing of the whole system.12 Therefore, lack of accountability and transparency, limited access to information, low stakeholder engagement and participation, poor standards of practice— premises and workflow/unpleasant working environment, repeated drug stock-outs and unavailability, damage/wastage/expiry/pilferage and inadequate skill and mix of the workforce were the main challenges that hindered the sector from achieving its goal as a safe, rational and cost-effective use of drugs by maximizing health gain and minimizing the risk of the patient.12–15
APTS is a data-driven package of interventions designed to track information on a pharmaceutical transaction that makes transactions transparent, measurable, and accountable.10 It enables efficient budget utilization by making transparent and accountable transactions and generating reliable information. It also renovates effective workforce development and deployment by introducing new working set-up and art that enhances customer and professional satisfaction.15
The objective of the current study was to assess the effect of APTS on its packages like patient knowledge of correct dosage schedule, satisfaction, key medicine availability/stock-out duration which is specified as indicators of improved customer satisfaction and wastage rate against non-APTS implemented facilities. It also showed the effects of transparency and accountability, effective workforce, generation of information, and efficient budget utilization indicators on overall pharmacy service performance.
Methods
Study Area and Period
The study was done in hospitals from various zones of south nations, nationalities, and peoples region (SNNPR). This region accounts for ≥10% of the country’s land area and an estimated population of 20,768,000 (2018). The estimated urban inhabitants comprise ≤ 10.02% of its population in 2007. It is Ethiopia’s most rural region.16 The region is divided into 13 administrative zones, 133 Woredas and 3512 Kebeles, and its capital is Hawassa.17 From the total of 54 functional hospitals and 710 health centers in the region, 23 of the hospitals have implemented APTS. This study was conducted at public hospitals in SNNPR from March 1 to 30, 2019.
Study Design
The quantitative research method was used through a facility-based cross-sectional comparative technique. The study was undertaken at public hospitals by using an intervention and control approach to estimate the significance of the difference between average performances of APTS implemented and APTS unimplemented hospitals.
Sample Size and Sampling Techniques
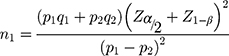
When this research was proposed, there were 23 APTS implemented and 31 APTS unimplemented hospitals in the study region. Applying a case-to-control ratio of 1:2 for the APTS and non-APTS hospitals respectively, 15 hospitals were included (see Table 1). All APTS hospitals framed were from the locations in which we can get controls to facilitate comparison. Non-APTS hospitals were selected from the list by a simple random sampling technique using the “lottery” method in the study sites. Twenty-six EDs were selected from each hospital as per the WHO standard—as health facility indicator (for assessing medicine availability and stock-out duration).18 Their selection was based on ten top disease lists obtained from the regional health bureau using a national list of tracers for essential drugs (Table 2).19 For patient satisfaction and/or knowledge of correct dose, the sample size was calculated by putting previous findings: Adinew A et al work revealed overall satisfaction on pharmacy service was 74.5% (percent of controls with an outcome),12 and Melissa et al study showed 90% (percent of study groups with an outcome)20 that in the statistical formula21 as:
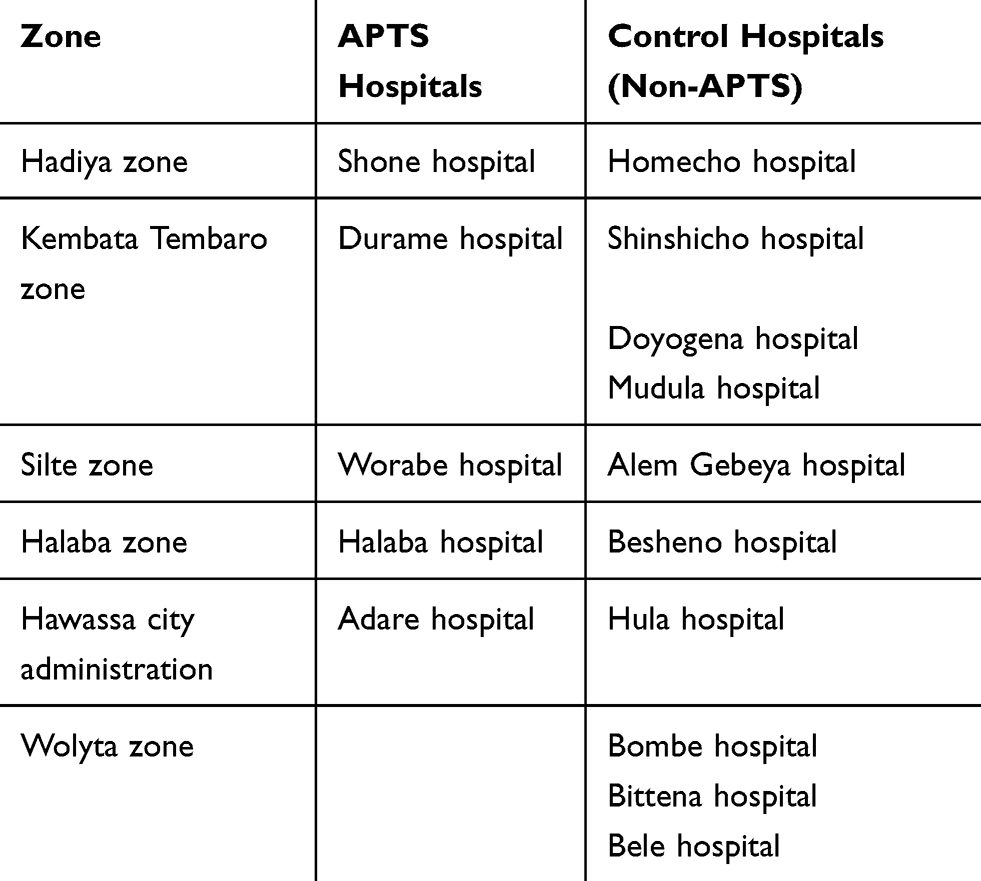 |
Table 1 List of Hospitals Selected to Assess the Effect of Auditable Pharmaceutical Service and Transaction System |
Where, p1=90%; and p2= 74.5%; are the proportion of patients satisfied with services given at outpatient pharmacy of APTS and non APTS hospitals respectively. q1=1-p1= 0.10; q2 =1-p2 = 0.255; are proportion of patients not satisfied with services given at outpatient pharmacy of APTS non APTS hospitals respectively. Zα/2 = 1.96, and Z1-β = 1.64; are values of the standard normal distribution corresponding to a significance level of α (a 2-sided test at 0.05 level) and the desired level of power (a power of 95%) respectively. The sample size was 141. The sample size for control, n2 = rn1, was 282, where, r is the ratio of control to study=2. Therefore, the total sample size before adjustment was 423. Then adjusted for the non-respondent effect, the final sample size taken was 465. To select respondents, the average daily number of patients served at OPD pharmacy was calculated by taking one-month data. The result was divided into six (number of respondents expected to be interviewed per day) to get an interval. Beginning at the first served patient, the calculated interval was added on to it to get the next respondents and the process continued until daily and site quota obtained. Wastage rate was assessed from documents of physical inventory, financial reports, and stock status analysis (SSA) in the year.
Data Collection Instruments
WHO drug use indicator assessment tool was contextualized to collect from patients for assessing patients’ satisfaction and their knowledge regarding prescribed drugs.18 Drug availability was assessed by adapting the format used during baseline assessment of APTS (Additional File).12
Data Collection Procedure
After being approached politely, patients were told the purpose of the interview and asked for willingness without any pressure; then, patient satisfaction was measured using a structured questioner on the specified variables based on Likert scale measurement in which values from 1–5 were used to indicate satisfaction level (Additional File). Patient knowledge was assessed by using the structured questionnaire on a name, correct dosage, frequency, and duration of medicines prescribed to them.
Data on availability and stock out duration was obtained by asking store managers and pharmacists in dispensing outlets and then, observing the medicine and record on the bin card. Wastage rate was reviewed from physical inventory, stock status analysis, and financial reports available at the pharmacy head section or the finance of the hospital. Health care workers (HCWs) play a crucial role in the attainment of health sectors goal. It is impossible to consider health without having a good plan for HCWs development.22 Availability of workload analysis documents was observed in all hospitals and the number of patients served per pharmacist was determined. To calculate it the total number of patients served was divided by the number of pharmacists.
Data Quality Assurance
Data collectors were trained properly. Data collecting toolset for patient satisfaction, knowledge of prescribed drugs was pre-tested.
Data Analysis
Epi-data (Version 3.1) was employed to enter quantitative data and then transferred to SPSS (Version 22). Descriptive statistics were computed. Independent sample t-test was applied to variables such as recording accuracy (information), labelling completeness, patient knowledge of prescribed medicine, and EDs availability to test differences, and P < 0.05 was a limit for significance. Mann Whitney U-test was employed to test patient satisfaction levels. Measurements for each variable were done using their equations (Additional File).
Ethical Considerations
Jimma University ethical review board after reviewing the research protocol if complied with the Declaration of Helsinki, provided ethical clearance to commence this study. The board wrote a letter of support to the researchers to be presented to the SNNPR health bureau to obtain permission to conduct the research work (ref.no. FMPGC/01/2019). The regional health bureau again provided a letter of support that was submitted to zonal health departments (ZHD) and hospitals (ref.no. pm/37/86/30491). Patients provided informed verbal consent that was approved by the ethical review board of Jimma University to be interviewed. Confidentiality was ensured by assigning unique code for every subject and site.
Results
Fifteen hospitals were included, and in each hospital outcomes of pharmaceutical services such as patient knowledge of correct dosage, patient satisfaction, medicine availability, stock out duration, and wastage rate were compared among APTS and non APTS sites (Table 1). The response rate for patient satisfaction and knowledge was found to be 99.4%.
Availability of Services
This study revealed that 100% of the APTS hospitals assessed deliver pharmacy services through outpatient, inpatient, and emergency pharmacy compared to 90% of non-APTS hospitals; one hospital did not have a separate inpatient pharmacy room.
Human Resource Adequacy
All studied APTS implemented hospitals conducted workload analysis of pharmacy staff but none of the control hospitals. In APTS implemented hospitals, 55.2 patients per day were served by a single outpatient pharmacy working professional. However, the standard as per the guidelines is 48 patients per day per pharmacist.15 It was impossible to compare the results since there was no enough information on workload analysis at non-APTS hospitals.
Information for Decision-Making
All studied primary hospitals utilized bin cards for the selected 26 EDs. They were assessed for recording accuracy by comparing the actual physical count of EDs and the record on the bin card during the day of the visit (Table 2). On average, 87.7% and 80% of APTS and control sites had accurate records respectively. Out of 26 items assessed, 38.5% of EDs were accurately recorded in all APTS hospitals compared to 15.38% in non APTS. However, their difference is statistically insignificant (P=0.541>0.05).
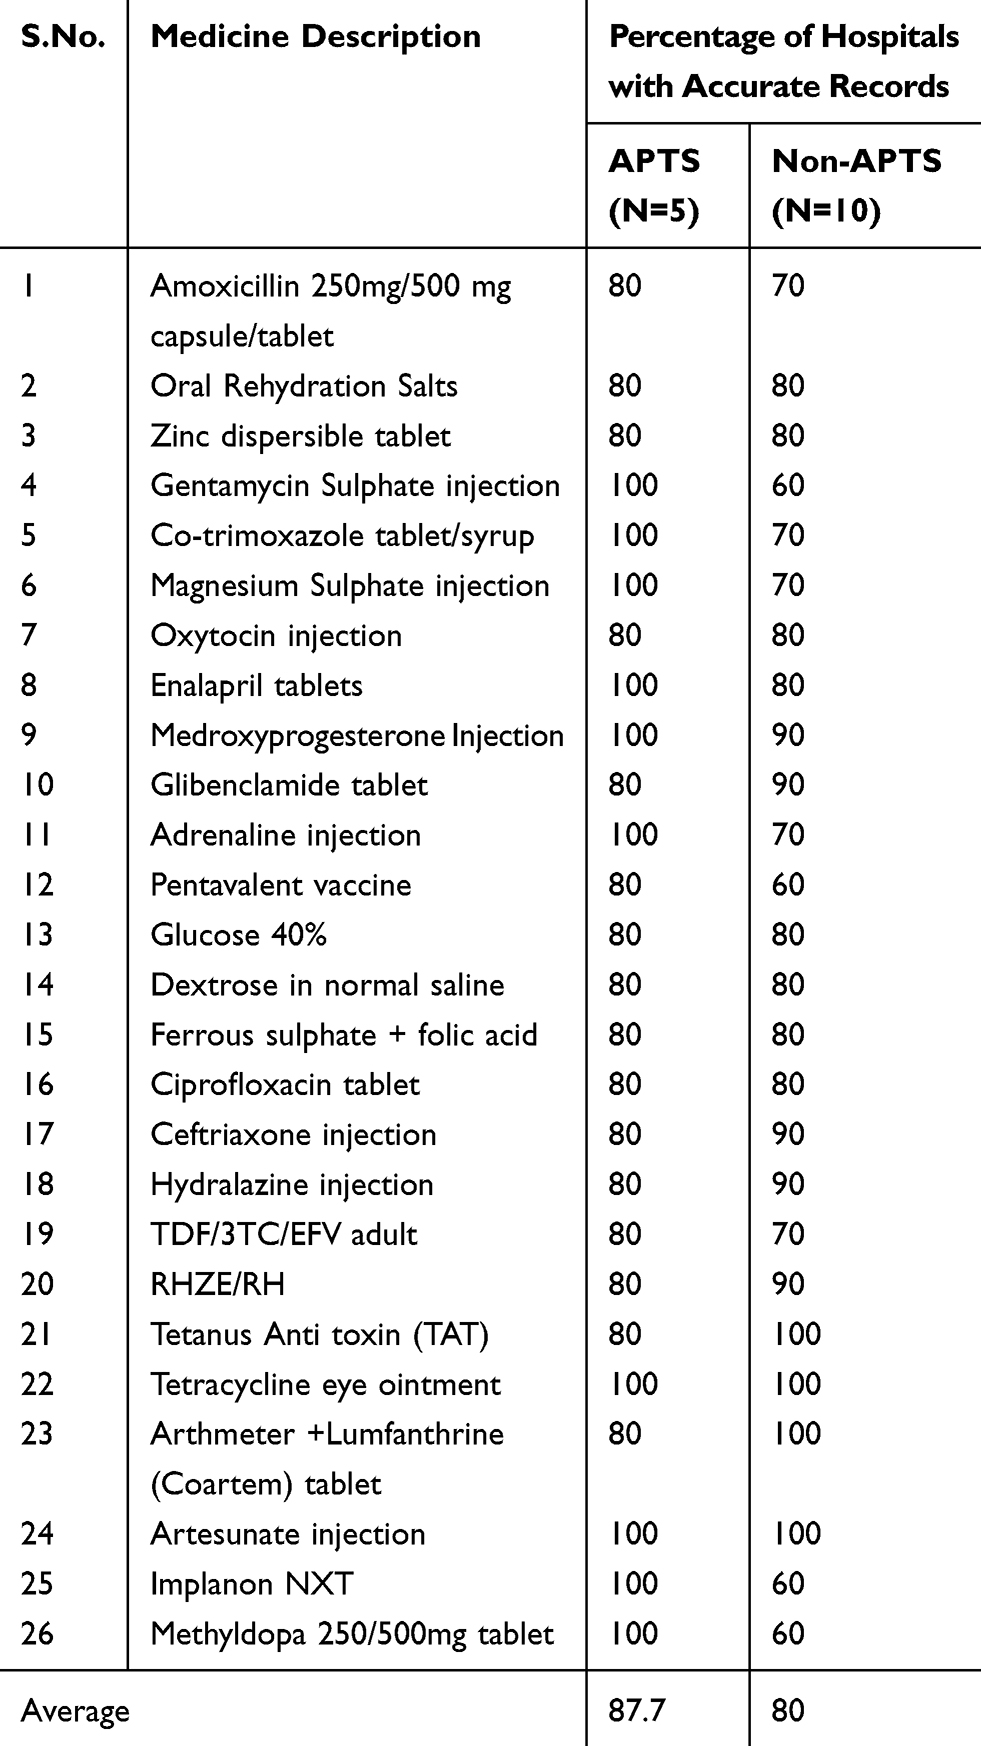 |
Table 2 Percentage of Hospitals with Accurate Records by Product and Facility Type |
Transparency and Accountability
All studied hospitals conducted physical inventory at the store; all APTS and 10% of non-APTS hospitals were able to conduct a transaction audit at the end of 2018. APTS hospitals had a daily sales tracking/management system but, none of the control hospitals.
Efficient Budget Utilization
Availability of documents like ABC (A-item, B-item, and C-item), VEN (V–very essential, E-essential and N-less essential drug) analysis, ABC/VEN reconciliation, SSA, and reports of wastage were observed for a period of six months to three years. In this regard, 60% of APTS and none of non APTS hospitals were conducted ABC, VEN, ABC/VEN reconciliation, and SSA in the year. Eighty-percent of APTS and 10% of control hospitals reported wastage of medicine in 2018/2019.
Dispensing Practice
Labelling Completeness
Labelling completeness at APTS sites (63.6%) was twice that of non APTS (31.8%). It was 96.6%, and 47.4% for medicine name; 46.8% and 90.6% for storage; and 2.9%, and 2.0% for precaution at APTS and non APTS hospitals respectively (Figure 1). Labelling completeness was significantly different between APTS and non APTS sites (P<0.05).
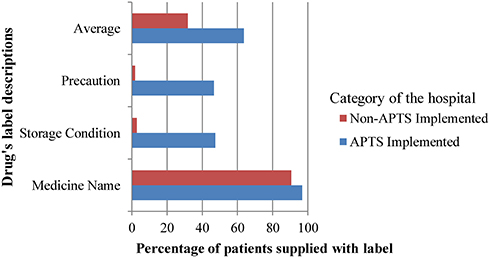 |
Figure 1 Labelling completeness of prescribed medicines at APTS and non-APTS hospitals. Assuming completely labelled medicine prescription contains the correct medicine name with its right dose, appropriate storage condition and precaution to be taken (at P values =0.017, 0.000 and 0.000 for medicine name, storage conditions, and precautions respectively). |
Patient Knowledge of Prescribed Medicine
As soon as the patients leave outpatient dispensaries receiving their drugs, they were immediately interviewed to determine their knowledge of dispensed drugs. On average, the percentages of patients who knew five basics WHO drug use indicators were 95.8% versus 91.6% at APTS and non APTS sites (see Table 3). The difference for knowledge of medication name and duration of treatment (P<0.05) was statistically significant between APTS and non APTS hospitals and the difference is not significant for other parameters.
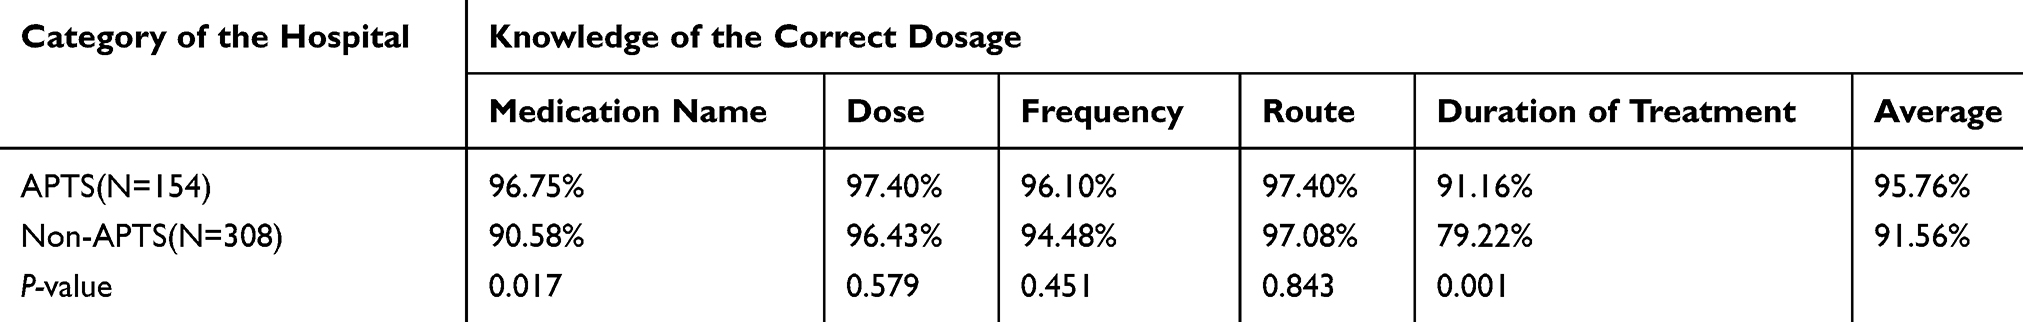 |
Table 3 Patient Knowledge of Correct Dosage of Prescribed Medicine at APTS and Non-APTS Hospitals |
Patient Satisfaction in Outpatient Pharmacy Services
Thirty-one patients were identified from each study hospital for assessing their satisfaction to the pharmaceutical services quality they have received. A Likert five-point scale was employed to interview the patients. Satisfaction was considered when the patients answered agree or strongly agree to the Likert scale and the respective scores given were 4 and 5; whereas those who did not satisfy answered neutral, disagree, and strongly disagree and scored as 3, 2, and 1. Patient satisfaction assessment parameters were listed in Table 4. Considering all parameters, on average, 92.3% and 47.5% of patients were satisfied at services provided by outpatient pharmacies of APTS and control hospitals respectively.
 |
Table 4 The Proportion of Patient Satisfaction at APTS and Non-APTS Hospitals |
Essential Drugs Availability
Medicine Availability
As shown in Table 5, availability was found to be 83.1% and 72.0% in stores of APTS and non APTS hospitals and it was 86.2% and 79.2% at outpatient pharmacies of APTS and non APTS sites at the day of visit respectively. Out of 26 medications assessed at the day of the visit, 12 (46.2%) and 15 (57.7%) of key medicines were present at stores and dispensaries of all APTS sites; while 8 (30.8%) and 9 (34.6%) of the key medicines were found at stores and dispensaries of all non APTS sites respectively. The mean stock-out duration in the review period was 41.4 days for APTS and 54.3 days for non-APTS hospitals. There was no statistically significant difference in the mean stock-out duration of EDs between APTS implemented and APTS unimplemented hospitals (P = 0.268 ≥0.05 = α).
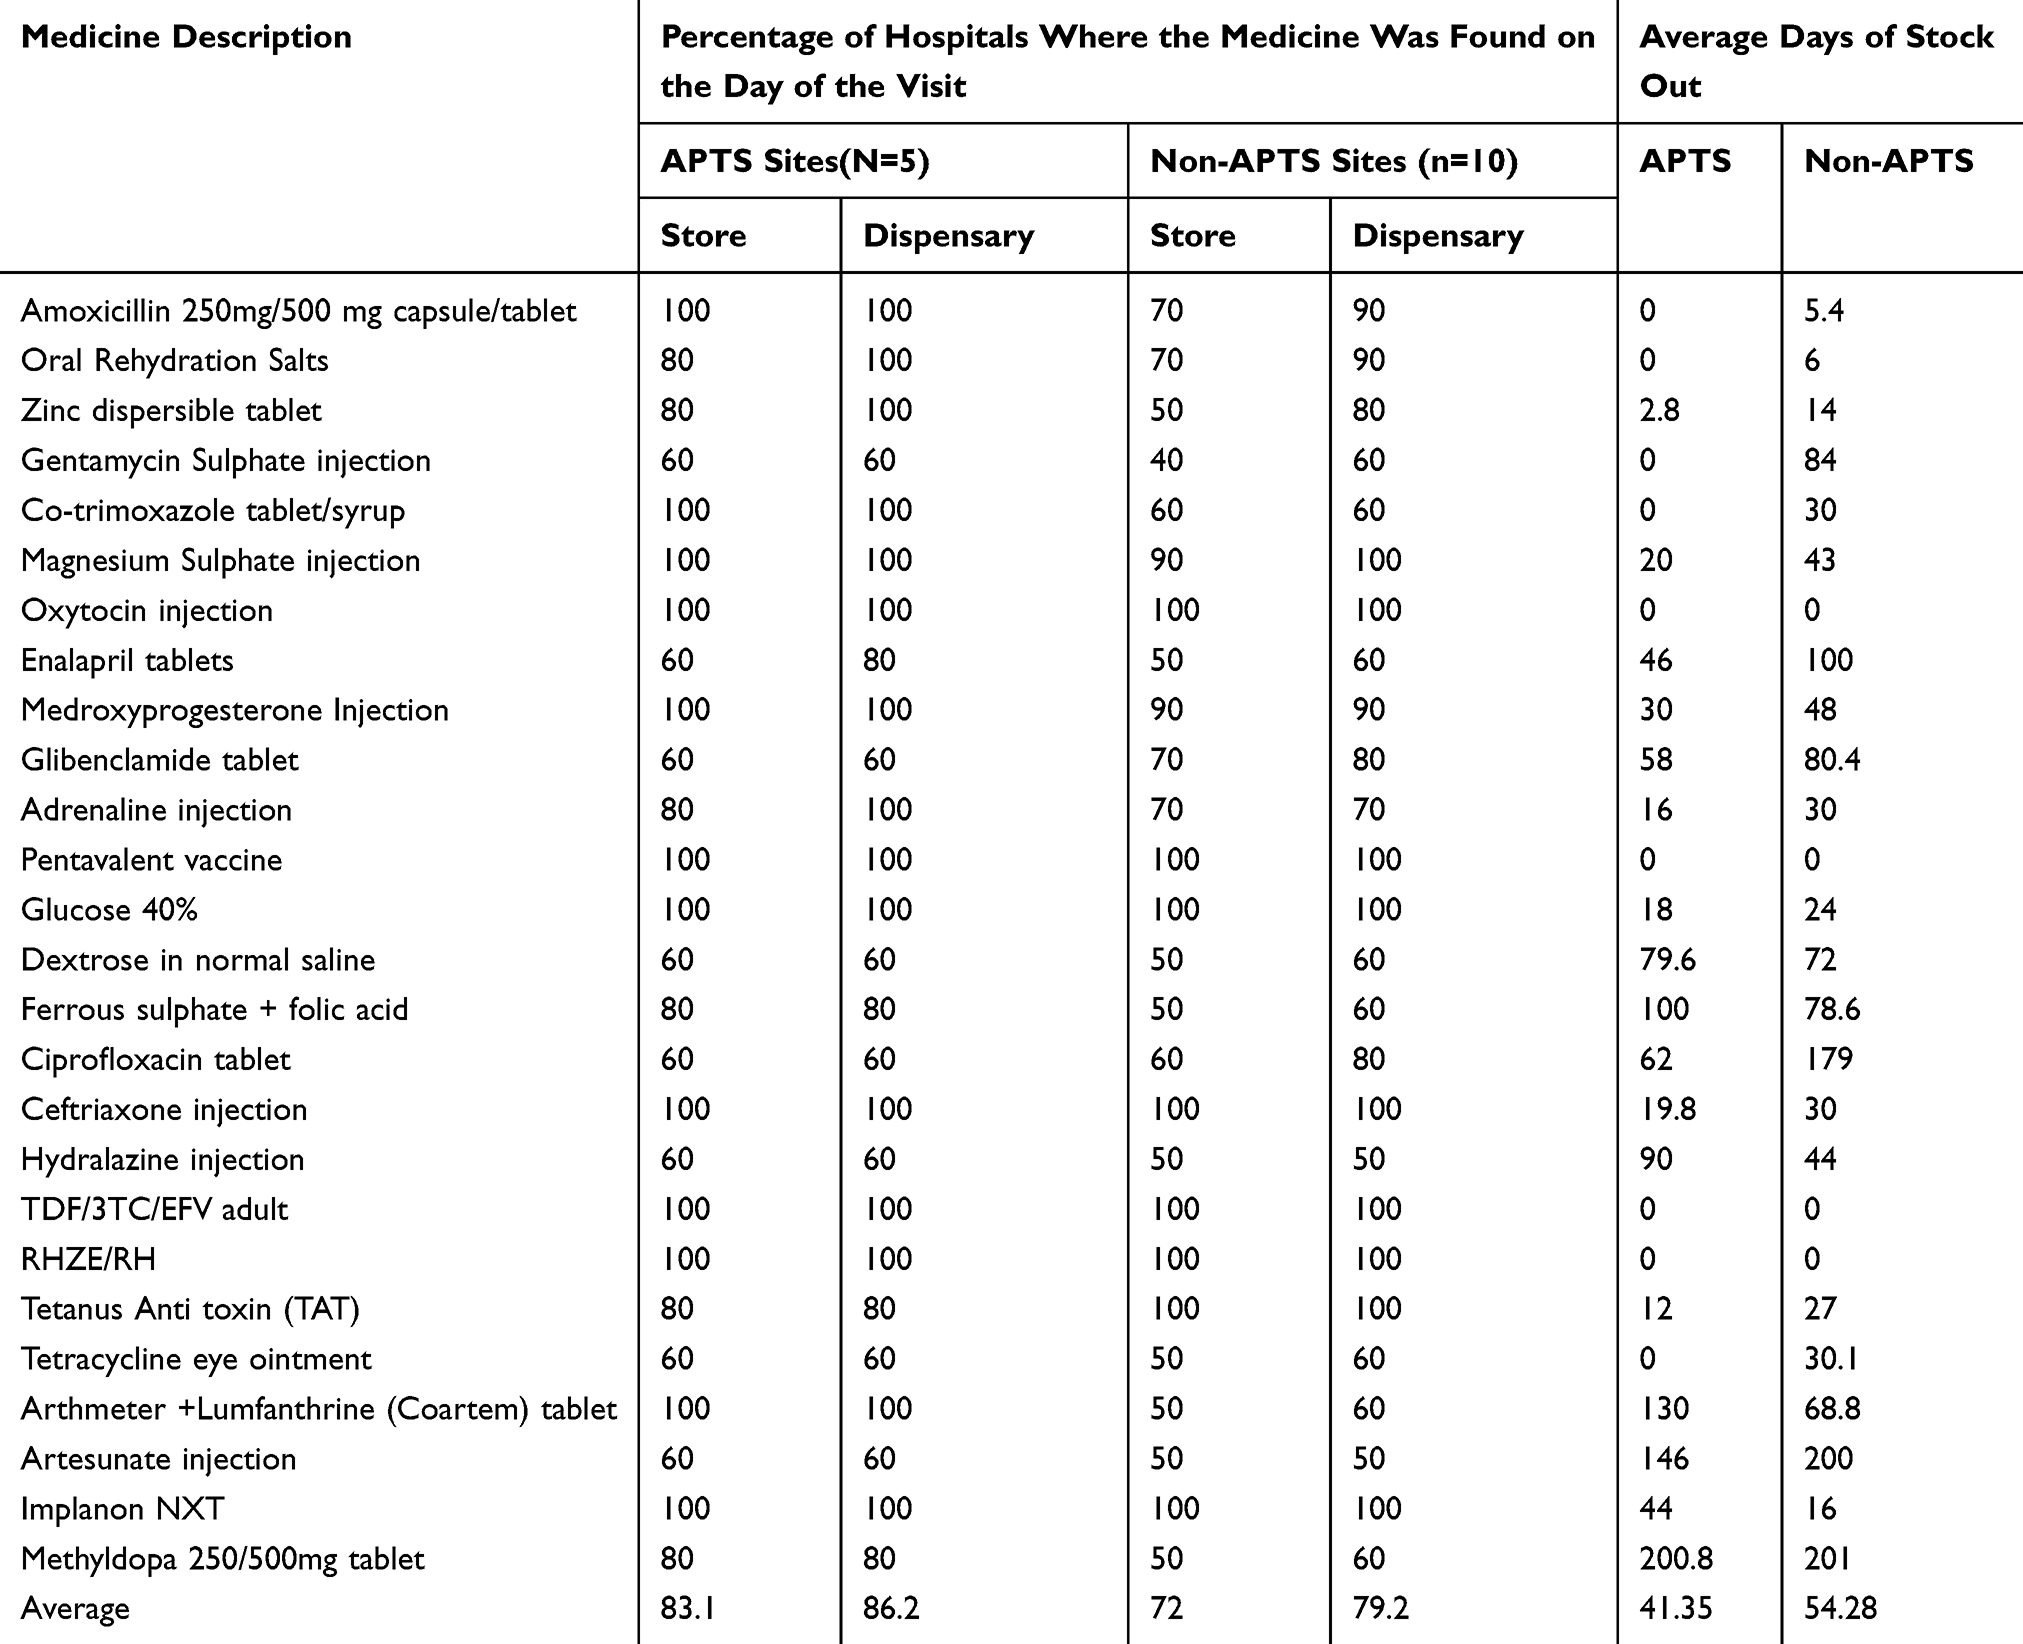 |
Table 5 The Percentage Availability and Stock Out the Duration of Key Medicines at APTS and Non-APTS Public Hospitals |
Mean Number of Available EDs
Mean availability of key medicines: on average, 21.6 and 18.7 at stores; and 22.4 and 20.6 were present at dispensaries out of 26 medicines assessed at APTS and non APTS sites respectively (Table 6). A significant statistical difference was observed in the mean number of EDs available at stores of APTS implemented and APTS unimplemented hospitals (P = 0.007 ≤0.05). However, the difference in the availability of key medicines at dispensaries is statistically insignificant (P value=0.218≥0.05=α).
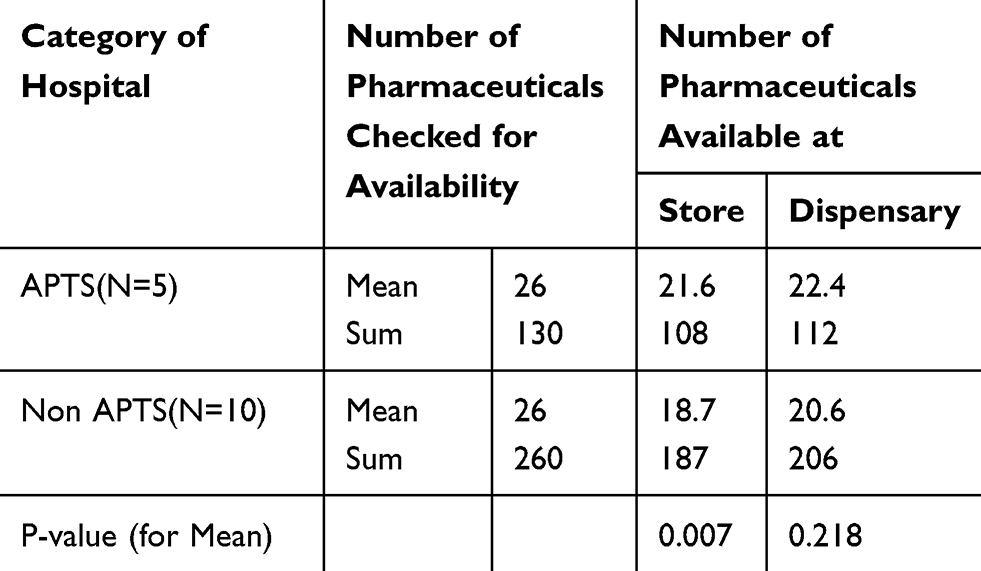 |
Table 6 The Mean Availability of Key Medicines at APTS and Non APTS Public Hospitals |
Pharmaceutical Wastage Rate
The pharmaceutical wastage rate was reviewed from available documents of annual physical inventory and financial reports of the hospital at the end of the year. The amount of money consumed by pharmaceuticals at the year (unusable stock + stock on hand) was reviewed from financial documents and the total unusable amount was obtained from physical inventory reports and the percentage of medicines wasted was calculated by using the standard formula. The average wastage rate was found to be 2.2% (SD ± 2.6) in APTS hospitals and 3% in one non APTS hospital in which the report was available. Statistical comparison was not possible due to the limited number of controls.
Discussion
This research evaluated the effect of APTS implementation on pharmaceutical service outcomes of the APTS hospitals by comparing with the old system to know the difference in the mean calculated values. The main service outcomes addressed in this research are patient knowledge of correct dosage, patient satisfaction, key medicine availability, and pharmaceutical wastage rate. The outcomes are mainly dependent on information for decision making, transparency and accountability, efficient budget utilization, human resource deployment and development, personnel service (skill), assistance to the patient, dispensing process (effect on waiting time), labelling completeness, amount of medicines dispensed, and dispensing area.
Patient Knowledge of Dispensed Medicines
Patient knowledge on correct dosage was measured by using WHO drug use indicators (name, dose, frequency, route, and duration) and it was found to be 95.8% at APTS implemented hospitals and 91.6% at APTS unimplemented hospitals. The results for both sites were found to be higher than an assessment report on outcomes of APTS at Addis Ababa which was 85.4% and 84.7% at APTS and non-APTS sites respectively,23 higher than an assessment of the Pharmaceutical Sector in Ethiopia 67%,6 Health Sector Transformation Plan (HSDP) baseline 68%,15 and by far higher than the result from APTS baseline assessment 50%.12 The higher patient knowledge at APTS sites might be due to better dispensing practices such as adequacy of labelling even though it was less than the national target (100%) at both sites.15
Patient Satisfaction
Patient satisfaction was measured using Likert scale questions to determine the level of patients feeling and opinion to factors like dispensing area, dispensing process, personnel skills, the privacy of the setting, the assistance offered, overall patient satisfaction, and availability of medicines.12 On average, 92.3% and 47.5% of patients were satisfied at services provided by outpatient pharmacies of APTS and control hospitals respectively. This finding was found to be inconsistent with studies conducted in Nigeria 56.0%,24 HSDP baseline 50%,15 APTS baseline assessment in Ethiopia 74%,12 eastern Ethiopia 68%,25 Hiwot-Fana specialized hospitals 44.6%,14 Mizan-Tepi University Teaching Hospital 52.6%.26 Despite this fact, it was found to be lower than the ideal value set by HSDP 100%.15
In general, patients were highly satisfied on the overall services provided to them by pharmacies found in APTS implemented hospitals (mean ± SD = 4.20 ± 0.888) than their encounter APTS unimplemented hospitals (mean ± SD = 3.22 ± 1.006). The difference was statistically significant (P <0.05). This figure was found to be consistent with the result of a study conducted by the Federal Ministry of Health (FMOH) at Addis Ababa.23 The higher satisfaction at APTS sites might be due to better accessibility of services (convenience), a higher proportion of skilled manpower, medicine availability, and the design of dispensing rooms.
Key Medicine Availability
Twenty-six EDs were assessed for measuring their availability both at stores and outpatient pharmacy dispensaries on the data collection date. APTS implemented hospitals found to have higher availability EDs 83.1% in stores than non-APTS implemented hospital, 71.9%. Similarly, the proportion was higher in dispensing outlets of APTS sites than non APTS sites (86.16% vs 79.2%). The findings had higher figures than the study’s findings in LMICs 51.8%,27 public health facilities of Ethiopia 70%,6 baseline data for HSDP 65%,15 baseline assessment for APTS,12 Boru Meda Hospital Pharmacy 54%,28 but lower than HSDP target (100%).15 On the other hand, the result was consistent concerning the way that both cases showed higher proportions to Gebregeorgise, D. T et al findings.23
Stockout Duration
EDs which were used to treat commonly prevalent diseases of the study area was assessed through bin-card reviewing for their availability. The reviewing was taken place for six months and converted to one year by using the standard formula. The mean stock-out duration for the review period was 41.4 and 54.3 days for APTS and non APTS sites respectively. The stock-out duration at both sites was lower than the study result shown in Rwanda 10.5 months,29 the national level 92.2 days,6 and the study on outcomes of APTS of 43.3 days for APTS and 61.1 days for non-APTS implementing hospitals.23 In both cases it opposes the HSDP target (0 stock-out days).15 This shows that there is a need for better application of systems like ABC/VEN reconciliation and minimizing expiry through SSA; better information management; and enhancing transparency and accountability in duties.
Wastage Rate of Pharmaceuticals
The average wastage rate of pharmaceuticals was assessed by taking the monetary value of pharmaceuticals expired within a year and dividing it by consumed annual budget. The data was available at four APTS hospitals and only one control hospital. The percentage of medicines wasted due to expiration was lower in APTS sites (2.1%) than non APTS hospital (3%). However, the significance test for the difference was not possible due to the limited number of control hospitals reporting wastage information. Although conditions made comparison unlikely, the result of this work shown a lower percentage of pharmaceutical wastage compared to the baseline study-8% and pharmaceutical sector study-8%.6,15 The wastage rate at both sites was slightly greater than the HSDP target of 2%.15
Study Strengths and Limitations
The strength of this research is, it used validated WHO instruments to compare drug use between APTS implemented and non-APTS implemented hospitals. However, it is not without limitations. Since we employed a cross-sectional comparative study design, causal relationships cannot be made. Matching the cases with controls was made for services and administrative types. The outcomes of this study only compare patient knowledge of correct dosage, patient satisfaction, medicine availability, stock out duration, and wastage rate were in the outpatient pharmacy department. Other units were not considered.
Conclusion
According to this study, better performances were observed in APTS sites than non APTS sites concerning performance evaluation of pharmacy staff, pharmaceuticals auditing, sales management, application of methodologies such as ABC, VEN, SSA, wastage reporting, and labelling completeness.
APTS hospitals in this study had shown statistically significant improvement concerning patient knowledge of correct dosage and satisfaction. Therefore, we can conclude that APTS implementation has a positive effect. APTS implementation had also shown to the positive impact the mean availability of EDs at stores. However, the difference for mean availability at dispensaries and stock out duration was insignificant. The better practice of reporting pharmaceuticals wastage was observed at APTS sites.
Acknowledgments
We gratefully thank Jimma University for ethical clearance provision, SNNPR regional health bureau, and zonal health departments for their co-operation and data collectors for their great effort in handling the whole data collection with good communication.
Disclosure
The authors declare that they have no competing interests.
References
1. World Health Organization. Constitution of the World Health Organization. WHO; 2006.
2. The Office of the High Commissioner for Human Rights. CESCR General Comment No. 14: The Right to the Highest Attainable Standard of Health (Art. 12); 2000.
3. World Health Organization. Service Availability and Readiness Assessment (SARA): An Annual Monitoring System for Service Delivery Reference Manual. WHO; 2015.
4. Management Sciences for Health. Toward Sustainable Access to Medicines. inManaging Access to Medicines and Health Technologies 1.1-1.19. MSH; 2012.
5. Lu Y, Hernandez P, Dele Abegunde ET. The World Medicine Situation 2011: Meidicine Expenditures. WHO; 2011.
6. The Federal Democratic Ethiopia/Pharmaceutical Fund and Supply Agency. Pharmaceutical Sector Assessment in Ethiopia. Foood, Medicine and Health Care Administration and Control Authority of Ethiopia; 2017.
7. Walkowiak H, Tamara Hafner SP. Strengthening Governance in Pharmaceutical Systems: A Compendium of Country Case Studies. Management Sciences for Health; 2018.
8. World Health Organization. The World Medicine Situation. WHO; 2004.
9. USAID/Delivery Project. Monitoring and Evaluation Indicators for Assessing Logistics Systems Performance. DELIVER for the U.S.Agency for International Development; 2006.
10. Alemayehu Y. Assessment of Auditable Pharmaceutical Transactions and Services Implementation Outcome: The Case of Amanuel Mental Specialized Hospital. 2017.
11. Temegen ND, Gemechis MS, Gutu MA, Alemayehu AG, Project DD. Proposal on Renovation of Pharmacy Services: Implementing Auditable Pharmaceutical Transaction and Services (APTS) in Shambu General Hospital, Horro Guduru Wollega Zone, Shambu Town,Oromia,North West Ethiopia. 2019.
12. Tadeg H, Ejigu E, Geremew E. Auditable Pharmaceutical Transactions and Services (APTS): Findings of the Baseline Assessment at Federal, Addis Ababa, and Teaching Hospitals. MSH; 2014.
13. SIAPS/USAID/MSH/. Transforming Pharmaceutical Services in Ethiopia Through Auditable Pharmaceutical Transactions and Services; 2014.
14. Reta Y, Tilahun E, Bekri D, Adem K, Bekele G. Assessment of patient satisfaction with Auditable Pharmaceutical Transaction and Services (APTS) at Hiwot Fana Specialized University Hospital in the Harari Region, Ethiopia. World J Pharm Pharm Sci. 2017;6:212–229.
15. Federal Democratic Republic of Ethiopia Ministry of Health. Pharmacy Service: Ethiopian Hospital Management Initiative. In Ethiopian Hospital Services Transformation Guidelines. FDRE, MoH; 2017.
16. Central Statistical Agency. The 2007 Population and Housing Census of Ethiopia: Statistical Report for Southern Nations, Nationalities and Peoples’ Region; Part I: Population Size and Characteristics; 2010.
17. Adugna A. Southern Nations Nationalities and Peoples Demography and Health. 2014.
18. World Health Organization. How to Investigate Drug Use in Health Facilities: Selected Drug Use Indicators. WHO; 1993.
19. Food Medicine and Healthcare Administration and. Control Authority of Ethiopia. National Essential Medicine List.
20. Thumm M, Malpica T, Tadeg H, Ejigu E, Ayalew Adinew RB. Transforming the Delivery of Pharmaceutical Services in Ethiopia: The Auditable Pharmaceutical Transactions and Services Approach. Management Sciences for Health; 2018.
21. Taherdoost H. Determining sample size; how to calculate survey sample size. Int J Econ Manag Syst. 2018;2:237–239.
22. John E, Ware ARD. Behavioral consequences of consumer dissatisfaction with medical care. Eval Progr Plann. 1983;6:291–297. doi:10.1016/0149-7189(83)90009-5
23. Gebregeorgise DT, Fenta TG, Assefa T, Teni FS, Institutet K. Outcomes of Auditable Pharmaceutical Transactions and Services (APTS) Implementation: Assessment Report. FMOH, EPA, SIAPS; 2016.
24. Ofili AN, Patients CEO. Assessment of efficiency of services at a teaching hospital in a developing country. Ann Afr Med. 2005;4:150–153.
25. Abdosh B. The quality of hospital services in eastern Ethiopia: patient ’ s perspective. Ethip J Heal Dev. 2006;20:199–200.
26. Kefale AT, Gebru Hagos Atsebah, TAM. Clients ’ perception and satisfaction toward service provided by pharmacy professionals at a teaching hospital in Ethiopia. Integr Pharm Res Pract. 2016;5:85–94. doi:10.2147/IPRP.S118657
27. World Health Organization. Priority Life-Saving Medicines for Women and Children. WHO; 2012.
28. Tegegne A, Muhe H, Gashaw W. A cross-sectional study of client satisfaction to wards services received at boru meda hospital pharmacy on opd basis and community pharmacy. Int Am Med. 2017;1.
29. Nditunze L, Makuza S, Amoroso CL, Odhiambo J, Ntakirutimana E. Assessment of essential medicines stock-outs at health centers in burera assessment of essential medicines stock-outs at health centers in Burera District in Northern Rwanda. Rwanda J Ser F Med Heal Sci. 2015;2.
 © 2020 The Author(s). This work is published and licensed by Dove Medical Press Limited. The full terms of this license are available at https://www.dovepress.com/terms.php and incorporate the Creative Commons Attribution - Non Commercial (unported, v3.0) License.
By accessing the work you hereby accept the Terms. Non-commercial uses of the work are permitted without any further permission from Dove Medical Press Limited, provided the work is properly attributed. For permission for commercial use of this work, please see paragraphs 4.2 and 5 of our Terms.
© 2020 The Author(s). This work is published and licensed by Dove Medical Press Limited. The full terms of this license are available at https://www.dovepress.com/terms.php and incorporate the Creative Commons Attribution - Non Commercial (unported, v3.0) License.
By accessing the work you hereby accept the Terms. Non-commercial uses of the work are permitted without any further permission from Dove Medical Press Limited, provided the work is properly attributed. For permission for commercial use of this work, please see paragraphs 4.2 and 5 of our Terms.