")
Back to Journals » Research and Reports in Urology » Volume 10
Effect of angiotensin II receptor blocker on TGF-β1, MMP-1, and collagen type I and type III concentration in New Zealand rabbit urethral stricture model
Authors Siregar S, Farenia R, Sugandi S, Roesli RM
Received 8 September 2017
Accepted for publication 26 April 2018
Published 2 October 2018 Volume 2018:10 Pages 127—133
DOI https://doi.org/10.2147/RRU.S151209
Checked for plagiarism Yes
Review by Single anonymous peer review
Peer reviewer comments 2
Editor who approved publication: Dr Jan Colli
Safendra Siregar, Reni Farenia, Suwandi Sugandi, Rully M Roesli
Urology Division, Department of Surgery, Hasan Sadikin Hospital Bandung, Faculty of Medicine Padjadjaran University, Bandung, Indonesia
Introduction: Urethral stricture is a disease with a high recurrence rate. Angiotensin II via AT1 receptor increases collagen formation through its effects on TGF-β1 and inhibition of collagenase activity. In this study, we evaluated the antifibrotic effect of angiotensin II receptor blocker on urethral stricture formation by creating a urethral stricture model in a male rabbit.
Material and methods: Thirty three male adult rabbits were separated into 3 groups (control, treatment, and sham). Group I consisted of 15 rabbits with urethral stricture that did not undergo any treatment, group II consisted of 15 rabbits with urethral stricture that were treated with a daily dose of 15 mg/kg losartan, given orally. Group III consisted of 3 rabbits with normal urethra and without any treatment. After 1, 2, and 4 weeks, the urethral tissues were collected, processed, and examined for TGF-β1, MMP-1, collagen type I, and collagen type III using enzyme-linked immunosorbent assay. Data were analyzed using 2-way analysis of variance using SPSS version 20.0.
Results: Urethral TGF-β1 concentration in the treatment group was significantly lower during the 2nd and 4th week of observation (p<0.0001), MMP-1 was significantly higher in the 1st, 2nd, and 4th week of observation (p<0.0001), collagen type I was significantly lower during the 2nd (p=0.001) and 4th week (p<0.0001), and collagen type III concentration was significantly lower in the 2nd and 4th week of observation (p<0.0001).
Conclusion: Angiotensin II receptor blocker could limit the progression of urethral stricture. The mechanism may be related to the AT1 blockage that leads to a decrease in TGF-β1 concentration, eventually resulting in lower collagen concentration due to increased MMP-1 activity.
Keywords: angiotensin receptor blocker, collagen, MMP-1, TGF-β1, urethral stricture
Introduction
Urethral stricture is a disease where a spongiofibrotic tissue formed inside the urethral lumen causes urethral lumen narrowing.1 These changes have various effects that could impair patients’ quality of life. Urethral stricture can be traumatic, inflammatory, iatrogenic, or idiopathic.2 Every process that causes injury of the urethral epithelium or the corpus spongiosum could eventually result in urethral stricture. Between 1992 and 2000 in the USA, the incidence of urethral stricture has reached 200–1,200 per 100,000 cases, with an increasing incidence in those aged >55 years.4 Treatment costs incurred by the US government to solve this reached US$191 million in 2000. Unfortunately, in Indonesia, data about annual cost for urethral stricture is still not available. In Hasan Sadikin Hospital, over the period of 2007–2013, there were 221 patients with urethral stricture, with an average age of 41 years. The etiology of strictures was mainly trauma and infection whose rates stood at 64.25% and 35.75%, respectively.6
Histologically, there were extracellular matrix (ECM) changes from normal urethral tissue in urethral stricture disease.9 The normal connective tissue of urethra was replaced by dense connective tissue, and there were changes in the collagen type II-to-collagen type I ratio.10 According to a study conducted by Ren et al,12 total collagen was significantly increased in urethral stricture.
A recent study has shown the role of rennin/angiotensin system (RAS) in the proliferation of fibroblasts and ECM deposits. TGF-β1 is an important cytokine in the fibrogenic process and has a role in stimulating the proliferation of fibroblasts and extracellular deposits. Shirazi et al13 in 2007 concluded that application of topical angiotensin-converting enzyme (ACE) inhibitor can significantly reduce the risk of stricture recurrence. Even though, in the study, they did not explain the direct effect of ACE inhibitor in urethral tissue histologically, the study suggests that there might be a role of renin angiotensin aldosterone axis in stricture formation and recurrence.
The angiotensin II receptor blockers (ARBs) represent a newer class of antihypertensive agents. The mechanism of action differs from ACE inhibitors; both drugs affect the RAS, but the ARB’s mechanism of action selectively inhibits angiotensin II by competitive antagonism of the angiotensin II receptors, those process showed ARB’s efficacy. A previous study has shown that there was an antifibrotic effect of ARB on kidney, heart, and liver tissues, but until now, there have been no studies that aimed to determine directly the effects of ARB on urethral tissue.
In this study, we aimed to determine the effect of ARB on fibrotic process of the urethral tissue by measuring TGF-β1, MMP-1, collagen type I, and collagen type III concentrations using enzyme-linked immunosorbent assays (ELISAs) in animal models with urethral stricture. Our study results will help in providing an alternative therapy for urethral stricture in the future.
Materials and methods
Thirty three male adult New Zealand rabbits with an average weight of 2.64±0.47 kg were separated into 3 groups (control group, treatment group, and sham group). Group I (control) consisted of 15 rabbits with urethral stricture that did not undergo any treatment. Group II (treatment) consisted of 15 rabbits with urethral stricture that were administered a daily dose of 15 mg/kg/d losartan orally. Group III (sham) consisted of 3 rabbits with normal urethra that did not undergo any treatment.
The urethral stricture model was made by stricture tissue coagulation, and observations were performed at 1, 2, and 4 weeks after coagulation. We used a thermal electrosurgical unit model AS300 110W (World Precision Instruments, Sarasota, FL, USA) for creating the stricture. We performed coagulation to the whole pendulare urethra in 15 mm length. In the therapy group, ARB (losartan) was given at a dose of 15 mg/kg/d. The rabbits were then euthanized depending on the different observation times, and the TGF-β1, MMP-1, and collagen types I and III concentrations were evaluated by ELISA. We used Rabbit Matrix Metalloproteinase-1 ELISA kit (Catalog Number MBS702551) to detect rabbit MMP-1 concentrations in serum, plasma, and tissue homogenates. In order to determine rabbit collagen concentration in serum, plasma, and tissue homogenates, we used collagen type I ELISA Kit (CSB-E06858Rb) and collagen III ELISA Kit (Catalog Number LS-F42491).
Biochemical process
Urethra protein isolation
Tissue sample (rabbit urethra) were cut into small pieces, grounded with a cold mortar and pestle, and then PBSTPMSF 5X V was added while grinding was continued. After dilution, the tissue sample was sonicated for 10 minutes and centrifuged at 6,000 rpm for 15 minutes. Supernatant was formed and sedimentation was observed; the sediment was expelled and the supernatant fluid was treated with absolute ethanol in a 1:1 proportion. The sample was then kept in a –20°C freezer until sediment formed. The sample was then centrifuged again at 10,000 rpm for 15 minutes at 4°C, the dried pellet was air dried, and Tris Cl was added to the sample.
Measurement of TGF-β1 level with ELISA
We coated the microplate with protein from the rabbit’s urethra in coating buffer for 2 hours at room temperature. The sample was washed with washing buffer (PBST) 3 times for 3 minutes each. After that, 50 µL BSA 1% was added, incubated for 1.5 hours, washed again with washing buffer (PBST) 3 times for 3 minutes each, and 100 µL biotin-antibody TTGF-β1 (goat anti-Rabit TGF-β1) was added into each well. This was then incubated for 1.5 hours at 37°C and then washed with washing buffer for 3 minutes. One hundred microliters of HRP-Avidin was then added and incubated for 1 hour at 37°C, followed by washing with the washing buffer 3 times. TMB substrate was then added and incubated for 20 minutes (room temperature). NaOH was added to the sample, and the sample was viewed with an ELISA reader at 450 nm wavelength.
Measurement of MMP1 level with ELISA
We coated the microplate with protein from the rabbit’s urethra in buffer coating for 2 hours at room temperature. The sample was washed with washing buffer (PBST) 3 times for 3 minutes each. After that, 50 µL BSA 1% was added, incubated for 1.5 hours, washed again with washing buffer (PBST) 3 times for 3 minutes each, and 100 µL biotin-antibody MMP1 was added into each well and incubated for 1.5 hours on 37°C. This was followed by washing with a washing buffer for 3 minutes. One hundred microliters of HRP-Avidin was then added and incubated again for 1 hour at 37°C, followed by washing with a washing buffer 3 times. TMB substrate was added and incubated for 20 minutes (room temperature). NaOH was added to the sample, and the sample was viewed with an ELISA reader at 450 nm wavelength.
Collagen1 amount measurement with ELISA
We coated the microplate with protein from the hare urethra in buffer coating for 2 hours at room temperature. The sample was washed with washing buffer (PBST) 3 times for 3 minutes each. After that, 50 µL BSA 1% added, incubated for 1.5 hours, washed again with washing buffer (PBST) 3 times for 3 minutes each, and 100 µL biotin-antibody Collagen1 was added on each well. The plate was incubated for 1.5 hours at 37°C, washed with washing buffer for 3 minutes, and 100 µL of HRP-Avidin was then added and incubated again for 1 hour at 37°C. Then this was washed with washing buffer 3 times. TMB substrate was added and incubated for 20 minutes (room temperature). NaOH was added to the sample, and the sample was viewed with an ELISA reader at 450 nm wavelength.
Collagen3 amount measurement with ELISA
We coated the microplate with protein from the hare urethra in buffer coating for 2 hours at room temperature. The sample was washed with washing buffer (PBST) 3 times for 3 minutes each. After that, 50 µL BSA 1% was added, incubated for 1.5 hours, washed again with washing buffer (PBST) 3 times for 3 minutes each, and 100 µL biotin-antibody conjugated Collagen3 was added into each well. This was followed by incubation for 1.5 hours at 37°C and washing with a washing buffer for 3 minutes. One hundred microliters of HRP-Avidin was then added and incubated again for 1 hour at 37°C, followed by washing with a washing buffer 3 times. TMB substrate was added and incubated for 20 minutes (room temperature). NaOH was added to the sample, and the sample was viewed with an ELISA reader at 450 nm wavelength.
This study was conducted after obtaining ethical clearance from the Bioscience Institute, Brawijaya University Malang, where the experiments were conducted. The experimental protocol was approved by the Animal Use and Care Committee of the Brawijaya University Malang and the Indonesian Health Ministry (no. 1031/2005) for experimental procedures in laboratory animals (National Guideline for Scientific Research in Indonesia: Use of Animal experiments). Data were analyzed using 2-way analysis of variance (ANOVA) and statistical analyses were performed using SPSS version 20.0 (IBM Corporation, Armonk, NY, USA).
Results
This study was conducted on 33 male adult New Zealand rabbits; 15 rabbits were included in the control group (group I), 15 in the treatment group (group II), and 3 in the sham group (group III). The average body weight of the animals was 2.68 kg; the average body weight of the rabbits in group I was 2.7 kg, in group II was 2.6 kg, and in group III was 2.1 kg. There was no significant difference in body weight between groups I and II (p-value =0.475) (Table 1).
 | Table 1 Average bodyweight of the rabbits in kilograms |
Urethral TGF-β1 concentration
Result of TGF-β1 examination using ELISA showed that there was a concentration difference between group I (control) and group II (treatment). TGF-β1 concentration was higher in the control group than in the treatment group in the 2nd and 4th week of observation. Even though in the 1st week TGF-β1 concentration was higher in the treatment group, there was a tendency for the concentration to reduce over time in the treatment group compared with the control group (Table 2 and Figure 1).
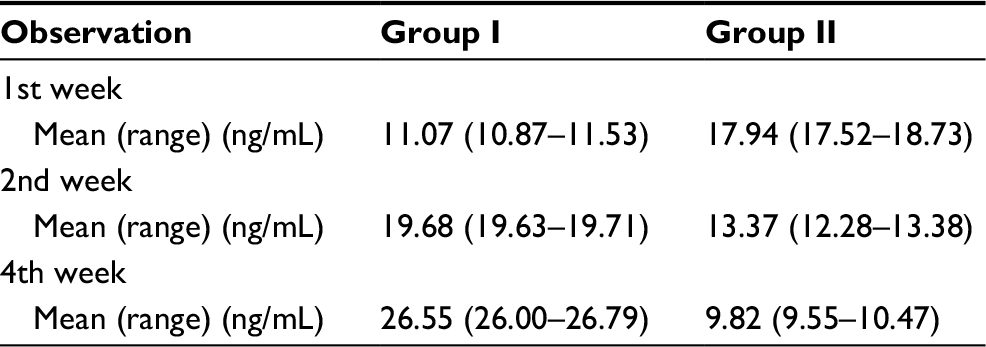 | Table 2 TGF-β1 concentration using ELISA Abbreviations: ELISA, enzyme-linked immunosorbent assay; TGF-β1, transforming growth factor β1. |
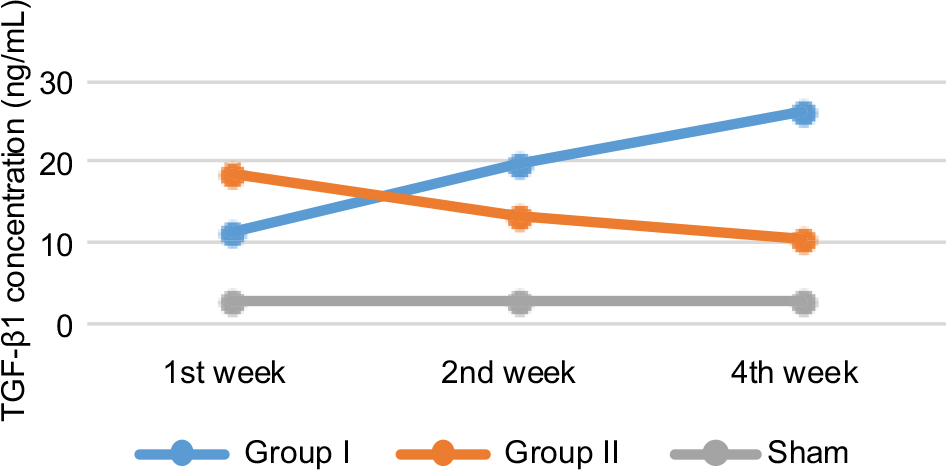 | Figure 1 TGF-β1 concentration pattern. Abbreviation: TGF-β1, transforming growth factor β1. |
Statistical analysis was done using ANOVA. Before the analysis was done, homogeneity test was done using Levene’s test. The results for the 1st, 2nd, and 4th week were p1=0.810, p2=0.010, and p4=0.528.
From statistical analysis using ANOVA, a significant difference in TGF-β1 concentration between group I and group II was observed in the 1st week of observation (p<0.0001), 2nd week of observation (p<0.0001), and 4th week of observation (p<0.0001). Even though in the 1st week, TGF-β1 concentration was higher in group II, later in the observation period, the concentration was lower than in group I (Table 3).
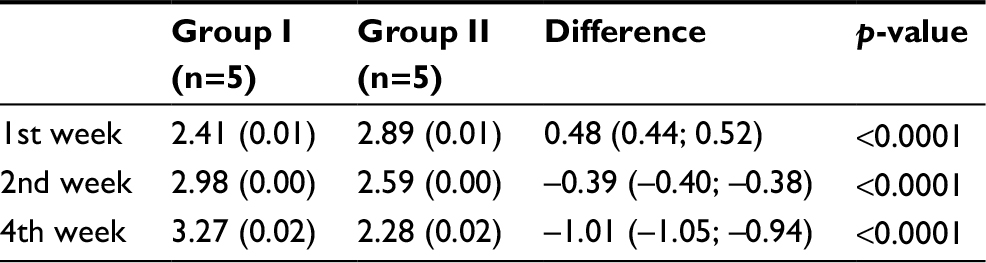 | Table 3 Statistical analysis for TGF-β1 concentration Abbreviation: TGF-β1, transforming growth factor β1. |
Urethral MMP-1 concentration
The result of MMP-1 examination using ELISA showed that there was a higher MMP-1 concentration in group II compared to group I. The difference was seen even from the 1st week of observation. Moreover, the MMP-1 concentration in group II seemed to increase over time, compared with MMP-1 concentration in group I which tends to decrease (Table 4 and Figure 2).
 | Table 4 MMP-1 concentration using ELISA Abbreviations: ELISA, enzyme-linked immunosorbent assay; MMP-1, matrix metalloproteinase 1. |
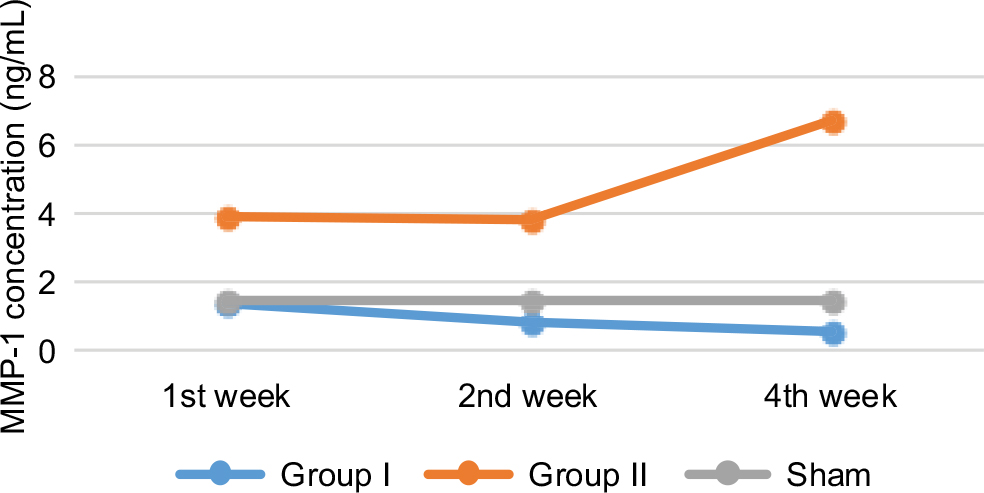 | Figure 2 MMP-1 concentration pattern. Abbreviation: MMP-1, matrix metalloproteinase 1. |
Homogeneity test using Levene’s test revealed the data for the 1st, 2nd, and 4th week as follows: p1=0.452, p2=0.002, and p4=0.683. Statistical analysis using ANOVA showed that there was a significant difference in the MMP-1 concentration between group I and group II in the 1st week of observation (p<0.0001), 2nd week (p<0.0001), and 4th week (p<0.0001) (Table 5).
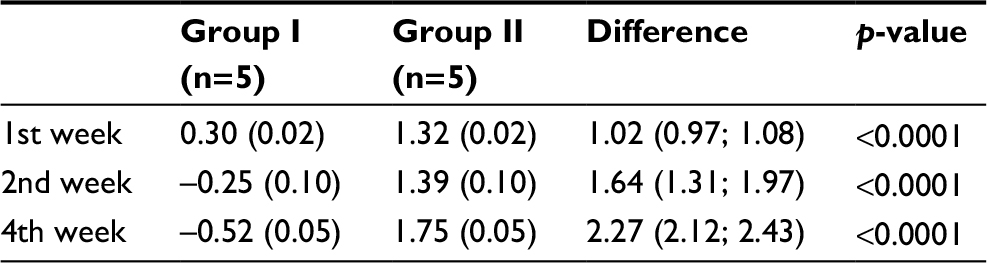 | Table 5 Statistical analysis for MMP-1 concentration Notes: Data in the table are shown as mean value of MMP-1 concentration between groups. There was statistically difference between two groups (p-value <0.0001). Abbreviation: MMP-1, matrix metalloproteinase 1. |
Urethral collagen type III concentration
The result of collagen type III examination using ELISA showed that there was a concentration difference between group I (control) and group II (treatment).
Even though in the 1st week, collagen type III concentration was higher in the treatment group, there was a tendency for the concentration to reduce over time, compared with the control group. In the 2nd and 4th week, collagen type III concentration was higher in the control group than in to the treatment group (Table 6, Figure 3).
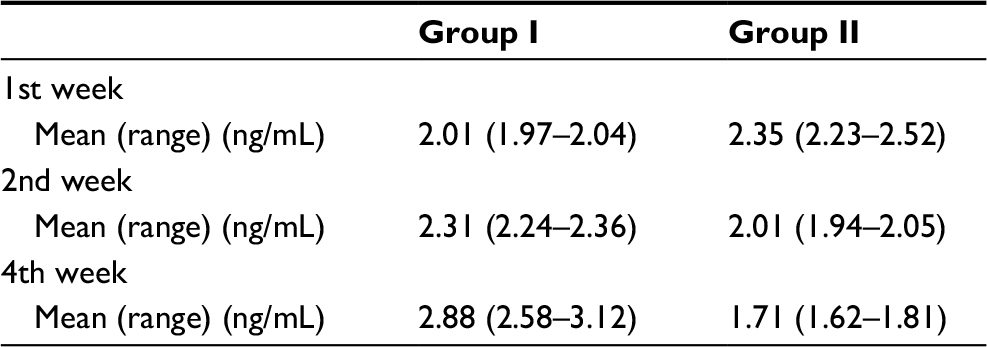 | Table 6 Collagen type III concentration using ELISA Abbreviation: ELISA, enzyme-linked immunosorbent assay. |
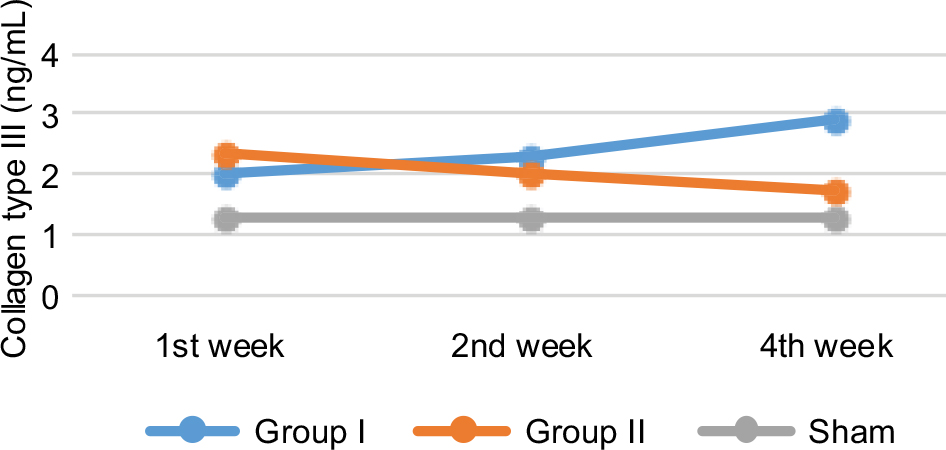 | Figure 3 Collagen type III concentration pattern. |
Homogeneity test using Levene’s test revealed the observation for the 1st, 2nd, and 4th week as follows: p1=0.628, p2=0.332, and p4=0.658. Statistical analysis using ANOVA showed that there were significant differences in collagen type III concentration between group I and group II in the 1st week of observation (p<0.0001), 2nd week (p<0.0001), and 4th week (p<0.0001) (Table 7).
 | Table 7 Statistical analysis for collagen type III concentration Notes: Data in the table are shown as mean value of collagen type III concentration between group I and II. There was statistical difference between two groups (p-value <0.0001). |
Urethral collagen type I concentration
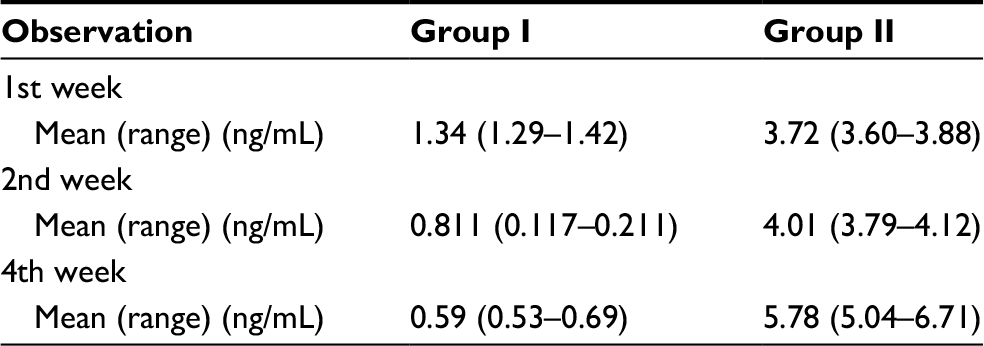
The result of collagen type I examination using ELISA showed that there was a concentration difference between group I and group II. Just like the pattern in collagen type III, in the 1st week the concentration was higher in group II, but there was a tendency for the concentration to reduce over time in group II, compared with group I. In the 2nd and 4th week, collagen type I concentration was higher in group I, compared with group II (Table 8, Figure 4).
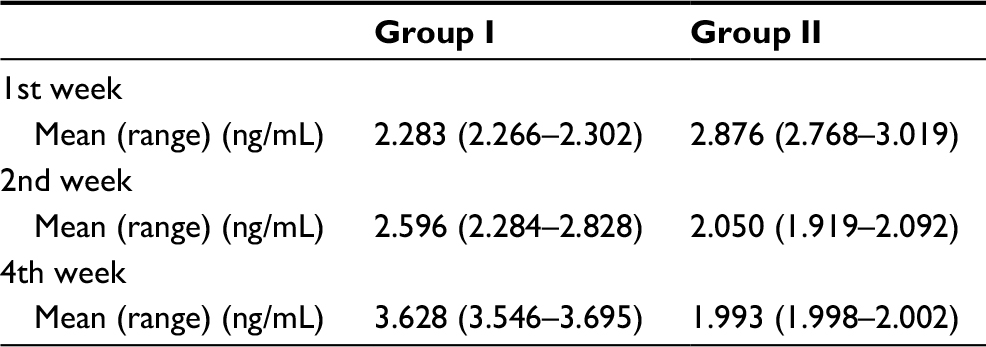 | Table 8 Collagen type I concentration using ELISA Abbreviation: ELISA, enzyme-linked immunosorbent assay. |
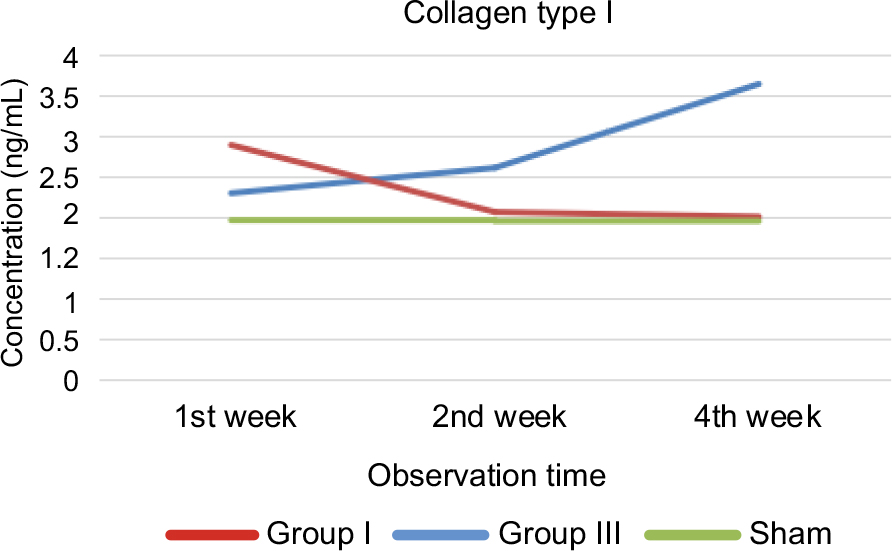 | Figure 4 Collagen type I concentration pattern. Notes: Red line: group 1; blue line: group 3; green line: sham. |
Homogeneity test using Levene’s test revealed the following data for the 1st, 2nd, and 4th week: p1=0.016, p2=0.508, and p4=0.072. Statistical analysis using ANOVA showed that there was a significant difference in collagen type I concentration between group I and group II in the 1st week of observation (p<0.0001), 2nd week (p=0.001), and 4th week (p<0.0001) (Table 9).
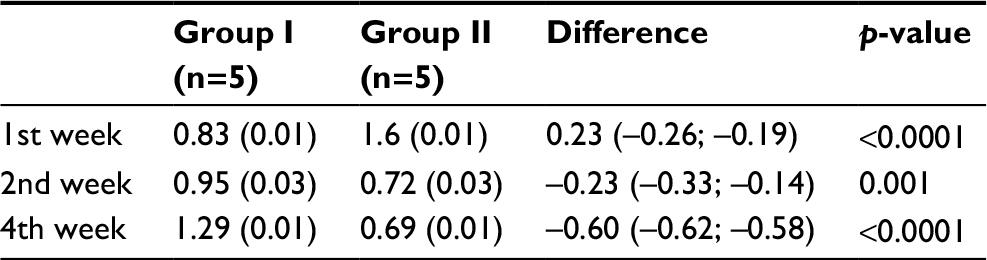 | Table 9 Statistical analysis for collagen type I concentration Notes: Data in the table are shown as mean value of collagen type I between two groups. There was statistical difference between two groups (p-value <0.0001). |
Discussion
Angiotensin II (AngII) has been recognized as a major vasoactive mediator in the RAS. The effects of AngII are seen even in the cardiovascular and renal systems. The RAS is an autonomous system and plays a role in fibrosis formation. AngII is expressed and works on any tissues. AngII signal is transferred through 2 receptors, which are AT1 and AT2. AT1 receptors mediate the effects of AngII on the tissues, which induce profibrotic effects, such as recruitment of inflammatory cells, angiogenesis, cell proliferation, and ECM accumulation.3 With the inhibition of AT1 receptors, ie, by ARB drugs, the profibrotic effects can be inhibited. Previous studies have shown the effect of ARB on the inhibition of fibrotic processes in various organs such as kidneys, liver, and heart.3–5
In this study, we noted an increase in TGF-β1 concentration over time in the control group. In contrast to the treated urethral stricture group, TGF-β1 concentrations in the control group were decreased at the 2nd and 4th week of observations when compared with TGF-β1 concentration at the 1st week. Although TGF-β1 concentration at the 1st week in the treated stricture group was higher than that in the untreated stricture group, TGF-β1 concentration in the treated group showed a tendency to decrease. This is in accordance with a study by el-Agroudy et al in 2003 who stated that Losartan administration was able to decrease the expression of TGF-β1 and interstitial fibrosis in kidney tissue.5 This is because AngII is able to stimulate TGF-β1 gene activation through PKC-dependent and p38 MAPK pathways, so that the inhibition of AngII mechanism of action by way of resistance to the AT1 receptor will decrease the expression of TGF-β1.7
Other findings in this study also showed an increase in the concentration of MMP-1 at the 2nd and 4th week of observation compared with the MMP-1 concentration at the 1st week in the untreated stricture group. In the treated stricture group, it appears that the concentrations of MMP-1 were higher since the 1st week compared with untreated stricture group, and continued to increase in the 2nd and 4th week of observation. This is influenced by the decline in TGF-β1 concentration that is affected by ARB administration. This result is also in accordance with a study by Philips et al8 who found inhibition of MMP-1 expression by TGF-β1 protein, anti-TGF antibodies, and anti-TGF-β1 antibody in vitro. Under inflammatory conditions, TGF-β1 will decrease the expression of MMP-1 (collagenase).9 MMP-1 has an important role in the re-epitalialization process by keratinocyte migration and remodeling of collagen, which is the key of wound healing.10 Briefly, AngII induces fibrosis not only through the increase of ECM synthesis but also by decreasing the turnover rate of the ECM. AngII through AT1 receptors induces TIMP-1 to inhibit MMP-1, which in turn inhibits the degradation of ECM and results in fibrosis.11
The last finding of this research is the decrease of collagen type I and collagen type III concentrations at the 2nd and 4th week of observations when compared with the 1st week in the treated stricture group. In the untreated stricture group, it was shown that the concentrations of type I collagen and type III collagen began to increase in the 2nd and 4th weeks of observation compared with the treated stricture group. Although in the 1st week of observation, type I and type III collagen concentrations in the treated stricture group was higher than the untreated stricture group, it was shown that type I and type III collagen concentrations in the treated stricture group tended to decrease, and there were significant differences at the 2nd and 4th week of observation. This is consistent with a previous study by Ren et al12 in 2013 which showed that the AngII increases the synthesis of collagen types I and III, along with the increased expression of TGF-β1 and TIMP-1, and those processes can be inhibited by losartan in the skin tissue of patients with diabetes. This study proves that the same possible mechanisms might be occurring in urethral tissue.
The decrease of type I and type III collagen concentrations in this study was also associated with the decreasing levels of TGF-β1 concentrations coupled with an increase in the MMP-1 concentration. MMP1 has the ability to degrade collagen (type I, II, and III), and collagen deposition is a major component in urethral stricture. More specifically, MMP-1 cleaves the helical region of collagen type I. MMP1 also has a role in the fibrotic process which can significantly decrease collagen.12 In this study, the concentrations of type I and type III collagen decreased with increasing MMP-1 concentrations during the 2nd and 4th weeks of observation.
Conclusion
ARBs (losartan) could limit the fibrotic progression of urethral injury into urethral stricture. The mechanism may be related to the Angiotensin II blockage that leads to a decrease in TGF-β1 concentration, eventually resulting in lower collagen concentration due to increased MMP-1 activity.
Disclosure
The authors report no conflicts of interest in this work.
References
Jordan GH, McCammon KA. Surgery of the penis and urethra. In: McDougal WS, Wein AJ, Kavoussi LR, Novick AC, Partin AW, Peters CA, editors. Campbell-Walsh Urology. Vol 1. 10th ed. Philadelphia: Saunders; 2012:967. | ||
Fenton AS, Morey AF, Aviles R, Garcia CR. Anterior urethral strictures; etiology and characteristics. Urology. 2005;65(6):1055–1058. | ||
Unger T. The angiotensin type 2 receptor: Variations on an enigmatic theme. J Hypertens. 1999;17(12 Pt 2):1775–1786. | ||
Baskin LS, Constantinescu SC, Howard PS. Biochemical characterization and quantitation of the collagenous components of urethra stricture tissue. J Urol. 1993;150(2 Pt 2):642–647. | ||
el-Agroudy AE, Hassan NA, Foda MA, et al. Effect of angiotensin II receptor blocker on plasma levels of TGF-beta 1 and interstitial fibrosis in hypertensive kidney transplant patients. Am J Nephrol. 2003;23(5):300–306. | ||
Seibold J, Selent C, Feil G, et al. Development of a porcine animal model for urethral stricture repair using autologous urothelial cells. J Pediatr Urol. 2012;8(2):194–200. | ||
Weigert C, Brodbeck K, Klopfer K, Häring HU, Schleicher ED. Angiotensin II induces human TGF-β1 promoter activation: similarity to hyperglycaemia. Diabetologia. 2002;45(6):890–898. | ||
Philips N, Keller T, Gonzalez S. TGF β-like regulation of matrix metalloproteinases by anti-transforming growth factor-β, and anti-transforming growth factor-β1 antibodies in dermal fibroblasts: implications for wound healing. Wound Repair Regen. 2004;12(1):53–59. | ||
Krstic J, Santibanez JF. Transforming growth factor-β and matrix metalloproteinases: functional interactions in tumor stroma-infiltrating myeloid cells. ScientificWorldJournal. 2014;2014:521754. | ||
Gill SE, Parks WC. Metalloproteinases and their inhibitors: regulators of wound healing. Int J Biochem Cell Biol. 2008;40(6):1334–1347. | ||
Iwano M, Plieth D, Danoff TM, Xue C, Okada H, Neilson EG. Evidence that fibroblasts derive from epithelium during tissue fibrosis. J Clin Invest. 2002;110(3):341–350. | ||
Ren M, Hao S, Yang C, et al. Angiotensin II regulates collagen metabolism through modulating tissue inhibitor of metalloproteinase-1 in diabetic skin tissues. Diab Vasc Dis Res. 2013;10(5):426–435. | ||
Shirazi M, Khezri A, Samani SM, Monabbati A, Kojoori J, Hassanpour A. Effect of intraurethral captopril gel on the recurrence of urethral stricture after direct vision internal urethrotomy: Phase II clinical trial. Int J Urol. 2007;14(3):203–208. |
 © 2018 The Author(s). This work is published and licensed by Dove Medical Press Limited. The full terms of this license are available at https://www.dovepress.com/terms.php and incorporate the Creative Commons Attribution - Non Commercial (unported, v3.0) License.
By accessing the work you hereby accept the Terms. Non-commercial uses of the work are permitted without any further permission from Dove Medical Press Limited, provided the work is properly attributed. For permission for commercial use of this work, please see paragraphs 4.2 and 5 of our Terms.
© 2018 The Author(s). This work is published and licensed by Dove Medical Press Limited. The full terms of this license are available at https://www.dovepress.com/terms.php and incorporate the Creative Commons Attribution - Non Commercial (unported, v3.0) License.
By accessing the work you hereby accept the Terms. Non-commercial uses of the work are permitted without any further permission from Dove Medical Press Limited, provided the work is properly attributed. For permission for commercial use of this work, please see paragraphs 4.2 and 5 of our Terms.