")
Back to Journals » Drug Design, Development and Therapy » Volume 16
ED-71 Prevents Glucocorticoid-Induced Osteoporosis by Regulating Osteoblast Differentiation via Notch and Wnt/β-Catenin Pathways
Authors Rong X, Kou Y , Zhang Y, Yang P, Tang R, Liu H, Li M
Received 9 June 2022
Accepted for publication 3 November 2022
Published 15 November 2022 Volume 2022:16 Pages 3929—3946
DOI https://doi.org/10.2147/DDDT.S377001
Checked for plagiarism Yes
Review by Single anonymous peer review
Peer reviewer comments 3
Editor who approved publication: Dr Georgios Panos
Xing Rong,1,2 Yuying Kou,1,2 Yuan Zhang,1,2 Panpan Yang,1,2 Rong Tang,1,2 Hongrui Liu,1,2 Minqi Li1,2
1Department of Bone Metabolism, School and Hospital of Stomatology, Cheeloo College of Medicine, Shandong University & Shandong Key Laboratory of Oral Tissue Regeneration & Shandong Engineering Laboratory for Dental Materials and Oral Tissue Regeneration, Jinan, People’s Republic of China; 2Center of Osteoporosis and Bone Mineral Research, Shandong University, Jinan, People’s Republic of China
Correspondence: Minqi Li; Hongrui Liu, Center of Osteoporosis and Bone Mineral Research, Shandong University, Department of Bone Metabolism, School of Stomatology, Shandong University, Wenhua West Road 44-1, Jinan, 250012, People’s Republic of China, Tel +86-531-88382095 ; +86-531-88382493, Fax +86-531-8838 2923, Email [email protected]; [email protected]
Purpose: Long-term glucocorticoid- usage can lead to glucocorticoid-induced osteoporosis (GIOP). The study focused on the preventative effects of a novel active vitamin D3 analog, eldecalcitol (ED-71), against GIOP and explored the underlying molecular mechanisms.
Methods: Intraperitoneal injection of methylprednisolone (MPED) or dexamethasone (DEX) induced the GIOP model within C57BL/6 mice in vivo. Simultaneously, ED-71 was orally supplemented. Bone histological alterations, microstructure parameters, novel bone formation rates, and osteogenic factor changes were evaluated by hematoxylin-eosin (HE) staining, micro-computed tomography, calcein/tetracycline labeling, and immunohistochemical (IHC) staining. The osteogenic differentiation level and mineralization in pre-osteoblast MC3T3-E1 cells were evaluated in vitro using alkaline phosphatase (ALP) staining, alizarin red (AR) staining, quantitative polymerase chain reaction (qPCR), Western blotting, and immunofluorescence staining.
Results: ED-71 partially prevented bone mass reduction and microstructure parameter alterations among GIOP-induced mice. Moreover, ED-71 also promoted new bone formation and osteoblast activity while inhibiting osteoclasts. In vitro, ED-71 promoted osteogenic differentiation and mineralization in DEX-treated MC3T3-E1 cells and boosted the levels of osteogenic-related factors. Additionally, GSK3-β and β-catenin expression levels were elevated after ED-71 was added to cells and were accompanied by reduced Notch expression. The Wnt signaling inhibitor XAV939 and Notch overexpression reversed the ED-71 promotional effects toward osteogenic differentiation and mineralization.
Conclusion: ED-71 prevented GIOP by enhancing osteogenic differentiation through Notch and Wnt/GSK-3β/β-catenin signaling. The results provide a novel translational direction for the clinical application of ED-71 against GIOP.
Keywords: glucocorticoid-induced osteoporosis, eldecalcitol, osteoblasts, Notch signaling, Wnt/GSK-3β/β-catenin signaling
Introduction
Glucocorticoids are anti-inflammatory and immunosuppressive drugs widely utilized for chronic non-infectious inflammatory diseases, allergic diseases, and organ transplantation.1 Due to their widespread use, glucocorticoid-induced osteoporosis (GIOP) has become a severe sequela. Studies have reported that approximately 30% of all patients treated with glucocorticoids for at least six months could develop osteoporosis.2 GIOP is the third common cause of pathological bone loss after bone loss in postmenopausal women and older individuals, with nearly 20% of all patients having osteoporosis.3 GIOP onset is associated with rapid bone loss and a dose-dependent increase in fracture risk within a few months.1,4 It is also the most common form of drug-induced osteoporosis; however, compared with widely characterized postmenopausal osteoporosis, the condition has not yet been fully recognized. Moreover, based on their pathological characteristics, targeted treatments have not been identified.1
As common drug-induced osteoporosis, the pathological mechanisms of GIOP are distinct from postmenopausal osteoporosis, primarily caused by osteoclast-induced bone resorption.5 The core feature of GIOP pathogenesis includes inhibited bone formation, glucocorticoids impair osteoblast proliferation, differentiation, and function, and induce apoptosis within mature osteoblasts and osteocytes.6,7 In addition, glucocorticoids facilitate osteoclast formation and enhance bone resorption rates in the early stages, while osteoclasts and osteoblasts are inhibited at later stages.8 Currently, drug therapy is the primary treatment avenue for GIOP. Bisphosphonates, denosumab, and teriparatide are common drugs, but they do not generate ideal therapeutic effects.2 Therefore, the simultaneous usage of glucocorticoids and drug intervention approaches could prevent GIOP pathology and function combinatorially from resolving this problem.
The liver and kidney metabolize active vitamin D (an active form of vitamin D). Activated vitamin D forms, such as calcitriol and alfacalcidol, and calcium supplementation are considered adequate preventative or first-step treatments for GIOP.9 Mechanistic studies have revealed that activated vitamin D regulates calcium and phosphorus metabolism and promotes bone mineralization (traditional functions). However, it also directly acts on osteoblasts and indirectly on osteoclasts through osteoblasts to modulate bone remodeling.10 Eldecalcitol (1α, 25-dihydroxy-2β-(3-hydroxypropyloxy) vitamin D3 or ED-71) is a novel active vitamin D3 analog recently approved for sale in Japan. Compared with traditional vitamin D, ED-71 has a longer half-life, depicts more stable binding with vitamin D binding proteins, and is more effective in elevating bone mineral density and inducing mini-bone formation.11,12 Studies have also demonstrated that ED-71 significantly reduces the risk of osteoporotic fractures,13 inhibits bone turnover, prevents bone loss among ovariectomized (OVX) rats,14 and reduces trabecular bone loss and bone brittleness in type I diabetes model rats.15 We previously conducted several ED-71 studies, including ED-71-derived bone mini-modeling among OVX rats,16 the amelioration of diabetic osteoporosis through ED-71 effects on the immune system,17 ED-71 amelioration toward cyclophosphamide-induced osteoporosis among rats,18 and guided bone regeneration by ED-71 for bone defect restoration in rats.19 Thus, ED-71 has good therapeutic prospects for treating various bone mineral diseases. Interestingly, while clinical studies described that ED-71 was superior to alfacalcidol in maintaining bone mineral density in GIOP patients,20 the specific mechanisms and effects of ED-71 on GIOP remain unclear. Similarly, it is unclear if ED-71 prevents GIOP occurrence and development.
The Notch signaling pathway is an intercellular communications system activated when the receptors bind to ligands, with the primary target genes being Hes1 and Hey1.21 The activated Notch intracellular domain is involved in osteoporosis pathogenesis by inhibiting osteoblast differentiation during bone remodeling.22 Previously, the inhibition of Notch signaling promoted osteogenic differentiation in OVX mice.23 In GIOP pathological mechanisms, glucocorticoids stimulate Notch1 transcription in osteoblasts, generating distinct inhibited osteoblast activity.24 In addition, the classical Wnt signaling pathway (Wnt/β-catenin signaling) is closely associated with bone metabolism, with crucial roles in bone formation.25 Wnt signal through the Frizzled (FZD) family of proteins acting as receptors and low-density lipoprotein receptor-related proteins 5 and 6 (LRP-5 and LRP-6) as coreceptors to stabilize β-catenin, translocating into the nucleus to stimulate the transcription of Wnt target genes.26 Wnt signaling also enhances the osteogenic differentiation of mesenchymal stem cells.27 Studies have shown that Wnt/GSK-3β/β-catenin signaling activation promotes osteoblast proliferation, differentiation, and mineralization within DEX-treated MC3T3-E1 pre-osteoblasts.28 These studies have suggested that Wnt/β-catenin signaling could be a potential therapeutic target against GIOP. However, Notch and Wnt signaling do not function independently. Previous studies revealed they interacted during muscle differentiation, liver disease progression, and carcinogenesis.29,30 These interactions were generated through other intracellular molecules, eg, glycogen synthase kinase 3 (GSK-3β) acted as a junction between Notch and Wnt signaling during mouse myogenesis.30 It was also established that normal bone cell differentiation needed high Notch signaling and low Wnt signaling activity.31 However, it is unclear if these signaling pathways mediate GIOP prevention using ED-71.
In this study, we developed a GIOP mouse model to evaluate the preventative effects of ED-71 in vivo. Additionally, in vitro studies were conducted to assess if ED-71 prevented GIOP by regulating Notch and Wnt/β-catenin signaling, thereby promoting osteoblast differentiation. Thus, our objective was to identify new molecular targets to treat osteoporosis, including GIOP, and provide novel ideas for the clinical treatment of GIOP.
Materials and Methods
GIOP Model Establishment and Treatment with ED-71
Eight-week-old male C57BL/6 mice were procured from Jinan Pengyue Laboratory Animal Breeding Co. Ltd. (Jinan, China) and kept under standard conditions in a 12 h light/dark cycle. All the animal procedures were performed in accordance with the Guidelines for Care and Use of Laboratory Animals of the National Institutes of Health. All animal experiments were approved by the Institutional Animal Care and Use Committee (IACUC), School and Hospital of Stomatology, Shandong University (No. 20210915).
Mice were randomly allocated to six groups (n=8): 1) control (CON) (four weeks, see the treatment regime), 2) methylprednisolone (MPED), 3) MPED+ED-71, 4) CON (eight weeks, see the treatment regime), 5) DEX, 6) and DEX+ED-71. Mice in MPED and MPED+ED-71 groups were injected intraperitoneally with MPED (10 mg/kg) (MedChemExpress, Monmouth Junction, NJ, USA) every day for four weeks. Simultaneously, the MPED+ED-71 group was orally supplemented with 50 mg/kg/day of ED-71 (Chugai Pharmaceutical Co., Ltd., Tokyo, Japan) every day.19 Mice in DEX and DEX+ED-71 groups were intraperitoneally injected with DEX (1 mg/kg) (MedChemExpress) every day for eight weeks. Simultaneously, 50 mg/kg/day of ED-71 was orally supplemented to the DEX+ED-71 group every day. At the end of treatment, some mice were anesthetized and humanely euthanized by neck dissection. Femurs were removed and stored in 75% alcohol for micro-computed tomography (micro-CT) or generating undecalcified histological slices. The remaining mice were anesthetized and intracardially perfused in 4% paraformaldehyde. After fixation, the femurs were decalcified in an EDTA-2Na solution at 4°C for four weeks. After dehydration using an ethanol gradient series, the tissues were embedded in paraffin and sectioned into 5 μm thick slices for histological analyses.
Micro-CT Assessment
After the 4- or 8-week treatment, bone microarchitecture parameters in distal femurs were examined through a micro-CT scanner (SCANCO Medical AG, Bruttisellen, Switzerland). Two- and three-dimensional micro-CT images were reconstructed with a micro-CT analysis system at 10 µm resolution (SCANCO Medical AG).
Calcein/Tetracycline Labeling
The mice were subcutaneously injected with 20 mg/kg tetracycline (MedChemExpress) or 8 mg/kg calcein (MedChemExpress) on days 3 and 13 days before being euthanized, respectively.16 Mice were anesthetized and euthanized. The femurs were separated and fixed in 75% ethanol for 48 h. Then, hard tissue embedding and ultra-thin sections (100–200 μm) were generated in the dark. Cortical bone sites corresponding to the primary bone trabeculae under the femoral growth plate were observed under fluorescence microscopy (BX-53; Olympus Corporation, Tokyo, Japan), and the images were collected.
Hematoxylin and Eosin (HE) Staining
HE staining was used to evaluate histological changes in sections. After dewaxing and hydration, the slices were immersed in hematoxylin for 15 minutes, washed in distilled water, immersed in eosin for 7 minutes, rewashed in distilled water, and finally dehydrated and mounted. After this, the sections were observed, and digital images were obtained under light microscopy (BX-53; Olympus). Trabecular bone volume (BV/TV), trabecular thickness (Tb.Th), trabecular number (Tb.N), and trabecular separation (Tb.Sp) parameters were determined using the Image Pro Plus 6.2 software (Media Cybernetics, Silver Spring, MD, USA). Specifically, three tissue sections were chosen from each level (margin, center, and another margin) for quantitative histological assessments to calculate mean values. CON group was compared using the slices in equal levels. The average value of parallel samples was calculated.
Immunohistochemistry (IHC) and Tartrate Resistant Acid Phosphatase (TRAP) Staining
Sections underwent IHC staining to examine alkaline phosphatase (ALP), osteocalcin (OCN), runt-related transcription factor 2 (RUNX2), and collagen I (COL1) expression. Paraffin sections were first deparaffinized in xylene for 20 min. To inhibit endogenous peroxidase, sections were pretreated with 0.3% hydrogen peroxide for 30 min and then treated with 1% bovine serum albumin (BSA) in PBS (1% BSA/PBS) for 20 min at room temperature to prevent non-specific staining. Sections were then incubated overnight with anti-ALP (1:150, ab108337, Abcam, Cambridge, UK), anti-OCN (1:150, ab93876, Abcam), anti-RUNX2 (1:50, ab192256, Abcam), and anti-COL1 (1:100, ab34710, Abcam) antibodies. The next day, after rinsing in PBS, sections were subjected to secondary antibody (1:200, ab6721, Abcam) staining for 1 h at room temperature. Diaminobenzidine (Sigma-Aldrich, Merck KGaA, Germany) was used to examine immune responses. The sections were stained using ALP&TRAP double staining to investigate the activity of osteoclasts and osteoblasts. Osteoblast activity was defined as ALP-positive cells on the linear surface of alveolar bone after Diaminobenzidine examination (brown). After rinsing in double distilled water, the TRAP staining solution was added and reacted at room temperature for 15 min until red staining was observed. Finally, all the sections were counterstained with methyl green stain before being viewed under an optical microscope (BX-53; Olympus).
For statistical analysis, three sections were selected (margin, center, and another margin) for each quantitative histological measurement and the average value of parallel samples calculated. Moreover, serial sections were selected and consistent vision fields were recorded for different markers. RUNX2 positive osteoblasts and TRAP positive osteoclasts were counted and the integrated optical density of COL1, the mean optical density of ALP and OCN were measured in three randomly selected non-overlapping microscopic fields from each section using Image-Pro Plus 6.2 software (Media Cybernetics). Regions of interest were manually selected in a color cube that based manner.
Cell Culture, Osteogenic Differentiation Induction, and Drug Treatments
Mouse pre-osteoblast MC3T3-E1 cells were obtained from Shanghai Cell Center (Shanghai, China) and maintained in α-minimal essential medium with 10% fetal bovine serum, 100 units/mL penicillin, and 100 μg/mL streptomycin at 37°C inside a 5% CO2 humidified incubator. After adherence and to induce osteogenic differentiation, the cells were cultured in osteoblast inducing conditional media and 50 mg/l ascorbic acid, 100 mM β-glycerophosphate, and 10 nM DEX23 for 7, 14, or 21 days. The osteoblast-inducing conditional media was changed every three days. The cells were also incubated with DEX (1 μM)32 or co-incubated with DEX and ED-71 (1 nM)17 to mimic the ED-71 treatment in a GIOP environment while performing osteogenic induction.
XAV939 Treatment and Hes1 Overexpression
MC3T3-E1 cells were co-incubated with the β-catenin inhibitor XAV939 (10 μM) (MedChemExpress) to inhibit Wnt/β-catenin signaling.32 Cells treated with dimethyl sulfoxide became controls. The Hes1 overexpression vector (NM_008235) pc DNA3.4–3xflag was synthesized by Keyybio (Shandong, China) to activate Notch signaling. Based on the manufacturer’s instructions, the vector (4 μg/2 mL) was transfected into MC3T3-E1 cells using the ZLip2000 (10 μL/2 mL) transfection reagent (Zoman Biotechnology Co., Ltd. Beijing, China). Moreover, pc DNA3.4–3xflag (4 μg/2 mL) was transfected into MC3T3-E1 cells and acted as the control group. The cells were cultured in six-well plates.
Immunofluorescence Staining
MC3T3-E1 cells fixed in 4% paraformaldehyde for 20 min were blocked in PBS plus 5% BSA for 1 h and incubated overnight with an anti-β-catenin (1:200; ab32572, Abcam) or anti-Notch1 (1:200; ab52627, Abcam) primary antibody. The next day, cells were incubated for 1 h with a secondary antibody (Alexa Fluor® 488) (1:200; ab150081, Abcam). 4´,6-Diamidino-2-phenylindole was used to stain the nucleus. Images were finally generated under fluorescence microscopy (BX-53; Olympus).
ALP Staining and Alizarin Red (AR) Staining
MC3T3-E1 cells were cultured in an osteogenic induction medium for seven days. The cells were fixed in 4% paraformaldehyde for 20 min to test for ALP activity and stained using the ALP solution (Solarbio, Beijing, China) based on the manufacturer’s protocols. At least three culture plates were screened for each group, and five fields were randomly selected for each plate. The images were obtained under optical microscopy (CKX-41, Olympus).
For AR staining, MC3T3-E1 cells were cultured in osteogenic induction medium for 21 days to form mineralized nodules, after which cells were fixed in 4% paraformaldehyde and stained with 1% AR staining solution (Lot. No.20180820, Solarbio) to visually evaluate mineralized osteoblast levels. At least three culture plates were screened for each group and five fields randomly selected for each plate. Images were taken under optical microscopy (CKX-41, Olympus).
Real-Time Polymerase Chain Reaction (RT-qPCR) Analysis
After 7 days of MC3T3-E1 cell culture, the culture medium was discarded and cells washed three times in pre-cooled PBS for total RNA analysis. RNA was extracted from cells using Trizol reagent (AG21102, Accurate Biotechnology Co., Ltd., China). According to manufacturer’s instructions, cDNA was synthesized using the Evo M-MLV RT Reverse Transcription kit II (AG11711, Accurate Biotechnology). QPCR was performed using the SYBR Green Pro Taq HS premixed qPCR kit (AG11701, Accurate Biotechnology) in a RT fluorescence quantitative PCR system (LightCycler® 96 SW 1.1, Roche Ltd, Switzerland). Glyceraldehyde 3-phosphate dehydrogenase (GAPDH) was used as an internal control and results were presented as relative gene expression. Fold-change in gene expression relative to the control was calculated using the 2−∆∆Cq method in GraphPad Prism software (GraphPad Inc., San Diego, CA, USA, version 6.0). Primer sequences are shown (Table 1).
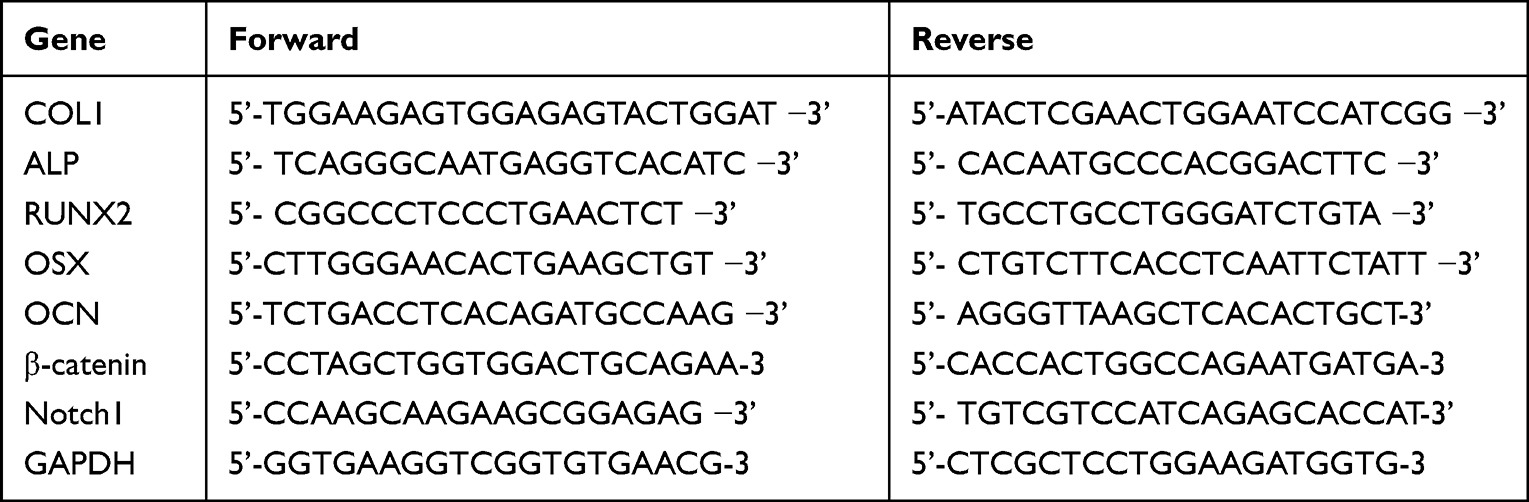 |
Table 1 Specific Primers for Control and Target Genes |
Western Blotting
Proteins were extracted in RIPA lysis buffer (Lot 02408/60412, CwBio Biotechnology Co., Ltd., China) according to manufacturer’s instructions. Protein concentrations were quantified using the bicinchoninic acid protein assay detection kit (P0012S, BeyoTime Biotechnology, Shanghai, China). Quantified proteins were mixed with a 1/4 volume of 5 × sodium dodecyl sulfate loading buffer and heated to 95°C for 5 min. Proteins were then separated by 10% sodium dodecyl sulfate-polyacrylamide gel electrophoresis and transferred to polyvinylidene fluoride membranes. After washing in 5% BSA-TBST at room temperature for 1 h, membranes were co-incubated with primary antibodies: anti-GAPDH (ab9485, Abcam), anti-COL1 (ab34710, Abcam), anti-ALP (ab108337, Abcam), anti-RUNX2 (ab192256, Abcam), anti-OCN (ab93876, Abcam), anti-Notch1 (ab52627, Abcam), anti-p-GSK-3β (ab131097, Abcam), anti-β-catenin (ab32572, Abcam), anti- non-phospho (Active) β-Catenin (8814, Cell Signaling Technology), anti-Wnt5a (A12744, Thermo Scientific), and anti-Frizzled4 (FZD4) (A8161, Thermo Scientific). After washing three times in buffer, membranes were incubated for 1 h with a horseradish peroxidase-conjugated goat anti-rabbit IgG (ab6721, Abcam) and then rewashed to remove residual antibodies. Immune reaction bands were visualized using enhanced chemiluminescence reagent (B500024, Proteintech, Chicago, IL, USA). A gel imaging system (Amersham Imager 600, General Electric Company, Boston, USA) was used to generate images. Grayscale values were analyzed and quantified using Image-Pro Plus 6.2 software (Media Cybernetics) and normalized to GAPDH levels. Each experiment was repeated at least three times.
Statistical Analysis
QQ plots were used to assess data distribution, when the scatter plot was close to a straight line, it can be considered that the data set was approximately normally distributed. All the quantitative data were expressed as means ± standard deviations (SD) and all experiments were independently repeated at least 3 times. One-way ANOVA was used for multiple groups’ comparison, and the mean value of each group was compared using the least significant difference (LSD) test. SPSS 25.0 software was used to analysis the obtained data, P < 0.05 was considered statistically significant.
Results
ED-71 Improves Bone Quantity and Quality in Mice with GIOP
At four weeks, micro-CT analysis was used to detect the bone quantity and quality differences among the three groups. CON mice revealed regular trabecular bone formation having moderate bone marrow cavities, while the cortical bone of the diaphysis had a particular thickness (Figure 1A a, d). However, the MPED mice displayed significantly less and more sparse trabeculae having larger bone marrow cavities, while the cortical bone had become thinner than CON animals (Figure 1A b, e). However, compared with MPED mice, MPED+ED-71 mice presented significantly elevated trabecular bone volume, smaller medullary cavity, and recovered cortical bone thickness (Figure 1A c, f).
 |
Figure 1 Effects of ED-71 on bone quantity and quality in MPED-induced osteoporosis mice. (A). a–f The representative 2D and 3D Micro-CT images of femur in CON, MPED and MPED+ED-71 groups at 4 weeks. (B). a–f Calcein and tetracycline labeling of mice femur at 4 weeks. The red arrow indicates the distance between calcein and tetracycline fluorescence labeling. Bar, 200μm or 100μm. (C). a–f The HE staining of mice femur. Bar, 1mm or 500μm. (D–G). Statistical analysis of bone histological parameters. Error bars stand for mean ± SD (n=5). *P < 0.05. **P < 0.01.***P < 0.001. Abbreviations: ns, no significance; CON, control; MPED, methylprednisolone; MPED+ED-71, methylprednisolone+eldecalcitol; BV/TV, bone volume/tissue volume; Tb.N, trabeculae number; Tb.Th, trabeculae thickness; Tb.Sp, trabeculae separation. |
In CON mice, HE staining depicted that the trabecular bone in the femurs was regularly arranged, with a wide thickness and small spacing (Figure 1C a, d). In contrast, cancellous bone levels in femurs of MPED mice were significantly decreased and accompanied by sparse arrangements, reduced number, and increased separation (Figure 1C b, e). After ED-71 administration, the cancellous bone mass was increased, the number and thickness of bone trabeculae elevated, and the degree of separation decreased, preventing bone loss due to glucocorticoids (Figure 1C c, f).
Statistical analysis of HE staining revealed that BV/TV values in the CON group were the highest, the MPED group values were significantly decreased, and ED-71 group values were in the middle (Figure 1D). The thickness and the number of bone trabeculae were the highest in the CON group and lowest in the MPED group. In contrast, bone trabecular thickness increased in the ED-71 group compared with the MPED group, but the values were not statistically significant (Figure 1E and F). For trabecular separation, the CON group showed the smallest values, the MPED group had the largest, and the MPED+ED-71 group values were in the middle (Figure 1G).
Calcein/tetracycline labeling was used to evaluate new bone deposition rates under dynamic conditions and bone mass and quality. The labeling revealed the new bone deposition thickness in the 10 days between calcein (green) and tetracycline (yellow) injections. The CON group showed the vastest distance and indicated that the newest bone had formed in this group and the highest bone deposition rates (Figure 1B a, d). The MPED group revealed the narrowest distance (Figure 1B b, e), while the MPED+ED-71 group showed accelerated bone deposition rates than the MPED group (Figure 1B c, f).
After eight weeks of DEX administration, micro-CT trends were similar to MPED administration. In contrast, reductions in bone mass were more significant (Figure 2A a-f). HE staining and statistical analyses depicted similar trends in histological alterations and femur microstructure parameters. However, unmineralized cartilage was reduced after eight weeks of treatment, and bone trabeculae had become thinner in all the groups. The recovery effect of DEX+ED-71 on bone mass was weaker in the MPED+ED-71 group (Figure 2C a-f, D–G). Compared with the MPED group, the DEX group showed more significant inhibitory effects on the bone formation rates, while the DEX+ED-71 group also partially restored the bone formation rates (Figure 2B a-f).
 |
Figure 2 Effects of ED-71 on bone quantity and quality in DEX-induced osteoporosis mice. (A). a–f The representative 2D and 3D Micro-CT images of femur in CON, DEX and DEX+ED-71 groups at 8 weeks. (B). a–f Calcein and tetracycline labeling of mice femur at 8 weeks. The red arrow indicates the distance between calcein and tetracycline fluorescence labeling. Bar, 200μm or 100μm. (C). a–f The HE staining of mice femur. Bar, 1mm or 500μm. (D–G). Statistical analysis of bone histological parameters. Error bars stand for mean ± SD (n=5). *P < 0.05. **P < 0.01. ***P < 0.001. Abbreviations: CON, control; DEX, dexamethasone; DEX+ED-71, dexamethasone+eldecalcitol; BV/TV, bone volume/tissue volume; Tb.N, trabeculae number; Tb.Th, trabeculae thickness; Tb.Sp, trabeculae separation. |
ED-71 Promotes Osteoblast Activity and Inhibits Osteoclasts in GIOP Mice
In the CON group, ALP-positive osteoblasts were evenly distributed over the surface of bone trabeculae, while TRAP-positive osteoclasts were scattered (Figure 3A a, d). The ALP-positive osteoblasts were significantly lower in the MPED group than in the CON group, and TRAP-positive osteoclasts were reduced (Figure 3A b, e). Compared with the MPED group, ALP-positive osteoblasts in the MPED+ED-71 group were elevated, but the TRAP-positive osteoclasts were reduced (Figure 3A c, f). Statistical analyses depicted that the CON group showed the highest ALP activity, the MPED group significantly decreased activity, while the MPED+ED-71 group demonstrated partially recovered activity. However, TRAP-positive osteoclasts were successively reduced in CON, MPED, and MPED+ED-71 groups (Figure 3B).
 |
Figure 3 Effects of ED-71 on osteoblasts and osteoclasts in MPED-induced osteoporosis mice. (A). a–f Double staining of ALP&TRAP in CON, MPED and MPED+ED-71 groups at 4 weeks. The black arrows indicated ALP positive osteoblasts and the red arrows indicated TRAP positive osteoclasts. Bar, 200μm or 100μm. (B). The statistical analysis of the mean optical density of ALP and the number of TRAP positive osteoclasts. (C). a–i The representative IHC staining of COL1, RUNX2, and OCN. The black arrows indicated areas of positive expression. Bar, 100μm. (D). The statistical analysis of mean optical density of OCN and integrated optical density of COL1, as well as the number of RUNX2 positive osteoblasts. Data were presented as mean ± SD (n=5). ***P < 0.001. |
Compared with the CON group, COL1 and OCN expression levels decreased in the MPED group, and RUNX2 positive osteoblasts were also reduced (Figure 3C a, b, d, e, g, h). Compared with the MPED group, these indices were increased in the MPED+ED-71 group (Figure 3C c, f, i), and statistical analyses reflected this trend (Figure 3D).
Similarly, after eight weeks of DEX and ED-71 treatment, when compared with the CON group, ALP-positive and TRAP-positive osteoclasts were significantly reduced in the DEX group (Figure 4A a, b, d, e). Compared with the DEX group, ALP-positive osteoblasts in the DEX+ED-71 group had increased, but TRAP-positive osteoclasts decreased (Figure 4A c, f), as reflected by the statistical analyses trend (Figure 4B). For IHC staining, trends were similar to those at four weeks. However, the DEX group displayed reduced COL1 and OCN expression levels and RUNX2 positive osteoblasts compared with the CON group (Figure 4C a, b, d, e, g, h). The DEX+ED-71 group demonstrated specific recovery effects concerning these indicators, but the results were not as significant as those at four weeks (Figure 4C c, f, i). Similarly, statistical analyses reflected this particular trend (Figure 4D).
 |
Figure 4 Effects of ED-71 on osteoblasts and osteoclasts in DEX-induced osteoporosis mice. (A). a–f Double staining of ALP&TRAP in CON, DEX and DEX+ED-71 groups at 8 weeks. The black arrows indicated ALP positive osteoblasts and the red arrows indicated TRAP positive osteoclasts. Bar, 200μm or 100μm. (B). The statistical analysis of the mean optical density of ALP and the number of TRAP positive osteoclasts. (C). a–i The representative IHC staining of COL1, RUNX2, and OCN. The black arrows indicated areas of positive expression. Bar, 100μm. (D). The statistical analysis of mean optical density of OCN and integrated optical density of COL1, as well as the number of RUNX2 positive osteoblasts. Data were presented as mean ± SD (n=5). **P < 0.01. ***P < 0.001. |
ED-71 Partially Restores the Inhibitory Effects of DEX on MC3T3-E1 Cell Differentiation and Mineralization
ALP and AR staining were performed on days 7 and 21 after treatment with DEX and ED-71. ALP staining showed that the ALP activity of osteoblasts in the CON group was very low. However, it increased significantly after the addition of osteoblast-inducing conditional media (OM group). In contrast, ALP activity in the DEX group was significantly inhibited compared to the OM group. ALP activity was partially recovered in the DEX+ED-71 group (Figure 5A). AR staining was utilized to assess calcium deposition, a key marker for osteoblast mineralization. As shown (Figure 5B), when compared with normal cells, AR staining density and mineralized nodules among MC3T3-E1 cells treated with DEX were significantly decreased. In contrast, the DEX+ED-71 group showed significantly elevated mineralized nodules compared to the DEX group (Figure 5B). RT-qPCR analyses revealed that ED-71 treatment significantly elevated osteogenic marker mRNA levels in MC3T3-E1 cells, including ALP, RUNX2, osterix (OSX), OCN, and COL1 (Figure 5C). Western blotting depicted that compared to the CON group, ALP, RUNX2, COL1, and OCN expression was down-regulated in DEX-treated MC3T3-E1 cells, which is consistent at the protein level. In contrast, ED-71 partially restored the protein levels (Figure 5D and E).
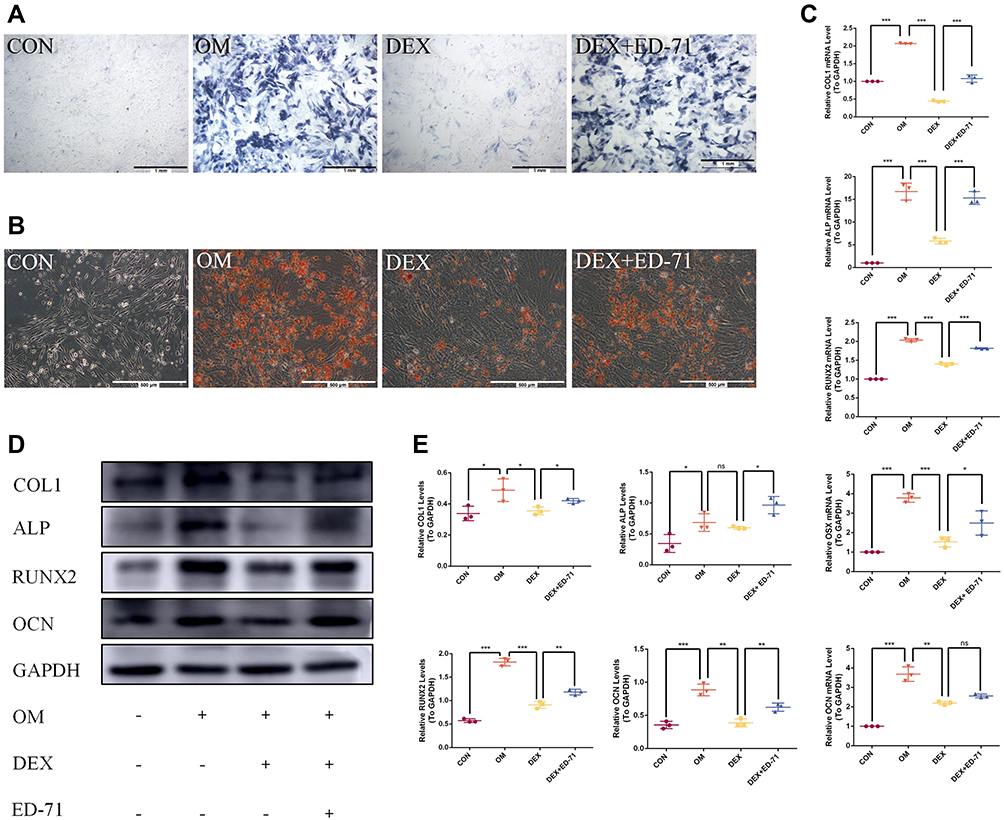 |
Figure 5 Effects of ED-71 on the differentiation and mineralization of DEX-treated MC3T3-E1 cells. (A). ALP staining of MC3T3-E1 cells in CON, OM, DEX, DEX+ED-71 groups at 7 days. Bar, 1mm. (B). AR staining of MC3T3-E1 cells in CON, OM, DEX, DEX+ED-71 groups after 21 days of culture. Bar, 500μm. (C). The mRNA levels of COL1, ALP, RUNX2, OSX, and OCN detected by RT-qPCR after 7 days of culture. GAPDH was used as an internal control. (D). The protein expression of COL1, ALP, RUNX2, OCN, and GAPDH detected by Western blotting after 14 days of culture. (E). The statistical analysis of Western blotting. Data were given as the mean ± S.D. from three independent experiments. *P < 0.05, **P < 0.01. ***P < 0.001. Abbreviations: ns, no significance; CON, control; OM, osteoblast inducing conditional media; DEX, dexamethasone; DEX+ED-71, dexamethasone+eldecalcitol. |
ED-71 Regulates Notch and Wnt/GSK-3β/β-Catenin Pathways in DEX- Inhibited MC3T3-E1 Cells
Immunofluorescence was performed to clarify the molecular mechanism underpinning ED-71-induced osteoblast differentiation to evaluate classical Notch signaling and the Wnt/GSK-3β/β-catenin pathway. Cells cultured in the OM group revealed significantly enhanced β-catenin expression in the nucleus and cytoplasm compared to the CON group. Also, β-catenin expression in the DEX group decreased significantly but was visibly improved in the DEX+ED-71 group (Figure 6A). It was previously demonstrated that ED-71 induced osteoblast differentiation by promoting Wnt/GSK-3β/β-catenin signaling. Regarding Notch signaling, when compared with the CON group, Notch1 fluorescence in the OM group was significantly decreased. In contrast, fluorescence was enhanced in the DEX group. However, it was reversed by ED-71 addition (Figure 6B). Next, Notch1 and β-catenin expression were examined using RT-qPCR and showed β-catenin mRNA expression was elevated and Notch1 mRNA expression was reduced in the OM group. Compared to the OM group, β-catenin mRNA expression decreased in the DEX group, while Notch1 expression increased. Thus, the addition of ED-71 partially counteracted the effects of DEX, generating similar β-catenin and Notch1 levels in the OM group (Figure 6C). Similarly, Western blotting showed higher β-catenin. It lowered Notch1 expression levels in the OM group compared to the CON group. GSK-3β, β-catenin, active β-catenin, Wnt5a, and FZD4 expression levels were down-regulated within the DEX group and accompanied by elevated Notch1 expression. In contrast, the ED-71 group demonstrated restored GSK-3β, β-catenin, active β-catenin, Wnt5a, and FZD4 levels but partially inhibited the Notch levels (Figure 6D and E).
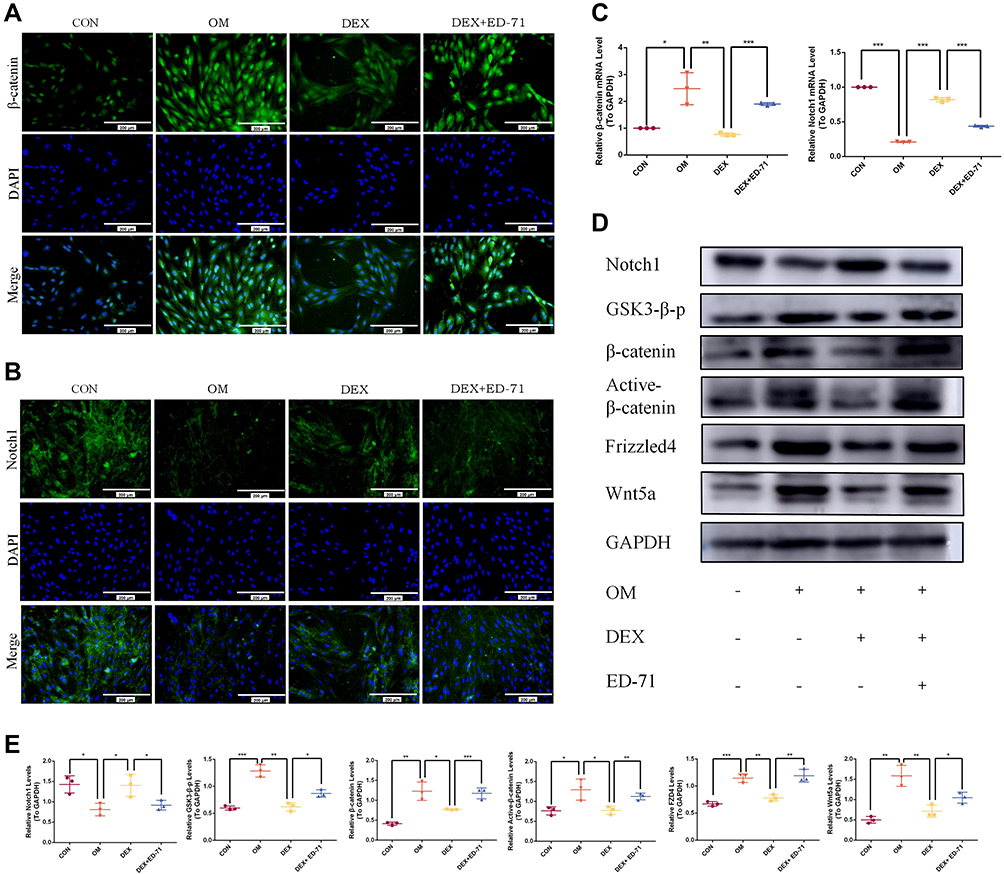 |
Figure 6 ED-71 regulated MC3T3-E1 cells through Notch and Wnt/GSK-3β/β-catenin pathway. (A). The representative immunofluorescence staining images of β-catenin in CON, OM, DEX, DEX+ED-71 groups at 7 days. Bar, 200μm. (B). Notch1 immunofluorescence staining in CON, OM, DEX, DEX+ED-71 groups at 7 days. Bar, 200μm. (C). The mRNA levels of β-catenin and Notch1 detected by RT-qPCR after 7 days of culture. GAPDH was used as an internal control. (D). The protein expression of Wnt5a, FZD4, Active β-catenin, β-catenin, GSK3-β-p, Notch1, and GAPDH detected by Western blotting after 14 days of culture. (E). The statistical analysis of Western blotting. Data were given as the mean ± S.D. from three independent experiments. *P < 0.05, **P < 0.01. ***P < 0.001. Abbreviations: CON, control; OM, osteoblast inducing conditional media; DEX, dexamethasone; DEX+ED-71, dexamethasone+eldecalcitol. |
The Wnt Signaling Inhibitor XAV939 Reverses ED-71 Effects
We used a Wnt signaling inhibitor, XAV939, in our assays to further verify the effects of ED-71 on Wnt/β-catenin signaling. We showed that ALP activity and mineralized nodules were significantly decreased in the DEX+XAV939 group compared to the DEX group (Figure 7A and B). Moreover, XAV939 treatment decreased COL1, ALP, RUNX2, and OCN mRNA levels (Figure 7C) and RUNX2, OCN, active β-catenin, Wnt5a, and FZD4 protein levels (Figure 7D and E). It indicated that Wnt/β-catenin signaling participated in the MC3T3-E1 cell differentiation and mineralization.
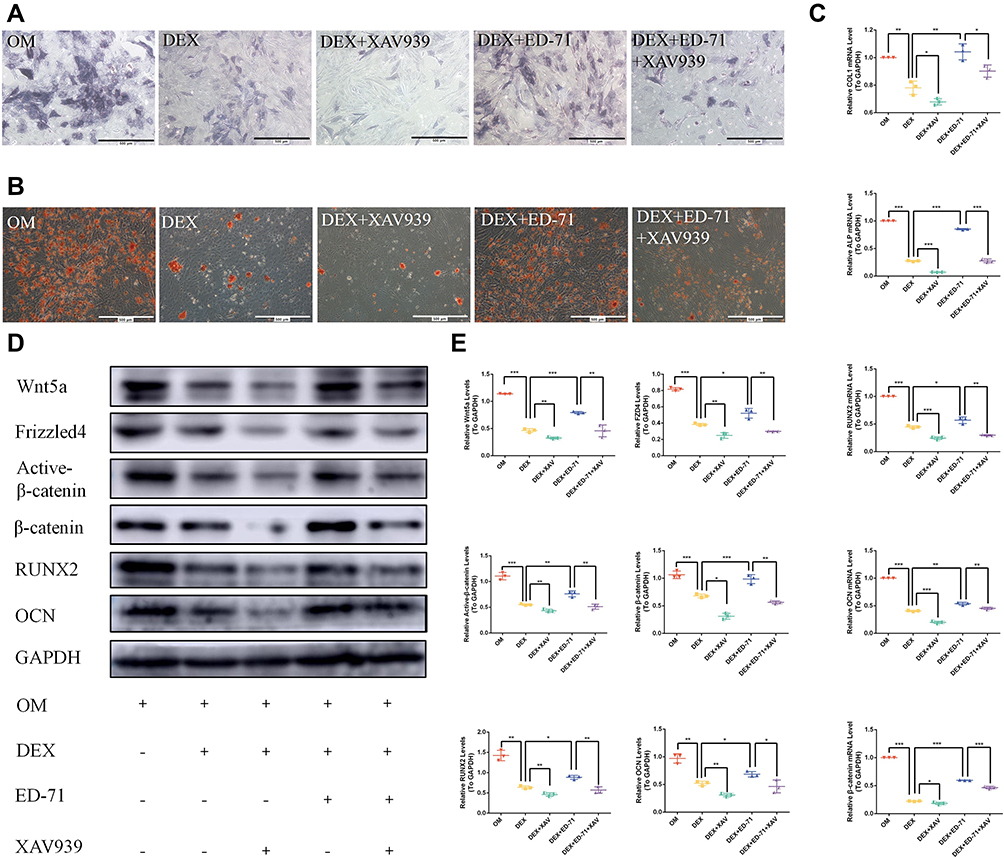 |
Figure 7 The Wnt signaling inhibitor XAV939 reversed the effects of ED-71. (A). ALP staining of MC3T3-E1 cells in OM, DEX, DEX+XAV939, DEX+ ED-71, DEX+ED-71+XAV939 groups at 7 days. Bar, 500μm. (B). AR staining images of these groups after 21 days of culture. Bar, 500μm. (C). The mRNA levels of COL1, ALP, RUNX2, OCN and β-catenin detected by RT-qPCR after 7 days of culture. GAPDH was used as an internal control. (D). Western blotting detection of β-catenin, RUNX2, OCN, Wnt5a, Active β-catenin, FZD4 and GAPDH after 14 days of culture. (E). The statistical analysis of Western blotting. Data were given as the mean ± S.D. from three independent experiments. *P < 0.05, **P < 0.01. ***P < 0.001. Abbreviations: OM, osteoblast inducing conditional media; DEX, dexamethasone; DEX+XAV939, dexamethasone+XAV939; DEX+ED-71, dexamethasone+eldecalcitol; DEX+ED-71+XAV939, dexamethasone+eldecalcitol+XAV939. |
Thus, ALP activity and mineralized nodules decreased in the DEX+ED-71+XAV939 group compared to the DEX+ED-71 group, but the values were still higher than in the DEX+XAV939 group (Figure 7A and B). Moreover, XAV939 treatment decreased COL1, ALP, RUNX2, and OCN mRNA levels (Figure 7C) and RUNX2, OCN, active β-catenin, Wnt5a, and FZD4 protein levels within the DEX+ED-71+XAV939 group, but they were higher than in the DEX+XAV939 group (Figure 7D and E). Therefore, XAV939 partially counteracted the protective effects of ED-71 and indicated that XAV939 reversed the ED-71 effects on osteoblasts due to DEX.
Notch1 Overexpression Reverses ED-71 Effects
After Hes1 was overexpressed, ALP activity and the mineralized nodules in the DEX+Hes1 group became lower compared to the DEX+ED-71 group (Figure 8A and B). Hes1 overexpression decreased the COL1, ALP, RUNX2, and OCN mRNA levels (Figure 8C) and the RUNX2 and OCN protein levels (Figure 8D and E). It suggested that Notch signaling participated in the MC3T3-E1 cell differentiation and mineralization.
 |
Figure 8 Notch1 overexpression reversed the effects of ED-71. (A). ALP staining of MC3T3-E1 cells in OM, DEX, DEX+Hes1, DEX+ ED-71, DEX+ED-71+Hes1 groups at 7 days. Bar, 500μm. (B). AR staining images of these groups after 21 days of culture. Bar, 500μm. (C). The mRNA levels of COL1, ALP, RUNX2, OCN, β-catenin and Hes 1 detected by RT-qPCR after 7 days of culture. GAPDH was used as an internal control. (D). The protein levels of β-catenin, RUNX2, OCN and GAPDH detected by Western blotting after 14 days of culture. (E). The statistical analysis of Western blotting. Data were given as the mean ± S.D. from three independent experiments. *P < 0.05, **P < 0.01. ***P < 0.001. Abbreviations: ns, no significance; OM, osteoblast inducing conditional media; DEX, dexamethasone; DEX+ Hes1, dexamethasone+ Hes1 transfection; DEX+ED-71, dexamethasone+eldecalcitol; DEX+ED-71+ Hes1, dexamethasone+eldecalcitol+ Hes1 transfection. |
ALP activity and mineralized nodules were reduced in the DEX+ED-71+Hes1 group compared to the DEX+ED-71 group. However, the values were still higher when compared with the DEX+Hes1 group (Figure 8A and B). In addition, the COL1, ALP, RUNX2, and OCN mRNA levels (Figure 8C) and the RUNX2 and OCN protein levels were decreased in the DEX+ED-71+Hes1 group but were higher when compared with the DEX+Hes1 group (Figure 8D and E). Thus, Notch activation through Hes1 overexpression reversed ED-71-induced osteoblast differentiation and mineralization in the MC3T3-E1 cells. Moreover, both β-catenin RNA and protein levels decreased after Notch activation (Figure 8C–E), indicating that the Notch pathway negatively regulated the Wnt/β-catenin signaling pathway.
Discussion
In this study, the preventative effects of ED-71 were evaluated on GIOP, ED-71 function was assessed in promoting osteogenic differentiation in a glucocorticoid-stimulated environment, and the underlying signaling mechanisms were explored. Our results suggested that ED-71 prevented GIOP by improving bone mass, quality, and formation rates. These effects were achieved by promoting osteoblast differentiation. One possible action mechanism could be that ED-71 promoted osteoblast differentiation by inhibiting Notch signaling and activating the Wnt/GSK-3β/β-catenin signaling (Figure 9).
 |
Figure 9 ED-71 effectively prevented GIOP by promoting osteogenic differentiation via Notch and Wnt/GSK-3β/β-catenin signaling. ED-71 prevented GIOP by improving bone mass, bone quality, and bone formation rates. One possible action mechanism may be that ED-71 promoted osteoblast differentiation by inhibiting Notch signaling and activating Wnt/GSK-3β/β-catenin signaling. (By Figdraw. www.figdraw.com). |
High glucocorticoid doses and long-term usage can culminate in the common iatrogenic complication, GIOP.2 In this study, we selected two common glucocorticoids (MPED and DEX) to evaluate the effects of glucocorticoids comprehensively and established a mouse GIOP model.33,34 MPED and DEX are relatively short-acting (half-life = 12–36 hours) and long-acting glucocorticoids (half-life = 36–72 hours), respectively.35 In this study, micro-CT, HE staining, and calcein/tetracycline fluorescence labeling of the proximal femur was utilized to identify reduced new bone formation, cortical bone thinning, BV/TV reduction, reduced bone trabecular number and thickness, and the increased degree of separation, after MPED/DEX was used. These results established the damage controlled by glucocorticoids on bone mass and quality, consistent with previous GIOP studies.36 In contrast, ED-71 significantly prevented GIOP progression as manifested by improved bone mass and quality, similar to previous clinical and animal studies showing enhanced GIOP pathology by ED-71.37,38 I Importantly, ED-71 is effective in patients who did not receive prior glucocorticoid therapy.39 We supplemented ED-71 simultaneously as glucocorticoid administration, with our results consistent with this clinical study. Therefore ED-71 could be a good candidate for preventing primary GIOP.
Based on the effects of ED-71 on GIOP, we also analyzed its effects on osteoblast and osteoclast function. ALP is a crucial indicator of osteogenic differentiation and bone formation for osteoblasts.40,41 RUNX2 is a central transcription factor regulating osteoblast differentiation and enhances bone mineralization.42 OCN is considered a marker of osteoblast differentiation during the mineralization stage.43 COL1 is a marker of advanced osteogenic differentiation.44 Our in vivo IHC data revealed that ALP, RUNX2, OCN, and COL1 levels in the femurs of GIOP mice were reduced and treatment with ED-71 significantly elevated this expression. Consistent with in vivo results, ED-71 effectively promoted DEX-inhibited MC3T3-E1 cell differentiation and mineralization. The effects of ED-71 or active vitamin D3 on osteoblasts have been controversial in recent years. Some studies suggested that ED-71 stimulated OVX rat pre-osteoblast differentiation but not their proliferation16 and ED-71 pretreatment enhanced muscle-induced osteoblast differentiation and elevated ALP and COL1 expression in MC3T3-E1 cells.45 Similarly, ED-71 elevated osteogenic differentiation in MC3T3-E1 cells in the presence of osteoclast bone absorption.46 Moreover, ED-71 exerted protective roles on osteoblasts to treat diabetic osteoporosis.17 However, some studies reported that ED-71 alone exerted inhibitory effects against in vitro osteoblasts.46 A study of specific genetic modifications in mice revealed that vitamin D3 had no positive role in bone formation.47 These results were inconsistent with ours, possibly because our study was the first to investigate the ED-71 effects on osteoblasts in the presence of common glucocorticoids. Previously, it was suggested that ED-71 enhanced osteogenic differentiation, affected by different in vivo and in vitro environments.
TRAP has been used as a histochemical marker for osteoclasts.48 Interestingly, we observed that both glucocorticoids (DEX and MPED) TRAP-positive osteoclasts rather than boosting numbers as previously described,32 since glucocorticoids act differentially on osteoclasts during different GIOP development stages.2 Moreover, osteoclasts were inhibited after ED-71 administration, consistent with previous studies. Thus, it is suggested that ED-71 reduces osteoclasts and bone resorption.16,48 Our previous studies and other study have partially revealed the mechanism of ED-71 inhibiting osteoclasts. In short, ED-71 could regulate the ratio of RANKL/OPG, the EphrinB2–EphB4 signaling and the sphingosine-1-phosphate (S1P).14,19,49 The specific mechanism of ED-71 on inhibiting osteoclasts in GIOP is also our next exploration direction.
ED-71 demonstrated distinct promotional effects toward osteogenic differentiation in vivo and in vitro. A comprehensive exploration of molecular mechanisms has been warranted. We focused on the Wnt/β-catenin and Notch signaling pathways. Wnt5a combined with FZD4 has been shown to regulate osteogenic differentiation positively.50,51 Our results showed that ED-71 inhibited Notch signaling, activated Wnt/GSK-3β/β-catenin signaling, and restored the abnormal expression of downstream regulators. Additionally, Wnt/GSK-3β/β-catenin signaling inhibition through a small molecule inhibitor XAV93952 partially eliminated the positive effects of ED-71 against MC3T3-E1 cell differentiation and mineralization. Next, we showed that Notch signaling activation inhibited ED-71-induced osteogenic differentiation by overexpressing the target gene Hes1 of Notch signaling. Furthermore, Notch activation inhibited β-catenin expression, indicating a connection between Notch and Wnt/β-catenin signals. As previously described, glucocorticoids inhibit Wnt signaling in osteoblasts.53 Moreover, Wnt/β-catenin pathway inhibition prohibits GIOP progression.54 Previous studies have reported that Notch signaling inhibited in vitro osteoblast differentiation and led to osteopenia in vivo.55 Thus, low Notch activity is crucial for initiating early osteoblast differentiation and acts oppositely to Wnt during osteoblast to osteoblast transition, and GSK-3β could mediate crosstalk between Notch and Wnt signals.56–58 These results supported our hypothesis that ED-71 specifically exerted its therapeutic effects against GIOP through the Notch and Wnt/GSK-3β/β-catenin pathway. Thus, identifying a signaling mechanism could provide novel ideas for GIOP treatment and generate targets for drug development.
However, as GIOP exhibits dynamic pathogenesis, our study had some limitations regarding the time points used. Thus, more comprehensive studies need to be conducted in the future. In addition, ED-71 only partially offsets glucocorticoid damage to bone mass and bone quality. Therefore, combining ED-71 and other drugs could achieve better patient therapeutic outcomes. This is an important future direction for our research. Furthermore, ED-71 was supplemented simultaneously with glucocorticoids, so it will be worth studying if ED-71 reverses the phenomenon among GIOP models with bone loss.
In conclusion, we provided strong evidence that ED-71 prevented GIOP progression, and this process was closely associated with osteogenic differentiation. ED-71 also enhanced osteoblast differentiation by inhibiting the Notch signaling and activating the Wnt/GSK-3β/β-catenin pathway. Therefore, the use of ED-71 for GIOP treatment has considerable clinical research value and provides significant drug developmental prospects in the future.
Ethical Approval
All the animal procedures were performed in accordance with the Guidelines for Care and Use of Laboratory Animals of the National Institutes of Health. All animal experiments were approved by the Institutional Animal Care and Use Committee (IACUC), School and Hospital of Stomatology, Shandong University (No. 20210915).
Author Contributions
All authors made a significant contribution to the work reported, whether that is in the conception, study design, execution, acquisition of data, analysis and interpretation, or in all these areas; took part in drafting, revising or critically reviewing the article; gave final approval of the version to be published; have agreed on the journal to which the article has been submitted; and agree to be accountable for all aspects of the work.
Funding
This study was partially supported by the National Natural Science Foundation of China (No. 81972072) to Li M, the National Natural Science Foundation of China (No. 81800982), the Construction Engineering Special Fund of “Taishan Young Scholars” of Shandong Province (No. tsqn202103177) to Liu H. Besides, Minqi Li received consulting fees from Chugai Pharma China Co., Ltd.
Disclosure
The authors report that they have received grant from Chugai Pharma China Co., Ltd. Minqi Li received consulting fees from Chugai Pharma China Co., Ltd.
References
1. Compston J. Glucocorticoid-induced osteoporosis: an update. Endocrine. 2018;61(1):7–16. doi:10.1007/s12020-018-1588-2
2. Chotiyarnwong P, McCloskey EV. Pathogenesis of glucocorticoid-induced osteoporosis and options for treatment. Nat Rev Endocrinol. 2020;16(8):437–447. doi:10.1038/s41574-020-0341-0
3. Peng CH, Lin WY, Yeh KT, Chen IH, Wu WT, Lin MD. The molecular etiology and treatment of glucocorticoid-induced osteoporosis. Tzu Chi Med J. 2021;33(3):212–223. doi:10.4103/tcmj.tcmj_233_20
4. Chiodini I, Merlotti D, Falchetti A, Gennari L. Treatment options for glucocorticoid-induced osteoporosis. Expert Opin Pharmacother. 2020;21(6):721–732. doi:10.1080/14656566.2020.1721467
5. Cheng CH, Chen LR, Chen KH. Osteoporosis due to hormone imbalance: an overview of the effects of estrogen deficiency and glucocorticoid overuse on bone turnover. J Mol Sci. 2022;23(3):1376. doi:10.3390/ijms23031376
6. Han Y, Zhang L, Xing Y, et al. Autophagy relieves the function inhibition and apoptosis‑promoting effects on osteoblast induced by glucocorticoid. Int J Mol Med. 2018;41(2):800–808. doi:10.3892/ijmm.2017.3270
7. Gado M, Baschant U, Hofbauer LC, Henneicke H. Bad to the bone: the effects of therapeutic glucocorticoids on osteoblasts and osteocytes. Front Endocrinol. 2022;13:835720. doi:10.3389/fendo.2022.835720
8. Kobza AO, Herman D, Papaioannou A. Understanding and managing corticosteroid-induced osteoporosis. Res Rev. 2021;13:177–190.
9. Leipe J, Holle JU, Weseloh C, Pfeil A, Krüger K. German society of rheumatology recommendations for management of glucocorticoid-induced osteoporosis. Z Rheumatol. 2021;80(Suppl 2):49–63. doi:10.1007/s00393-021-01025-z
10. Christakos S, Dhawan P, Verstuyf A, Verlinden L, Carmeliet G. Vitamin D: metabolism, molecular mechanism of action, and pleiotropic effects. Physiol Rev. 2016;96(1):365–408. doi:10.1152/physrev.00014.2015
11. Saito K, Miyakoshi N, Matsunaga T, Hongo M, Kasukawa Y, Shimada Y. Eldecalcitol improves muscle strength and dynamic balance in postmenopausal women with osteoporosis: an open-label randomized controlled study. J Bone Miner Metab. 2016;34(5):547–554. doi:10.1007/s00774-015-0695-x
12. Shintani T, Rosli SNZ, Takatsu F, et al. Eldecalcitol (ED-71), an analog of 1α,25-dihydroxyvitamin D3 as a potential anti-cancer agent for oral squamous cell carcinomas. J Steroid Biochem Mol Biol. 2016;164:79–84. doi:10.1016/j.jsbmb.2015.09.043
13. Liu H, Wang G, Wu T, Mu Y, Gu W. Efficacy and safety of eldecalcitol for osteoporosis: a meta-analysis of randomized controlled trials. Front Endocrinol. 2022;13:854439. doi:10.3389/fendo.2022.854439
14. Zhang Y, Kou Y, Yang P, et al. ED-71 inhibited osteoclastogenesis by enhancing EphrinB2-EphB4 signaling between osteoclasts and osteoblasts in osteoporosis. Cell Signal. 2022;96:110376. doi:10.1016/j.cellsig.2022.110376
15. Takeda S, Saito M, Sakai S, Yogo K, Marumo K, Endo K. Eldecalcitol, an active vitamin D(3) derivative, prevents trabecular bone loss and bone fragility in type I diabetic model rats. Calcif Tissue Int. 2017;101(4):433–444. doi:10.1007/s00223-017-0298-8
16. de Freitas PH, Hasegawa T, Takeda S, et al. Eldecalcitol, a second-generation vitamin D analog, drives bone minimodeling and reduces osteoclastic number in trabecular bone of ovariectomized rats. Bone. 2011;49(3):335–342. doi:10.1016/j.bone.2011.05.022
17. Lu Y, Liu S, Yang P, et al. Exendin-4 and eldecalcitol synergistically promote osteogenic differentiation of bone marrow mesenchymal stem cells through M2 macrophages polarization via PI3K/AKT pathway. Stem Cell Res Ther. 2022;13(1):113. doi:10.1186/s13287-022-02800-8
18. Wang W, Gao Y, Liu H, et al. Eldecalcitol, an active vitamin D analog, effectively prevents cyclophosphamide-induced osteoporosis in rats. Exp Ther Med. 2019;18(3):1571–1580. doi:10.3892/etm.2019.7759
19. Han X, Du J, Liu D, Liu H, Amizuka N, Li M. Histochemical examination of systemic administration of eldecalcitol combined with guided bone regeneration for bone defect restoration in rats. J Mol Histol. 2017;48(1):41–51. doi:10.1007/s10735-016-9705-0
20. Matsumoto T, Yamamoto K, Takeuchi T, et al. Eldecalcitol is superior to alfacalcidol in maintaining bone mineral density in glucocorticoid-induced osteoporosis patients (e-GLORIA). J Bone Miner Metab. 2020;38(4):522–532. doi:10.1007/s00774-020-01091-4
21. Zanotti S, Smerdel-Ramoya A, Canalis E. HES1 (hairy and enhancer of split 1) is a determinant of bone mass. J Biol Chem. 2011;286(4):2648–2657. doi:10.1074/jbc.M110.183038
22. Lee SY, Long F. Notch signaling suppresses glucose metabolism in mesenchymal progenitors to restrict osteoblast differentiation. J Clin Invest. 2018;128(12):5573–5586. doi:10.1172/JCI96221
23. Xu Y, Li L, Tang Y, Yang J, Jin Y, Ma C. Icariin promotes osteogenic differentiation by suppressing Notch signaling. Eur J Pharmacol. 2019;865:172794. doi:10.1016/j.ejphar.2019.172794
24. Pereira RM, Delany AM, Durant D, Canalis E. Cortisol regulates the expression of Notch in osteoblasts. J Cell Biochem. 2002;85(2):252–258. doi:10.1002/jcb.10125
25. Baron R, Gori F. Targeting WNT signaling in the treatment of osteoporosis. Curr Opin Pharmacol. 2018;40:134–141. doi:10.1016/j.coph.2018.04.011
26. Zhang Y, Wang Y, Zheng G, et al. Follistatin-like 1 (FSTL1) interacts with Wnt ligands and Frizzled receptors to enhance Wnt/β-catenin signaling in obstructed kidneys in vivo. J Biol Chem. 2022;298(7):102010. doi:10.1016/j.jbc.2022.102010
27. Pan FF, Shao J, Shi CJ, Li ZP, Fu WM, Zhang JF. Apigenin promotes osteogenic differentiation of mesenchymal stem cells and accelerates bone fracture healing via activating Wnt/β-catenin signaling. Am J Physiol Endocrinol Metab. 2021;320(4):E760–e771. doi:10.1152/ajpendo.00543.2019
28. Karsenty G, Olson EN. Bone and muscle endocrine functions: unexpected paradigms of inter-organ communication. Cell. 2016;164(6):1248–1256. doi:10.1016/j.cell.2016.02.043
29. Ye YC, Zhao JL, Lu YT, et al. Notch signaling via WNT regulates the proliferation of alternative, CCR2-independent tumor-associated macrophages in hepatocellular carcinoma. Cancer Res. 2019;79(16):4160–4172. doi:10.1158/0008-5472.CAN-18-1691
30. Wu D, Pan W. GSK3: a multifaceted kinase in Wnt signaling. Trends Biochem Sci. 2010;35(3):161–168. doi:10.1016/j.tibs.2009.10.002
31. Shao J, Zhou Y, Xiao Y. The regulatory roles of Notch in osteocyte differentiation via the crosstalk with canonical Wnt pathways during the transition of osteoblasts to osteocytes. Bone. 2018;108:165–178. doi:10.1016/j.bone.2018.01.010
32. Wang Y, Chen J, Chen J, et al. Daphnetin ameliorates glucocorticoid-induced osteoporosis via activation of Wnt/GSK-3β/β-catenin signaling. Toxicol Appl Pharmacol. 2020;409:115333. doi:10.1016/j.taap.2020.115333
33. Lian WS, Ko JY, Chen YS, et al. Chaperonin 60 sustains osteoblast autophagy and counteracts glucocorticoid aggravation of osteoporosis by chaperoning RPTOR. Cell Death Dis. 2018;9(10):938. doi:10.1038/s41419-018-0970-6
34. Lin NY, Chen CW, Kagwiria R, et al. Inactivation of autophagy ameliorates glucocorticoid-induced and ovariectomy-induced bone loss. Ann Rheum Dis. 2016;75(6):1203–1210. doi:10.1136/annrheumdis-2015-207240
35. Hemani SA, Glover B, Ball S, et al. Dexamethasone versus prednisone in children hospitalized for acute asthma exacerbations. Hosp Pediatr. 2021;11(11):1263–1272. doi:10.1542/hpeds.2020-004788
36. Briot K, Roux C. Glucocorticoid-induced osteoporosis. RMD Open. 2015;1(1):e000014. doi:10.1136/rmdopen-2014-000014
37. Tanaka Y, Nakamura T, Nishida S, et al. Effects of a synthetic vitamin D analog, ED-71, on bone dynamics and strength in cancellous and cortical bone in prednisolone-treated rats. J Bone Miner Res. 1996;11(3):325–336. doi:10.1002/jbmr.5650110306
38. Kinoshita H, Miyakoshi N, Kasukawa Y, et al. Effects of eldecalcitol on bone and skeletal muscles in glucocorticoid-treated rats. J Bone Miner Metab. 2016;34(2):171–178. doi:10.1007/s00774-015-0664-4
39. Nakamura T, Takano T, Fukunaga M, Shiraki M, Matsumoto T. Eldecalcitol is more effective for the prevention of osteoporotic fractures than alfacalcidol. J Bone Miner Metab. 2013;31(4):417–422. doi:10.1007/s00774-012-0418-5
40. Yang L, Yang J, Pan T, Zhong X. Liraglutide increases bone formation and inhibits bone resorption in rats with glucocorticoid-induced osteoporosis. J Endocrinol Invest. 2019;42(9):1125–1131. doi:10.1007/s40618-019-01034-5
41. Vimalraj S. Alkaline phosphatase: structure, expression and its function in bone mineralization. Gene. 2020;754:144855. doi:10.1016/j.gene.2020.144855
42. Hou Z, Wang Z, Tao Y, et al. KLF2 regulates osteoblast differentiation by targeting of Runx2. Lab Invest. 2019;99(2):271–280. doi:10.1038/s41374-018-0149-x
43. Mizokami A, Kawakubo-Yasukochi T, Hirata M. Osteocalcin and its endocrine functions. Biochem Pharmacol. 2017;132:1–8. doi:10.1016/j.bcp.2017.02.001
44. Viguet-Carrin S, Garnero P, Delmas PD. The role of collagen in bone strength. Osteoporos Int. 2006;17(3):319–336. doi:10.1007/s00198-005-2035-9
45. Tanaka K, Kanazawa I, Yamaguchi T, Yano S, Kaji H, Sugimoto T. Active vitamin D possesses beneficial effects on the interaction between muscle and bone. Biochem Biophys Res Commun. 2014;450(1):482–487. doi:10.1016/j.bbrc.2014.05.145
46. Bu J, Du J, Shi L, et al. Eldecalcitol effects on osteoblastic differentiation and function in the presence or absence of osteoclastic bone resorption. Exp Ther Med. 2019;18(3):2111–2121. doi:10.3892/etm.2019.7784
47. Bemenderfer TB, Harris JS, Condon KW, Li J, Kacena MA. Processing and sectioning undecalcified murine bone specimens. Methods Mol Biol. 2021;2230:231–257.
48. Takahashi N. Mechanism of inhibitory action of eldecalcitol, an active vitamin D analog, on bone resorption in vivo. J Steroid Biochem Mol Biol. 2013;136:171–174. doi:10.1016/j.jsbmb.2012.11.010
49. Kikuta J, Kawamura S, Okiji F, et al. Sphingosine-1-phosphate-mediated osteoclast precursor monocyte migration is a critical point of control in antibone-resorptive action of active vitamin D. Proc Natl Acad Sci USA. 2013;110(17):7009–7013. doi:10.1073/pnas.1218799110
50. Mi B, Yan C, Xue H, et al. Inhibition of circulating miR-194-5p reverses osteoporosis through Wnt5a/β-catenin-dependent induction of osteogenic differentiation. Mol Ther Nucleic Acids. 2020;21:814–823. doi:10.1016/j.omtn.2020.07.023
51. Gu Q, Tian H, Zhang K, et al. Wnt5a/FZD4 mediates the mechanical stretch-induced osteogenic differentiation of bone mesenchymal stem cells. Cell Physiol Biochem. 2018;48(1):215–226. doi:10.1159/000491721
52. Stakheev D, Taborska P, Strizova Z, Podrazil M, Bartunkova J, The SD. WNT/β-catenin signaling inhibitor XAV939 enhances the elimination of LNCaP and PC-3 prostate cancer cells by prostate cancer patient lymphocytes in vitro. Sci Rep. 2019;9(1):4761. doi:10.1038/s41598-019-41182-5
53. Almeida M, Han L, Ambrogini E, Weinstein RS, Manolagas SC. Glucocorticoids and tumor necrosis factor α increase oxidative stress and suppress Wnt protein signaling in osteoblasts. J Biol Chem. 2011;286(52):44326–44335. doi:10.1074/jbc.M111.283481
54. Sato AY, Cregor M, Delgado-Calle J, et al. Protection from glucocorticoid-induced osteoporosis by anti-catabolic signaling in the absence of sost/sclerostin. J Bone Miner Res. 2016;31(10):1791–1802. doi:10.1002/jbmr.2869
55. Dong Y, Jesse AM, Kohn A, et al. RBPjkappa-dependent Notch signaling regulates mesenchymal progenitor cell proliferation and differentiation during skeletal development. Development. 2010;137(9):1461–1471. doi:10.1242/dev.042911
56. Brack AS, Conboy IM, Conboy MJ, Shen J, Rando TA. A temporal switch from notch to Wnt signaling in muscle stem cells is necessary for normal adult myogenesis. Cell Stem Cell. 2008;2(1):50–59. doi:10.1016/j.stem.2007.10.006
57. Boulter L, Govaere O, Bird TG, et al. Macrophage-derived Wnt opposes Notch signaling to specify hepatic progenitor cell fate in chronic liver disease. Nat Med. 2012;18(4):572–579. doi:10.1038/nm.2667
58. Takebe N, Miele L, Harris PJ, et al. Targeting Notch, Hedgehog, and Wnt pathways in cancer stem cells: clinical update. Nat Rev Clin Oncol. 2015;12(8):445–464. doi:10.1038/nrclinonc.2015.61
 © 2022 The Author(s). This work is published and licensed by Dove Medical Press Limited. The full terms of this license are available at https://www.dovepress.com/terms.php and incorporate the Creative Commons Attribution - Non Commercial (unported, v3.0) License.
By accessing the work you hereby accept the Terms. Non-commercial uses of the work are permitted without any further permission from Dove Medical Press Limited, provided the work is properly attributed. For permission for commercial use of this work, please see paragraphs 4.2 and 5 of our Terms.
© 2022 The Author(s). This work is published and licensed by Dove Medical Press Limited. The full terms of this license are available at https://www.dovepress.com/terms.php and incorporate the Creative Commons Attribution - Non Commercial (unported, v3.0) License.
By accessing the work you hereby accept the Terms. Non-commercial uses of the work are permitted without any further permission from Dove Medical Press Limited, provided the work is properly attributed. For permission for commercial use of this work, please see paragraphs 4.2 and 5 of our Terms.