")
Back to Journals » ClinicoEconomics and Outcomes Research » Volume 7
Economic value of in vitro fertilization in Ukraine, Belarus, and Kazakhstan
Authors Mandrik O, Knies S, Severens J
Received 18 December 2014
Accepted for publication 18 February 2015
Published 12 June 2015 Volume 2015:7 Pages 347—356
DOI https://doi.org/10.2147/CEOR.S79513
Checked for plagiarism Yes
Review by Single anonymous peer review
Peer reviewer comments 4
Editor who approved publication: Professor Giorgio L Colombo
Olena Mandrik,1 Saskia Knies,1,2 Johan L Severens1,3
1Institute of Health Policy and Management, Erasmus University, Rotterdam, 2National Health Care Institute, Diemen, 3iMTA Institute of Medical Technology Assessment, Erasmus University, Rotterdam, the Netherlands
Background: An economic value calculation was performed to estimate the lifetime net present value of in vitro fertilization (IVF) in Ukraine, Belarus, and Kazakhstan.
Methods: Net lifetime tax revenues were used to represent governmental benefits accruing from a hypothetical cohort of an IVF population born in 2009 using the methodology of generational accounting. Governmental expenses related to this population included social benefits, education and health care, unemployment support, and pensions. Where available, country-specific data referencing official sources were applied.
Results: The average health care cost needed to achieve one additional birth from the governmental perspective varied from $2,599 in Ukraine to $5,509 in Belarus. The net present value from the population born using IVF was positive in all countries: for Ukraine ($9,839), Belarus ($21,702), and Kazakhstan ($2,295). The break-even costs of drugs and supplies per IVF procedure is expected to be $3,870, $8,530, and $1,780, respectively. Probabilistic sensitivity analyses based on 5,000 simulations show that the average net present value per person remains positive: $1,894±$7,619, $27,925±$12,407, and $17,229±$24,637 in Ukraine, Belarus, and Kazakhstan, respectively.
Conclusion: Financing IVF may represent a good investment in terms of governmental financial returns, even in lower-income countries with state-financed health care systems such as Ukraine, Belarus, and Kazakhstan.
Keywords: in vitro fertilization, economic value of life, developing countries
Introduction
Infertility is a common problem in many countries. In Central and Eastern European and Central Asian regions, countries report high rates of abortion, while at the same time displaying higher levels of secondary infertility (females with previous life births). Additionally, the prevalence of primary infertility (females with no previous life births) is significantly higher in Ukraine than in other countries of the region, reaching a level of ≥3% of the female population.1
Despite an increasing medical demand for infertility treatments, public funding challenges for in vitro fertilization (IVF) exist in a number of jurisdictions. While some countries (such as France, Spain, and Israel) provide full coverage of IVF treatments as a matter of policy, others either partially cover expenses (eg, Portugal, Sweden, Turkey), or fail to cover it at all (eg, India, the People’s Republic of China).2 Meanwhile, when coverage for IVF is absent or incomplete, as is the case throughout the USA, it may lead to cases where IVF treatments are unaffordable to couples who need it most. Moreover, and of particular interest from a governmental perspective, a number of economic studies have concluded that there are long-term financial benefits to be gained from creating new citizens who will eventually become future taxpayers. The cost-efficiency of state investments in IVF is assessed by calculation of net income, usually expressed through taxes and other state revenues received from the working population. Economic evaluations revealed that there were net tax benefits of IVF financing in both high-income countries (eg, the USA, UK, Denmark, Sweden)3–7 and medium-income countries like Brazil.8 Net income gained from the IVF populations in all countries studied was positive; however, the largest gain was found for the UK (£109,939), while the smallest gain was found for Brazil (US$ 61,428).
While encouraging, these results may not be easily used in the decision-making process in other countries,9 such as those of the Central and Eastern European region. Besides putative differences in health care systems and population characteristics, the country’s wealth must be taken into account when considering the efficiency of medical technologies. For example, in lower-income countries, costly medical technologies potentially may be less cost-efficient than they would be in higher-income countries. Countries of the Central and Eastern European region have, on average, a much lower gross domestic product (GDP) than their Western European or North American counterparts; thus, the generalizability may be questionable for economic studies on IVF subsidies from high-income countries (like the USA and UK) to lower-income jurisdictions.
Finally, the economic impact for the population (expressed as the difference between state spending and economic benefits), may not be directly proportional to the GDP, depending more on internal policy of the country, such as tax level, social contributions, net revenues from public enterprises, and so on. Thus, financing of IVF also may be cost-efficient for governments of countries with relatively low GDP per capita level. For example, while having universal health care coverage and free access to medical procedures for their respective populations, governments in former Soviet Union countries (such as Ukraine, Belarus, Kazakhstan) do not consider IVF a priority, so provide only limited, insufficient funds for its coverage. However, economic analysis may be a justification for reexamining their policies where IVF coverage is concerned.
With the above discussion as a rationale, the present study was conducted to: assess the economic cost and benefits of financing IVF technologies (one cycle per woman) in Ukraine, Belarus, and Kazakhstan from the governmental perspective; explore relationships between GDP per capita and level of financial impact on the population; and address transferability of the received results to other countries of the Central and Eastern European region.
Materials and methods
Model design
Similar to previous studies, an economic model using the methodology of generational accounting was developed to estimate for Ukraine, Belarus, and Kazakhstan whether publicly funded IVF treatments result in a financial benefit, by calculating the net revenue gained from a child conceived via IVF in each country.3–8 Generational accounting evaluates whether there will be sufficient tax revenue in the future to pay for current investments into IVF programs by calculating the net present value (NPV) of lifetime net taxes (gross taxes minus financial expenditures of the government on population). Because taxation remains the main source of revenue for most states,5 using this applied approach provides an appropriate assessment of rationality for IVF investments by the governments.
In the model we defined five stages during which populations have different expenses and revenues: prenatal; early childhood (from birth until school); late childhood (period when individual receives education including high school); employment; and retirement. The prenatal stage includes costs of IVF procedures. During the childhood stage the cohort is a receiver of financial flows from the state that consists of social support, sick leave payments, medical help, and education financing. During the employment period, the population provides revenue to the state in the form of tax payments, but also receives unemployment support and medical help. After retirement, the employment rate decreases, likewise tax contribution, but pension and health care are provided until the end of life. For each age category, state spending and income from population are calculated.
Similar to Connolly et al4–6 and Kröger and Ejzenberg,8 the following formula was applied for assessing the NPV of lifetime net taxes:
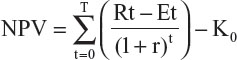
where Rt is the sum of the governmental revenues from individual’s age t; Et is the sum of the governmental expenditures from individual’s age t; r is the discount rate; T is life expectancy; and K0 is the direct costs of IVF.
As NPV is used to estimate how much future returns from the investment are worth today, NPV >0 represents profitable investment, NPV =0 represents investment that is neither profitable nor unprofitable, and NPV <0 represents unprofitable investment.7
IVF costs and outcome
Base-case scenario
Applying IVF success rates, the costs per IVF-born cohort and cost per live birth is calculated. Because Belarus-specific data for this parameter were not available, it was assumed in the base case that the success of IVF was equal in all three countries to 31.9% on average (success rate of IVF for 35- to 37-year-old women based on the data from the Society for Assisted Reproductive Technology summary report on 154,412 cycles conducted in 2011).10 The percentage of boys born as a result of intervention was assumed to be equal to the naturally born cohort and was assessed from data on sex ratios (51.70%, 51.5%, and 48.5% boys for born in Ukraine, Belarus, and Kazakhstan, respectively).11–13
Country-specific state-registered prices were used to assess costs of drugs and medical supplies, while the need in quantities of the defined medical products per one IVF cycle was assessed from the national state reproductive program in Ukraine (and considered to be similar for Belarus and Kazakhstan).14–16
Despite all three countries providing universal free health care, country-specific pregnancy-related costs are unknown and, for this reason, medical care expenditures were accounted using costs per outpatient (during IVF procedures and pregnancy) and inpatient (delivery) visits by WHO-CHOICE estimates.17 The average number of visits during one IVF cycle was calculated assuming the following referrals: first appointment (one visit), preparation (one visit), initiation (one visit), visits during treatment with fertility medications (five visits), egg harvesting (one visit), embryo transfer (one visit), consultation (one visit). Nine monthly visits to gynecologists and three hospitalization days were accounted for during pregnancy and delivery.
Although IVF procedures frequently result in multiple births, only one-child pregnancy was assumed in the base-case scenario. Moreover, while during the early perinatal stage IVF children may require more medical assistance, in the life-duration model used here children conceived with IVF were considered to be comparable with those conceived naturally.
Country-specific scenario
IVF success data and rates of multiple deliveries due to IVF were used to understand if these country-specific parameters have a significant impact on the results. The following assumptions were used in this scenario:
- The birth rate from the IVF procedure was calculated from data on IVF success rate and multiple pregnancies from the study conducted by Kupka et al18
- Because of the low incidence of triple births (1% for both Ukraine and Kazakhstan)18 this parameter was accounted together with dual births
- Because no Belarus-specific data were available, the rate of births due to IVF was calculated as an average in Russia, Belarus, and Kazakhstan18
- Negative health impact and higher costs associated with multiple pregnancies included the following: higher probability of dying during neonatal the period (6.4 times);19 higher medical costs during the 1st year of life (the calculated cost ratio between single and dual births, 3.29);19 and doubled payments for “maternity support” because of multiple births.
Government transfers
In all three analyzed countries, child benefits are provided to the families of newborns. The first-child allowance was accounted in all of the cases, as it was considered that IVF is applied by childless families. It was also considered that one parent is not employed, thus receives monthly financial support for 3 years in Belarus ($82.10 per month) and Ukraine ($16.26 per month) and for 1 year in Kazakhstan ($214.2 per month) as ensured by state policies in these countries (estimation was made by the data of the Labor informational resource [http://mojazarplata.by; http://mojazarplata.kz; mojazarplata.com.ua]). Basing estimates on data from accounting departments in three companies (two in Ukraine and one in Kazakhstan, 485 employees total), it was considered that mothers spend 15 sick leave days paid by the government annually per child aged 3–6 years and 10 days per child aged 7–12 years.
In the model, people receive health care services throughout their lives and educational services from 0 to 19 years. Average expenses of governmental support for unemployed were calculated using official unemployment rates among population of working age, coverage with financial support for unemployed, duration of unemployment, and the amount of financial support.
From retirement until death, the population receives a pension from the government. Because data on disability prevalence were unavailable, no additional costs besides those associated with regular health care were accounted.
State income
Government revenue accrues from income tax on population of working age or from the aged population who continue to work and pay taxes. As no age-stratified income is available for the study countries, average salary and tax rates were applied for the entire lifetime of the cohort.
Though governments receive additional revenue from other sources (eg, land taxes, business and enterprise payments, social contributions), income taxes are argued to be the largest part of state revenues; therefore, the impact of population increase on state income was assessed as direct taxes from salaries on official employment. No country-specific data were available bearing on a relationship between age and income, thus average salaries, taxes, and employment rates were applied to calculate the income from the working-age population. Moreover, a percentage of the retired population who are officially employed was used to calculate additional income from this group.
Other input parameters of the model
Life expectancy at birth for children born in 2009 was applied.20 All costs provided in the national currencies were transferred into US$ according to the national bank exchange rates on November 22, 2014. Rate per 1$ was equal to 15.096 UAH (Ukraine), 10,780.00 BYR (Belarus), and 180.87 KZT (Kazakhstan). State expenses before birth of the IVF cohort were adjusted to current prices (2014) using the inflation index for consumer prices.21 Governmental payments and incomes were assumed to grow annually with the rate of annual GDP growth22 while being discounted at 3% in the deterministic model. The complete list of model input parameters together with a full reference list are provided in Table S1.
Validity of the model
The parameters possible for state regulation were varied in one-way sensitivity analysis with break-even costs calculation. Subcategory analysis for women of different age categories presenting variations in IVF success rates was conducted to analyze an impact of IVF success rate on the results of economic analysis and, moreover, to assess the possible implication of limiting financing for different groups. As drug costs are frequently negotiable, the impact of changes in IVF expenses on NPV was assessed. Additionally, one-way sensitivity analyses with 0%–10% discounting was conducted.
Probabilistic sensitivity analysis (PSA) on the most influential parameters with 5,000 simulations was conducted to ensure the validity of the calculation. Because the aim of PSA was to assess the uncertainty related to long duration of the model (cohort lifetime), the prenatal parameters which potentially can be controlled by the government (ie, age of mother and IVF costs) were excluded from this assessment. Moreover, the IVF success rate was varied in the PSA to address the uncertainty of the success of the procedure. Costs included in the early childhood period were not varied in PSA because of the low impact on a lifetime model and no data on deviation parameters. A number of prognostic factors (such as a possible tax decrease in Ukraine, prolongation of the retirement age to the average in the Organisation for Economic Co-operation and Development region for all three countries) were assessed from publicly available information sources describing current political trends that may affect model results. Because health care expenditures already are relatively low in the study countries, it was assumed they may only increase from current values or remain the same. If multiple data sources were available, the source providing the largest data deviation was used. The complete range of parameters and distributions used in the PSA are presented in Table S1.
Results
The observed cost variation for different schemes of IVF cycles applied resulted in a difference in average cost per cycle, with the lowest one observed in Ukraine ($732 per cycle) and the highest one in Belarus ($1,607 per cycle). Using a similar IVF success rate, the average cost of one IVF birth from the governmental perspective varied from $2,599 in Ukraine to $5,509 in Belarus (Table 1).
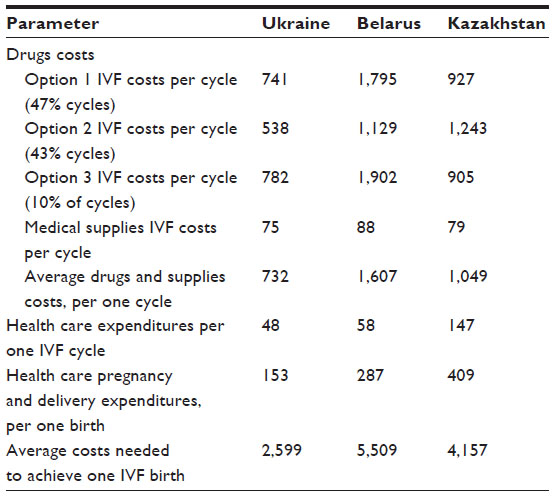 | Table 1 Neonatal costs of IVF population in Ukraine, Belarus, and Kazakhstan (US$) |
Projected lifetime net revenues from the IVF cohort are illustrated in Figure 1, where changes in NPV depending on the age of the IVF cohort are observed. While in the early stages of an individual’s life, net monetary flows are negative for the government since education, health and social support are provided to the family by state without financial returns, during the working years, the individual’s financial balance tips positive for the government, as state revenue is collected as tax payments and lower social expenses are paid. Advancing in age, individuals begin to provide less revenue to the state while simultaneously receiving increased social spending, primarily because of pension payments. Because the net revenue positions for an IVF-conceived and a naturally-conceived child follow similar trajectories, where the only difference between the two is the additional cost of IVF investment required for conception, Figure 1 presents the NPV for an IVF-conceived individual only. In light of the observed difference in expenses on population in the three study countries, IVF may be considered an attractive economic option in Ukraine, Belarus, and Kazakhstan, with discounted NPVs of $9,839, $21,702, and $2,295, respectively (Table 2). When country-specific IVF birth rates were applied in the model considering both IVF success rate and multiple pregnancies (Table 2), the results did not change significantly. A possible explanation for the small impact of higher-cost IVF children stems from the positive economic impact of the individual in general. As such, higher frequency of multiple births in IVF population compensates for the additional expenses related to IVF newborns and the higher mortality during neonatal stage.
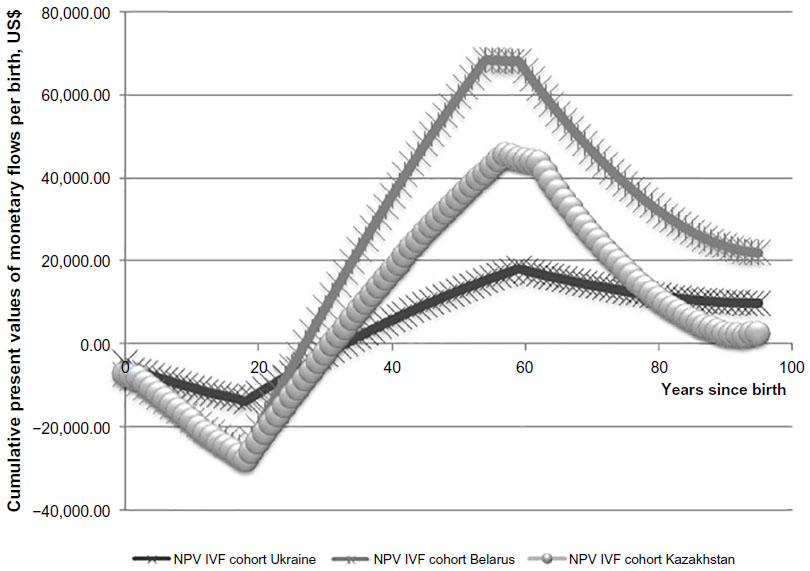 | Figure 1 Projected net present value for child conceived by IVF in Ukraine, Belarus, and Kazakhstan. |
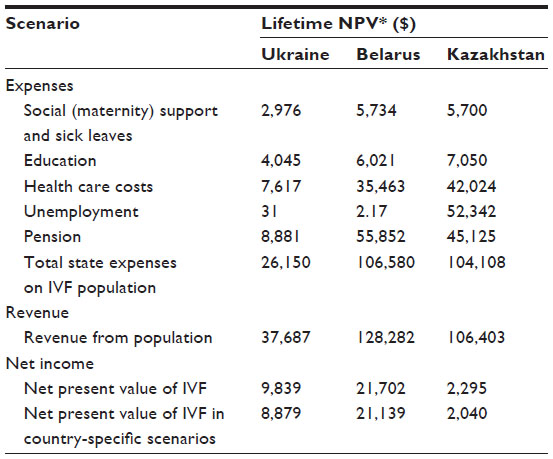 | Table 2 Cost and income of IVF-conceived population in Ukraine, Belarus, and Kazakhstan |
The PSA based on 5,000 simulations shows that the average NPV per person remains positive: $1,894±$7,619, $27,925±$12,407, and $17,229±$24,637 in Ukraine, Belarus, and Kazakhstan, respectively. At the same time, the ranges and standard deviations for Ukraine and Kazakhstan indicate that under some circumstances (meaning of inputs), financing of IVF can become negative for these countries.
The results of one-way sensitivity analysis (Table 3) show a positive NPV until the mother’s age is over 42 years in Ukraine and Belarus, while in Kazakhstan the break-even age of the mother (age at which financing IVF remains economically beneficial for the government) is 38–40 years. The costs of IVF drugs and supplies impact significantly the results of the economic analysis. A negative NPV was obtained using a discount rate of 10% in all three countries, as well as with a discount rate of 0% in Belarus and Kazakhstan. In the PSA, with a fixed 0% discount rate, a negative NPV was obtained for Ukraine and Kazakhstan ($19,962±$33,263 and $44,084±$89,815, respectively) and positive for Belarus ($24,328±$63,580). The instability of these results is indicated by the value of the standard deviation, which exceeds the average value.
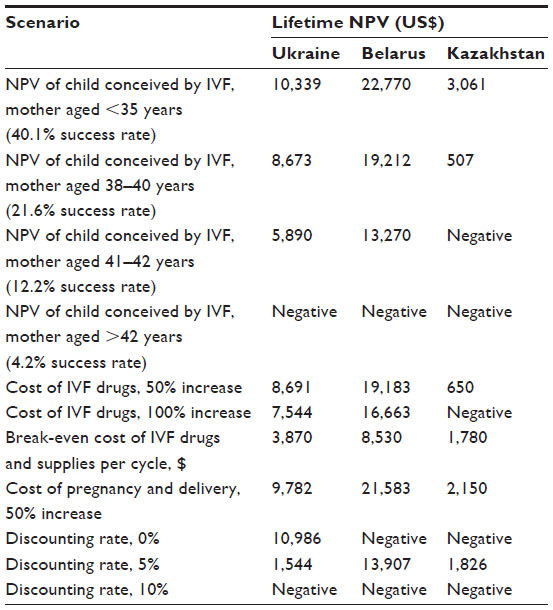 | Table 3 One-way sensitivity analysis (mothers’ age, IVF drug costs, and discounting rate) |
Discussion
The results presented in this paper show how public financing of IVF in three former Soviet Union countries (Belarus, Kazakhstan, and Ukraine) will generate a positive return to the state in future tax contributions. Understanding the financial benefits from medical technologies not related to life-saving technologies is especially important in jurisdictions where financial resources are limited, such as in low-income and middle-income countries like Ukraine, Belarus, and Kazakhstan. Economic evidence in terms of cost minimization or budget impact techniques may be applied to rationalize financing a limited number of IVF cycles, or to define an intent-to-treat patient population. While in Belarus nearly 600 children were born via state-financed IVF treatments,23 Ukraine,16 and Kazakhstan together report about 600 IVF cycles to be state-financed annually (personal communication), although in Kazakhstan this number is expected to rise in 2015. The present research shows that financing IVF may have a positive NPV, not only in high-income but also in lower-income countries. Based on the average cost per child conceived with IVF in a state clinic and using current levels of financial flows between populations and governments of Ukraine, Belarus, and Kazakhstan, the discounted returns to state all were positive over the projected lifetime of an individual, with higher uncertainty of results for Ukraine and Kazakhstan. A higher NPV from financing IVF in Ukraine, Belarus, and Kazakhstan can be achieved by limiting coverage of the procedure to women of younger age and by negotiating lower prices with IVF drug suppliers.
In Western European countries and Brazil, the discounted NPV of IVF ranged from $61,428 (Brazil) to $177,002 (UK; exchange rate 1 pound = US$ 1.61 on September 9, 2014), while in the countries of the Central and Eastern European region studied here the financial returns to the state were significantly lower, although still positive.3–8 However, an interesting observation from this study is that the NPV derived from an IVF population may not always be proportional to the income level of the country, expressed in GDP per capita. For example, the lowest financial return in the present study was observed in the country with the highest GDP per capita, ie, Kazakhstan. It should be noted that GDP per capita is not always the best approach for evaluating the income of a country’s population, as wealth can be distributed unequally, an especially common case in countries with a developing economy. Meanwhile, it also may be assumed that state income from population may not be related linearly to the country’s wealth in general in cross-country comparisons, because of differences in taxation policies and government spending.
Another interesting conclusion resulted from the probabilistic model applied, in which we tried to account for possible changes of the input parameters that may be expected during the long run of the model (lifetime of the IVF cohort). While applying the individual prognostic factors for each country, it appeared that the NPV in the probabilistic model may differ from the deterministic model, a finding explained by differences in economic forecast for a long time horizon. Moreover, opposite the deterministic model, the NPV of the IVF population may be higher in Kazakhstan than in Ukraine, if changes in the taxation policy (which are currently under political discussion) are applied in the future. Because of the long horizon of generational accounting models, we suggest that it is obligatory to apply PSA in order to define the stability of the received results under conditions of possible political and economic change.
The sensitivity analysis with the 0% discount rate has shown the inaccuracy of using this value in a life-duration model based on generational accounting. The assumption in the model that annual expenses increase proportionally to GDP makes the expenses on the retired population inaccurately higher than on the working population in countries with larger values for pensions and GDP growth.
The generational accounting framework from the governmental perspective used in this model assesses costs and benefits attributed to conceiving an IVF child as an investment required to achieve a live birth with consequent long-term economic returns. This economic model was used to assess the cost efficiency of state investments in countries with nationally funded health services (Ukraine, Belarus, and Kazakhstan) where both investments (financing IVF procedures) and returns (tax received) will present a financial flow between two stakeholders, population, and state. This model may be potentially applied to other countries with similar political, economic, and health care structures, where major state revenues are expected to come from tax payments (such as Russia, Georgia, or Azerbaijan). While the results of the current study show a positive economic balance with stability of the received results by PSA in Ukraine, Belarus, and Kazakhstan, the transferability of the model to other countries of the region may be assessed in the future.
In most Western European countries, a complete IVF treatment consists of a maximum of three IVF cycles, where treatment choices for each cycle can differ. In a cost-effectiveness analysis reflecting the “real-world” situation conducted in the Netherlands, it was found that combining several transfer policies was not cost-effective, and so the single-choice treatment option should be preferred, ie, elective single embryo transfer, standard treatment policy, or double embryo transfer.24
A cost-effectiveness analysis of replacing one, two, or three embryos per cycle of IVF in specific populations of women (<38 years, ≥38 years; one cycle, two cycles, and three or more cycles) has shown that the most cost-effective and least cost-effective scenarios occurred, respectively, with younger and older women who received three or more cycles, in the move from one embryo transfer to two embryo transfers.25 Meanwhile, in the current study, we assessed only two scenarios: expenses and incomes related to one birth only, with the IVF success rate aiming at the minimum budget impact for the intervention financing; expenses and incomes related to IVF birth according to the current countries’ data on multiple births and cycle success rate. Taking into consideration cost-efficiency of the different IVF procedures in future studies may show increases in state benefits from IVF financing.
Limitations
While taxation-based income may represent a reasonably accurate means of estimating future economic benefits for the state, it should be noted that population also contributes to other financial governmental flows, such as trade and enterprise development, which was not accounted for in the current model. The model also did not account for possible emigration of people to other countries. This may particularly affect the results of economic studies in Belarus, where the unemployment rate is assessed by the number of people receiving unemployment support from the government.
The model accounts for linear increases in spending and earning, based on average values from a retrospective historical assessment of the countries’ input parameters. As a consequence, the impact of unpredictable economic crises or growth also was not accounted for in the evaluation. Another model limitation is that the calculation applied average earnings in the population, ignoring the possibility of wealthier generations in the future. While the return of state investments was assessed from the narrow governmental perspective using only future net tax contributions, we may consider that with broader assessment of net marginal contributions from individuals, the net state benefit from IVF-conceived children will present an even more attractive economic option.
Conclusion
The results of this study may have implications for IVF reimbursement policy not only in Ukraine, Belarus, and Kazakhstan, but in other settings with comparable populations and financial flows between population and governments, particularly those which may be considering universal coverage for fertility treatments. While income from a population may not be directly proportional to GDP per capita, it appears that financing IVF technologies collectively may represent a promising potential for state financial returns.
Acknowledgments
We would like to thank Vladimir Matveev for his help in obtaining Belarus price data, and Carter Mandrik, Beate Sander, and Chris Jones for their help in manuscript editing.
Disclosure
OM is affiliated with Erasmus University Rotterdam by means of a hospitality agreement, and has worked for several pharmaceutical companies in Ukraine that had no impact on the current research. SK is employed by the National Health Care Institute, the Netherlands. The authors have no other conflict of interests to declare.
References
Mascarenhas MN, Flaxman SR, Boerma T, Vanderpoel S, Stevens GA. National, regional, and global trends in infertility prevalence since 1990: a systematic analysis of 277 health surveys. PLoS Med. 2012;9(12):e1001356. | |
Ory SJ, Devroey P, Banker M, editors. IFFS Surveillance 2013. The International Federation of Fertility Societies; 2013. Available from: ttps://c.ymcdn.com/sites/iffs.site-ym.com/resource/resmgr/iffs_surveillance_09-19-13.pdf. Accessed April 24, 2015. | |
Collins J. Cost-effectiveness of in vitro fertilization. Semin Reprod Med. 2001;19(3):279–289. | |
Connolly M, Hoorens S, Ledger W. Money in – babies out: assessing the long-term economic impact of IVF-conceived children. J Med Ethics. 2008;34(9):653–654. | |
Connolly M, Gallo F, Hoorens S, Ledger W. Assessing long run economic benefits attributed to an IVF-conceived singleton based on projected lifetime net tax contributions in the UK. Hum Reprod. 2009; 24(3):626–632. | |
Connolly MP, Pollard MS, Hoorens S, et al. Long-term economic benefits attributed to IVF-conceived children: a lifetime tax calculation. Am J Manag Care. 2008;14(9):598–604. | |
Svensson A, Connolly M, Gallo F, Hägglund L. Long-term fiscal implications of subsidizing in-vitro fertilization in Sweden: a lifetime tax perspective. Scand J Public Health. 2008;36(8):841–849. | |
Kröger GB, Ejzenberg D. The fiscal outcome of artificial conception in Brazil-creating citizens in developing countries. Hum Reprod. 2012;27(1):142–145. | |
Welte R, Feenstra T, Jager H, Leidl R. A decision chart for assessing and improving the transferability of economic evaluation results between countries. Pharmacoeconomics. 2004;22(13):857–876. | |
Society for Assisted Reproductive Technology. Clinic Summary Report. All SART member clinics. Available from: https://www.sartcorsonline.com/rptCSR_PublicMultYear.aspx?ClinicPKID=0. Accessed November 28, 2014. | |
Central Intelligence Agency. The World Factbook. Belarus. Available from: https://www.cia.gov/library/publications/the-world-factbook/geos/bo.html. Accessed October 31, 2013. | |
Central Intelligence Agency. The World Factbook. Kazakhstan. Available from: https://www.cia.gov/library/publications/the-world-factbook/geos/kz.html. Accessed October 31, 2013. | |
Central Intelligence Agency. The World Factbook. Ukraine. Available from: https://www.cia.gov/library/publications/the-world-factbook/geos/up.html. Accessed October 31, 2013. | |
Center of the Medical and Pharmaceutical Information of Kazakhstan. [Price lists for drugs and biologic additives]. Russian. Available from: http://mpi.kz/index.php/. Accessed May 5, 2013. | |
Ministry of Healthcare of the Belarus Republic. [Center of expertise and trials in health care]. Russian. Available from: http://www.rceth.by/. Accessed May 5, 2013. | |
Ministry of Health of Ukraine. [National State Reproductive program. Economic Justification of the program], 2014. Accessed May 5, 2013. Ukrainian. | |
World Health Organization. CHOosing Interventions that are Cost Effective (WHO-CHOICE). Country-specific unit costs. Available from: http://www.who.int/choice/country/country_specific/en/. Accessed November 16, 2013. | |
Kupka MS, Ferraretti AP, de Mouzon J, et al. The European IVF-monitoring (EIM) Consortium, for the European Society of Human Reproduction and Embryology (ESHRE). Assisted reproductive technology in Europe, 2010: results generated from European registers by ESHRE. Hum Reprod. 2014;29(10):2099–2113. | |
Chambers GM, Hoang VP, Lee E, et al. Hospital costs of multiple-birth and singleton-birth children during the first 5 years of life and the role of assisted reproductive technology. JAMA Pediatr. 2014;168(11):1045–1053. | |
The Global Health Observatory. Life expectancy at birth. World health statistics. Available from: http://apps.who.int/gho/data/?vid=61740#. Assessed January 1, 2012. | |
The World Bank. Inflation, consumer price (%). Available from: http://data.worldbank.org/indicator/FP.CPI.TOTL.ZG. Assessed November 23, 2014. | |
The World Bank. GDP growth (annual%) The World Bank national accounts data, and OECD national accounts data files. Available from: http://data.worldbank.org/indicator/NY.GDP.MKTP.KD.ZG/countries/1W-KZ-UA-BY?display=graph. Assessed October 31, 2013. | |
Order of the President of the Republic of Belarus from 11 August 2011 #357. On approval of the national program of demographic safety of the Republic of Belarus for 2011–2015. | |
Fiddelers AA, Dirksen CD, Dumoulin JC, et al. Cost-effectiveness of seven IVF strategies: results of a Markov decision-analytic model. Hum Reprod. 2009;24(7):1648–1655. | |
Jones CA. Doctoral dissertation, Oxford University. Economic evaluation of alternative embryo transfer policies in in vitro fertilisation, 2006. |
Supplementary materials
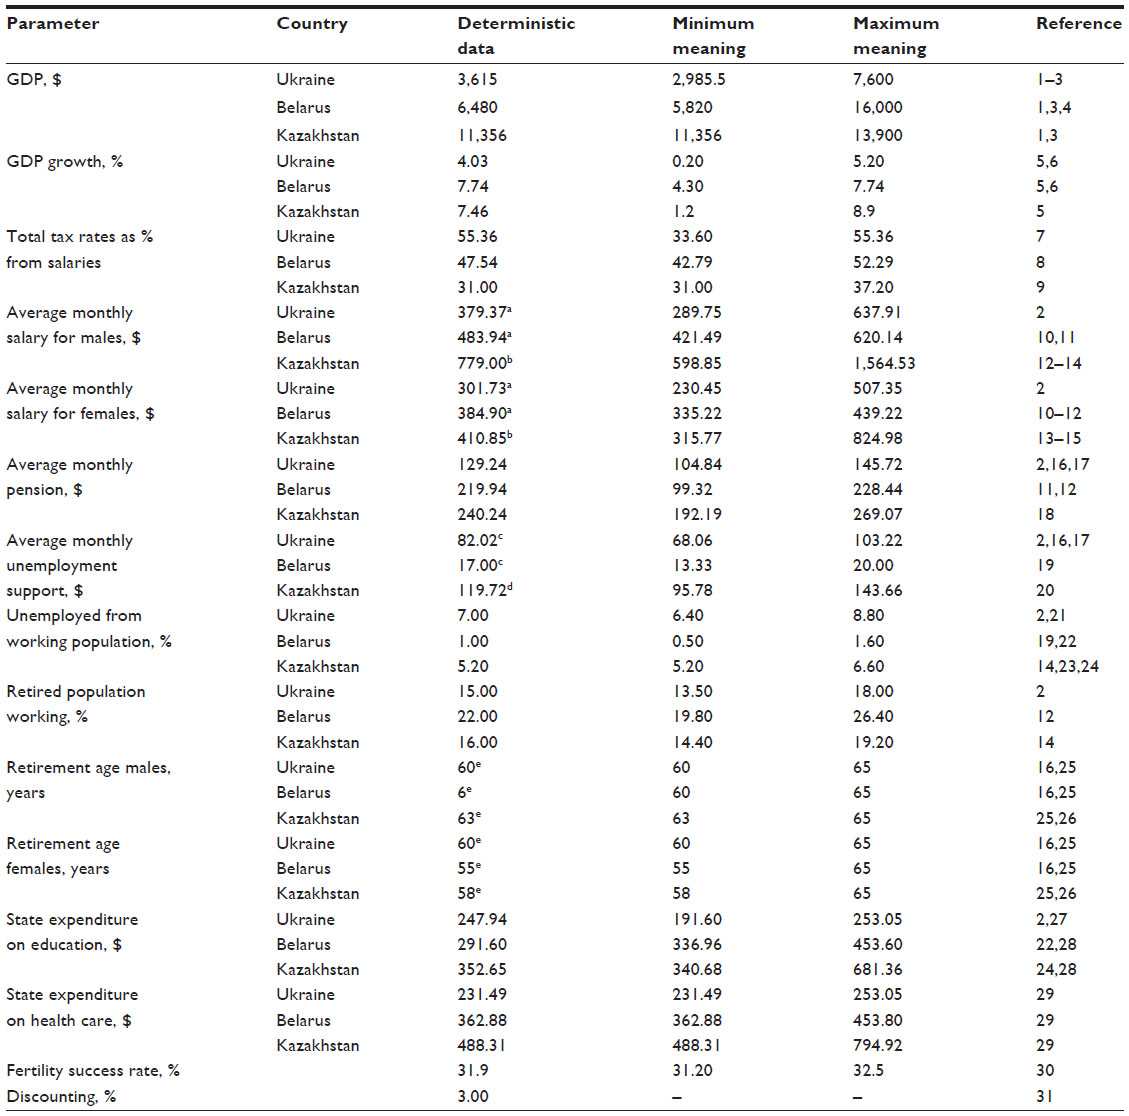 | Table S1 Input parameters in deterministic and probabilistic models |
References
The World Bank. GDP per capita (current US$) The World Bank national accounts data, and OECD National Accounts data files. Available from: http://data.worldbank.org/indicator/NY.GDP.PCAP.CD. Accessed October 31, 2013. | |
State Committee of Statistics of Ukraine. [Social protection of the population of Ukraine. The compendium of statistics]. Ukrainian. 2011. | |
Central Intelligence Agency. The World Factbook. GDP per capita (PPP). Available from: https://www.cia.gov/library/publications/the-world-factbook/rankorder/2004rank.html. Accessed October 31, 2013. | |
National Statistical Committee of the Republic of Belarus. [Gross Domestic Product]. Russian. Available from: http://belstat.gov.by/homep/ru/indicators/gross.php. Accessed October 31, 2013. | |
The World Bank. GDP growth (annual%) The World Bank national accounts data, and OECD National Accounts data files. Available from: http://data.worldbank.org/indicator/NY.GDP.MKTP.KD.ZG/countries/1W-KZ-UA-BY?display=graph. Accessed October 31, 2013. | |
Central Intelligence Agency. The World Factbook. GDP growth rate. Available from: https://www.cia.gov/library/publications/the-world-factbook/rankorder/2003rank.html. Accessed October 31, 2013. | |
Ukrainian Business Consulting Group. [Taxes in Ukraine 2013. The general review of the taxation system]. Analytical report. Russian. Available from: http://www.ubc.ua/articl_tax1.html. Accessed on November 15, 2013. | |
Commentaries on the legislation of the Republic of Belarus. [Retentions from the salaries of the employees: reflection in the accounting and documentation processes]. Russian. Available from: http://accountantrb.blogspot.com/2012/09/blog-post_3307.html. Accessed November 15, 2013. | |
Karazhat Consulting. [Taxes and tax documentation]. Russian. Available from: http://www.karazhat.kz/taxes. Accessed November 15, 2013. | |
National Statistical Committee of the Republic of Belarus. [Annual data. Salaries]. Russian. Available from: http://belstat.gov.by/homep/ru/indicators/wages.php. Accessed November 15, 2013. | |
National Statistical Committee of the Republic of Belarus. [Income and expenses of population]. Russian. Available from: http://belstat.gov.by/homep/ru/indicators/doclad/2012_7/15.pdf. Accessed November 15, 2013. | |
Ministry of Labor and Social Protection of Population of the Republic of Belarus. [Occupation of population]. Russian. Available from: http://www.mintrud.gov.by/ru/populbusy. Accessed January 12, 2013. | |
Agency of the Republic of Kazakhstan on Statistics. [Salaries of the employers]. Russian. Available from: http://www.stat.kz/news/Pages/n2_17_03_11.aspx. Accessed October 17, 2013. | |
Agency of the Republic of Kazakhstan on Statistics. [Analytical report]. Russian. Available from: http://www.stat.kz/publishing/DocLib1.doc. Accessed December 08, 2013. | |
Agency of the Republic of Kazakhstan on Statistics. [Monitoring of village development]. Russian. Available from: http://www.stat.kz/Pages/default.aspx. Accessed November 15, 2013. | |
Social Security Administration. Office of Retirement and disability policy. Social security programs throughout the world: Europe. Available from: http://www.ssa.gov/policy/docs/progdesc/ssptw/2012-2013/europe/ssptw12europe.pdf. Assessed on November 15, 2013. | |
European Center for Social Welfare Policy and Research. Affiliated to the United Nations. Strategy Paper for pension policy in Ukraine. March 2012. | |
Legal web portal of Kazakhstan. [The sizes of pensions in Kazakhstan]. Russian. Available from: http://www.zakon.kz/4465367-razmery-pensijj-v-kazakhstane.html. Accessed November 15, 2013. | |
National Statistical Committee of the Republic of Belarus. [Occupation of population and unemployment]. Russian. Available from: http://belstat.gov.by/homep/ru/indicators/doclad/2012_12/14.pdf. Accessed November 15, 2013. | |
Ministry of Labor and Social Protection of Population of the Republic of Kazakhstan. [Unemployment payments]. Russian. Available from: http://www.enbek.gov.kz/node/251200. Accessed November 15, 2013. | |
The World Bank. Unemployment, total (% of total labor force). Available from: http://data.worldbank.org/indicator/SL.UEM.TOTL.ZS. Assessed October 31, 2013. | |
Central Intelligence Agency. The World Factbook. Available from: https://www.cia.gov/library/publications/the-world-factbook/geos/bo.html. Accessed October 31, 2013. | |
Central Intelligence Agency. The World Factbook. Kazakhstan. Available from: https://www.cia.gov/library/publications/the-world-factbook/geos/kz.html. Accessed October 31, 2013. | |
The World Bank. World Bank Group – Kazakhstan. Partnership program snapshot. April, 2013. Available from: http://www.worldbank.org/content/dam/Worldbank/document/Kazakhstan-Snapshot.pdf. Accessed February 01, 2014. | |
Organization of European Cooperation and Development. Statistics on average effective age and official age of retirement in OECD countries. Available from: http://www.oecd.org/els/emp/ageingandemploymentpolicies-statisticsonaverageeffectiveageofretirement.htm. Accessed November 16, 2013. | |
Social Security Administration. Office of Retirement and Disability Policy. Social security programs throughout the world: Asia and the Pacific. Available from: http://www.ssa.gov/policy/docs/progdesc/ssptw/2012-2013/asia/ssptw12asia.pdf. Accessed November 17, 2013. | |
Central Intelligence Agency. The World Factbook. Ukraine. Available from: https://www.cia.gov/library/publications/the-world-factbook/geos/up.html. Accessed October 31, 2013. | |
The World Bank. Public spending on education, total (% of GDP). Available from: http://data.worldbank.org/indicator/SE.XPD.TOTL.GD.ZS. Accessed November 06, 2013. | |
The World Bank. Health Expenditure, total (% of GDP). Available from: http://data.worldbank.org/indicator/SH.XPD.TOTL.ZS. Accessed November 06, 2013. | |
Society for Assisted Reproductive Technology; Clinic Summary Report. All SART member clinics. Available from: https://www.sartcorsonline.com/rptCSR_PublicMultYear.aspx?ClinicPKID=0. Accessed November 28, 2014. | |
Edejer T, Baltussen R, Adam T, et al. Making choices in health: WHO guide to cost-effectiveness analysis. World Health Organization; 2003. Available from: http://www.who.int/choice/publications/p_2003_generalised_cea.pdf. Accessed November 17, 2013. |
 © 2015 The Author(s). This work is published and licensed by Dove Medical Press Limited. The full terms of this license are available at https://www.dovepress.com/terms.php and incorporate the Creative Commons Attribution - Non Commercial (unported, v3.0) License.
By accessing the work you hereby accept the Terms. Non-commercial uses of the work are permitted without any further permission from Dove Medical Press Limited, provided the work is properly attributed. For permission for commercial use of this work, please see paragraphs 4.2 and 5 of our Terms.
© 2015 The Author(s). This work is published and licensed by Dove Medical Press Limited. The full terms of this license are available at https://www.dovepress.com/terms.php and incorporate the Creative Commons Attribution - Non Commercial (unported, v3.0) License.
By accessing the work you hereby accept the Terms. Non-commercial uses of the work are permitted without any further permission from Dove Medical Press Limited, provided the work is properly attributed. For permission for commercial use of this work, please see paragraphs 4.2 and 5 of our Terms.