")
Back to Journals » Breast Cancer: Targets and Therapy » Volume 8
Economic burden related to chemotherapy-related adverse events in patients with metastatic breast cancer in an integrated health care system
Authors Rashid N, Koh HA, Baca HC, Lin KJ, Malecha SE, Masaquel A
Received 2 February 2016
Accepted for publication 31 March 2016
Published 4 October 2016 Volume 2016:8 Pages 173—181
DOI https://doi.org/10.2147/BCTT.S105618
Checked for plagiarism Yes
Review by Single anonymous peer review
Peer reviewer comments 2
Editor who approved publication: Professor Pranela Rameshwar
Nazia Rashid,1 Han A Koh,2 Hilda C Baca,3 Kathy J Lin,1 Susan E Malecha,4 Anthony Masaquel5
1Drug Information Services, Kaiser Permanente, Downey, 2Southern California Permanente Medical Group, Kaiser Permanente, Bellflower, 3Pharmacy Analytical Services, Kaiser Permanente, Downey, 4US Medical Affairs, Genetech Inc., San Francisco, 5Health Economics and Outcomes, Genentech Inc., San Francisco, CA, USA
Background: Breast cancer is treated with many different modalities, including chemotherapy that can be given as a single agent or in combination. Patients often experience adverse events from chemotherapy during the cycles of treatment which can lead to economic burden.
Objective: The objective of this study was to evaluate costs related to chemotherapy-related adverse events in patients with metastatic breast cancer (mBC) in an integrated health care delivery system.
Methods: Patients with mBC newly initiated on chemotherapy were identified and the first infusion was defined as the index date. Patients were ≥18 years old at time of index date, had at least 6 months of health plan membership and drug eligibility prior to their index date. The chemotherapy adverse events were identified after the index date and during first line of chemotherapy. Episodes of care (EOC) were created using healthcare visits. Chart review was conducted to establish whether the adverse events were related to chemotherapy. Costs were calculated for each visit, including medications related to the adverse events, and aggregated to calculate the total EOC cost.
Results: A total of 1,682 patients with mBC were identified after applying study criteria; 54% of these patients had one or more adverse events related to chemotherapy. After applying the EOC method, there were a total of 5,475 episodes (4,185 single episodes [76.4%] and 1,290 multiple episodes [23.6%]) related to chemotherapy-related adverse events. Within single episodes, hematological (1,387 EOC, 33.1%), musculoskeletal/pain related (1,070 EOC, 25.6%), and gastrointestinal (775 EOC, 18.5%) were the most frequent adverse events. Patients with adverse events related to single EOC with anemia and neutropenia had the highest total outpatient costs with 901 EOC ($81,991) and 187 EOC ($17,017); these patients also had highest total inpatient costs with 46 EOC ($542,798) and 16 EOC ($136,768). However, within multiple episodes, hematological (420 EOC, 32.6%), followed by infections/pyrexia (335 EOC, 25.9%) and gastrointestinal (278 EOC, 22.6%) were the most frequent adverse events.
Conclusion: The economic burden related to chemotherapy adverse events in patients with mBC is substantial.
Keywords: metastatic breast cancer, chemotherapy, adverse events, costs, health care use, economic burden
A Letter to the Editor has been received and published for this article.
Introduction
In the US, metastatic breast cancer (mBC) is the second leading cause of cancer death among women with ~40,000 deaths each year.1 An estimated 150,000–250,000 people, at any given time, are currently living with mBC.2 For mBC patients in stage I (whose cancer has not spread), the 5-year survival rate is ~98%. However, for mBC patients in stage IV, the 5-year survival rate is only ~22%.3 In the US, the annual indirect cost to society attributable to mBC for women <65 years was estimated to be >$572 million, which included ~$270 million, $253 million, and $50 million from premature deaths, lost productivity, and caregiving, respectively; lost productivity costs alone were estimated to be $21,153 per patient-year (2010 US dollars).4 Currently, breast cancer is treated with many different modalities, including chemotherapy that can be given as a single agent or in combination. Patients often experience adverse events from chemotherapy during the cycles of treatment. These adverse events lead to additional unforeseen costs and can accumulate economic burden on the patient and the health care system.
A select number of studies have evaluated the rates of chemotherapy-related adverse events and the costs associated with these adverse events.5–9 Hurvitz et al5 conducted a study using a commercially insured claims database in which they identified rates of chemotherapy-related adverse events and evaluated the costs associated with these adverse events among patients on a taxane or capecitabine as a first-line therapy. The most frequent adverse events were anemia (50.7%), bilirubin elevation (26.4%), and leukopenia (24.8%); the costs related to the adverse events were primarily driven by incremental inpatient, outpatient, and pharmacy costs. Increases in monthly costs ranged from $854 to $5,320 for patients with adverse events versus without adverse events. Overall costs increased with increasing numbers of adverse events.5 Hansen et al6 compared the economic impact of treatment-related adverse events in patients with mBC on taxane- or capecitabine-based treatment regimens using a commercial claims database. Thus, the adjusted total monthly costs were significantly higher in those with adverse events than those without adverse events. Total costs increased with the number of adverse events and were primarily driven by increased hospitalization among those with adverse events.6 Another prior study by Hassett et al7 examined patients younger than 65 years using insurance claims data and evaluated the frequencies and costs of chemotherapy-related adverse events, in which a serious adverse effect was defined as harm in a patient resulting in an emergency room (ER) visit or hospitalization. Women who received chemotherapy within 12 months of their first breast cancer diagnosis versus those who did not receive chemotherapy within 12 months of their first breast cancer diagnosis were more likely to visit the hospital or have an ER visit.7 Chemotherapy recipients incurred large incremental expenditures for chemotherapy-related serious adverse events ($1,271 per person per year) and ambulatory encounters ($17,617 per person per year) versus no chemotherapy group.7 Women who received chemotherapy had more adverse events related to fever/infection (8.4%) and neutropenia/thrombocytopenia (5.5%). Du et al8 examined toxicity from chemotherapy in females with any stage of breast cancer, aged ≥65 years, and used hospitalization visits only and found that >9% of women with breast cancer who received chemotherapy were admitted to the hospital with neutropenia, fever, and thrombocytopenia compared with 0.5% of women with breast cancer who did not receive chemotherapy within 6 months of being diagnosed. The hospitalization rates of adverse events increased significantly with comorbidity score.
This study investigated similar questions; however, our population included patients with mBC, aged ≥18 years, and involved an integrated managed care electronic health care database. This study also applied an episode of care (EOC) method to provide a more real-world approach that may reflect the common practice of our health care delivery system. Finally, we conducted a chart review to determine whether the EOC-related adverse events were from chemotherapy or disease progression. To our knowledge, this is the first study to review chart notes and examine data regarding chemotherapy-related adverse events and the costs associated with these adverse events. The objective for this study was to evaluate the costs related to chemotherapy-related adverse events via EOC level data in an integrated health care delivery system.
Materials and methods
Study setting and data
Kaiser Permanente Southern California (KPSC) is an integrated health care delivery system with ~3.9 million members located in Southern California. Data were derived from the KPSC administrative databases and The Kaiser Permanente Southern California Regional Cancer Registry (CANREG) database. The KPSC databases contain information on patient demographics, diagnoses, prescriptions, laboratory results, medical, and hospital encounters. The electronic health medical record system allows for more detailed information to be accessed, such as chart notes. The mBC diagnoses are confirmed cancer diagnoses, which makes the KPSC CANREG applicable when conducting various retrospective or prospective longitudinal studies and is a compilation of data collected at the registry level at each of the 14 hospitals. Currently, the KPSC membership represents 15% of the underlying population in the Southern California region, and this membership closely mirrors the Southern California population: it is racially diverse and includes the entire socioeconomic spectrum.10 The institutional review board of KPSC approved this study.
Design and study population
A retrospective cohort database analysis was conducted during the study time period of January 1, 2007, to December 31, 2011. Patients with mBC were selected either from the KPSC CANREG or using medical claims from an algorithm that is used in previous studies5,6 (Supplementary materials): patients had two or more medical encounters within 90 days between January 1, 2007, and December 31, 2011, with the following diagnosis codes (International Classification of Diseases, Ninth Revision, Clinical Modification [ICD-9-CM] code 197.xx-198.xx). The mBC date was defined as the metastatic disease index date. We identified patients with one or more ICD-9 code of breast cancer (174.xx or 233.0x) prior mBC date starting from January 1, 2002 (5 years prior) or 90 days after the mBC date, which was defined as diagnosis date. Patients had to be female and ≥18 years of age on the diagnosis date (Supplementary materials). We excluded any other cancers 12 months prior to the diagnosis date: 140.x to 165.x, 170.x to 173.x, 175.x to 176.x, 179.x to 195.x, 196.x, 199.x to 209.x, 230x-234.x (except 233.0x), 235.x-239.x (except 238.3, 239.3), and V10.x (except V10.3). Men were excluded in this study because they may display different profiles than women due to different pathogenesis in breast cancer.5 Patients had to have 6 months of continuous membership and drug benefit eligibility prior to the mBC date to capture baseline characteristics. All baseline characteristics were identified during 6 months prior the index date. Treatment index date was the first chemotherapy regimen identified after mBC diagnosis.
Identification of chemotherapy and follow-up
Once the final cohort of mBC patients was established, we used pharmacy and CANREG databases to identify the first-line chemotherapy for each patient. Chemotherapy was identified using national drug codes and generic product identifiers if patients were prescribed one or more of the following: capecitabine, taxane (docetaxel and paclitaxel), cyclophosphamide, doxorubicin, gemcitabine, epirubicin, vinorelbine, ixabepilone, or eribulin. Once chemotherapy was identified for the patient with mBC, we searched the pharmacy databases to ensure that no other chemotherapy regimens were initiated in the prior 12 months. We did not evaluate hormonal status or examined any targeted therapies for our patient population. If no other chemotherapy regimens were identified, we categorized the patient into the chemotherapy regimens and identified the first date of chemotherapy cycle as the index date. Patients were followed after index date until disenrollment from the health plan, end of the study time period (December 31, 2012), a gap in treatment of >45 consecutive days, switch/change to another chemotherapy regimen, or discontinued their first-line therapy, whichever came first.
Adverse events
The list of adverse events for this study was compiled using package inserts, clinical opinion, previous studies, or clinical trials5–8,11 (Supplementary materials). The following adverse events were selected based on ICD-9 diagnosis codes or procedure codes and categorized into the following groups: 1) dermatological: alopecia, injection site reaction, and rash; 2) dehydration; 3) edema; 4) gastrointestinal: constipation, decreased appetite, diarrhea, nausea/vomiting, and stomatitis; 5) hematological: anemia, leukopenia, neutropenia, and thrombocytopenia; 6) hepatic: increase in liver enzymes and bilirubin; 7) infection or pyrexia; and 8) musculoskeletal/pain related: arthralgia, myalgia, and peripheral neuropathy. Adverse events were identified using the primary or secondary discharge position ranking for outpatient visits, hospitalizations, and ER visits (Supplementary materials).
Episodes of care
Once adverse events were identified in our cohort, we created EOCs for each adverse event. As defined in literature, an EOC is the period initiated by patient with a diagnosis of clinical condition and concluded when the condition is resolved.12,13 The theoretical framework for assessing episodes has been well developed in the literature;12,13 however, the EOC for the management of adverse events has not been applied to patients with mBC. An EOC for the same condition can include a single type of visit or multiple various types of health care visits, including hospitalization, ER visits, or outpatient visits. The duration of an EOC is defined as the length of time between the first and last visits for that clinical condition. We applied a 2-week gap between the date of the last visit and the next visit of the same adverse event to ensure that the EOCs were not over estimated and also per clinical expert opinion, a 2-week gap would be sufficient to create unique EOC for each adverse event.
Two types of EOC were created, single EOC and multiple EOC. The latter would likely represent persistence or repeated visits for the management of adverse events. A single EOC was defined as only one health care resource encounter type for the specific adverse event and no other health care encounter within 2 weeks from that visit. Thus, single episodes could be an outpatient visit only with 1 day or a hospital encounter with 3 days. A multiple EOC was defined as a patient having more than one health care resource encounter type within a 2-week time period. An example of a multiple EOC would be a patient having an outpatient visit, then in 3 days, had another outpatient visit, then in 2 days went to the ER, and then was admitted to the hospital for 5 days all for the same adverse event. Since no 2-week gap was described between the encounters, it was counted as one multiple EOC. Chart notes were evaluated to help differentiate whether the single or multiple EOC was related to chemotherapy, related to disease progression, or other reasons (patient preference, cost/insurance, and nonadherence). Once the EOC was defined, the chart notes were extracted using the dates of each EOC. Each EOC was individually reviewed by a clinical oncology pharmacist and an oncology research associate. The results were shared once all the EOC events were reviewed. If there were any discrepancies, they were adjudicated by the KPSC clinical expert oncologist. Only patients who had an adverse event related to chemotherapy were included in our economic evaluation. Patients could have overlap in their episodes since we were identifying different adverse events using the primary and secondary discharge positions, which could occur on different dates.
Cost associated with chemotherapy-related adverse events
Costs were computed as the total of plan paid plus patient paid amounts, presented at constant 2013 US dollars.14,15 In this study, we evaluated costs related to outpatient visits, ER visits, hospitalizations, and other medications that were used to help treat the adverse events. The list of other medications was created using prior studies9 and with clinician feedback (Supplementary materials). We computed total costs related to the adverse events for each EOC to evaluate which adverse event was driving increase in costs. The average cost per EOC for each adverse events category was calculated by adding all costs of the visit types that created each EOC and dividing by the number of EOC. The KPSC 2013 sample charge amounts were used for hospital stays.14 KPSC 2013 sample fee schedules were used for various outpatient and ER visits.15 In previous studies,5–9 chemotherapy costs were included in the economic evaluation. However, in this study, we did not include chemotherapy costs because it was not the focus of our study. The list of other medications for these adverse events, including antiemetics, growth factors, electrolytes, and anti-infectives (Supplementary materials), was calculated using combination of public costs such as Redbook and drugstore.com.16,17 Each EOC, when identified, was started with an admission date and ended with a discharge date using the last visit for that particular EOC. The other medications were identified within each EOC by using the dispense date within the admission date of each EOC until the discharge date of the last visit, which ended the EOC.
Statistical analyses
Unadjusted descriptive statistics were conducted to summarize characteristics of patients with mBC who experienced chemotherapy-related adverse events versus those who did not experience chemotherapy-related adverse events. Differences between these patients groups were tested using two-sided t-test for continuous variables and the chi-squared statistic for categorical variables. Costs were calculated for each EOC, and data were analyzed using SAS version 9.2 (SAS Institute, Cary, NC, USA). P-values <0.05 were considered to be statistically significant.
Results
A total of 1,682 patients were identified after applying all inclusion and exclusion criteria (Supplementary materials). Patients initially started with a single chemotherapy agent versus combination chemotherapy regimen. First-line chemotherapy was categorized into patients initially starting on single or combination therapies consisting of capecitabine (67%), taxane (22%), cyclophosphamide (9%), doxorubicin (6%), and gemcitabine, epirubicin, vinorelbine, ixabepilone, and eribulin were 5%. Patients were on first-line therapy for a mean 262 days (SD ±105). There were 909 patients (54%) who had at least one or more identified adverse event and 773 (46%) who did not experience the identified adverse events during follow-up. Overall, there was a higher percentage of patients <65 years (60%) with a mean age of 53 years (SD ±8.1). Overall, both groups were similar between baseline comorbidities, but there were some statistical differences in race and peripheral vascular disease. Patients were predominantly white (57%), and most common comorbidities were hypertension (43%), diabetes (16%), chronic pulmonary disease (12%), and renal disease (9%; Table 1).
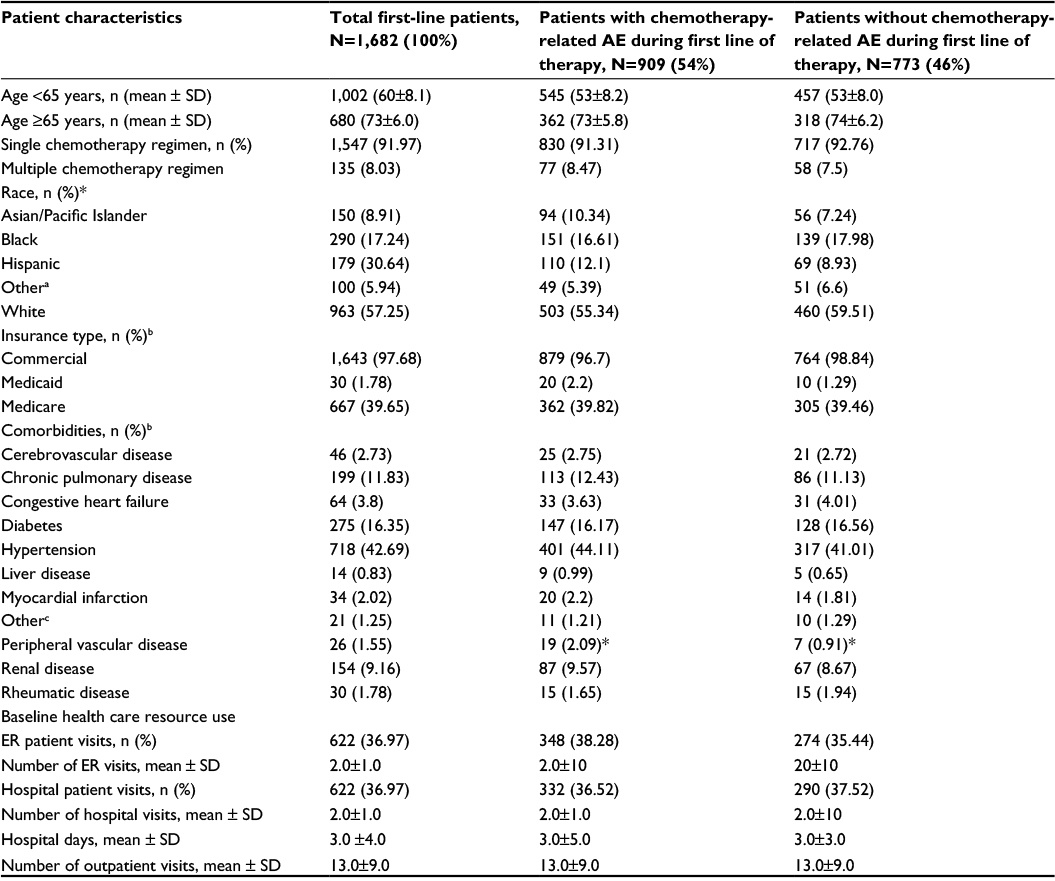 | Table 1 Baseline characteristics of patients with and without adverse events Notes: All patients had at least one or more outpatient visit during the 12 months prior index date. aNative Hawaiian/other Pacific Islander/Native American/other/unknown. bNot mutually exclusive, more than one patient could be counted more than once. cOther includes dementia, peptic ulcer disease, and hemiplegia or paraplegia. *Statistically significant with P<0.05. Abbreviations: AE, adverse event; ER, emergency room. |
According to Table 2, there were a total of 5,475 episodes (4,185 single episodes [76.4%] and 1,290 multiple episodes [23.6%]) related to adverse events. The most prevalent episodes were hematological (33%), musculoskeletal/pain related (21%), gastrointestinal (19%), and infections/pyrexia (16%). Within single episodes, hematological (33.1%), musculoskeletal/pain related (25.6%), and gastrointestinal (18.5%) were the most frequent adverse events. However, within multiple episodes, hematological (32.6%) followed by infections/pyrexia (25.9%) and gastrointestinal (22.6%) were the most frequent adverse events.
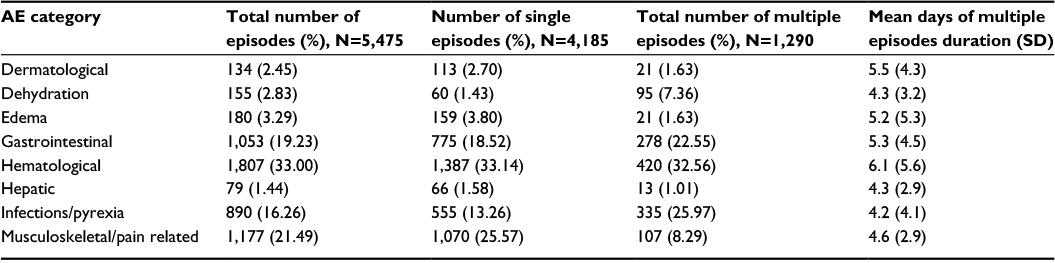 | Table 2 Descriptive data on episode of care for AEs Abbreviation: AE, adverse event. |
Table 3 provides more details related to the economic burden at the episode level data among different adverse events episodes within single and multiple episodes. Within the single EOC findings, there were either outpatient visits or hospital visits. The most common outpatient single EOC and most costly were related to hematological (1,317 EOC, $119,847), musculoskeletal/pain (1,065 EOC, $96,915), and gastrointestinal (741 EOC, $67,431). Within hematological outpatient single EOC, the leading adverse events were related to anemia (901 EOC, $81,991) and neutropenia (187 EOC, $17,017). However, within the hospital single EOC, we found hematological (70 EOC, $745,813), infection/pyrexia (57 EOC, $438,085), and gastrointestinal (34 EOC, $288,495) to be most costly EOC. The musculoskeletal/pain-related EOCs are more prevalent in outpatient visits versus hospital visits within the single EOC findings (Table 3). Within the multiple EOC findings, there were more EOCs related to outpatient + ER, outpatient + hospital, and ER + hospital. Infections/pyrexia-related EOCs (57 EOC, $20,748) were most prevalent in the outpatient multiple EOC, and hematological was second leading (47 EOC, $$37,730). The primary driver of costs was associated with hospitalizations, and second was outpatient (Table 3).
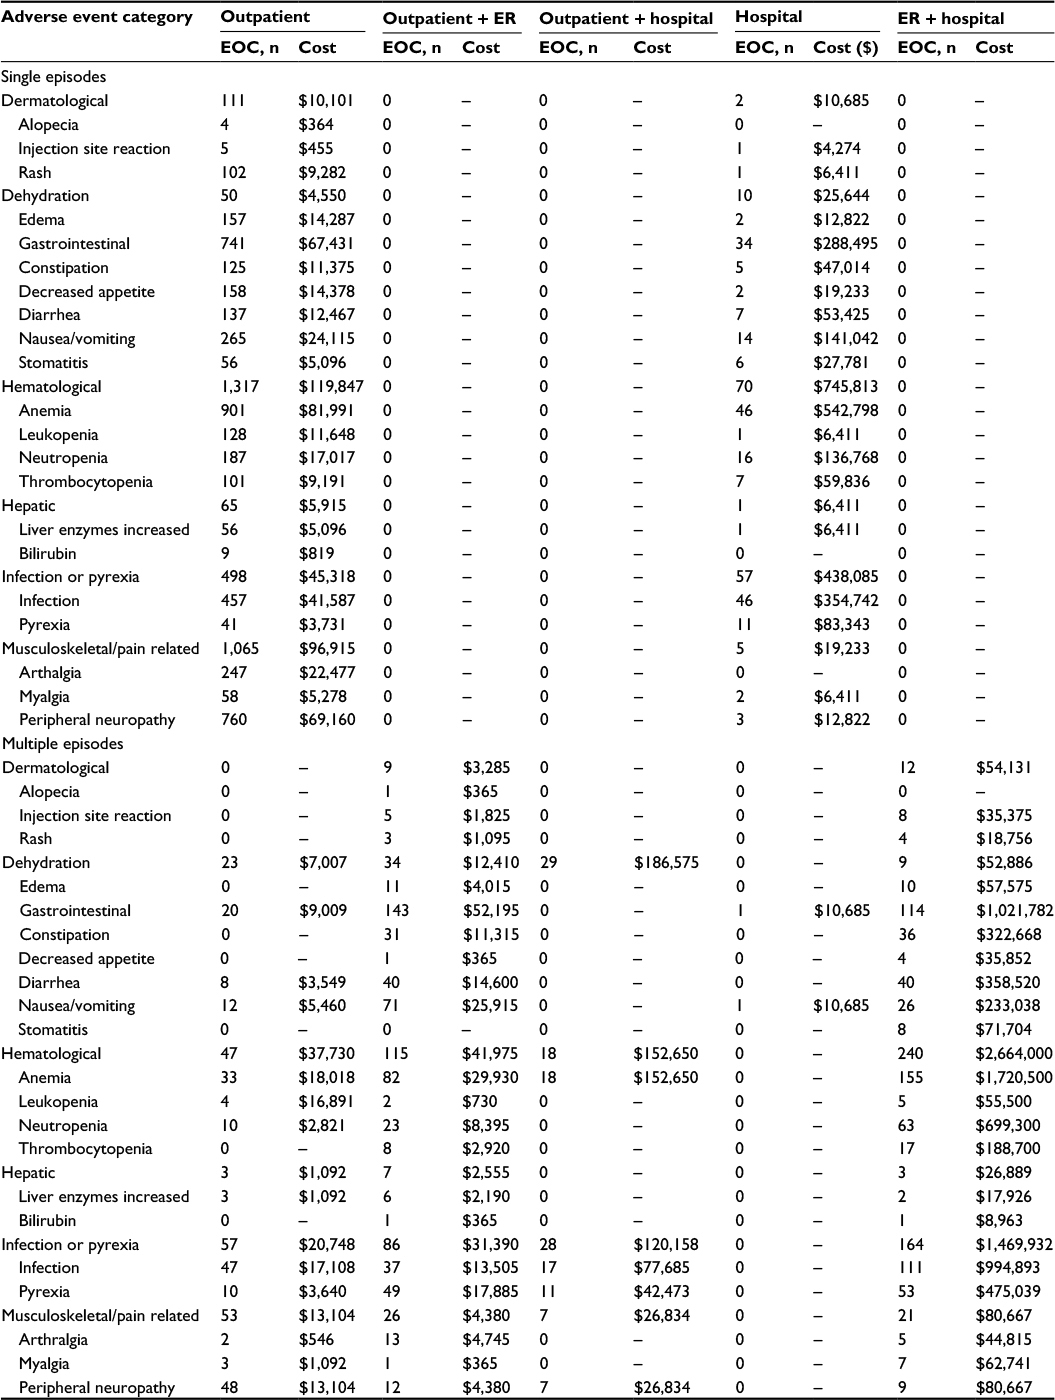 | Table 3 Descriptive data on total health care resource costs for each AE category (episode level) Abbreviations: ER, emergency room; EOC, episode of care; AE, adverse event. |
We computed the average cost per EOC for single and multiple episodes (Table 4). Total average cost per EOC for single episodes was $30,936 (±$10,352) and for multiple episodes was $35,223 (±$11,071). The average cost per EOC for single episodes was highest for hematological ($6,779±$2,218), gastrointestinal ($4,809±$1,001), and infection/pyrexia ($4,773±$2,258). The average cost per EOC for multiple episodes was similar to the single EOC in regard to the adverse events with the highest costs: hematological ($7,283±$1,181), gastrointestinal ($6,287±$1,752), and infection/pyrexia ($5,429±$1,858).
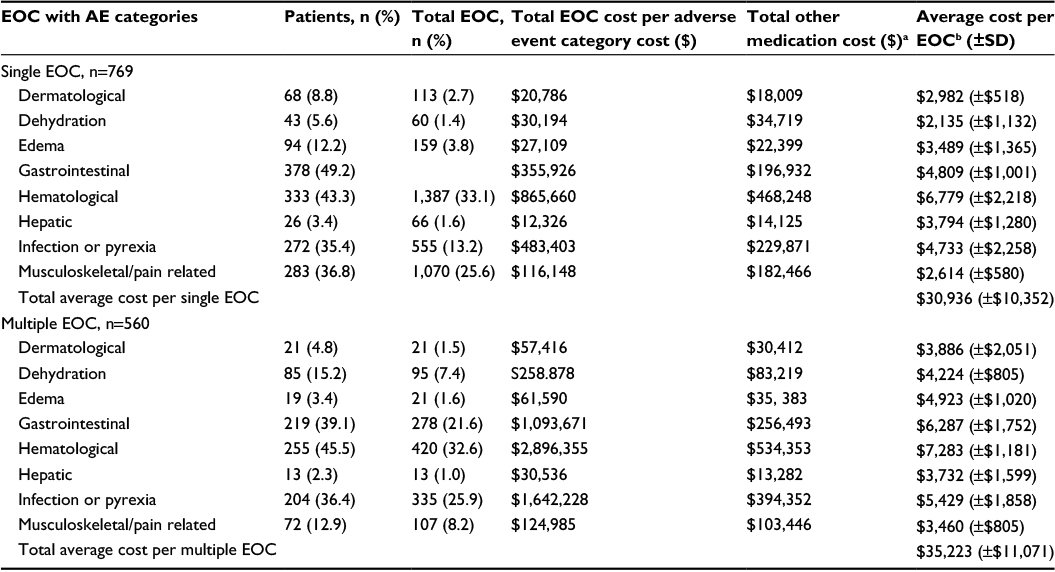 | Table 4 Descriptive economic data on 909 patients with AE during their first-line chemotherapy regimen Notes: aChemotherapy cost is not included in the total other medication costs. bAverage cost per EOC includes the average cost of other medications. Abbreviations: AE, adverse event; EOC, episode of care. |
Discussion
This study evaluated costs using an integrated managed care health care system of chemotherapy-related adverse events in patients with mBC. This analysis was also the first study to use EOC as the method to evaluate adverse events and costs and conduct a chart review to evaluate whether adverse events were related to chemotherapy. The costs of any adverse events related to chemotherapy overall are extremely substantial not only on the health care system but also emotionally on patients as well. Newer and innovative therapies are needed to help with alleviating these adverse events and reduce economic burden on any health plan or health system. In this study, hematological, gastrointestinal, and infection/pyrexia were most prevalent and incurred most cost. Prior studies may differ due to various databases used or different types of mBC patients. For example, Hassett et al7 reported fever/infection, neutropenia/thrombocytopenia, and dehydration as the most prevalent adverse events. The calculated cost of $12,907 per person per year was higher among women who received chemotherapy versus women who did not receive chemotherapy within 6 months of being diagnosed. Du et al8 reported frequencies of chemotherapy-related adverse events but not costs in a population of women with stage I through stage IV and ≥65 years of age. Most prevalent adverse events were anemia, neutropenia, and infection/fever.
The costs from previous studies maybe inflated from this study since they included chemotherapy and other medical services, such as laboratory tests, radiology, or other services within their costs. Previous studies have reported increase in costs with more adverse events due to hospitalizations, and we also observed a similar trend in this study where patients who have multiple EOC per adverse events category, incurred more costs, primarily driven by hospitalization rates.5–9 In this study, we also observed that anemia, neutropenia, nausea/vomiting, infection/pyrexia, and peripheral neuropathy were prevalent adverse events as demonstrated in previous studies.5–9 However, with differences in patient characteristics, and their individual prognosis, the rates vary. Prior studies all had different populations. Hurvitz et al5 and Hansen et al6 included patient populations from a commercial health plan younger than 65 years. Our population had both commercial and Medicare patients ≥18 years of age. Hassett et al7 used a sample of patient with mBC who were younger than 64 years. They also added expenditures for procedures or administration of chemotherapy medications, which were considered as ambulatory expenditures. The chemotherapy-related adverse events were identified using hospitalization or ER visit only. Du et al8 evaluated women with all stages of breast cancer, aged ≥65 years, and also used hospital visits to identify adverse events.
Overall, patients with mBC who receive chemotherapy are likely to experience an adverse event. These patients will incur higher costs to the health care system related to more health care visits, prescribing or administrating of other medications to alleviate the adverse events, and finally, cause a dose delay, dose discontinuation, or dose reduction to the chemotherapy regimen.18 All these impact the patient and health care system directly.
Limitations
There are some limitations with the data. All adverse events were identified with diagnosis and procedural codes, and laboratory data were not used to confirm specific adverse events such as anemia, leukopenia, neutropenia, or thrombocytopenia. Differences between the adverse events identified in this study versus those reported by clinical trials may be due to differences in patients’ demographic characteristics, prognoses within their disease state, and the use of various diagnosis and procedure codes rather than direct clinical assessment. There could also be an underestimation of the other medications used to help treat these adverse events because we used the dispense date between each EOC that was created and not dates between the 2-week gap.
We included the most common adverse events in patients using chemotherapy from the literature and previous clinical trials; however, we did not include all adverse events. One common adverse event is fatigue, and since this is a patient-reported event, we could not identify fatigue using diagnosis codes. We did not evaluate human epidermal growth factor receptor 2-positive or -negative status or evaluate targeted therapies in our sample, thus our sample consisted of patients on chemotherapy only. We also evaluated our databases to identify first-line chemotherapy regimens 12 months prior index date and could only capture what was found in our pharmacy databases and capture any chemotherapy dispensed outside of KPSC if a patient filled their prescription at a non-KPSC facility. Some patients could have been exposed to taxane utilization or possible use of systemic therapy in the adjuvant setting not within KPSC; however, we retrieved all claims, and we required that patients had membership and drug benefit eligibility as well during 6 months prior to index date. The results may not be generalizable to those patients who received another type of treatment or targeted therapies, since we evaluated chemotherapy only. The costs could be underestimated since we only evaluated the cost of the visit and not how the EOC was managed, for example, we did not capture how long each outpatient or ER visit was and what type of management (laboratory work, X-rays, consultations by different staff, procedures, etc.) was performed during the visit. All these have additional costs attributed to the EOC, but this is not included in this study. Finally, when we evaluated adverse events, we could not report what grade (3 or 4) or apply a scale of severity to them; however, if a patient was admitted to the hospital, this was an assumption that it had a level of severity.
Conclusion
This study suggests that adverse events related to chemotherapy for mBC lead to a substantial economic burden that is primarily explained by outpatient, ER, and hospital visits as well as other medications needed to treat these adverse events. While newer targeted therapies are costly and may not offset the cost of adverse events of chemotherapy, personalized medicine may change the mBC therapy landscape, alleviating adverse events, improving adherence, and potentially increasing overall survival.
Acknowledgments
This study was sponsored by Genentech Inc. Doctor Rashid, Doctor Koh, and all KPSC coauthors do not have any financial interests or potential conflict of interest with regard to the work.
Disclosure
Doctor Masaquel and Doctor Malecha are employees of Genentech Inc. The authors report no other conflicts of interest in this work.
References
Lu J, Steeg PS, Price JE, et al. Breast cancer metastasis: challenges and opportunities. Cancer Res. 2009;69(12):4951–4953. | ||
AdvancedBC.org. [webpage on the Internet]. Silent Voices: Women with Advanced (Metastatic) Breast Cancer Share Their Needs and Preferences for Information, Support and Practical Service; 2014. Available from: http://www.advancedbc.org/node/26. Accessed September 9, 2014. | ||
Madell, R. Metastatic Breast Cancer: Life Expectancy and Prognosis. Healthline; 2014. Available from: http://www.healthline.com/health/breast-cancer/metastatic-prognosis. Accessed September 1, 2014. | ||
Sorensen SV, Feng Pan JWG, Chen C, et al. Incidence-based cost-of-illness model for metastatic breast cancer in the United States. Int J Technol Assess Health Care. 2012;28(1):12–21. | ||
Hurvitz S, Guerin A, Brammer M, et al. Investigation of adverse-event-related costs for patients with metastatic breast cancer in a real world setting. Oncologist. 2014;19(9):1–8. | ||
Hansen RN, Ramsey S, Lalla D, et al. Identification and cost of adverse events in metastatic breast cancer in taxane and capecitabine based regimens. Springerplus. 2014;3:259. | ||
Hassett MJ, O’Malley AJ, Pakes JR, Newhouse JP. Frequency and cost of chemotherapy-related serious adverse effects in a population sample of women with breast cancer. J Natl Cancer Inst. 2006;98(16):1108–1117. | ||
Du XL, Osbourne C, Goodwin JS. Population-based assessment of hospitalizations for toxicity from chemotherapy in older women with breast cancer. J Clin Oncol. 2002;20(24):4636–4642. | ||
Vera-Llonch M, Weycker D, Glass A, et al. Healthcare costs in women with metastatic breast cancer receiving chemotherapy as their principal treatment modality. BMC Cancer. 2011;11:250. | ||
Koebnick C, Langer-Gould AM, Gould MK, et al. Sociodemographic characteristics of members of a large, integrated health care system comparison with US Census Bureau data. Perm J. 2012;16(3):37–41. | ||
Shapiro CL, Recht A. Side effects of adjuvant treatment of breast cancer. N Engl J Med. 2001;2001(26):1997–2008. | ||
Mehta SS, Suzuki S, Glick HA, Schulman KA. Determining an episode of care using claims data. Diabetic foot ulcer. Diabetes Care. 1999;22(7):1110–1115. | ||
Flaherman VJ, Ragins AI, Li XS, Kipnis P, Masaquel A, Escobar GJ. Frequency, duration and predictors of bronchiolitis episodes of care among infants >32 weeks gestation in a large integrated healthcare system: a retrospective cohort study. BMC Health Serv Res. 2012;12:144–152. | ||
Kaiser Permanente [webpage on the Internet]. 2013 Charge Master List; 2013. Available from: http://xnet.kp.org/hospitalcharges/downloads/2013_CDM.pdf. Accessed February 11, 2014. | ||
Kaiser Permanente. 2013 Sample Fee List for Southern California; 2013. Available from: https://www.google.com/#q=kaiser+sample+fee+list+southern+california. Accessed February 11, 2014. | ||
www.cl.kp.org/redbook.com/AWP/AWP unit prices. Accessed March 2015. Accessed March 1, 2015. | ||
Drugstore [homepage on the Internet]. www.drugstore.com. Accessed March 2015. | ||
Rashid N, Koh HA, Baca HC, et al. Clinical impact of chemotherapy-related adverse events in patients with metastatic breast cancer in an integrated health care system. J Manag Care Spec Pharm. 2015;21(10):863–871. |
 © 2016 The Author(s). This work is published and licensed by Dove Medical Press Limited. The full terms of this license are available at https://www.dovepress.com/terms.php and incorporate the Creative Commons Attribution - Non Commercial (unported, v3.0) License.
By accessing the work you hereby accept the Terms. Non-commercial uses of the work are permitted without any further permission from Dove Medical Press Limited, provided the work is properly attributed. For permission for commercial use of this work, please see paragraphs 4.2 and 5 of our Terms.
© 2016 The Author(s). This work is published and licensed by Dove Medical Press Limited. The full terms of this license are available at https://www.dovepress.com/terms.php and incorporate the Creative Commons Attribution - Non Commercial (unported, v3.0) License.
By accessing the work you hereby accept the Terms. Non-commercial uses of the work are permitted without any further permission from Dove Medical Press Limited, provided the work is properly attributed. For permission for commercial use of this work, please see paragraphs 4.2 and 5 of our Terms.