")
Back to Journals » HIV/AIDS - Research and Palliative Care » Volume 8
Economic and health implications from earlier detection of HIV infection in the United Kingdom
Received 21 September 2015
Accepted for publication 29 December 2015
Published 15 March 2016 Volume 2016:8 Pages 67—74
DOI https://doi.org/10.2147/HIV.S96713
Checked for plagiarism Yes
Review by Single anonymous peer review
Peer reviewer comments 5
Editor who approved publication: Professor Bassel Sawaya
Vladimir Zah,1,2 Mondher Toumi1
1Ecole Doctoral Interdisciplinaire Sciences-Santé (EDISS), University of Lyon, Lyon, France; 2ZRx Outcomes Research Inc., Mississauga, Canada
Purpose: To model the budget and survival impact of implementing interventions to increase the proportion of HIV infections detected early in a given UK population.
Patients and methods: A Microsoft Excel decision model was designed to generate a set of outcomes for a defined population. Survival was modeled on the Collaboration of Observational HIV Epidemiological Research Europe (COHERE) study extrapolated to a 5-year horizon as a constant hazard. Hazard rates were specific to age, sex, and whether detection was early or late. The primary outcomes for each year up to 5 years were: annual costs, numbers of infected cases, hospital admissions, and surviving cases. Three locations in the UK were chosen to model outcomes across a range of HIV prevalence areas: Lambeth, Southwark, and Lewisham (LSL), Greater Manchester Cluster (GMC), and Kent and Medway (K&M).
Results: In LSL, the projected cumulative cost savings over 5 years were £3,210,206 or £5,290,206 when including the value of the 104 life-years saved. Savings were insensitive to transmission rates, but sensitive in direct proportion to the percentage shift from late to early detection. In GMC, savings were in a similar proportion to LSL, but the magnitude was smaller, as a consequence of the lower base-case HIV prevalence. In K&M, with a smaller population and lower HIV prevalence than GMC, savings were commensurately smaller (£733,202 cumulatively over 5 years).
Conclusion: The results strengthen the rationale for implementing increased testing in high prevalence areas. However, in areas of low prevalence, it is unlikely that costs will be returned over a 5-year period.
Keywords: HIV, testing, costs, savings, model
Introduction
At the end of 2011, it was estimated that 96,000 people in the UK were infected with HIV, with approximately 24% unaware of their infection.1 At the end of 2013, it was estimated that 107,800 people in the UK were infected with HIV, with unchanged number of approximately 24% unaware of their infection.2
In 2011, the estimated prevalence of HIV was 1.5 per 1,000 population (all ages), with a greater proportion of infected males (2.1 per 1,000) than females (1.0 per 1,000),1 whereas in 2013, Public Health England reported the estimated prevalence of HIV among 15–59 year-olds only, to be 2.8 per 1,000 population, with a greater proportion of infected males (3.7 per 1,000) than females (1.9 per 1,000).2
A late diagnosis of HIV is the most important predictor of morbidity and short-term mortality in HIV infected individuals. It has been estimated that the difference in predicted life expectancy between early diagnosis (CD4 count 432 cells/μL) and late diagnosis (CD4 count 140 cells/μL) is 3.5 years.3 Other studies have confirmed that early detection and high CD4 counts can result in life expectancies similar to those of the general population.4,5 A direct benefit of early detection is that infected individuals can immediately start antiretroviral treatment (ART) if they meet the treatment initiation criterion, which for the UK is a CD4 cell count below 350 cells/μL.6 In the UK, individuals diagnosed late with HIV are six times more likely to die of AIDS than those diagnosed earlier.7 Not only does early detection increase life expectancy, but it also decreases the annual cost of health care.8–10
There has been an overall trend in the UK towards earlier detection; at the end of 2011, it was estimated that 47% of individuals were diagnosed late within 3 months of their diagnosis (CD4 cell count <350 cells/μL), which had improved to only 42% by 2013.2 Nevertheless, a high number of new HIV infections is still diagnosed late, and this includes 24% of individuals who were severely immunocompromised (CD4 count <200 cells/μL).1
The UK national guidelines on HIV testing reflect the need for earlier detection and intervention.11 Universal screening is recommended in genitourinary and sexual health clinics, antenatal services, termination of pregnancy services, drug dependency programs, and health care services for individuals diagnosed with tuberculosis, hepatitis B and C, and lymphoma. In addition, the British HIV Association (BHIVA) guidelines state that where HIV prevalence in the local population exceeds two per 1,000, there should be screening for all persons registering at a general practice (GP) and all general medical admissions, and that the test should be offered to all high risk groups.11
Much of the evidence for the cost-effectiveness of screening comes from modeling studies in the US, where the incremental cost-effectiveness ratio for routine HIV testing in an inpatient setting was estimated at $38,600 per quality-adjusted life year (QALY) gained, whilst testing every 5 years for high risk patients in the outpatient setting cost $50,000–$57,000 per QALY gained.12,13 When other variables remained constant, estimated incremental cost-effectiveness ratios fell (ie, became more favorable) as the prevalence of HIV infection increased. This provides an economic rationale for expanding universal screening programs to all geographic areas where the prevalence exceeds a given threshold.
The economics of screening become even more favorable when indirect effects are taken into account.12 Early detection of HIV-positive status may reduce the rate of onward viral transmission, reducing the number of infected individuals and the consequent cost burden within the population at risk. Depending on the local prevalence, early detection may even be cost-saving, and could be linked to other public health measures, such as vaccination programs. National HIV testing guidelines and National Institute for Health and Care Excellence (NICE) guidance recommend expanding HIV testing in high prevalence areas, defined as those with a diagnosed prevalence of greater than two per 1,000.11,14,15 This includes 54 local authorities in England.
Measuring the economic benefits of early detection could help inform decision makers within health care trusts and other commissioning bodies on the possible return on investment of interventions to increase the uptake of testing. This model forecasts the impact of implementing expanded testing on health care system costs and population survival over a 5-year time period. It illustrates these outcomes for a selected range of geographical settings representing patterns of HIV epidemiology in England, UK.
Material and methods
The model framework
Microsoft Excel (Microsoft Corporation, Redmond, WA, USA) decision model was designed to estimate the potential budget and survival impact of implementing interventions to increase the uptake of HIV testing and achieving an increase in the proportion of cases that are detected early in a given population within the UK.
For any given population, two scenarios are constructed: current and future. The two scenarios differ only in the proportions of newly detected cases that are diagnosed early or late. For the current scenario, proportions of early and late diagnoses are represented by 2014 data, while for the future scenario, there is a 50% relative shift from current scenario late to early HIV detection. Other input requirements include: population size split by age (<50 years, ≥50 years), sex, the incidence of newly-detected HIV cases per annum, and the proportion of early- and late-diagnosed patients receiving ART. Other input parameters are set at default values, though they may be altered by users to allow sensitivity analyses. These parameters include epidemiological assumptions to model survival and transmission; and the annual costs of HIV care contingent on disease status.
This decision model generates a set of outcomes for the defined population under the current and future scenarios. The primary outcomes are annual costs, numbers of infected cases, hospital admissions, and surviving cases, for each year to a maximum 5-year horizon. From these primary data, differential outcomes between scenarios are calculated: cost savings, infected cases avoided, and deaths avoided.
The investment costs are deducted from the savings in the overall cost impact calculation. The calculation of cost impact can optionally include a monetary valuation of survival, for example, £20,000 per life-year gained. By monetizing the flows of survival for each scenario, the net present value of the intervention can be calculated; where net present value >0, the decision rule would be to implement the intervention. The model does not explicitly allow for utility adjustment of survival. Alternatively, omitting a valuation of survival corresponds to a budget impact analysis. As the model covers a period of 5 years, all flows of costs and survival are discounted to present values at 3.5% per annum.16,17
Epidemiological assumptions and data
Survival (S) was modeled based upon the Collaboration of Observational HIV Epidemiological Research Europe (COHERE) study4 and extrapolated to a 5-year time (t) horizon as a constant hazard.5 No ethical permission was required for this study, as the COHERE study data was previously published and ethical permission was previously retained. Hazard rates were specific to age, sex, and early or late detection, defined as a CD4 cell count of >350/μL or <350/μL, respectively. The constant per annum risk of death is r, with the expected survival after 1 year in a population of HIV infected patients being:

When expressed more generally, for a population of N patients infected with HIV, survival over time was represented by the hazard function:

Survival in years (S(t)) 1 to 5 is evaluated at the beginning of each year. Therefore, the specific structure of the equation becomes:

Accounting for sex differences in survival rates, the survival function becomes:

where subscripts M and F denote male and female respectively, and t denotes time.
This framework allows modeling of the survival benefits associated with a given shift in the proportion of late and early diagnoses. The number of life-years gained over t years from a percentage point shift in the distribution is derived using the hazard rates associated with late and early HIV detection, respectively.
Based on literature review, it was assumed that older adults (≥50 years) that are diagnosed late have a 2.4 times greater risk of dying within a year of diagnosis versus older adults diagnosed early. Older adults (>= 50 years) diagnosed late were 14 times more likely to die within a first year of diagnosis compared to older adults diagnosed early.18
The assumptions that 14% of all newly-diagnosed HIV infections occur in individuals aged over 50 years and that 64% of these are males were combined with life expectancy data from a cohort of recently-diagnosed individuals in the Netherlands to generate the survival probabilities in Table 1.5,18,19
 | Table 1 Survival data by stage of HIV presentation |
HIV transmission rates were modeled using scaling parameters and multipliers which reflect population average transmission data on a per infected person basis. Infections in a year are uniquely determined by the number of infected individuals in the year, plus the estimated new infections occurring in the population based upon the transmission coefficient determined by the scaling parameters employed. The assumed number of onward transmissions avoided per year per positive patient was 0.02773.15 This value was the default for the transmission multiplier scalar.
Cost impact calculations
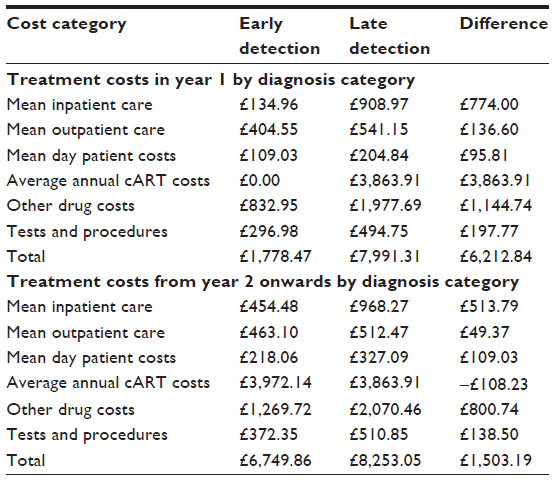
In order to calculate the total medical care costs incurred for the cohort under the current and future scenarios, each year of survival of an individual was multiplied by the appropriate annual cost. The annual cost is the sum of all categories of HIV clinical care from a payer perspective and includes inpatient, outpatient, and day patient care, test procedures, costs of ART (based upon current BHIVA guidelines) and other drugs.6 Costs for these resource categories were taken from data collected by the National Prospective Monitoring System from 1996–2006.8,9 The costs applied depend on whether each individual is treatment-naïve or treatment-experienced and, within these categories, whether they are diagnosed early or late. The cost differentials depicted in Table 2 between treatment-naïve and treatment-experienced patients reflect the empirical findings that the direct costs of care in the year following a diagnosis of HIV are driven almost exclusively by the timing of the diagnosis (early versus late), rather than the patient characteristics (age, race, other demographic variables, and even severity of illness).8,20 Therefore, the higher treatment costs reported with late stage detection are not the result of factors correlating with the timing of the HIV diagnosis, but rather reflect the independent effect of an early versus late diagnosis after controlling for other confounding factors.
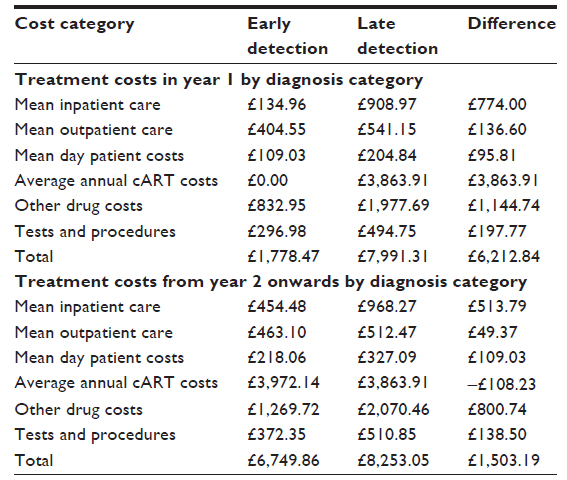 | Table 2 Annual costs by category according to early versus late HIV diagnosis |
Settings and assumptions for analyses
An analysis was made for three localities selected to represent the wide range of HIV prevalence in England. The localities are based on clusters of local authorities or boroughs served by former PCTs in which HIV care and support services are commissioned collaboratively:
- Lambeth, Southwark, and Lewisham (LSL). These three South London boroughs are contiguous. In 2011, Lambeth and Southwark had the highest diagnosed HIV prevalence in England, at 13.9 and 11.3 per 1,000 population aged 15–59 years respectively, while Lewisham had a corresponding prevalence of 7.5. Hence LSL represents an extreme example of a high prevalence cluster.
- Greater Manchester Cluster (GMC). Ten former PCTs comprise GMC, and include the inner city (Manchester PCT and Salford PCT, with prevalence of 5.2 and 3.6 respectively) and the surrounding PCTs within the Manchester conurbation: Ashton, Leigh, and Wigan PCT, Bolton PCT, Bury PCT, Heywood, Middleton and Rochdale PCT, Oldham PCT, Stockport PCT, Tameside and Glossop PCT, and Trafford PCT. These eight former PCTs had a prevalence in the range 0.8–1.6. Hence, GMC represents a diverse mix of high and low prevalence.
- Kent and Medway (K and M). This cluster includes the three former PCTs: Eastern and Coastal Kent, West Kent, and Medway that comprise the pre-1971 county of Kent, which is a diverse mix of rural and urban communities. HIV prevalence is fairly uniform across the cluster and at 0.9 is below the national average; K and M therefore represents a low prevalence cluster.
The base-case input assumptions for the analyses were:
- a current scenario of 47.8% of HIV diagnoses made late (CD4 cell count <350 per μL). This was assumed to apply to all three localities.
- A future scenario of a 50% relative shift from late to early diagnosis: ie, diagnoses made late reduced from 47.8% to 23.9%.
- The number of newly detected HIV local patients in 2014 was divided by the total local population in each locality in order to estimate the newly detected HIV per annum percentages.
- Patients were treatment-naïve for the first year after diagnosis; thereafter patients were considered to be treatment-experienced.
- The monetary valuation of a life-year saved was £20,000.
The cost of medical care was calculated to a 5-year horizon, with and without a valuation of survival. The number of HIV infections avoided, cumulative life-years gained, the cumulative cost impact by resource category, and the cumulative net saving by elapsed year were calculated for each locality. One-way sensitivity analyses were used to test the impact of excluding the monetary value of life-years and the effects of assuming: a) no onward transmission of HIV infection and b) a 5.546% rate of transmission, ie, double the default rate of 2.773%.
Results
Figures 1–3 graphically illustrate the cumulative financial impact of achieving shifts to early diagnosis for LSL, GMC, and K and M, respectively. In each figure, the left-hand panel shows the total savings under the base-case future scenario (50% shift from late to early diagnosis, 2.773% transmission rate) and the alternative future scenarios. Also shown are indicative costs based on estimates made by the UK Health Protection Agency (HPA) from pilot National Health Service projects to expand HIV testing.21 The right-hand panels show the breakdown of cost categories that comprise the base-case savings as segments of stacked bars. The top bar segment in white represents the valuation of life-years saved at £20,000 each, so such valuation can be included or excluded by viewing the full bar or only the colored segments, respectively.
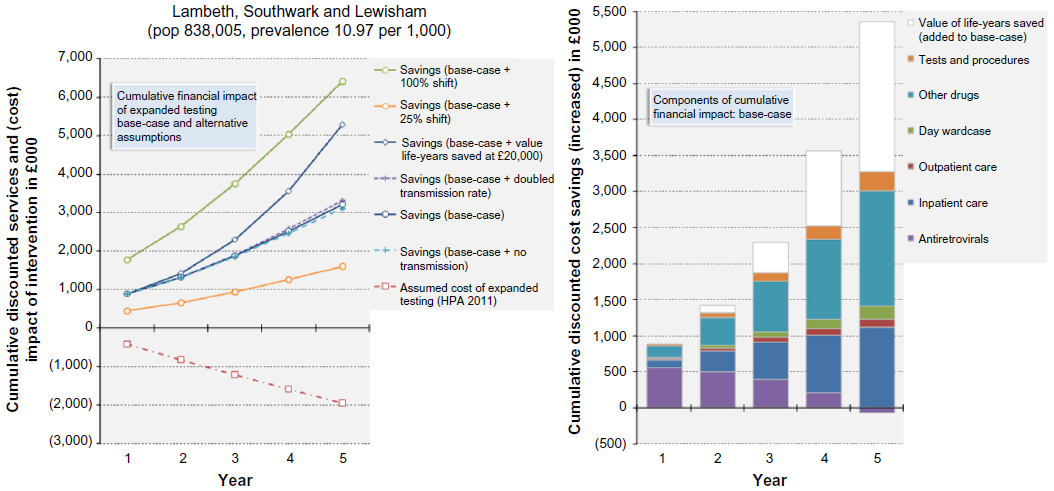 | Figure 1 Financial impact of future versus current scenario for Lambeth, Southwark, and Lewisham. |
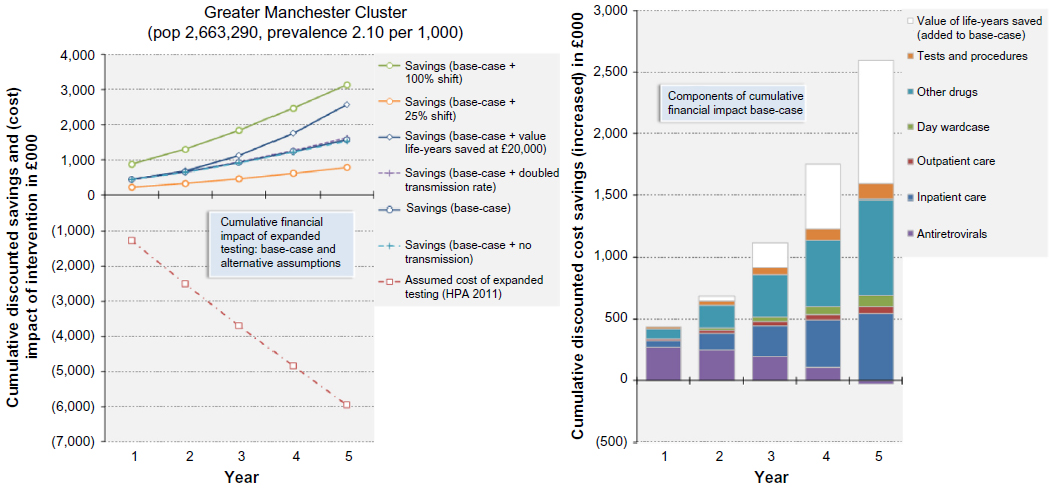 | Figure 2 Financial impact of future versus current scenario for the Greater Manchester Cluster. |
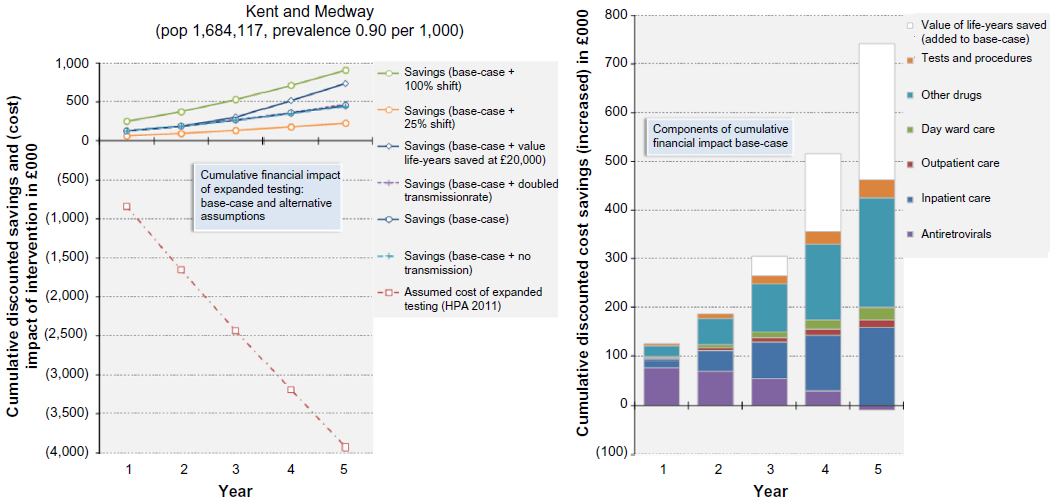 | Figure 3 Financial impact of future versus current scenario for Kent and Medway. |
LSL
In LSL (population 838,005), an estimated 53 transmitted infections were avoided and 104 life-years saved at year 5. These and the cases detected earlier gave rise to projected savings rising from £887,975 in year 1 to a cumulative value of £5,290,206 at year 5. By year 5, the greatest component of the savings was the value of the projected 104 life-years saved. If this was excluded, year 5 cumulative savings were £3,210,206, and the largest components of savings were due to reduced use of “other drugs”, ie, drugs for prophylaxis and treatment of HIV complications, followed by savings in inpatient care from avoided hospital admissions. The pattern of use of antiretrovirals showed a decrease in expenditure in year 1, which was eroded over time until by year 5 a small cumulative increase resulted (as more patients remained alive and were therefore exposed to treatment in the future scenario). The savings were insensitive to the transmission rate within the 5-year analytic horizon, but were sensitive in direct proportion to the percentage shift from late to early diagnosis, such that savings would be doubled if a complete (100%) shift to early diagnosis was achieved.
When the potential savings are viewed alongside the possible costs of implementing a program of testing all acute hospital admissions and new GP registrations, it can be seen that cumulative savings from the base-case exceed cumulative costs from year 1 through year 5, and do so without invoking any valuation of life-years saved.
GMC
The components of savings for GMC and the impact of sensitivity analyses show similar proportions as for LSL, but the absolute magnitude of savings is much smaller, at £2,564,802 for the base-case at year 5. This is a consequence of the overall prevalence in GMC standing at 2.1 per 1,000, as compared to 10.97 per 1,000 in LSL, even though the population of GMC is three times that of LSL. An estimated 26 transmitted infections were avoided and 50 life-years saved at year 5. The cost impact of implementing testing of all acute admissions and new GP registrants is assumed to be in direct proportion to population for the purposes of this analysis, and as a result, exceeds the projected savings from a 50% shift to early detection, using HPA’s cost assumptions.
K and M
K and M has a smaller population than GMC and a lower HIV prevalence, at 0.90 per 1,000. As a result, the potential savings from the base-case are commensurately smaller, at £733,202 to year 5 cumulatively. Seven transmitted infections were avoided and 14 life-years saved at year 5. The savings figures are greatly exceeded by the testing costs under all sensitivity analyses, illustrating that the economic case for expanding testing is less secure in low prevalence localities, where the cost per positive case detected will be relatively high.
Discussion
Savings that could be achieved from earlier detection of HIV infection in different localities were estimated. The estimates critically depend on whether the assumed shifts in late to early detection actually occur. For the purposes of the base-case analyses, we have assumed a 50% shift, reducing the national proportion of late diagnoses from approximately 42% to 21%. This figure was chosen because 50% success might be viewed as the minimum plausible outcome for expanded testing programs to be considered. As the scenarios show, the main driver of cost savings is the shift actually achieved from late to early diagnosis: a 100% shift whereby all cases diagnosed early would double the base-case savings.
Further, HPA estimates of the cost of implementing what are believed to be the most promising strategies to achieve earlier detection: opt-out testing of all acute hospital admissions and opt-out testing of all new GP registrants in high-prevalence areas, were included. These costs are based on the findings from five hospitals and three primary care pilots. In the former, costs per test ranged from £3.11 to £12.15, and in the latter, £13.32 (Lewisham) to £26.35 (Brighton). We used the HPA’s estimated costs for LSL and GMC based on population size, which assumed average costs of £8 and £7.60 per hospital and GP test respectively, and a 75% coverage rate. For K and M, we estimated costs from its proportional population size. These costs must be considered indicative only and it is conceivable that, once implemented, they could be reduced by economies of scale, scope, and learning effects. Evidence is lacking on the quantitative relationship linking the number of tests likely to be performed following a policy decision and the resulting shift to early detection. In the London and Leicester pilots, 7–11 cases were found per 1,000 tests administered, while in Brighton the pilots found fewer than two new cases per 1,000 tests, which seems surprisingly low for such a high-prevalence locality.
The range of costs and benefits that are included in the economic calculation depend on the perspectives and attitudes of the decision-maker. For economic evaluations submitted to NICE, a formal cost-utility analysis is required with a threshold of £20,000–£30,000 per QALY gained.22 We did not formally utility-adjust survival in this study, as the observation period is only 5 years, thus too short to see any major impact, especially considering previously reported 0.07/QALY difference between early and late HIV detected patients.23 In the interest of avoiding complexity, £20,000 per life-year saved was taken as a reasonable proxy for NICE’s stated cost-utility threshold. Economic evaluations submitted to NICE should consider all relevant National Health Service costs, measured over the full period of time that they accrue. The horizon of this study was limited to 5 years because any investment to hasten HIV detection is likely to have to be self-financing within a short timescale, as political structures and national health priorities may change. Even though relatively few deaths occurred in the 5-year timescale, the impact of valuing life-years saved at £20,000 per annum becomes substantial by year 5. In contrast, avoidance of onward HIV transmission has a small impact on costs over the 5-year timescale of this analysis, but this effect would be compounded to become more significant in a lifetime analysis. Though payback within 5 years was only shown for LSL in our analysis, localities with lower prevalence are likely to achieve payback if a sufficient timeframe was set to accrue the benefits of avoided transmissions and mortality.
This study has a number of limitations. The cost inputs were derived from the most comprehensive source available in the UK: the National Prospective Monitoring System, which has been recording the care provided to HIV patients at 15 participating hospitals since 1996. The assumed base-case rate of transmissions avoided per positive individual of 2.773% is a national average.5,16 The actual figure is likely to vary between areas according to prevalence. In the absence of data, we performed sensitivity analyses around feasible ranges for this parameter.
Conclusion
Local commissioners are in the best position to determine how best to interpret and comply with the 2008 national testing guidelines given their at-risk populations and configuration of health services. Ideally, it would be possible to identify a break-even point at which the prevalence is sufficient to generate cost savings that outweigh the costs of testing within a reasonable timescale. This point may become apparent once expanded testing is implemented on a larger scale. Meanwhile, results from this study strengthen the case for testing in high-prevalence areas.
Disclosure
The authors report no conflicts of interest in this work.
References
Health Protection Agency. HIV in the United Kingdom: 2012 Report. London: Health Protection Services; 2012. Available from: https://www.gov.uk/government/uploads/system/uploads/attachment_data/file/335452/HIV_annual_report_2012.pdf. Accessed January 4, 2016. | |
Public Health England. HIV in the United Kingdom: 2014 Report. London: Public Health England; 2014. Available from: https://www.gov.uk/government/uploads/system/uploads/attachment_data/file/401662/2014_PHE_HIV_annual_report_draft_Final_07-01-2015.pdf. Accessed January 4, 2016. | |
Nakagawa F, Lodwick RK, Smith CJ, et al. Projected life expectancy of people with HIV according to timing of diagnosis. AIDS. 2011;26(3):335–343. | |
Lewden C, the Mortality Working Group of COHERE. Time with CD4 count above 500 cells/mm3 allows HIV-infected men, but not women, to reach similar mortality rates to those of the general population: a 7-year analysis. Seventeenth Conference on Retroviruses and Opportunistic Infections; February 16–19 2010; San Francisco, CA. Abstract 527. | |
van Sighem A, Gras L, Reiss P, Brinkman K, de Wolf F. Life expectancy of recently diagnosed asymptomatic HIV-infected patients approaches that of uninfected individuals. Seventeenth Conference on Retroviruses and Opportunistic Infections; February 16–19 2010; San Francisco, CA. Abstract 526. | |
Williams I, Chulrchill D, Anderson J, et al. British HIV Association guidelines for the treatment of HIV-1 positive adults with antiretroviral therapy 2012. HIV Med. 2012;13 Suppl 2:1–85. | |
bhiva.org [homepage on the Internet]. People diagnosed late in the UK are six times more likely to die of AIDS. British HIV Association; 2011. Available from: http://www.bhiva.org/News.aspx?NewsID= 870a36f4-9fea-4a31-ada0-1e5fafd927d3. Accessed January 4, 2016. | |
Beck EJ, Mandalia S, Lo G, et al. Cost-effectiveness of early treatment with first-line NNRTI-based HAART regimens in the UK, 1996–2006. PLoS One. 2011;6(5):e20200. | |
Beck EJ, Mandalia S, Sangha R, et al. The cost-effectiveness of early access to HIV services and starting cART in the UK, 1996–2008. PLoS One. 2011;6(12):e27830. | |
Krentz HB, Auld MC, Gill MJ. The high cost of medical care for patients who present late (CD4 <200 cells/microL) with HIV infection. HIV Med. 2004;5(2):93–98. | |
British HIV Association, British Association of Sexual Health and HIV, British Infection Society. UK national guidelines for HIV testing 2008. London: BHIVA/BASHH, BIS; 2008. Available from: http://www.bhiva.org/documents/guidelines/testing/glineshivtest08.pdf. Accessed January 4, 2016. | |
Walensky RP, Freedberg KA, Weinstein MC, Paltiel AD. Cost-effectiveness of HIV testing and treatment in the United States. Clin Infect Dis. 2007;45 Suppl 4:S248–S254. | |
Sanders GD, Bayoumi AM, Holodniy M, Owens DK. Cost-effectiveness of HIV screening in patients older than 55 years of age. Ann Intern Med. 2008;148(12):889–903. | |
National Institute for Health and Care Excellence [homepage on the Internet]. HIV testing: increasing uptake in black Africans. NICE guidelines [PH33]; 2011. Available from: https://www.nice.org.uk/guidance/ph33. Accessed January 4, 2016. | |
National Institute for Health and Care Excellence [homepage on the Internet]. HIV testing: increasing uptake in men who have sex with men. NICE guidelines [PH34]; 2011. Available from: https://www.nice.org.uk/guidance/ph34. Accessed January 4, 2016. | |
National Institute for Health and Clinical Excellence. Discounting of health benefits in special circumstances. NICE; 2011. Available from: http://www.nice.org.uk/guidance/ta235/resources/osteosarcoma-mifamurtide-discounting-of-health-benefits-in-special-circumstances2. Accessed January 4, 2016. | |
HM Treasury. The Green Book: appraisal and evaluation in central government. London: The Stationery Office; 2011. | |
Smith RD, Delpech VC, Brown AE, Rice BD. HIV transmission and high rates of late diagnoses among adults aged 50 years and over. AIDS. 2010;24(13):2109–2115. | |
Health Protection Agency. United Kingdom New HIV diagnoses to end of June 2011. London: Health Protection Services; 2011. | |
Krentz HB, Gill MJ. The direct costs of late presentation (<350/mm) of HIV infection over a 15-year period. AIDS Res Treat. 2012;2012:757135. | |
Health Protection Agency. Evidence and resources to commission expanded HIV testing in priority medical services in high prevalence areas. London: Health Protection Agency; 2012. Available from: http://www.boltonshealthmatters.org/sites/default/files/Evidence%20to%20commission%20expanded%20HIV%20testing.pdf. Accessed January 4, 2016. | |
Appleby J, Devlin N, Parkin D, Buxton M, Chalkidou K. Searching for cost effectiveness thresholds in the NHS. Health Policy. 2009; 91(3):239–245. | |
Schackman BR, Goldie SJ, Freedberg KA, et al. Comparison of health state utilities using community and patient preference weights derived from a survey of patients with HIV/AIDS. Med Decis Making. 2002;22(1):27–38. |
 © 2016 The Author(s). This work is published and licensed by Dove Medical Press Limited. The full terms of this license are available at https://www.dovepress.com/terms.php and incorporate the Creative Commons Attribution - Non Commercial (unported, v3.0) License.
By accessing the work you hereby accept the Terms. Non-commercial uses of the work are permitted without any further permission from Dove Medical Press Limited, provided the work is properly attributed. For permission for commercial use of this work, please see paragraphs 4.2 and 5 of our Terms.
© 2016 The Author(s). This work is published and licensed by Dove Medical Press Limited. The full terms of this license are available at https://www.dovepress.com/terms.php and incorporate the Creative Commons Attribution - Non Commercial (unported, v3.0) License.
By accessing the work you hereby accept the Terms. Non-commercial uses of the work are permitted without any further permission from Dove Medical Press Limited, provided the work is properly attributed. For permission for commercial use of this work, please see paragraphs 4.2 and 5 of our Terms.