")
Back to Journals » Breast Cancer: Targets and Therapy » Volume 9
Economic analysis of the breast cancer screening program used by the UK NHS: should the program be maintained?
Authors Morton R, Sayma M, Sura MS
Received 30 September 2016
Accepted for publication 15 February 2017
Published 24 March 2017 Volume 2017:9 Pages 217—225
DOI https://doi.org/10.2147/BCTT.S123558
Checked for plagiarism Yes
Review by Single anonymous peer review
Peer reviewer comments 4
Editor who approved publication: Professor Pranela Rameshwar
Robert Morton,1,2 Meelad Sayma,1,3 Manraj Singh Sura,1,4
1Imperial College Business School, Imperial College London, London, 2Department of Medicine, University of Aberdeen, Aberdeen, 3Knowledge Spa, Peninsula College of Medicine and Dentistry, Truro, 4Department of Medicine, University of Birmingham, Birmingham, UK
Introduction: One key tool thought to combat the spiraling costs of late-stage breast cancer diagnosis is the use of breast cancer screening. However, over recent years, more effective treatments and questions being raised over the safety implications of using mammography have led to the cost-effectiveness of breast cancer screening to be highlighted as an important issue to investigate.
Methods: A cost–utility analysis was conducted to appraise the breast cancer screening program. The analysis considered the breast cancer screening program and its utility over a 20-year period, accounting for the typical breast cancer screening period taking place between the ages of 50 and 70 years. Analysis was conducted from the perspective of the UK National Health Service (NHS). This accepted NHS threshold was utilized for analysis of £20,000/quality-adjusted life year (QALY)–£30,000/QALY gain. A systematic literature review was conducted to obtain relevant financial, health, and probability outcomes pertaining to the breast cancer screening program.
Results: The mean incremental cost-effectiveness ratio (ICER) calculated was at a value of £11,546.11 with subsequent sensitivity analysis conducted around this value. Three sensitivity analyses were undertaken to evaluate ICERs of a range of scenarios which could occur as the following: 1) maximum costs at each node – £17,254/QALY; 2) all costs are fixed costs: screening center costs, and staff are paid for regardless of use – £14,172/QALY; and 3) combination of (1) and (2) to produce a worst case scenario £20,823/QALY.
Discussion and conclusion: The majority of calculations suggested that breast cancer screening is cost-effective. However, in our worst case scenario, the ICER fell near the bottom ceiling ratio. This makes it unclear whether the program should be available in the future, as more evidence becomes available over the risks of screening and as some currently expensive chemotherapy drugs begin to lose patents.
Keywords: breast cancer, screening, cost-effectiveness, economic analysis
Introduction
The financial burden of cancer is increasing at a constant rate, with an aging population and ever-increasing treatment costs.1 Consequently, economic evaluations have become an intrinsic component of the clinical decision-making process.1 Breast cancer is one of the most common cancers in the UK.2 The mean cost to the UK National Health Service (NHS) for the treatment of breast cancer, 15 months following diagnosis is £12,595 per patient.2 This is currently costing the NHS over £700 million a year and is predicted to rise, with each late-stage diagnosis costing significantly more than if the cancer could be detected earlier.1,3
One of the key tools thought to combat and prevent the spiraling costs of late-stage breast cancer diagnosis is the use of breast cancer screening.4 However, over recent years, with more effective treatments being available and questions being raised over the safety and risk – implications of using mammography as part of the screening program, the cost-effectiveness of breast cancer screening has been highlighted as an important issue to investigate.5–7 This report will seek to evaluate the current cost-effectiveness of the program and its place in the NHS.
Breast cancer is a complex disease caused by a malignancy of the breast tissue, where abnormal cells divide uncontrollably and can potentially invade other areas of the body, in a process known as metastasis.8 This disease accounts for ~12,000 deaths in the UK and ~4% of the total deaths were women. Further to this, breast cancer has far-reaching impacts on patients’ families, friends, and livelihoods.1,3,9,10 Patients with breast cancer can present to their health care practitioner in a number of ways. Most patients present having felt a lump, with other symptoms including nipple discharge and changing nipple or skin appearance.11
Since the Forest report recommended the introduction of a breast cancer screening program in the NHS, many females are being diagnosed through a mammography-based screening program as opposed to presenting to their general practitioner (GP) once they notice symptoms.12 In the UK, women aged 50–70 years are invited to attend breast screening as part of the NHS Breast Cancer Screening Programme (NHSBCSP) every 3 years. The objective is to be able to identify a greater proportion of women who may have breast cancer before they become symptomatic or progress to later stages.13
Between 2010 and 2016, the NHS has phased in a trial increasing the age range of screening to between 47 and 73 years. The purpose of this program is to detect cancers even earlier, improve prognosis, and reduce the health, social, and financial impact of late-stage diagnosis. Women diagnosed (90%) with breast cancer at the earliest stage survived for at least 5 years, compared with only 15% of the 5-year survival at the latest stage of diagnosis.9
However, recent articles published in the BMJ and specialist breast cancer journals have sparked debate over whether the benefits of the breast cancer screening program are outweighed by the risks which include overdiagnosis and unnecessary radiation exposure.12,14 A Cochrane review suggested that the screening program creates 30% greater overdiagnosis and overtreatment, with some research reviews insisting that the net quality-adjusted life year (QALY) benefit of breast cancer is actually negative over a 20-year period.4,6 However, a recent independent review for the NHS suggested that the program results in a 20% reduction in relative risk mortality.7,12,15 This controversy and surrounding media debate have been attributed to causing a decrease in the uptake of screening, from a peak of 75.5% in 2002 to just over 73.5% in 2011.13,16
This debate, combined with declines in uptake rates, and the perceived financial unsustainability of the NHS have thrown the financial viability and cost-effectiveness of the national breast cancer screening program into question. This report aims to address these topical issues.
Study objectives
Recent evidence has suggested that the risks and anxiety associated with mammography screening outweigh benefits in earlier diagnosis and treatment.12 This evidence, combined with declining screening uptake rates and the increasing operational deficit for the NHS, has created a need to ensure:
The current screening program is cost-effective for the NHS and, therefore, congruent with The National Institute for Health and Care Excellence (NICE) guidance.
This report aims to perform a thorough economic evaluation of the NHS breast screening program, looking both at cost and utility to justify whether the program is cost-effective. Despite recent expansion of the breast cancer screening program (47–73 years of age), this analysis will focus on the effectiveness of breast cancer screening for 50–70-year-olds as more robust data are available, and the program is expected to continue in this form.
Materials and methods
Choice analysis and perspective
A cost–utility analysis (CUA) was conducted to appraise the breast cancer screening program. The analysis was done from the perspective of the NHS. The NHS was selected as they fund both the screening program and subsequent interventions for the majority of the population. The NHS is more concerned with measures that inform them of the value of health provided as opposed to an economic evaluation based primarily on monetized gains through a cost-effectiveness analysis (CEA).17 This is also linked to the concept of health care being seen as an economic good with special characteristics; willingness to pay is not acceptable as a criterion for allocation of health care.17
A CUA uses QALYs, which is a measure of gain in life expectancy and quality of life. This enables an informed, patient-centric decision to be made to judge the benefits of the NHSBCSP and to take into account financial constraints in line with NICE guidelines. EuroQol-5 dimensions questionnaire (EQ-5D) is a standardized tool that can be completed by respondents themselves and provides a measure of health-related quality of life (QALY).18 This tool consists of five dimensions, which include mobility, self-care, usual activities, pain and discomfort, and anxiety and depression.17
Furthermore, NICE prefers the use of a CUA in economic analysis, allowing cost between the options to be justified in terms of changes in health effects.19 CUA is deemed to be superior to a CEA due to the fact that quality of life is taken into account, as opposed to just life years gained, important for people with long-term conditions.20 However, there are challenges, for example, the assumption that the value of having one condition for 2 years is double that of 1 year and the assumption that all QALYs have the same social value.20 There are also concerns regarding the inadequate weight attached to emotional and mental health problems when determining QALY benefit.21
Choice of horizon and justification
The analysis will consider the breast cancer screening program and its utility over a 20-year period. It will take into account for the time a patient is typically screened between the ages of 50 and 70 years in the UK. Although this does not consider any risks and benefits beyond this time constraint, literature suggests that 20-year period is the standard for breast cancer screening programs of this type and allows for effective comparison with current literature.12
Choice of comparator
The comparator chosen in the economic analysis was no screening, and this was also suggested as the key comparator by current literature available. This was due to there being no established alternative method of screening for breast cancer. There is also some literature that highlights the concerns over false positives in screening and overdiagnosis, with estimates stating that up to 54% of all breast cancers detected by screening are results of overdiagnosis.12,22–24 As a result, the comparator was kept to no screening.
Literature review
A literature review was conducted to obtain relevant financial, health, and probability outcomes relevant to the breast cancer screening program. PubMed/Medline, NHS Economic Evaluation Database, and the Cochrane Database of Systematic Reviews were utilized using relevant search terms and strings, identified utilizing the PICO method (Table 1). Table 2 shows the number of search terms retrieved. Exclusion and inclusion criteria were applied. Studies were only included that were conducted in the UK or Western Europe as these areas have similar guidelines and screening methods. Papers that were in English and included an economic analysis to ensure they were relevant were included. Papers that did not comment on economic analysis were excluded. Those that looked more at different methods of screening women than the effectiveness of current methods were also excluded.
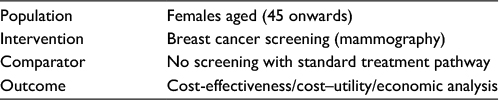 | Table 1 Search terms |
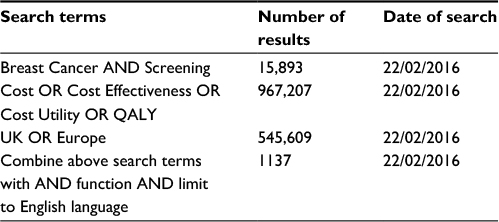 | Table 2 Search numbers Abbreviation: QALY, quality-adjusted life year. |
Five key papers were identified, and these papers are discussed along with how they were used in Table 3. Data were extracted from these papers and combined to conduct the economic analysis. These included two NICE documents, a BMJ publication and Cochrane Review for up-to-date models and data.15,25 Where required data were not available, such as probability data, Cancer Research UK was used as the key source.
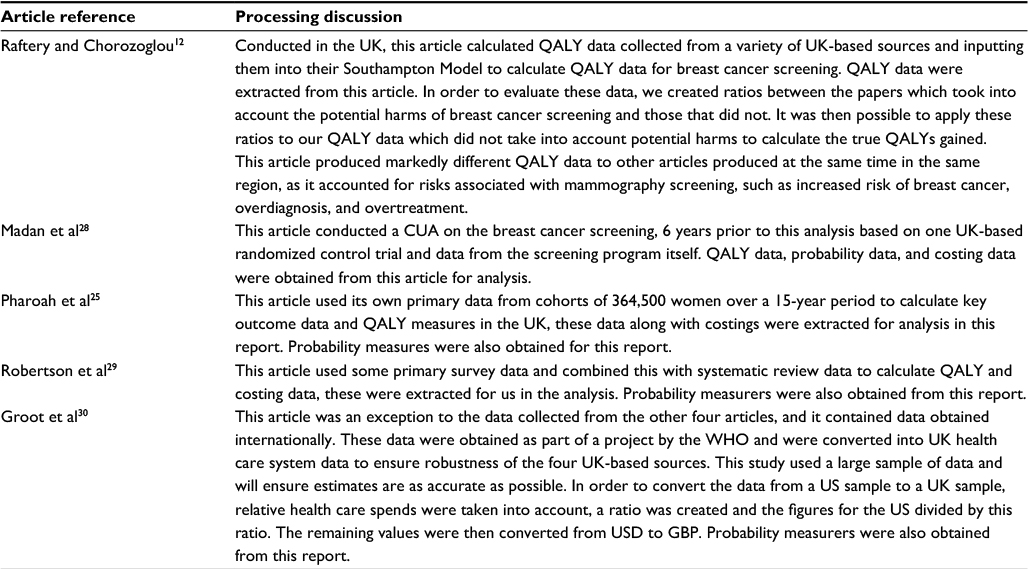 | Table 3 Key articles and data use Abbreviations: CUA, cost–utility analysis; GBP, British pound; QALY, quality-adjusted life year; USD, US dollar; WHO, World Health Organization. |
Probabilities
Probabilities were calculated using data extracted from the literature review. Whereas more than one probability value was available for a mutually exclusive parameter, non-weighted mean values were used, and rounded to two decimal places to calculate probabilities as shown in Table 4. Mean values were not weighted as some studies with the largest population sizes did not give clear population data to create weighted mean values.
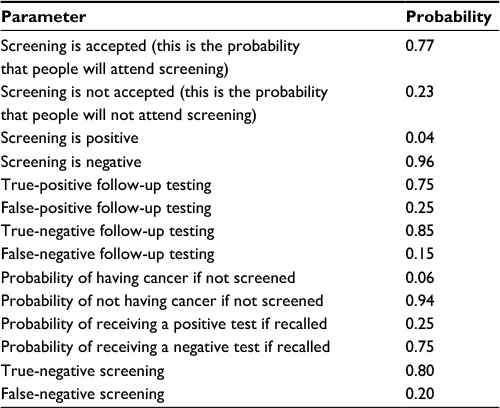 | Table 4 Key sources Note: Data adapted from Pharoah et al,25 Harker,27 Madan et al,28 Robertson et al,29 and Groot et al.30 |
Financial costs and discounting
Costs were extracted from four key UK-based studies. These data were extracted and adjusted for inflation to 2016. A discount rate of 3.5% per annum was applied for costs incurred beyond 2016, as per UK government guidance (for 20 years).26 Future values, however, were increased with regard to the average real terms increase in spending on health care over the previous 20 years. This was done to allow a more accurate representation of the figures over such a large time scale. Health care spending has increased in real terms (over the 3.5% inflation figure) in all but two of the last 20 years.27 Information solely from the NHS was not utilized as screening involves both direct and indirect costs with the latter requiring economic data beyond the scope of the NHS reference database. Data were presented as figures for per-case costing. Future costs and outcomes were given less weight.17 Reasons for future costs and outcomes being given less weight include people having a positive time preference and the factor of social opportunity cost when particularly analyzing public versus private projects.17 This was then transformed into per-case costing. All data extracted were converted to pound sterling, the dollar to pound conversion rate for the February 24, 2016 was utilized at USD1=£0.71.
Present value costs
Cumulative present value cost of treating a screened patient for breast cancer: minimum £434.43; average £627.13; maximum £852.13.25,28–30 The cost for one screening was calculated from figures given in two papers. These figures were then adjusted as noted earlier and summed to give the total lifetime cost of screening one lady assuming eight screening episodes.
Average present value cost of treating a screened patient for breast cancer: minimum £5,415.10; average £7,589.04; maximum £11,327.62.25,28–30
Average present value cost of treating an unscreened patient for breast cancer: minimum £5,956.61; average £8,624.68; maximum £14,954.69.25,28–30
Average present value cost of unnecessary treatment: minimum £2,095.12; average £2,095.12; maximum £2,095.12.25,28–30 From the literature review conducted it was found there was a concern that screening led to unnecessary treatment and consequently this factor was incorporated into the economic analysis.6
Average present value cost of GP appointment and referral: minimum £55.96; average £55.96.12; maximum £55.96.25,28–30 This cost is indicative of the costs that would be incurred if there was no screening program in place. With no screening, GPs would refer patients to the breast clinic following symptoms or a mammogram and patients would be seen within two weeks. This cost takes into account the cost of the GP appointment, referral letter, and consultant appointment.
Average present value cost of follow-up test: minimum £247.87; average £301.06; maximum £377.47.25,28–30 The screening pathway for a patient may involve a follow-up test depending on the results of their mammogram. Consequently, to accommodate for all possibilities and to ensure an accurate and thorough economic analysis was conducted, the cost of follow-up was calculated.
QALYs
QALYs were extracted from key papers and calculated as follows. QALYS gained per patient treated in a screened population: minimum 13.08; average 13.08; maximum 13.08.27 QALYS gained per patient treated in an unscreened population: minimum 12.93; average 12.93, maximum 12.94.27
Rafferty and Chorozoglou12 found in a meta-analysis that there were harms associated with breast cancer screening that caused a loss of QALYs in those patients affected. They demonstrated the different amount of QALYs gained in equal size populations when the potential harmful side effects of screening were taken into account. In order to evaluate this data, ratios were created between the papers in the meta-analysis that took into account the potential harms of breast cancer screening and those that did not. It was then possible to apply these ratios to the QALY data which did not take into account potential harms to calculate the true QALYs gained. Ratio of QALYS lost due to harm from breast cancer screening: minimum 0.253; average 0.253; maximum 0.253.
Results
A decision tree was mapped utilizing costs, QALYs, and probabilities obtained from literature review. The complete patient pathway was considered, so that all costs and probabilities were taken into account.
Incremental cost-effectiveness ratio (ICER)
To summarize the effectiveness of breast cancer screening, an ICER was calculated. This summarizes the difference in cost of screening and not screening and the difference in effect of those two interventions. QALYs data utilizing decision tree analysis were utilized along with the ICER equation below.
|
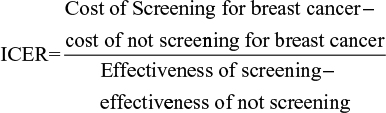
The mean ICER calculated was at a value of £11,546.11 with subsequent sensitivity analysis conducted around this value.
Sensitivity analysis
Multiple sensitivity analyses were undertaken to evaluate a range of scenarios which could occur within the proposed model. The first sensitivity analysis used maximum costs at each of the nodes in order to assess how this would affect the ICER. These costs were obtained by using the maximum absolute costs for each category that could be gathered from the literature. In this scenario, the ICER became £17,254/QALY. With this figure, the program would still be acceptable under the NICE threshold. A second sensitivity analysis was performed. In this model, it was assumed that the majority of costs for screening would be fixed costs. For example, the screening centers, machines, and their staff would be paid for regardless of whether they are used. This is applicable in this model as costs for screening were given per patient and not per center or per program basis. It was, therefore, assumed that screening costs should be multiplied to reflect the costs that would be incurred when the program’s utilization was 100% without the associated QALY benefits. In this model, the ICER was £14,172/QALY in which case breast cancer would still be acceptable.
In the final sensitivity analysis, the last two models were combined to produce a worst case scenario. In this case, the ICER became £20,823/QALY and this makes it unclear whether the program (Figure 1) should be available under the NHS particularly given the new evidence regarding the increased morbidity and mortality associated with breast cancer screening (such as overdiagnosis, overtreatment, and excess anxiety).12 This combined sensitivity analysis is appropriate to conduct for the breast screening program as the cost of these programs are traditionally underestimated, and the majority of the costs (in terms of performing screening) are fixed costs. As a result, this creates a highly plausible situation in which to conduct a sensitivity analysis where both breast cancer screening costs have been underestimated in the past and the cost of conducting a mammography is predominantly a fixed cost without accounting for subsequent treatment costs.31–33
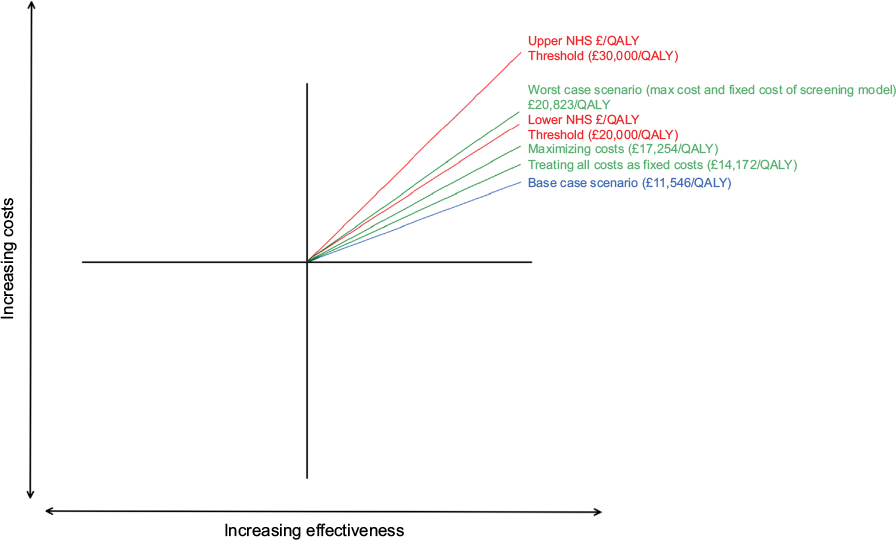 | Figure 1 Incremental cost-effectiveness ratio graph. Note: Red text: standard thresholds for the NHS; green text: the authors’ sensitivity analysis; blue text: base case. Abbreviations: max, maximum; NHS, UK National Health Service; QALY, quality-adjusted life year. |
Monetary net benefit (MNB) and health net benefit (HNB)
MNB is measured in monetary units, with both costs and effects being converted into the same units.17 Both MNB and HNB were calculated for the base case and worst case sensitivity analysis for this report.17 Effects are expressed in monetary units by taking into account the ceiling ratio (Rc), which can be used to convert costs and effects to the same units. The decision rule is that if the MNB is greater than zero, then the activity is cost-effective.
|
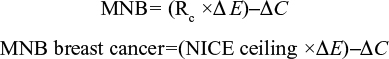
To predict if breast cancer screening is cost-effective, the equation below must be true:
|

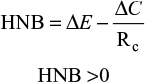
This equation shows that for screening to be deemed economically viable, the MNB must be >0 (Figure 2). The HNB can also be calculated using similar variables in the equations and must also be >0 to be deemed viable
|
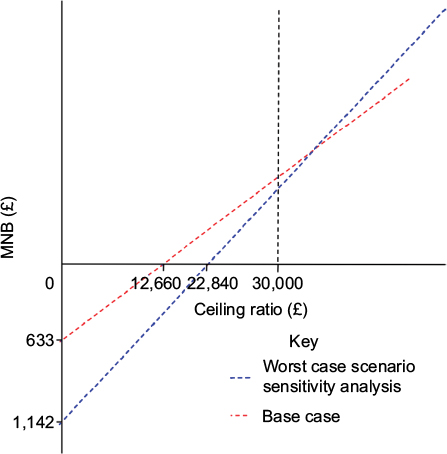 | Figure 2 MNB graph. Abbreviation: MNB, monetary net benefit. |
The ceiling ratio (Rc) will be taken as the upper limit of NICE guideline recommendations (£30,000), with the base case and sensitivity analysis decision trees analyzed.34
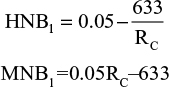
Base case MNB and HNB
|
Worst case MNB and HNB
|
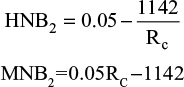
Results from the equations: worst case HNB=0.012; worst case MNB=£358.
Discussion
This analysis aimed to analyze the cost–utility of breast cancer screening and to ascertain whether it is viable and feasible to continue in its current form. The mean ICER calculated combined with multiple sensitivity analysis creates some element of doubt when comparing these figures to the NICE guideline threshold of a cost between £20,000 and £30,000 per ICER, as it falls in between this range. This analysis indicates that in a base case scenario, calculated with mean probabilities, costs, and QALYs, £11,546 will have to be spent for one QALY gain. This base case is well below the NICE threshold; therefore, based on these assumptions, the breast cancer screening program would be deemed economically viable to continue. However, when considering the worst case scenario with maximal costs, the ICER increases to £20,823/QALY which is above the lower end threshold set by NICE. Although still acceptable, this sheds some doubt on the potential benefit of conducting this screening program, especially considering the significant plausibility of the worst case scenario. As a result of this, it is important to consider the MNB when considering the viability of breast cancer screening.
The results indicate the MNB of breast cancer screening when utilizing the base case example and a ceiling ratio of £30,000 is £867 with an HNB of the base case of 0.0289. Both of these calculations suggest that breast cancer screening is acceptable as they exceed zero. This analysis shows that at a ceiling ratio of <£12,660, breast cancer screening becomes unacceptable: this is the point where the MNB is equal to zero. Considering the worst case scenario and a ceiling ratio of £30,000, the MNB of breast cancer screening is £358, with the HNB being 0.01193. Once again, both results are greater than zero, which suggests that even in the worst case scenario, with the highest ceiling ratio, the breast cancer screening program is economically viable. The results for ICER, MNB, and HNB combined with sensitivity analyses suggest that even in the worst case, breast cancer screening is cost-effective from an NHS perspective. It is difficult to compare these findings to other literature, especially international data. This is due to the NHS’s unique current mammography regime of screening every 3 years and the fact that some other developed countries are yet to implement a breast cancer screening program. Overall, results are consistent with the existing published data; however, the most robust economic analysis data from the UK were used to conduct the analysis, meaning results were likely to be similar to these studies, making comparison weak. Five systematic reviews of economic evaluations were analyzed for their congruence to the results in this report from Organization for Economic Cooperation and Development (OECD) countries. One key article described a systematic review of all current economic evaluations for breast cancer screening. Although it focused on annual mammography, ICERs calculated in this report are congruent with this review’s results. However, higher thresholds were utilized to conduct analysis (USD100,000/£71,000), and wide-ranging ICER results were also obtained. It is important to highlight that this review focused on an annual mammography screening program in a private health care system, meaning both financial costs and QALY data may be significantly different.
Pharoah et al25 found breast cancer screening to be cost-effective at the £20,000 QALY threshold in 45% of scenarios, with a moderate probability. This differs from this report’s findings, where calculations found that only in a worst case scenario would the benefit be £20,823/QALY.25 This may be due to many reasons, in particular the differing methodologies. Pharoah et al25 used a life table model to undertake their research: this methodology was not accessible in this analysis and could contribute to the differing results. The economic analysis has shown that the use of NHS breast cancer screening is cost-effective and, consequently, the deployment of valuable NHS resources in this field is justifiable. As the calculations show the cost of screening to be within the range accepted by NICE, it can be argued that the screening program is also feasible. However, there is further research needed to address the growing concerns regarding the potential harm caused in the screening process, and then to ascertain whether the QALY/cost benefit is maximized through 3-yearly screening, when compared with more regular screening programs.
Limitations
A CUA was conducted to evaluate the screening program. A limitation of this analysis is that it does not take into account the full social costs or benefits to the population as a whole. Consequently, further analysis would be needed to ensure whether full societal cost is taken into account. One of the major problems of conducting an economic analysis is that it does not fully consider the impact on equity and provides more robust data in relation to efficiency with providing figures on how utility can be maximized on a per unit cost basis. It has been found that those in the most deprived areas were less likely to attend screening, which has not been accounted for in the analysis.16 The presence of externalities would be a limitation of this economic analysis, as they have not been taken into account. Breast screening would result in positive externalities and consequently the social marginal benefit being greater than the private marginal benefit. This would be due to the positive effect on the family of the patient from early diagnosis and treatment as well as reducing the burden of care on relatives. Such societal benefit was not included in the economic analysis.
This economic analysis used QALYs to provide a measurement of health-related improvement in quality of life. However, there are many limitations to use this method. Important health consequences could have been excluded by this analysis as only QALYs were used for the economic evaluation.21 Using QALYs for a screening presents the problem of the importance being placed on the dimensions being measured varying by age and life situations, making it difficult to get accurate measurements.21 The horizon of this analysis was 20 years based on the age women are invited to the program. Modeling a 20-year horizon meant assumptions had to be made regarding costs and benefits. Consequently, significant changes that could occur within a 20-year period in terms of protocols or medical technology could affect the results of the analysis. As a result, this analysis is limited to assumptions made on the technology and guidelines currently in practice. The analysis is limited by the number of studies included and consequently more data specific to the UK population would be needed for the findings to be generalized. The literature search highlighted differences in methodology which make it difficult to directly compare results; however, the common use of QALYs and ICER ratios may negate this issue to a certain extent.
In this article, we assumed the NHS breast screening program would reduce breast cancer mortality by 20%, we derived this figure from meta-analyses – however, it is important to acknowledge that these figures may be out of date reducing the reliability of our results. This study would also benefit from more accurate data on patient compliance, a screening program focusing only on already identified high-risk populations and the potential of different screening schedules. Further research and studies should also account for stochastic Markov-type analysis, to add to the depth of literature investigating the cost-effectiveness of breast cancer screening.
Impact and scope
The findings of this report suggest that breast cancer screening in the NHS is cost-effective. However, with breast cancer affecting such a large proportion of the female population and therefore, nationwide screening being hugely expensive, it is important that cost-effectiveness studies such as this are carried out. This report recommends that further economic analysis of breast cancer screening is undertaken to address the growing questions into its risks. Due to the fact that the screening infrastructure is already in place and is well established, many more CEA can be undertaken.
Conclusion
This report suggests that breast cancer screening is cost-effective and from this, perspective should be continued to be offered on the NHS. It is important to conduct a repeat analysis as greater data become available on the adverse effects of mammography and as treatment and prognosis for late-stage breast cancer improves.
Disclosure
The authors report no conflicts of interest in this work.
References
Hall PS, Hamilton P, Hulme CT, et al. Costs of cancer care for use in economic evaluation: a UK analysis of patient-level routine health system data. Br J Cancer. 2015;112(5):948–956. | ||
Lomas A, Leonardi-Bee J, Bath-Hextall F. A systematic review of worldwide incidence of nonmelanoma skin cancer. Br J Dermatol. 2012;166(5):1069–1080. | ||
Mistry M, Parkin DM, Ahmad AS, Sasieni P. Cancer incidence in the United Kingdom: projections to the year 2030. Br J Cancer. 2011;105(11):1795–1803. | ||
Myers ER, Moorman P, Gierisch JM, et al. Benefits and harms of breast cancer screening: a systematic review. JAMA. 2015;314(15):1615–1634. | ||
Rao R, Wiechmann L. Treatment of early breast cancer. Minerva Endocrinol. 2009;34(4):311–324. | ||
Marmot MG, Altman DG, Cameron DA, Dewar JA, Thompson SG, Wilcox M. The benefits and harms of breast cancer screening: an independent review. Br J Cancer. 2013;108(11):2205–2240. | ||
Independent-UK-Panel-on-Breast-Cancer-Screening. The benefits and harms of breast cancer screening: an independent review. Lancet. 2012;380(9855):1778–1786. | ||
Downs-Holmes C, Silverman P. Breast cancer: overview & updates. Nurse Pract. 2011;36(12):20–26; quiz 7. | ||
Cancer-Research. Breast cancer mortality statistics: Cancer Research UK; 2015. Available from: http://www.cancerresearchuk.org/health-professional/cancer-statistics/statistics-by-cancer-type/breast-cancer/mortality-ref-0. Accessed February 26, 2016. | ||
Lawless GD. The working patient with cancer: implications for payers and employers. Am Health Drug Benefits. 2009;2(4):168–173. | ||
Nguyen J, Cramarossa G, Bruner D, et al. A literature review of symptom clusters in patients with breast cancer. Expert Rev Pharmacoecon Outcomes Res. 2011;11(5):533–539. | ||
Raftery J, Chorozoglou M. Possible net harms of breast cancer screening: updated modelling of Forest report. BMJ. 2011;343:d7627. | ||
Cancer-Research. Breast screening statistics: cancer research UK; 2015. Available from: http://www.cancerresearchuk.org/health-professional/cancer-statistics/statistics-by-cancer-type/breast-cancer/screening. Accessed February 26, 2016. | ||
Loberg M, Lousdal ML, Bretthauer M, Kalager M. Benefits and harms of mammography screening. Breast Cancer Res. 2015;17:63. | ||
Gotzsche PC, Jorgensen KJ. Screening for breast cancer with mammography. Cochrane Database Syst Rev. 2013;6:CD001877. | ||
Taylor-Phillips S, O’Sullivan E, Kearins O, Parsons H, Clarke A. The effects of a UK review of breast cancer screening on uptake: an observational before/after study. J Med Screen. 2013;20(2):86–90. | ||
Morris S, Devlin N, Parkin D. Economic Analysis in Health Care. Chichester, UK: John Wiley & Sons; 2007. | ||
Haywood KL, Garratt AM, Lall R, Smith JF, Lamb SE. EuroQol EQ-5D and condition-specific measures of health outcome in women with urinary incontinence: reliability, validity and responsiveness. Quality Life Res. 2008;17(3):475–483. | ||
NICE. Guide to the methods of technology appraisal. National Institute for Health and Care Excellence; 2013. | ||
Whitehead SJ, Ali S. Health outcomes in economic evaluation: the QALY and utilities. Br Med Bull. 2010;96:5–21. | ||
Anderson P, Phillips C. What is a QALY? Available from: http://www.whatisseries.co.uk/what-is-a-qaly/. Accessed March 3, 2017. 22/02/2017. | ||
Miller AB. Screening for breast cancer – is there an alternative to mammography? Asian Pac J Cancer Prev. 2005;6(1):83–86. | ||
Yaffe MJ, Mainprize JG. Risk of radiation-induced breast cancer from mammographic screening. Radiology. 2011;258(1):98–105. | ||
NIH. breast cancer screening–for health professionals (PDQ®): National cancer Institute; 2016. Available from: http://www.cancer.gov/types/breast/hp/breast-screening-pdq. Accessed February 26, 2016. | ||
Pharoah PD, Sewell B, Fitzsimmons D, Bennett HS, Pashayan N. Cost effectiveness of the NHS breast screening programme: life table model. BMJ. 2013;346:f2618. | ||
CSI. Discount rates and net present value: Centre for Social Impact; 2016. Available from: https://data.gov.uk/sib_knowledge_box/discount-rates-and-net-present-value. Accessed February 26, 2016. | ||
Harker R. NHS funding and expenditure. Standard Note: SN/SG/724. Library; House of Commons; 2012. | ||
Madan J, Rawdin A, Stevenson M, Tappenden P. A rapid-response economic evaluation of the UK NHS cancer reform strategy breast cancer screening program extension via a plausible bounds approach. Value Health. 2010;13(2):215–221. | ||
Robertson C, Arcot Ragupathy SK, Boachie C, et al. The clinical effectiveness and cost-effectiveness of different surveillance mammography regimens after the treatment for primary breast cancer: systematic reviews registry database analyses and economic evaluation. Health Technol Assess. 2011;15(34):v–vi, 1–322. | ||
Groot MT, Baltussen R, Uyl-de Groot CA, Anderson BO, Hortobagyi GN. Costs and health effects of breast cancer interventions in epidemiologically different regions of Africa, North America, and Asia. Breast J. 2006;12 (Suppl 1):S81–90. | ||
Chaloupka FJ, Warner KE, Acemoglu D, et al. An evaluation of the FDA’s analysis of the costs and benefits of the graphic warning label regulation. Tob Control. 2015;24(2):112–119. | ||
Henderson JB. An economic appraisal of the benefits of screening for open spina bifida. Soc Sci Med. 1982;16(5):545–560. | ||
Wolk RB. Hidden costs of mobile mammography: is subsidization necessary? AJR Am J Roentgenol. 1992;158(6):1243–1245. | ||
Devlin N, Parkin D. Does NICE have a cost-effectiveness threshold and what other factors influence its decisions? A binary choice analysis. Health Econ. 2004;13(5):437–452. |
 © 2017 The Author(s). This work is published and licensed by Dove Medical Press Limited. The full terms of this license are available at https://www.dovepress.com/terms.php and incorporate the Creative Commons Attribution - Non Commercial (unported, v3.0) License.
By accessing the work you hereby accept the Terms. Non-commercial uses of the work are permitted without any further permission from Dove Medical Press Limited, provided the work is properly attributed. For permission for commercial use of this work, please see paragraphs 4.2 and 5 of our Terms.
© 2017 The Author(s). This work is published and licensed by Dove Medical Press Limited. The full terms of this license are available at https://www.dovepress.com/terms.php and incorporate the Creative Commons Attribution - Non Commercial (unported, v3.0) License.
By accessing the work you hereby accept the Terms. Non-commercial uses of the work are permitted without any further permission from Dove Medical Press Limited, provided the work is properly attributed. For permission for commercial use of this work, please see paragraphs 4.2 and 5 of our Terms.