")
Back to Journals » Diabetes, Metabolic Syndrome and Obesity » Volume 14
Early Predictors in the Onset of Type 2 Diabetes at Different Fasting Blood Glucose Levels
Authors Xie X, Bai G, Liu H, Zhang L, He Y, Qiang D, Zou X
Received 10 January 2021
Accepted for publication 12 March 2021
Published 31 March 2021 Volume 2021:14 Pages 1485—1492
DOI https://doi.org/10.2147/DMSO.S301352
Checked for plagiarism Yes
Review by Single anonymous peer review
Peer reviewer comments 2
Editor who approved publication: Prof. Dr. Juei-Tang Cheng
Xiaomin Xie,* Guirong Bai,* Huili Liu, Li Zhang, YanTing He, Dan Qiang, Xiaoyan Zou
Department of Endocrinology, The First People’s Hospital of Yinchuan, Yinchuan, 750001, People’s Republic of China
*These authors contributed equally to this work
Correspondence: Xiaomin Xie
Department of Endocrinology, The First People’s Hospital of Yinchuan, 2 Liqun Street, Xingqing District, Yinchuan, 750001, Ningxia, People’s Republic of China
Tel +86 13895189599
Email [email protected]
Purpose: This study investigates the possible roles and potential prediction ability of metabolic parameters in the early development of T2D by detecting their serum levels at different fasting blood glucose (FBG) levels.
Methods: The subjects were included and divided into normal glucose tolerance (NGT), prediabetes (PD), and T2Dsubgroups. Apart from detecting the levels of routine biochemical parameters, fasting serum insulin (FINS), 25(OH)D, thioredoxin-interacting protein (TXNIP), thioredoxin (TRX), and NOD-like receptor family, pyrin domain-containing 3 (NLRP3) were detected. β-cell dysfunction (HOMA-β) and insulin resistance (HOMA-IR) were assessed by homeostasis model assessment. Both univariate and multivariate logistic regression analyses were used to estimate the risk of metabolic parameters, and their optimal cut-off values were obtained in the receiver operating characteristic (ROC) curve analysis and the Youden index.
Results: Among the 207 subjects, aged from 20 to 60 years (44.62+12.92) contain 118 males and 89 females. There was a significantly lower trend of TRX, HOMA-β, and 25(OH)D following the higher FBG level among these three subgroups, while a significantly higher trend of all the other metabolic parameters. The multivariate analysis showed that subjects with higher values of TRX, HOMA-β, and 25(OH)D had a significantly lower risk for patients to be diagnosed as PD (aOR: 0.945, 0.961, and 0.543) and T2D (aOR: 0.912, 0.947, 0.434). Under the reliable 95% CI, TXNIP with a cut-off value of 119.27 showed the highest AUC value, sensitivity, and specificity (AUC: 0.981, 95% CI: 0.8524– 0.9839, 91.49%, and 83.33%) to diagnose PD. FINS with a cut-off value of 28.1 also showed the highest ones (AUC=0.9872, 95% CI: 0.9753– 0.9992, 100%, and 92.91%) to diagnose T2D.
Conclusion: Early prediction of T2D is vital for timely intervention. Based on the FBG ≥ 100.8 mg/dl, the results provide evidence that 25(OH)D might be the protective factor in the early development of T2D. Besides, TXNIP and FINS might be the predictor for PD and T2D, respectively.
Keywords: prediabetes, PD, type 2 diabetes, T2D, 25-hydroxyvitamin D, 25(OH)D, thioredoxin-interacting protein, TXNIP, β-cell dysfunction, insulin resistance
Introduction
Insulin resistance and impaired glucose tolerance induced by increased compensatory insulin secretion represent prominent features in the early development of type 2 diabetes (T2D). Besides, islet β-cell function begins to decline as insulin resistance occurs. The onset of T2D is characterized by hyperglycemia due to impaired glucose regulation and further deterioration of β-cell dysfunction.1,2 As T2D evolves through impaired fasting glucose (IFG) and impaired glucose tolerance (IGT), the fasting and/or the 2 h postprandial plasma glucose level have been used as clinical risk indicators for the diagnosis of prediabetes (PD).2,3
Oxidative stress and inflammation are associated with impaired glucose regulation and insulin resistance.4–7 Under ischemic or hypoxic conditions, reactive oxygen species (ROS) and thioredoxin-interacting protein (TXNIP) are upregulated in islet β-cells.5,6 The NOD-like receptor family and pyrin domain-containing 3 (NLRP3) inflammasome is then activated as mediated by the ROS-TXNIP axis, and finally, β-cell apoptosis is induced.8,9 During this process, three inflammatory regulating proteins including in caspase-1 (CASP1), interleukin (IL)-1β, and IL-18 are induced and secreted extracellularly, indicating cell damage and/or apoptosis occurs.9 The pancreatic β-cell is known to be lacking sufficient antioxidant capacity; therefore, it is extremely vulnerable to hypoxic conditions.6
Vitamin D is produced when the skin is exposed to sunshine. The precursor, 7-dehydrocholesterol, is converted to vitamin D3, also known as cholecalciferol, by exposure to UV light in the skin. This intermediate molecular is converted to 25-hydroxyvitamin D (25(OH)D), also known as calcidiol, or 25(OH)D, and then change to the active form of the vitamin D, 1,25-hydroxyvitamin D [1,25(OH)2D], also known as calcitriol, in the kidney.10 On the other hand, the active form of vitamin D, 1,25(OH)2D, has been shown to possess protective effects against oxidative stress-induced cell damage by mediating the ROS/TXNIP/NLRP3 inflammasome pathway.11 A higher level of serum 25(OH)D appears to be associated with a lower risk of T2Dand could be used as a predictor for the development of T2D.12,13 Indeed, Omar et al14 have suggested that vitamin D and TXNIP could be markers for various states of β-cell dysfunction. Nevertheless, as elevated TXNIP is suggested to be harmful to β-cells while it is upregulated by vitamin D, how these molecules are associated with the pathogenesis of T2D, and in particular in the PD states, remains elusive.
The hyperglycemia-induced inflammation and apoptosis of β-cell also involve activation of the transcription factor NF-κB.15 Reports have indicated that NF-κB-mediated apoptosis is regulated by redox reaction, of which the thioredoxin family is the main component.16 The thioredoxin family, including thioredoxin (TRX) protein and selenoprotein TRX reductase (TRxR), has been recognized as a family of antioxidant agents which participate in reversible disulfidedithiol exchange reactions and de-nitrosylation of cysteine (Cys) residues, thus possess protective and anti-apoptotic functions.16,17 Mammalian cells contain two forms of thioredoxin proteins: the cytosolic (TRX1, TRX reductase1) and the mitochondrial (TRX2, TRX reductase2), where the cytosolic TRX1 can be secreted.16,18 TXNIP can inhibit the activity of reduced TRX; TRX is also implicated in the functional regulation of β-cells. According to Chou and Sytwu,19 TRX can improve the grafted islet survival after pancreatic islet transplantation in a mouse model, and therefore has the potential to serve as a therapeutic agent to restore β-cell function. Moreover, evidence has shown that TRX of pancreatic β-cells can be differentially regulated in intracellular and extracellular compartments under inflammatory conditions or oxidative stress.16,19
In this study, 25(OH)D, TXNIP, TRX, NLRP3, CASP1, and fasting serum insulin (FINS)were evaluated whether any of them could be used as potential metabolic parameters for diagnosing PD and T2D. Homeostasis model assessment of HOMA-IR and HOMA-β were also established for these patients to further characterize the possible mechanisms involved in the onset of T2D.
Methods
Subjects
All the 207 subjects enrolled in this study were examined at the Second Affiliated Hospital of Ningxia Medical University between December 2016 and April 2017. All patients with PD and T2D were first diagnosed in the setting of the current study, and none of the subjects received any medication or dietary supplement intervention. Exclusion criteria were: 1) patient aged less than 20 or more than 60 years old; 2) a history of confirmed PD or T2D; 3) the presence of kidney or liver disease or cancer; 4) the presence of an acute, chronic infection or inflammatory disease; 5) a history of cardiovascular or cerebrovascular disease; 6) thyroid dysfunction; 7) the presence of any blood diseases; 8) alcohol, drug or tobacco abuse; hormone replacement therapy in women.
Methods
The diagnostic criteria of PD and T2D met the 2019 standards of the American Diabetes Association (ADA) based on FBG levels. According to the FBG level, subjects were divided into three subgroups: the normal glucose tolerance (NGT) subgroup with FBG <100.8 mg/dl, the PD subgroup with 100.8 mg/dl ≤ FBG <126 mg/dl, and the T2D subgroup with FBG ≥126 mg/dl. The same questionnaire was used for each subject, which included age, sex, family history of T2D and complications, medical history, blood pressure, height, weight, waist circumference, hip circumference, body mass index (BMI, kg/m2), and waist to hip ratio (WHR, cm/cm).
Peripheral venous blood was collected on fasting 8–12 h, and FBG, total cholesterol (TC), low-density lipoprotein (LDL), high-density lipoprotein (HDL), triglyceride (TG), and uric acid (UA) were measured using a Beckman Coulter AU5821 automatic biochemical analyzer (Beckman Coulter, Brea, CA, USA).
For each study subject, 2 mL of serum sample was stored in a −80°C refrigerator. FINS, 25(OH)D, TXNIP, TRX, and NLR family, pyrin domain containing 3 (NLRP3) were assessed by enzyme-linked immunosorbent assay (kit batch number: 2017.03, Shanghai Baoman Biotechnology Co., Ltd., Shanghai, China) using a fluorescent microplate reader (Promega-GloMax, Fitchburg, WI, USA). The insulin resistance and β-cell function were evaluated using a homeostasis model. The formula for the insulin resistance index of the homeostasis model assessment (HOMA-IR) was FBG×FINS/22.5; that for the insulin secretion index (HOMA-β) was 20×FINS/(FBG-3.5).20,21
Statistical Analysis
Continuous data from each subgroup are presented as mean ± standard deviation, and non-normally distributed data were presented as median (min, max). Independent t-test and Mann–Whitney test were used for comparisons between subgroups.
Multivariate logistic analysis was performed to estimate the odds ratio (OR) and 95% confidence interval (95% CI) of the different groups with metabolic parameters. The sensitivity and specificity of various factors for diagnosing PD and T2D were analyzed using the Receiver Operating Characteristic (ROC) curve. Two ROC curve analyses were performed to compare the NGT vs PD and the PD vs T2D (model 1 and model 2, respectively). The cut-off value was determined by calculating the Youden index. A two-tailed P<0.005 indicated statistical significance. Statistical analysis was performed using the Statistical Product and Service Solutions (SPSS) version 23.0 (IBM Corp., Armonk, NY, USA) software.
Ethical Consideration
The project was conducted following the Helsinki Declaration, and the study protocol was reviewed and approved by the Institutional Review Board of the Second Affiliated Hospital of Ningxia Medical University. Each participant signed a written informed consent to participate in the study.
Results
Baseline Characteristics and Metabolic Parameters Between Patient Groups
The basic characteristics of all subjects in the three subgroups are shown in Table 1. Baseline characteristics include age, BMI, systolic blood pressure (SBP) and diastolic blood pressure (DBP), and hematological parameters regarding various metabolic parameters of the enrolled subject. Among the 207 subjects, 118 were male and 89 were female. The ages ranged from 20 to 60 years old (44.62±12.92). The NGT, PD, and T2D subgroup with a mean age of 45.11, 46.11, and 48.07 years, respectively. TRX, 25(OH)D levels and HOMA-β index in PD subgroup, were significantly lower than that in the NGT subgroup (P<0.0001). Similarly, TRX, 25(OH)D levels and HOMA-β index in T2D subgroup, were significantly lower than that in the PD subgroup (P<0.0001). However, significant higher values of other metabolic parameters were observed in T2D subgroup among three subgroups (P<0.0001).
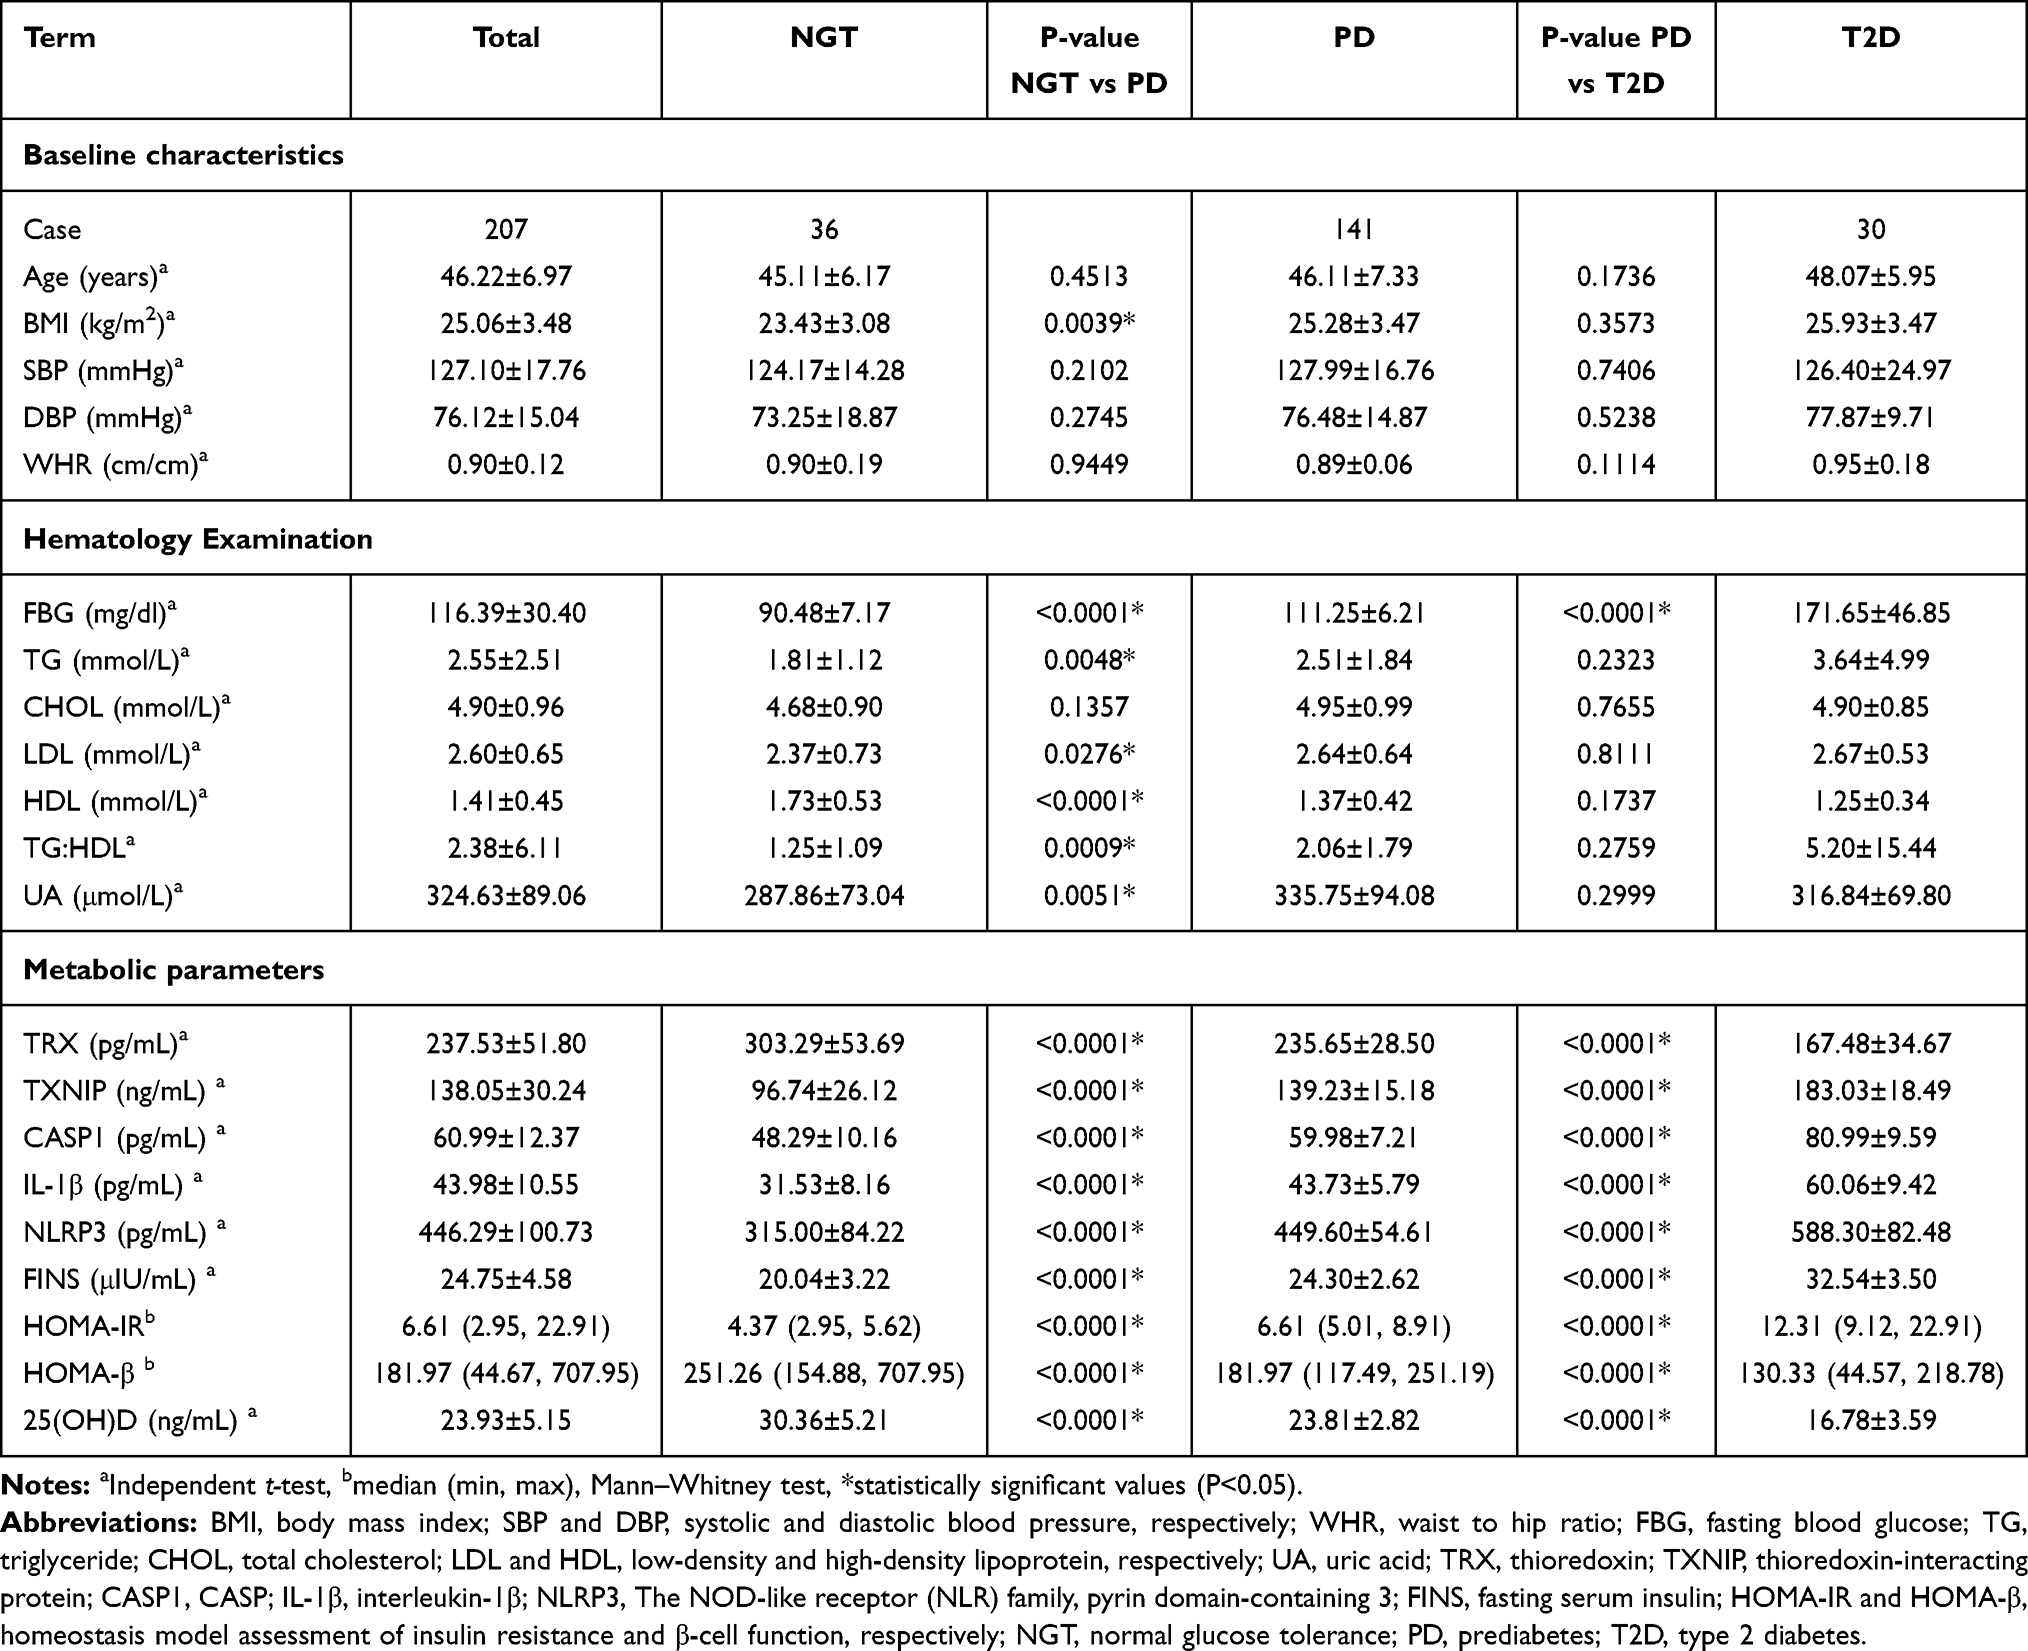 |
Table 1 Characteristics of Three Subgroups in This Study |
Evaluation of the Metabolic Parameters in Diagnosing PD and T2D
The results of univariate analysis and multivariate analysis in NGT vs PD and PD vs. T2D were shown in Table 2. Subjects with higher values of TRX, HOMA-β, and 25(OH)D had a significantly lower risk to be diagnosed as PD, while higher value of TXNIP, CASP1, IL-1β, NLRP3, FINS, and HOMA-IR had a significantly higher risk in PD subgroup. After adjusted BMI, TG:HDL, and UA, subjects with higher values of TRX (aOR: 0.945, 95% CI: 0.926–0.966), HOMA-β (aOR: 0.961, 95% CI: 0.945–0.976) and 25(OH)D (aOR: 0.543, 95% CI: 0.430–0.685) had significantly lower risk to be diagnosed as PD, while subjects with higher values of TXNIP (aOR: 1.123, 95% CI: 1.075–1.173), CASP1 (aOR: 1.204, 95% CI: 1.122–1.291), IL-1β (1.352, 95% CI: 1.210–1.512), NLRP3 (aOR: 1.036, 95% CI: 1.022–1.050), FINS (aOR: 1.747, 95% CI: 1.427–2.138) and HOMA-IR (aOR: 262.330, 95% CI: 1.863–999.99) had significantly higher risk in PD subgroup.
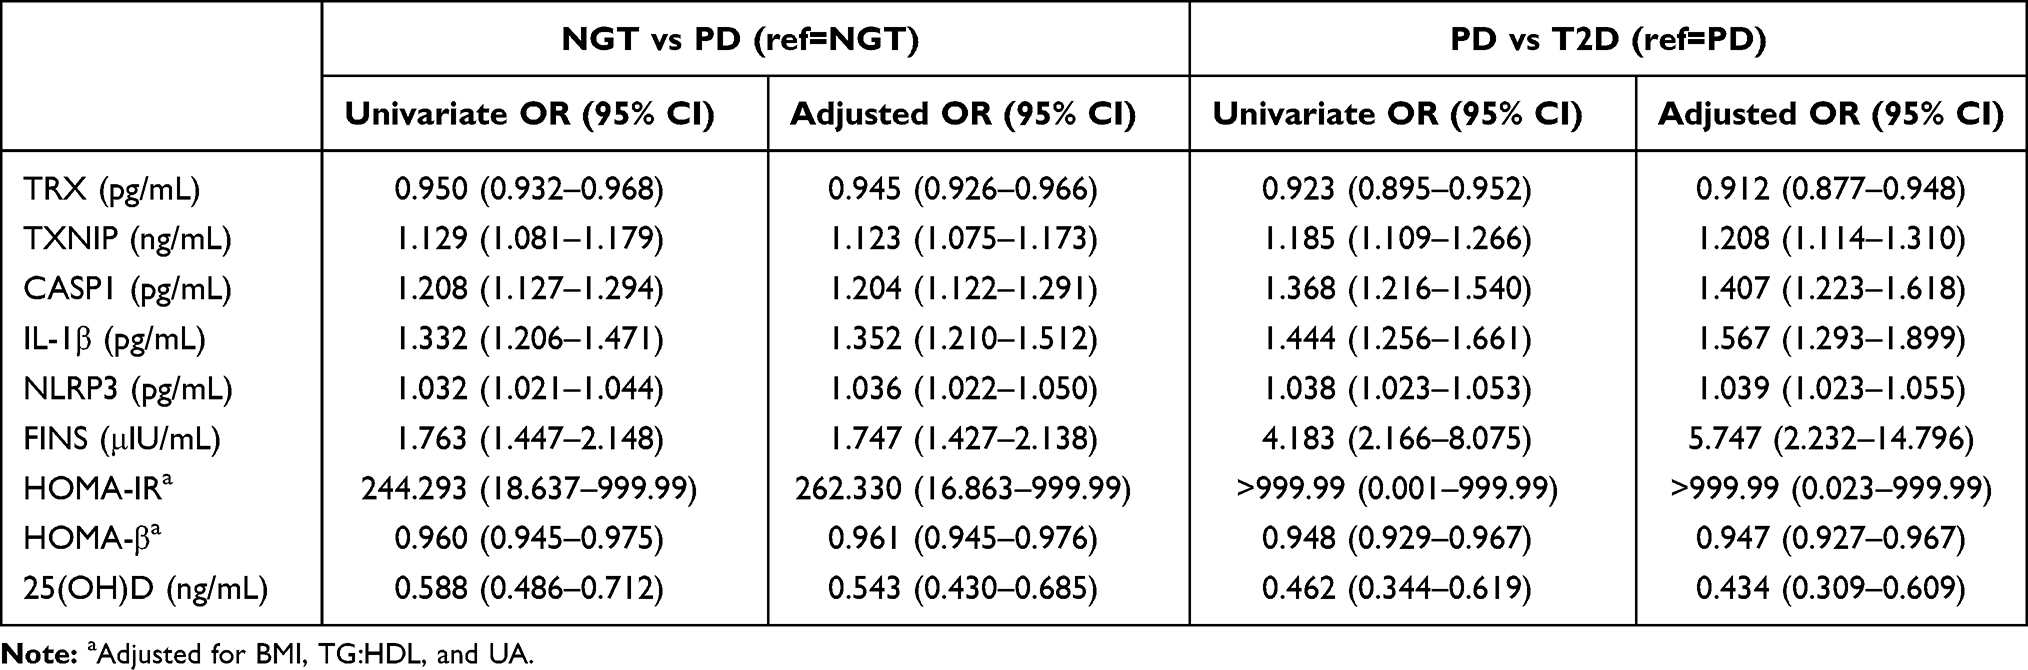 |
Table 2 Univariable and Multivariate Logistic Regression in Metabolic Parameters of NGT vs PD and PD vs T2D |
The results of univariate analysis and multivariate analysis revealed that subjects with higher values of TRX, HOMA-β, and 25(OH)D had a significantly lower risk inT2D subgroup while subjects with higher values of TXNIP, CASP1, IL-1β, NLRP3, FINS, and HOMA-IR had a significantly higher risk to be diagnosed as T2D. After adjusted BMI, TG:HDL and UA, subjects with higher values of TRX (aOR: 0.912, 95% CI: 0.877–0.948), HOMA-β (aOR: 0.947, 95% CI: 0.927–0.967) and 25(OH)D (aOR: 0.434, 95% CI: 0.309–0.609) had significantly lower risk to be diagnosed as while subjects with higher values of TXNIP (aOR: 1.208, 95% CI: 1.114–1.310), CASP1 (aOR: 1.407, 95% CI: 1.223–1.618), IL-1β (aOR: 1.567, 95% CI: 1.293–1.899), NLRP3 (aOR: 1.039, 95% CI: 1.023–1.055), FINS (aOR: 5.747, 95% CI: 2.232–14.796) and HOMA-IR (aOR: >999.99, 95% CI: 0.023–999.99) has significantly higher risk in T2D subgroup (Table 2).
The sensitivity, specificity, AUC, and cut-off values of each biochemical parameter for distinguishing PD from NGT subgroup or T2D from PD subgroup are shown in Table 3. The ROC curve was calculated to obtain the optimal cut-off values of TRX, TXNIP, CASP1, IL-1β, NLRP3, FINS, HOMA-IR, HOMA-β, and 25(OH)D. In NGT vs PD subgroup, HOMA-IR showed a highest AUC value, sensitivity, and specificity (AUC: 0.9864, 95% CI: 0.9742–0.9986, 90.78%, and 97.22%), and TXNIP (AUC: 0.9810, 95% CI: 0.8524–0.9839, 91.49%, 83.33%) has a second higher AUC curve among the other parameters. In the PD vs T2D subgroup, all the metabolic parameters could distinguish these two subgroups. HOMA-IR (AUC=1.000, 95% CI: 1.000–1.000, 100%, and 100%) still showed the highest AUC value, sensitivity, and specificity, and FINS (AUC=0.9872, 95% CI: 0.9753–0.9992, 100%, 92.91%) has a second higher AUC curve rather than the other parameters.
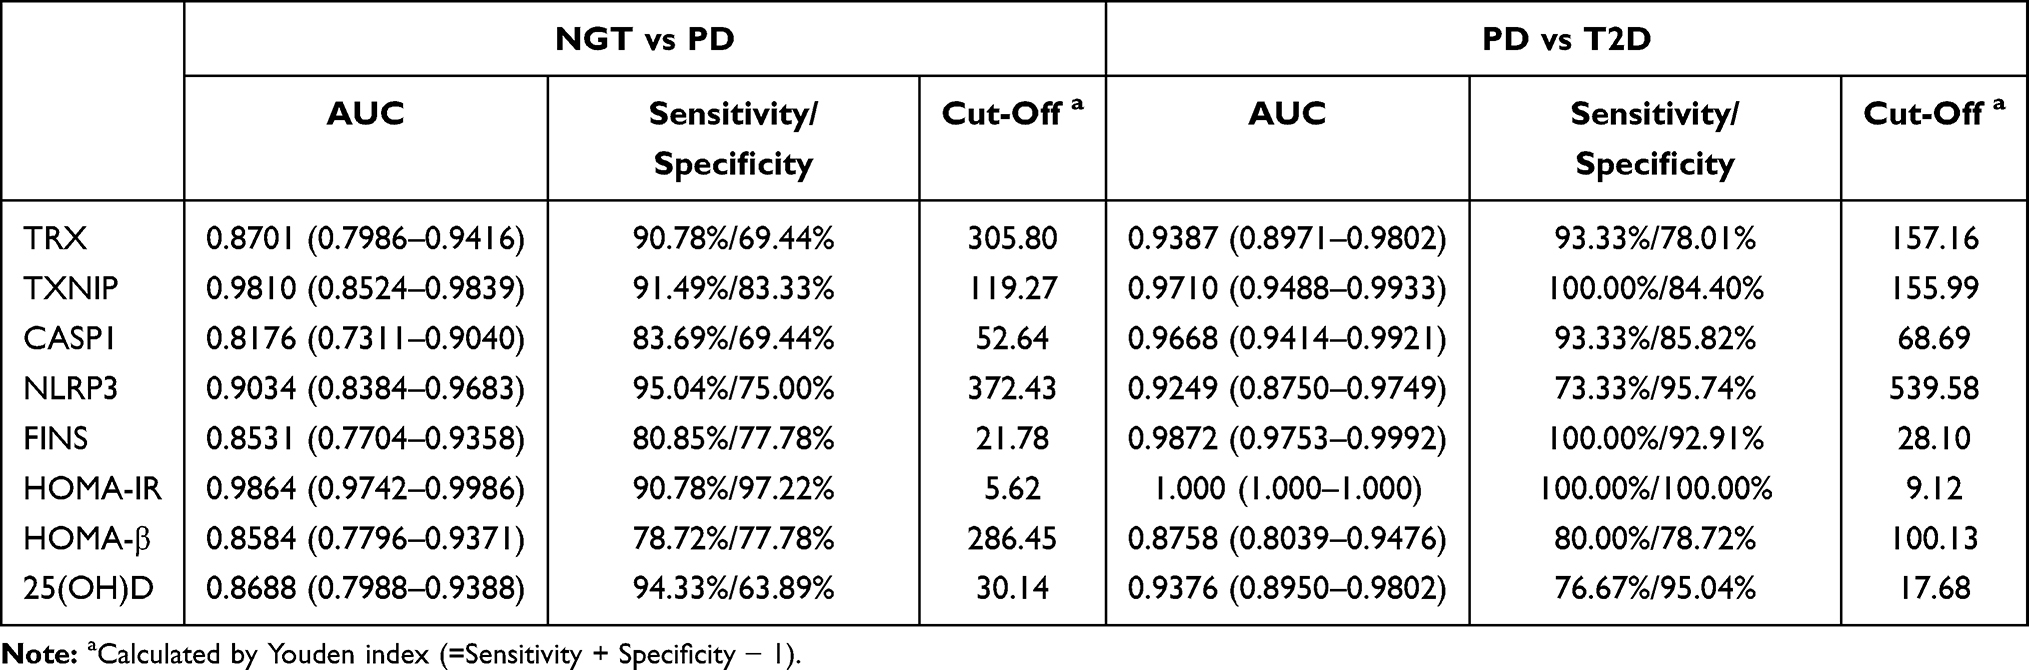 |
Table 3 ROC Curve-Derived Values of NGT vs PD and PD vs T2D Group |
Discussion
This study analyzed the FBG levels in people with normal glucose levels, PD, and T2D. The results showed a particular trend of metabolic parameters connecting with FBG. With the increase in FBG, TXNIP, CASP1, IL-1β, NLRP3, FINS, and HOMA-IR increased significantly. HOMA-IR and FINS showed a significantly higher aOR in T2D vs PD, revealing their potential to be the risk factors for early T2D. Chronic low-grade inflammation is an essential factor leading to the development of T2D.9 The levels of 25(OH)D, TXNIP, and other chronic inflammation-related factors were included in our study to explore those factors as a potential predictor in the early development of T2D. TRX, HOMA-β, and 25(OH)D decreased significantly with the increase in FBG. The lowest aOR in T2D vs PD was observed in 25(OH)D, which might reveal its protective role for the early development of T2D.
The models developed from anthropometric data, fasting laboratory values, an oral glucose tolerance test (OGTT), and information on co-morbidities and lifestyle habits showed better AUC values (0.83, 0.87, and 0.9) than the conventional predictor such as the Finnish Diabetes Risk Score (FINDRISC)22 and Framingham risk scores23 (0.8 and 0.75) for predicting the T2D.24 In this study, relatively higher AUC values of HOMA-IR (0.9864) and TXNIP (0.9810) in the T2D vs PD and HOMA-IR (1.0000) and FIN (0.9872) in the PD vs T2D was observed (Table 3). However, due to the extremely large 95% CI of aOR from HOMA-IR’s, FINS and TXNIP could have more reliability to be diagnostic factors of early T2D than HOMA-IR.
Vitamin D deficiency is prevalent in patients with T2D and can stimulate insulin secretion from pancreatic β-cells by increasing receptor expression to improve pancreatic β-cell function in populations at a high risk of diabetes, improving insulin resistance.12–14 Supplementation of Vitamin D was shown in several clinical trials, increasing serum 25(OH)D, and effectively reducing insulin resistance.10,25 The results of this study suggest that, in the early stage of T2D, vitamin D deficiency may occur when the FBG level is ≥100.8 mg/dl. 25(OH)D deficiency aggravates insulin resistance, induces excessive compensatory insulin secretion, and leads to further impairment of islet β-cell function. Therefore, serum 25(OH)D might play a vital role in early islet β-cell function damage in T2D. Vitamin D has been reported to increase TXNIP expression, and TXNIP expression increases 1,25-dihydroxyvitamin D3 ex vivo in cells.14 In this study, PD and T2D patients at initial diagnosis showed that vitamin D was significantly reduced, while TXNIP was significantly increased. Vitamin D was negatively correlated with TXNIP, a result that is not following previous studies. A previous study14 showed that, in patients with T2D, vitamin D was reduced, and TXNIP did not differ from those with normal blood glucose levels, and vitamin D was positively correlated with TXNIP. This result may be explained by the fact that, in these studies, patients with T2D were on metformin treatment,26–28 and TXNIP may change when blood glucose control and insulin resistance are improved by drug treatment. Therefore, it was hypothesized that when the FBG level is ≥100.8 mg/dl, the abnormal expression of TXNIP is initiated, which activates the TXNIP/NLRP3 chronic inflammatory pathway and influences the cholesterol metabolism pathway related to 25(OH)D metabolism, resulting in the abnormal synthesis of 25(OH)D. Further study should be verified with the mechanism of vitamin D metabolism during abnormal glucose metabolism initiation.
TXNIP, a potential cause of β-cell dysfunction,29 is an essential regulator of activation of NLRP3 inflammatory bodies.30–33 TXNIP can mediate oxidative stress through physiological or pathological inhibition of TRX expression and can also directly activate the inflammatory process, inhibit glucose uptake and participate in the development of insulin resistance, diabetes, and other diseases.5,27,28,34,35
Studies in isolated human islet cells have found that TXNIP significantly upregulated gene expression under high glucose conditions,36 while hyperglycemia can lead to the production of reactive oxygen species (ROS).37 ROS, in turn, triggers TXNIP, and TRX dissociation produces “free” TXNIP and activates NLRP3 inflammatory bodies as well as a series of related inflammatory processes,32 which accelerates β-cell damage. Insulin and glucose have an inter modulatory effect on TXNIP, which is not a simple glucose regulation but focuses on the complete insulin receptor signaling process.34 Additionally, hyperglycemia causes activation of the TXNIP/NLRP3 pathway;38 fatty acids in the bodily tissue can also enhance TXNIP expression.35
Although the compensatory FINS secretion increases, abnormal insulin receptor signaling might occur as well. Under the influence of multiple factors, blood glucose levels deteriorate, and TXNIP might be activated. Subsequent activation of the TXNIP/NLRP3 inflammatory vesicle pathway and aggravation of oxidative stress might further aggravate the insulin β-cell dysfunction. A study has shown that increased tissue glucose concentrations can initiate the carbohydrate-response element-binding protein on the TXNIP gene promoter, increase TXNIP expression, and promote TXNIP synthesis by physiological stimulation.39 TXNIP in patients with impaired glucose regulation increases; high blood levels of glucose and endoplasmic reticulum stress also contribute to TXNIP activation, and TXNIP overexpression increases the rate of apoptosis in pancreatic β-cells and impairs glucose metabolism.39,40 Combining with the evidence of previous studies and higher AUC value of TXNIP in the T2D vs PD in this study, TXNIP might be an inflammatory marker of impaired β-cell function in the early stage of T2D.
Several limitations were indicated in this study. Firstly, the diagnostic criteria of cases were only based on FBG levels, which might cause the misclassification of cases in this study. Secondly, the highly unequal numbers among these three groups and relatively smaller NGT subgroup might cause a heteroscedastic problem during analysis. Thirdly, the physiological effects of TXNIP are produced intracellularly, but only the TXNIP outside the cells was estimated in this study. Fourthly, this study reflects only serum level changes of 25(OH)D and other metabolic parameters and lacks other evidence. Finally, it is unclear whether the serum TXNIP concentration is related to β-cell function in T2D. Therefore, further studies are needed to evaluate and avoid the above limitations.
In conclusion, based on the FBG ≥100.8 mg/dl, the results provide evidence that 25(OH)D might be a protective factor in the early development of T2D. TXNIP and FINS showed the highest AUC value under reliable CI can distinguish PD and T2D patients, respectively. Therefore, the combination of TXNIP and FINS might be potentially the diagnostic indicators for the early development of PD and T2D patients.
Ethics Approval and Informed Consent
The project was conducted in accordance with the Helsinki Declaration, approved by the Institutional Review Board of the Second Affiliated Hospital of Ningxia Medical University. Informed consent was received from each subject prior to their participation in the study.
Acknowledgments
We thank Ling Li, Renda Li, and Qingning Hou for the help of literature research, clinical studies, and experimental studies. We also thank Haiyan Zhou for the help of data analysis and statistical analysis. Xiaomin Xie and Guirong Bai are co-first authors for this study.
Author Contributions
All authors made substantial contributions to conception and design, acquisition of data, or analysis and interpretation of data; took part in drafting the article or revising it critically for important intellectual content; agreed to submit to the current journal; gave final approval of the version to be published; and agree to be accountable for all aspects of the work.
Funding
This work is supported by Special Fund for Guiding Local Science 410 and Technology Development by the Central Government of Ningxia Hui Autonomous Region in 2020; Ningxia Natural Science Foundation Project (Number: 2018AAC03228); and Special Fund of Ningxia Clinical Medicine Research Center for Metabolic Diseases.
Disclosure
The authors report no conflicts of interest in this work.
References
1. Gallwitz B, Kazda C, Kraus P, Nicolay C, Schernthaner G. Contribution of insulin deficiency and insulin resistance to the development of type 2 diabetes: nature of early stage diabetes. Acta Diabetol. 2013;50(1):39–45. doi:10.1007/s00592-011-0319-4
2. Palermo A, Maggi D, Maurizi AR, Pozzilli P, Buzzetti R. Prevention of type 2 diabetes mellitus: is it feasible? Diabetes Metab Res Rev. 2014;30(Suppl 1):4–12. doi:10.1002/dmrr.2513
3. World Health Organisation. Definition, diagnosis and classification of diabetes mellitus and its complications: report of a WHO consultation. Part 1, Diagnosis and classification of diabetes mellitus. Geneva: World Health Organization; 1999.
4. Shoelson SE, Lee J, Goldfine AB. Inflammation and insulin resistance. J Clin Invest. 2006;116(7):1793–1801. doi:10.1172/JCI29069
5. Zhao YC, Zhu J, Song GY, Li XS. Relationship between thioredoxin-interacting protein (TXNIP) and islet β-cell dysfunction in patients with impaired glucose tolerance and hypertriglyceridemia. Int J Clin Exp Med. 2015;8(3):4363–4368.
6. Lenzen S, Drinkgern J, Tiedge M. Low antioxidant enzyme gene expression in pancreatic islets compared with various other mouse tissues. Free Radic Biol Med. 1996;20(3):463–466. doi:10.1016/0891-5849(96)02051-5.
7. Charles-Messance H, Sheedy FJ. Train to lose: innate immune memory in metaflammation. Mol Nutr Food Res. 2020;65(1):e1900480. doi:10.1002/mnfr.201900480
8. Jiang H, He H, Chen Y, et al. Identification of a selective and direct NLRP3 inhibitor to treat inflammatory disorders. J Exp Med. 2017;214(11):3219–3238. doi:10.1084/jem.20171419
9. Lee HM, Kim JJ, Kim HJ, Shong M, Ku BJ, Jo EK. Upregulated NLRP3 inflammasome activation in patients with type 2 diabetes. Diabetes. 2013;62(1):194–204. doi:10.2337/db12-0420.
10. Ishida M, Shima M, Seino Y. 1,25(OH)2D and 24,25(OH)2D production in the developing kidney. Pediatr Nephrol. 1988;2(1):166–170. doi:10.1007/BF00870399.
11. Lu L, Lu Q, Chen W, Li J, Li C, Zheng Z. Vitamin D3 protects against diabetic retinopathy by inhibiting high-glucose-induced activation of the ROS/TXNIP/NLRP3 inflammasome pathway. J Diabetes Res. 2018;2018:8193523. doi:10.1155/2018/8193523
12. Deleskog A, Hilding A, Brismar K, Hamsten A, Efendic S, Ostenson CG. Low serum 25-hydroxyvitamin D level predicts progression to type 2 diabetes in individuals with prediabetes but not with normal glucose tolerance. Diabetologia. 2012;55(6):1668–1678. doi:10.1007/s00125-012-2529-x
13. Park SK, Garland CF, Gorham ED, BuDoff L, Barrett-Connor E. Plasma 25-hydroxyvitamin D concentration and risk of type 2 diabetes and pre-diabetes: 12-year cohort study. PLoS One. 2018;13(4):e0193070. doi:10.1371/journal.pone.0193070
14. Omar DF, Kamal MM, El-Hefnawy MH, El-Mesallamy HO. Serum vitamin D and its upregulated protein, thioredoxin interacting protein, are associated with beta-cell dysfunction in adult patients with Type 1 and Type 2 diabetes. Can J Diabetes. 2018;42(6):588–594. doi:10.1016/j.jcjd.2018.02.012
15. Lai Y, Brandhorst H, Hossain H, et al. Activation of NFkappaB dependent apoptotic pathway in pancreatic islet cells by hypoxia. Islets. 2009;1(1):19–25. doi:10.4161/isl.1.1.8530
16. Hanschmann EM, Petry SF, Eitner S, et al. Paracrine regulation and improvement of beta-cell function by thioredoxin. Redox Biol. 2020;34:101570. doi:10.1016/j.redox.2020.101570
17. Hanschmann EM, Godoy JR, Berndt C, Hudemann C, Lillig CH. Thioredoxins, glutaredoxins, and peroxiredoxins–molecular mechanisms and health significance: from cofactors to antioxidants to redox signaling. Antioxid Redox Signal. 2013;19(13):1539–1605. doi:10.1089/ars.2012.4599
18. Hirota K, Murata M, Sachi Y, et al. Distinct roles of thioredoxin in the cytoplasm and in the nucleus. A two-step mechanism of redox regulation of transcription factor NF-kappa B. J Biol Chem. 1999;274(39):27891–27897. doi:10.1074/jbc.274.39.27891
19. Chou FC, Sytwu HK. Overexpression of thioredoxin in islets transduced by a lentiviral vector prolongs graft survival in autoimmune diabetic NOD mice. J Biomed Sci. 2009;16(1):71. doi:10.1186/1423-0127-16-71
20. Matthews DR, Hosker JP, Rudenski AS, Naylor BA, Treacher DF, Turner RC. Homeostasis model assessment: insulin resistance and beta-cell function from fasting plasma glucose and insulin concentrations in man. Diabetologia. 1985;28(7):412–419. doi:10.1007/BF00280883
21. Tang Q, Li X, Song P, Xu L. Optimal cut-off values for the homeostasis model assessment of insulin resistance (HOMA-IR) and pre-diabetes screening: developments in research and prospects for the future. Drug Discov Ther. 2015;9(6):380–385. doi:10.5582/ddt.2015.01207
22. Lindström J, Tuomilehto J. The diabetes risk score: a practical tool to predict type 2 diabetes risk. Diabetes Care. 2003;26(3):725–731. doi:10.2337/diacare.26.3.725
23. Wilson PW, Meigs JB, Sullivan L, Fox CS, Nathan DM, D’Agostino RB
24. Di Camillo B, Hakaste L, Sambo F, et al. HAPT2D: high accuracy of prediction of T2D with a model combining basic and advanced data depending on availability. Eur J Endocrinol. 2018;178(4):331–341. doi:10.1530/EJE-17-0921
25. Li X, Liu Y, Zheng Y, Wang P, Zhang Y. The effect of vitamin d supplementation on glycemic control in Type 2 diabetes patients: a systematic review and meta-analysis. Nutrients. 2018;10(3):375. doi:10.3390/nu10030375
26. Shaked M, Ketzinel-Gilad M, Cerasi E, Kaiser N, Leibowitz G. AMP-activated protein kinase (AMPK) mediates nutrient regulation of thioredoxin-interacting protein (TXNIP) in pancreatic beta-cells. PLoS One. 2011;6(12):e28804. doi:10.1371/journal.pone.0028804
27. Shao W, Yu Z, Fantus IG, Jin T. Cyclic AMP signaling stimulates proteasome degradation of thioredoxin interacting protein (TxNIP) in pancreatic beta-cells. Cell Signal. 2010;22(8):1240–1246. doi:10.1016/j.cellsig.2010.04.001
28. Chai TF, Hong SY, He H, et al. A potential mechanism of metformin-mediated regulation of glucose homeostasis: inhibition of Thioredoxin-interacting protein (Txnip) gene expression. Cell Signal. 2012;24(8):1700–1705. doi:10.1016/j.cellsig.2012.04.017
29. Schroder K, Zhou R, Tschopp J. The NLRP3 inflammasome: a sensor for metabolic danger? Science. 2010;327(5963):296–300. doi:10.1126/science.1184003
30. Oslowski CM, Hara T, O’Sullivan-Murphy B, et al. Thioredoxin-interacting protein mediates ER stress-induced β cell death through initiation of the inflammasome. Cell Metab. 2012;16(2):265–273. doi:10.1016/j.cmet.2012.07.005
31. Lerner AG, Upton JP, Praveen PV, et al. IRE1α induces thioredoxin-interacting protein to activate the NLRP3 inflammasome and promote programmed cell death under irremediable ER stress. Cell Metab. 2012;16(2):250–264. doi:10.1016/j.cmet.2012.07.007
32. Zhou R, Tardivel A, Thorens B, Choi I, Tschopp J. Thioredoxin-interacting protein links oxidative stress to inflammasome activation. Nat Immunol. 2010;11(2):136–140. doi:10.1038/ni.1831
33. Luo B, Li B, Wang W, et al. Rosuvastatin alleviates diabetic cardiomyopathy by inhibiting NLRP3 inflammasome and MAPK pathways in a type 2 diabetes rat model. Cardiovasc Drugs Ther. 2014;28(1):33–43. doi:10.1007/s10557-013-6498-1
34. Parikh H, Carlsson E, Chutkow WA, et al. TXNIP regulates peripheral glucose metabolism in humans. PLoS Med. 2007;4(5):e158. doi:10.1371/journal.pmed.0040158
35. Masutani H, Yoshihara E, Masaki S, Chen Z, Yodoi J. Thioredoxin binding protein (TBP)-2/Txnip and α-arrestin proteins in cancer and diabetes mellitus. J Clin Biochem Nutr. 2012;50(1):23–34. doi:10.3164/jcbn.11-36SR
36. Shalev A, Pise-Masison CA, Radonovich M, et al. Oligonucleotide microarray analysis of intact human pancreatic islets: identification of glucose-responsive genes and a highly regulated TGF beta signaling pathway. Endocrinology. 2002;143(9):3695–3698. doi:10.1210/en.2002-220564
37. Volpe CMO, Villar-Delfino PH, Dos Anjos PMF, Nogueira-Machado JA. Cellular death, reactive oxygen species (ROS) and diabetic complications. Cell Death Dis. 2018;9(2):119. doi:10.1038/s41419-017-0135-z
38. Davis BK. 1,25(OH)2D and 24,25(OH)2D production in the developing kidney. Nat Immunol. 2018;2018(1):105–106. doi:10.1155/2018/8193523
39. Minn AH, Hafele C, Shalev A. Thioredoxin-interacting protein is stimulated by glucose through a carbohydrate response element and induces beta-cell apoptosis. Endocrinology. 2005;146(5):2397–2405. doi:10.1210/en.2004-1378
40. Chen J, Saxena G, Mungrue IN, Lusis AJ, Shalev A. Thioredoxin-interacting protein: a critical link between glucose toxicity and beta-cell apoptosis. Diabetes. 2008;57(4):938–944. doi:10.2337/db07-0715
 © 2021 The Author(s). This work is published and licensed by Dove Medical Press Limited. The full terms of this license are available at https://www.dovepress.com/terms.php and incorporate the Creative Commons Attribution - Non Commercial (unported, v3.0) License.
By accessing the work you hereby accept the Terms. Non-commercial uses of the work are permitted without any further permission from Dove Medical Press Limited, provided the work is properly attributed. For permission for commercial use of this work, please see paragraphs 4.2 and 5 of our Terms.
© 2021 The Author(s). This work is published and licensed by Dove Medical Press Limited. The full terms of this license are available at https://www.dovepress.com/terms.php and incorporate the Creative Commons Attribution - Non Commercial (unported, v3.0) License.
By accessing the work you hereby accept the Terms. Non-commercial uses of the work are permitted without any further permission from Dove Medical Press Limited, provided the work is properly attributed. For permission for commercial use of this work, please see paragraphs 4.2 and 5 of our Terms.