")
Back to Journals » Diabetes, Metabolic Syndrome and Obesity » Volume 14
Early Prediction Model of Gestational Hypertension by Multi-Biomarkers Before 20 Weeks Gestation
Authors Zhou C, Song C, Huang X, Chen S, Long Y, Zeng S , Yang H, Jiang M
Received 10 March 2021
Accepted for publication 28 April 2021
Published 31 May 2021 Volume 2021:14 Pages 2441—2451
DOI https://doi.org/10.2147/DMSO.S309725
Checked for plagiarism Yes
Review by Single anonymous peer review
Peer reviewer comments 3
Editor who approved publication: Dr Konstantinos Tziomalos
Cheng Zhou,1 Chunlin Song,1 Xiang Huang,1 Shufen Chen,1 Yan Long,2 Shanshui Zeng,2 Hongling Yang,2 Min Jiang2
1Laboratory of Molecular Diagnostics, Southern Medical University Affiliated Maternal & Child Health Hospital of Foshan, Foshan, 528000, People’s Republic of China; 2Department of Laboratory, Guangzhou Women and Children’s Medical Centre, Guangzhou Medical University, Guangzhou, 510623, People’s Republic of China
Correspondence: Hongling Yang; Min Jiang
Department of Laboratory, Guangzhou Women and Children’s Medical Centre, Guangzhou Medical University, No. 9, Jinsui Road, Guangzhou, 510623, People’s Republic of China
Tel +86-20-38857723
; +86-20-38076256
Email [email protected]; [email protected]
Background: Gestational hypertension (GH), a hypertensive disorder of pregnancy (HDP), is a leading cause of maternal and fetal mortality due to the lack of clarity on its exact etiology and clinically feasible prediction models. This study was performed to discover novel biomarkers before 20 weeks gestation and thereby construct an early GH prediction model.
Methods: This study was designed based on differentially expressed protein screening followed by clinical validation. In the screening phase, a nested case-controlled study was conducted by plasma proteomic analyses using label-free LC-MS/MS and plasma samples from seven pre-GH cases before 20-week gestation and seven age- and gestational week-matched controls. In the validation phase, 10 proteins with differential expression in the screening phase were validated by ELISA or electrochemiluminescence in an independent study consisting of 29 pre-GH cases before 20-week gestation and 29 matched controls.
Results: In the screening phase, 149 proteins were found to be differentially expressed between the two groups and were predominantly involved in complement and coagulation cascades, platelet degranulation and positive regulation of cell motility. Further validation showed that serpin family C member 1 (SERPINC1), serpin family A member 5 (SERPINA5), complement factor H-related protein 5 (CFHR5), clusterin, cytokeratin 18 (CK18) and histidine-rich glycoprotein (HRG) levels were significantly higher in women who later developed GH compared to women with uncomplicated pregnancies (P< 0.05). Binary logistic regression analysis was used to determine the combination efficacy of models for early prediction of GH. The model with a combination of SERPINC1, CK18 and HRG had a significantly better discriminatory power (AUC = 0.91, 95% CI 0.83– 0.98) compared to the models with those proteins alone as independent predictors of GH.
Conclusion: Plasma levels of SERPINC1, SERPINA5, CFHR5, clusterin, CK18 and HRG are potential novel predictive biomarkers of GH, and a prediction model using a combination of SERPINC1, CK18 and HRG has good discriminatory performance for GH before 20 weeks gestation.
Keywords: label-free LC-MS/MS, gestational hypertension, biomarkers
Introduction
Gestational hypertension (GH) is defined as de novo hypertension after 20 weeks gestation without proteinuria. GH and preeclampsia (PE) belong to the spectrum of hypertensive disorders of pregnancy (HDP) that is a leading cause of maternal and fetal morbidity and mortality worldwide.1,2 GH can develop into PE and there are important similarities in the causes and pathophysiology of GH and PE, indicating that the two disorders represent different stages of the same disease.3,4 HDP can cause hematologic, cardiac, hepatic and renal complications in the mother, and fetal growth restriction, prematurity, and low birth weight in the fetus. Furthermore, regardless of type, HDP can pose serious lifelong health consequences for the pregnant woman.5,6
In early onset severe cases, HDP can be life-threatening and requires premature delivery of the fetus. Therefore, only early identification of women at risk for HDP can enable them to get early intervention and intensive antenatal surveillance, thereby preventing serious adverse clinical and long-term outcomes. Although the exact pathogenesis of HDP remains elusive, the general theoretical framework underlying the etiology of PE focuses on insufficient spiral artery remodeling due to incomplete trophoblast cell invasion and consequent placental oxidative stress.7–9 This results in placental hypoxia and stimulates the liberation of signal factors (eg, vasoactive factors, inflammatory cytokines, as well as syncytiotrophoblast debris) from the placenta into the maternal circulation. So abnormal expression of some circulating proteins may contribute to the pathophysiological changes related to PE.10 Identification of these proteins will help to clarify the molecular basis of the pathogenesis, as well as to discover potential biomarkers for early prediction. GH can progress to PE and they may share similar etiology.6 Early identification of GH will allow a decreased incidence of PE. Most studies have been focused on identifying predictive biomarkers of HDP or PE, whereas information regarding predictive biomarkers of GH alone is much more limited. Therefore, in the current study label-free nano-LC-MS/MS quantitative proteomics was used to discover the key predictive biomarkers related to GH alone and validate their predictive use as biomarkers.
Materials and Methods
All women who had attended antenatal clinic and subsequently delivered at Southern Medical University Affiliated Maternal and Child Health Hospital of Foshan between July 2018 and June 2019 were recruited. This study was conducted in accordance with the Declaration of Helsinki. The study protocol was approved by the institutional ethics committee and written informed consent was obtained from all participants.
GH was defined as de novo systolic blood pressure >140 mmHg or diastolic blood pressure >90 mmHg after 20 weeks gestation without significant proteinuria. Normal control subjects were healthy pregnant women with normal blood pressure, without proteinuria and any medical or pregnancy complications. In this study, both cases and control pregnant women with one of the following items were excluded: multiple pregnancies, in vitro fertilization treatment, gynecological disease, trophoblastic disease, pre-existing hypertension, gestational diabetes mellitus, infectious diseases, and renal or liver disease. Each case was matched with one normal control individually for age, gestational week and sample collection date in order to eliminate the effect of these confounders.
Sample Collection
Peripheral blood samples (3 mL) were collected from women before 20 weeks gestation. Plasma was separated from blood cells by centrifuging at 3000g for 10 min, followed by a second centrifugation 3000g for 10 min, clear plasma supernatant was aliquoted, and stored at −80°C until required for use.
Label-Free Nano-LC-MS/MS Quantitative Proteomic Analysis
Plasma samples of 7 GH cases matched at 1:1 with controls in the screening set were analyzed using label-free quantification by nano-LC−MS/MS (Thermo Fisher Scientific, Waltham, MA, USA).
Protein Preparation
Plasma samples were homogenised by a homogeniser in SDT1 lysis buffer (4% SDS, 100 mM Tris-HCl, 1 mM DTT, pH 7.6). Protein extraction was performed by sonication (10 times at 80 W, with 10 s intervals) on ice and then boiled for 15 min. Supernatants were filtered through 0.22-μm filters, and protein concentration was measured using the BCA Protein Assay Kit (Bio-Rad, Hercules, CA, USA). These filtrates were stored at −80 °C for further analysis. The protein pellets were resuspended prior to tryptic digestion, and 100 mM HEPES with 100 μL 1% SDC added to the samples and vortexed before centrifugation. Then, the samples were sonicated in a sonicating water bath for 5 min to solubilize the protein pellet. Trypsin was resuspended to a concentration of 0.5 μg/μL in resuspension buffer and incubated for 5 min at room temperature. Four microliters of the prepared trypsin solution was then added to each sample at a ratio of 1:50 (trypsin: protein). The samples were mixed thoroughly before centrifugation and incubated overnight at 37°C to achieve complete digestion.
LC-MS Analysis
Three replicates of each sample were analyzed by nano-LC–MS/MS. Each sample (1 μg protein/sample) was injected onto a 100 μm i.d. × 10 cm reverse-phase C18 BEH column (Waters, Milford, MA, USA). Chromatography was performed using 0.1% formic acid in water (solvent A) and 0.1% formic acid in acetonitrile (solvent B). Peptides were eluted from the column using a gradient of 3% to 35% solvent B for 90 min. At 140 min, the gradient was increased to 95% solvent B and held for 10 min. At 160 min, the gradient returned to 3% to re-equilibrate the column before the next injection. A linear gradient blank was run for 50 min between samples to ensure no carry-over. Peptides eluting from the column were analyzed by data-dependent MS/MS using a Thermo Scientific Q Exactive Orbitrap mass spectrometer (Thermo Fisher Scientific, Waltham, MA, USA). The top-15 method was used to acquire data. Briefly, the instrument settings were as follows: resolution, 70,000 for MS scans and 17,500 for the data-dependent MS/MS scans to improve the speed; counts, 106 for MS AGC target and 105 for MS/MS AGC target. The MS scan range was 300 to 2000 m/z. MS scans were acquired in profile mode and MS/MS were acquired in centroid mode. The repeat count for dynamic exclusion was set to 1 with a 25 s duration. Internal quality control samples were analyzed after every 10th sample.
Data Processing
Following LC–MS/MS acquisition, the data and its reverse decoy were searched using MaxQuant (version 1.5.6.0), against the human protein sequence database (UniProt_human_2016_09) at a false discovery cut off ≤1%. Trypsin was set as the specific proteolytic enzyme, with two maximum missed cleavages allowed. Carbamidomethylation was considered as a fixed modification, whereas oxidation (M) and acetylation (Protein N-term) were set as variable modifications. The minimum and maximum peptide lengths were set to 7 and 4600 amino acids, respectively.
Bioinformatics Analysis
Differentially expressed proteins with a fold change ≥1.1 (up-regulated or down-regulated) between the two groups and the P-value ≤0.1 were considered for further analysis. The functional annotation clustering of the differentially expressed proteins was performed using Database for Annotation, Visualization and Integrated Discovery (DAVID) and the Gene Ontology (GO).
Candidate Biomarker Validation
To construct the prediction model, plasma candidate biomarkers were validated in another 29 GH cases matched at 1:1 with controls. Interleukin-6 (IL-6) levels were measured by electrochemiluminescence using an e411 automatic analyzer (Roche, La Jolla, CA, USA). Serotransferrin levels were measured using an i2000 electrochemiluminescence analyzer (Abbott Laboratories, Lake Forest, IL, USA). Serpin family C member 1 (SERPINC1), serpin family A member 5 (SERPINA5), complement factor H-related protein 5 (CFHR5), cytokeratin 18 (CK18), histidine-rich glycoprotein (HRG), placenta growth factor (PlGF) and soluble fms-like tyrosine kinase 1 (sFlt-1) levels were measured by human immunoassay (Raybiotech, Norcross, GA, USA). Clusterin levels were measured by Human Clusterin ELISA kit (Abcam, Cambridge, UK). The OD value was read at a wavelength of 450 mm using the Multiskan™ FC Microplate Photometer (Thermo Fisher Scientific, Waltham, MA, USA). Assays were performed according to the manufacturer’s instructions. All samples were assayed in duplicate.
Statistical Analysis
Two group comparisons of categorical variables were performed using chi-square test and continuous variables were compared using paired t-tests. The quantitative comparison of plasma proteome profile between the two groups was analyzed using fold change. Logistic regression models were used to evaluate the efficacy of the construction of combination models for GH and receiver operating characteristic (ROC) analysis used to evaluate a model’s predictive performance.
Statistical analyses were conducted using SPSS 18.0 for Windows and GraphPad Prism. P<0.05 was considered statistically significant.
Results
Clinical Characteristics
In the screening phase, 286 pregnant women were recruited, of which 7 developed GH and satisfied all the inclusion and exclusion criteria for the GH group. For the differential expression validation, 1050 pregnant women were recruited, of which 29 developed GH and satisfied all the criteria. GH was associated with adverse pregnancy outcomes such as premature rupture of membranes and cesarean section (Table 1).
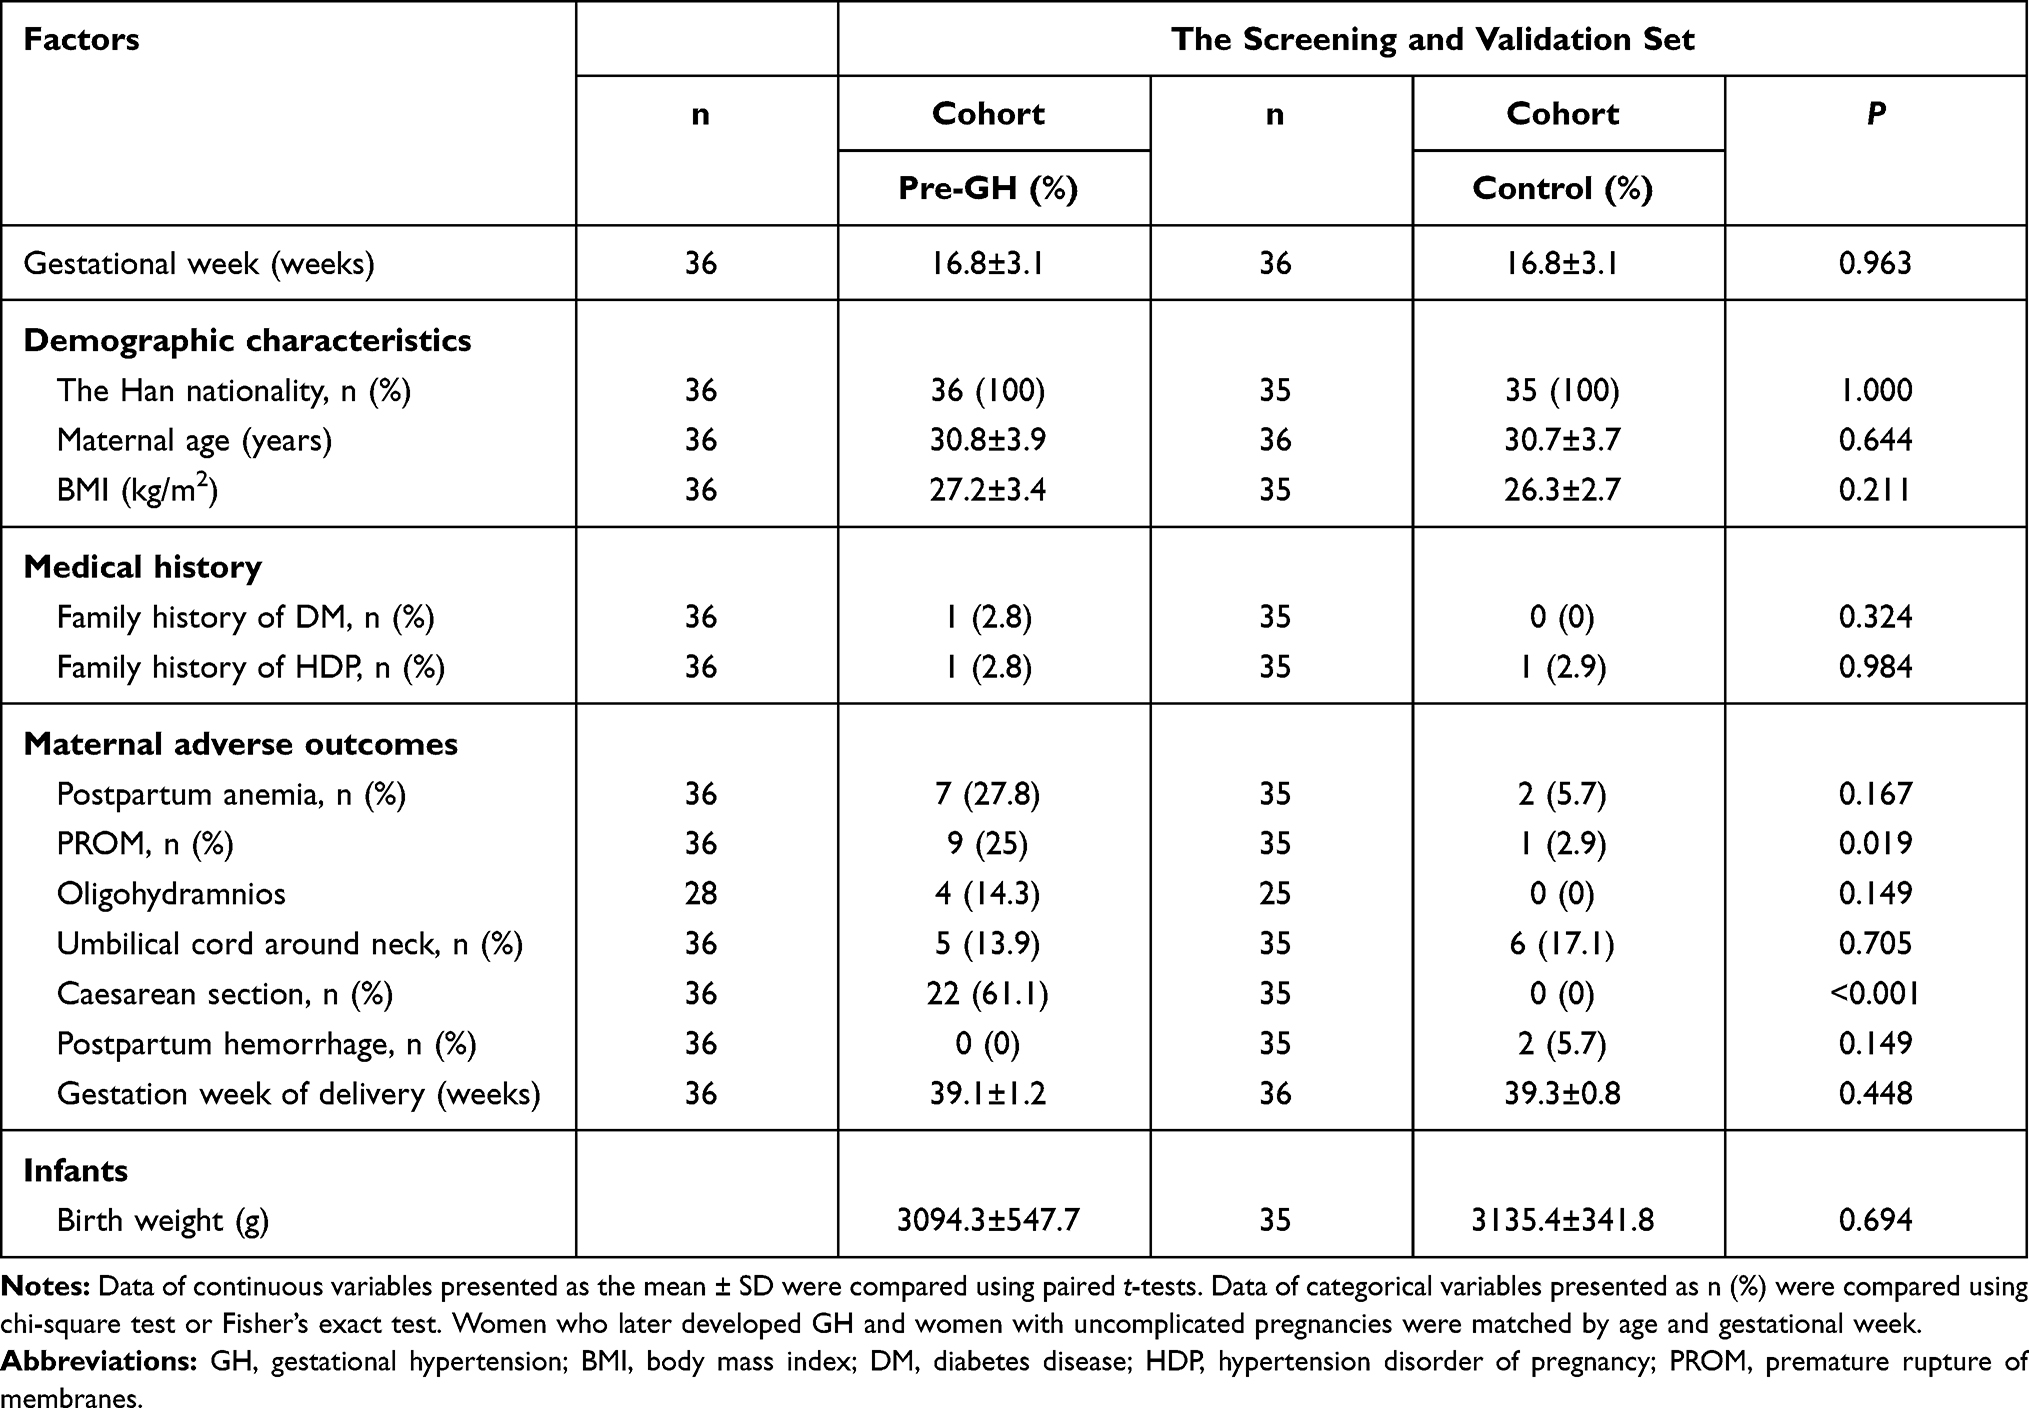 |
Table 1 Characteristics of Pre-GH Patients and Uncomplicated Pregnant Woman as Control |
Candidate Protein Screening
Based on at least two unique peptides, a total of 769 proteins were identified by LC-MS/MS analysis. Through proteomic examination and analyses, it was shown that 82 serum proteins were increased, and 67 were reduced in women who later developed GH after 20 weeks gestation (pre-GH) compared with controls (Supplementary Table 1). SERPINC1, SERPINA5, clusterin, CK18, sFlt-1 exhibited the highest fold change among the up-regulated proteins, while PlGF exhibited the third largest fold change among the down-regulated proteins in GH patients compared with controls (Supplementary Table 1). The identified 149 differentially expressed proteins were classified according to molecular function, cellular component and Kyoto Encyclopedia of Genes and Genomes (KEGG) pathway using DAVID and GO annotation. The major groups of the identified differentially expressed proteins were associated with complement and coagulation cascades (15%), platelet degranulation (15%) and positive regulation of cell motility (12.4%) (Figure 1).
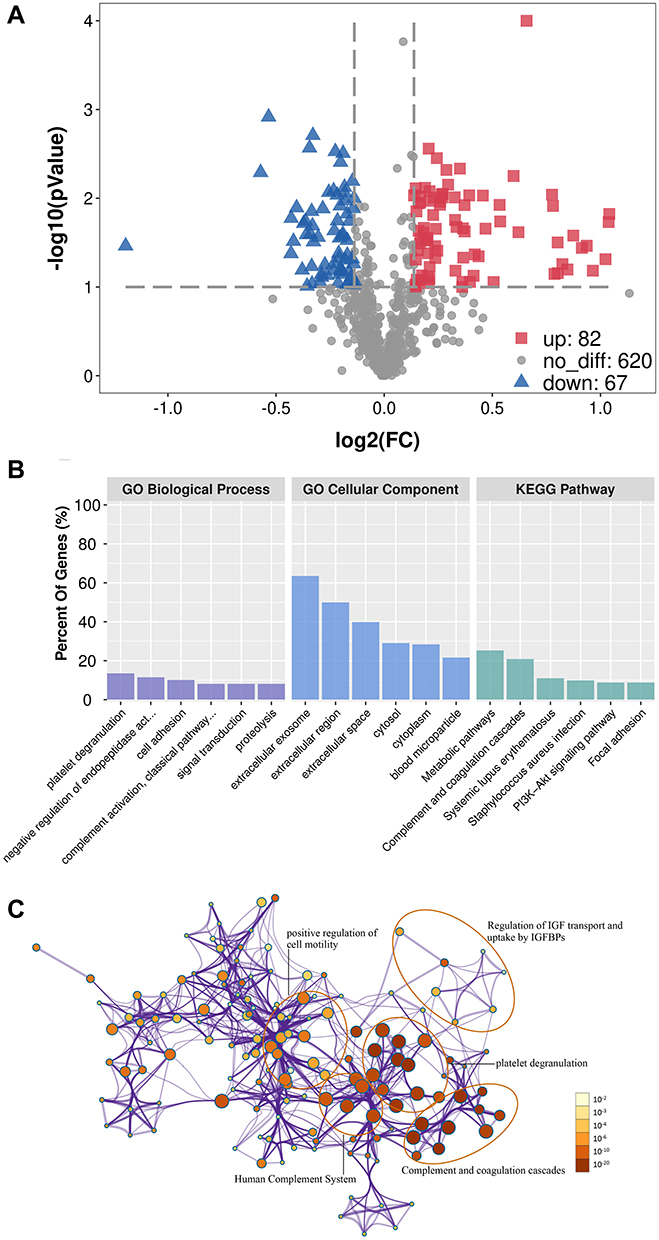 |
Figure 1 Differentially expressed proteins between pre-GH patients and healthy pregnant woman. (A) Volcano plot was used to analyze differentially expressed proteins. Gray nodes represent no differentially expressed proteins, red nodes represent upregulated proteins, and blue nodes are downregulated proteins. Fold change ≥1.1 and P-value ≤0.10. (B) GO and KEGG enrichment analysis of differentially expressed proteins. The top six significantly enriched GO terms and pathways are represented. (C) Network of enriched terms: the intensity of the color represents the size of the P-value (a deeper color indicates a smaller P-value) and the node size represents the number of genes (the larger node indicates more genes). Abbreviation: FC, fold change. |
Candidate Protein Validation
Among the differentially expressed proteins identified in the screening phase, SERPINC1, SERPINA5, clusterin, CK18, sFlt-1, and PlGF exhibited the largest fold change, and CFHR5, HRG, IL-6 and serotransferrin have known effects on vascular endothelial damage, inflammation and oxidative stress, respectively (Supplementary Table 1). In the differential expression validation phase, the 10 candidate proteins were examined in 29 pre-GH cases before 20 weeks gestation and 29 matched controls. These protein levels were significantly increased in pre-GH compared with normal pregnant women: SERPINC1 (147.6±61.8 vs 88.3±56.1 ng/mL, P<0.001), SERPINA5 (1544.5±559.9 vs 1297.7±602.9 μg/mL, P<0.05), CFHR5 (17.3±4.7 vs 14.1±3.8 ng/mL, P<0.001), clusterin (416.5±198.9 vs 337.6±143.8 μg/mL, P<0.01), CK18 (222.2±246.0 vs 100.4±95.9 pg/mL, P<0.05) and HRG (209.1±34.0 vs 166.0±47.5ng/mL, P<0.001). But the plasma levels of IL-6, serotransferrin, PlGF and sFlt-1 did not differ significantly between the two groups (Figure 2, Table 2).
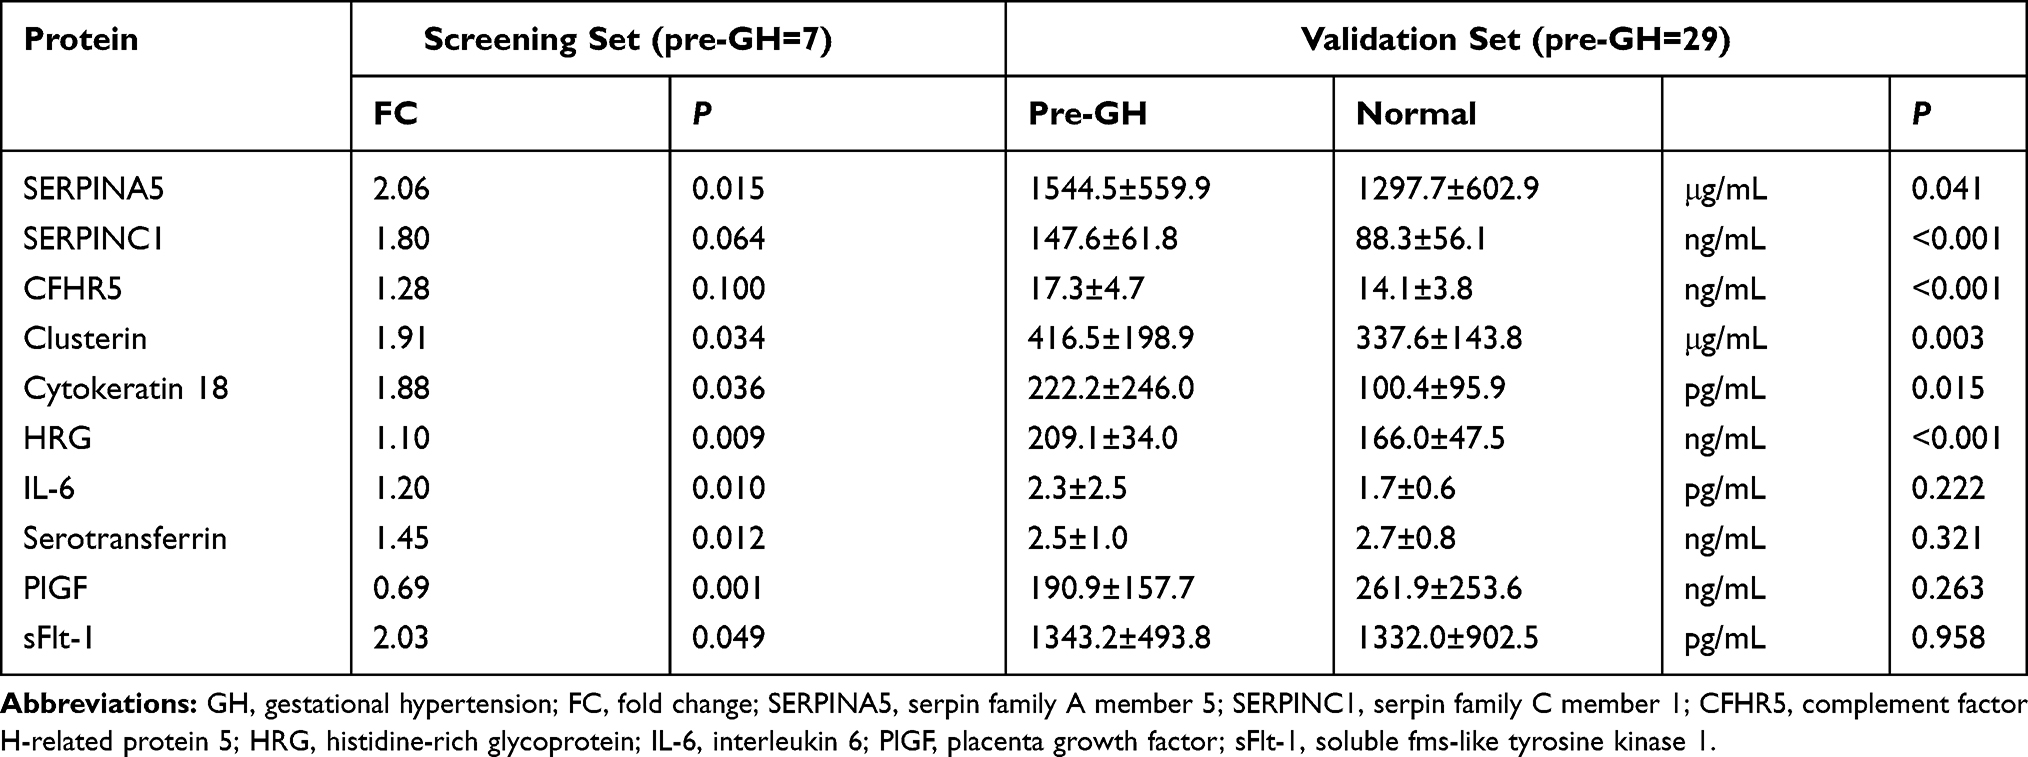 |
Table 2 Candidate Proteins in the Screening/Validation Set |
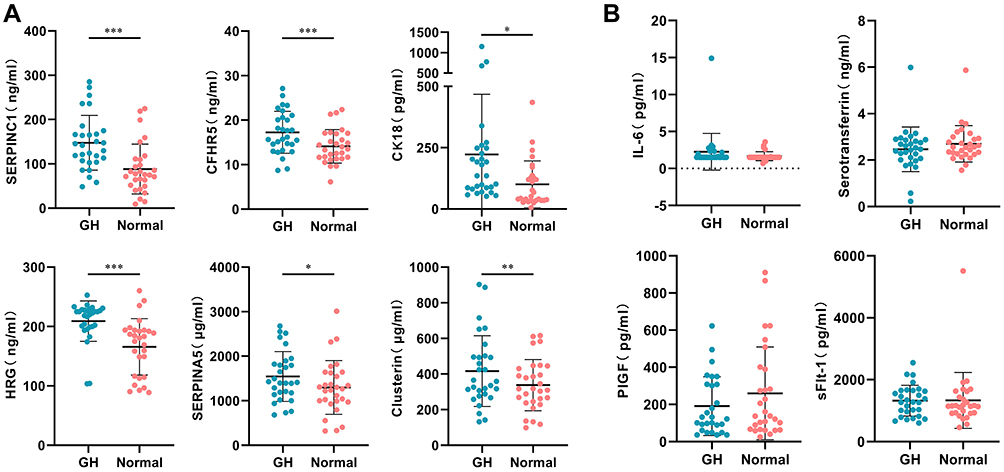 |
Figure 2 Plasma levels of 10 candidate proteins were validated in 29 pre-GH cases and 29 matched controls before 20 weeks gestation. (A) *P<0.05, **P<0.01, ***P<0.001. (B) The levels of IL-6, serotransferrin, PlGF and sFlt-1 did not differ significantly between the two groups. Abbreviations: GH, gestational hypertension; SERPINC1, serpin family C member 1; CFHR5, complement factor H-related protein 5; CK18, cytokeratin 18; HRG, histidine-rich glycoprotein; SERPINA5, serpin family A member 5; IL-6, interleukin 6; PlGF, placenta growth factor; sFlt-1, soluble fms-like tyrosine kinase 1. |
Construction of a Predictive Model for GH
To examine the efficacy of each validated candidate protein on potential prediction before 20 weeks gestation, area under the curve (AUC), sensitivity and specificity were examined. AUC of SERPINC1 was 0.79 (95% CI 0.67–0.91) with sensitivity of 0.90 and specificity of 0.66 based on the optimal cutoff point; SERPINA5, 0.63 (95% CI 0.50–0.76) with sensitivity of 0.62 and specificity of 0.69; CFHR5, 0.71 (95% CI 0.57–0.84) with sensitivity of 0.90 and specificity of 0.45; clusterin, 0.62 (95% CI 0.48–0.74) with sensitivity of 0.38 and specificity of 0.86; CK18, 0.75 (95% CI 0.62–0.88) with sensitivity of 1.00 and specificity of 0.52; and HRG, 0.81 (95% CI 0.68–0.93) with sensitivity of 0.83 and specificity of 0.83 for GH prediction. A prediction model for GH using a combination of SERPINC1, CK18 and HRG was constructed according to the logistic regression. The AUC of this model increased to 0.91 (95% CI 0.83–0.98) with sensitivity of 0.90 and specificity of 0.83 based on the optimal cutoff point for GH prediction (Figure 3).
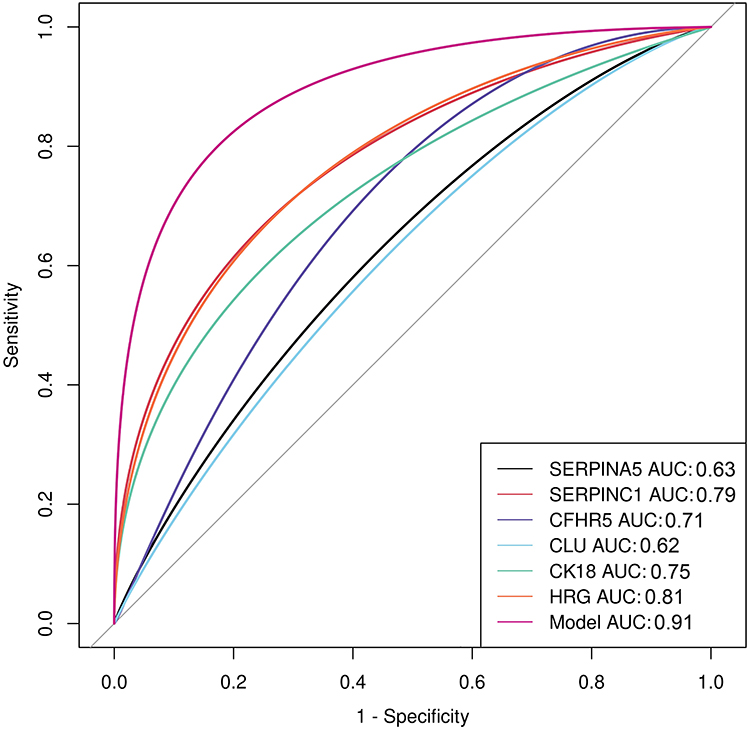 |
Figure 3 ROC curve for GH prediction (n=29). ROC curves of SERPINA5, SERPINC1, CFHR5, clusterin, CK18, HRG alone, and the combined model are marked by different colors and AUCs are listed in the bottom right corner. Abbreviations: AUC, area under the curve; SERPINA5, serpin family A member 5; SERPINC1, serpin family C member 1; CFHR5, complement factor H-related protein 5; CLU, clusterin; CK18, cytokeratin 18; HRG, histidine-rich glycoprotein. |
Discussion
This study demonstrated that increased plasma levels of SERPINC1, SERPINA5, CFHR5, clusterin, CK18 and HRG were associated with the development of GH and a prediction model combining multi-biomarkers showed good discriminatory performance (AUC, 0.91) for GH before 20 weeks gestation. Our model has favorable discriminatory power compared with that of first trimester levels of placental hormones and angiogenic factors, including AUC of 0.57 using soluble endoglin, 0.87 using pregnancy associated plasma protein A, 0.82 using placental protein 13, as reported in first trimester for HDP prediction.11 Therefore, SERPINC1, SERPINA5, CFHR5, clusterin, CK18 and HRG could serve as novel potential biomarkers for early prediction of GH before 20-week gestation. However, some caution must be exercised in comparing to other biomarkers studies as the majority of them relate to prediction of PE and not GH alone. But due to the lack of studies on prediction of GH, the results of the current study have been compared with PE prediction studies. Either way, the model developed here shows good efficacy for prediction of GH and requires validation in larger independent cohorts.
Although this is the first study to report on the correlation between SERPINC1 or SERPINA5 levels and GH, Auer et al demonstrated that circulating levels of SERPINA3 (another member of the same family) were increased in hypertensive placental diseases and that SERPINA3 was expressed in syncytiotrophoblast, indicating that this protein could be released into the maternal circulation by the placenta, therefore leading to increased circulating levels.12 SERPINC1 is also named antithrombin III, a physiological anticoagulative protein produced by hepatocytes.13 Recent studies have shown that thrombin is involved development of a more malignant tumor phenotype in vivo by activating tumor adhesion to the subendothelial matrix, growth, metastasis and angiogenesis.14–16 These results conclude that SERPINC1 can repress the proliferation and migration of cancer cells by interacting with thrombin. SERPINC1 was also reported to efficiently inhibit migration and induce apoptosis of endothelial cells by perturbing focal adhesion kinase (FAK) signaling and consequently disrupting cell-matrix interactions, which inhibit tumor angiogenesis.17 The process of trophoblast invasion in placentation is similar to tumor growth and metastasis, although it is more tightly controlled. We can speculate that the increased SERPINC1 observed in pre-GH may be associated with increased trophoblast cell apoptosis and decreased trophoblast invasion, which is related to the etiology of GH. SERPINA5, also named protein C inhibitor, is a member of the serine protease inhibitor superfamily that is a multifunctional protein family, including anti-metastasis and anti-angiogenesis factors in tumor cells.18 Overexpression of SERPINA5 has been shown to result in a decreased cell invasion, metastatic ability and angiogenesis in tumor cells.19 One of the mechanisms by which SERPINA5 contributes to these processes is dependent on protease inhibitory activity by inactivating urokinase-type plasminogen activator (uPA) and its downstream activation of matrix metalloproteinase 9 (MMP9), leading to failed conversion of plasminogen into plasmin and subsequent extracellular matrix degradation. Another mechanism is through direct interaction with fibronectin and inhibition of the fibronectin-integrin β1 signaling pathway and subsequent downstream activation of MMP9. uPA and MMP9 have been shown to play pivotal roles in trophoblast invasion.20 Therefore, we speculate that increased SERPINA5 may exert similar effects on the incomplete trophoblast invasion in GH through targeting uPA and MMP9.
Many studies have shown that the altered activation of the complement system is associated with the development of HDP. Previous studies have shown increased C1s and FIB-γ levels in PE compared with controls.21,22 Increased shedding of placenta debris caused by trophoblast apoptosis, reperfusion and oxidative stress into the HDP maternal circulation initiates the activation of the classical pathway (CP) and alternative pathway (AP).23 CFHR5 is an analog of complement factor H that enhances local AP activation by interference with the C-inhibiting function of factor H in cell membranes.24,25 Increased levels of CFHR5 have been reported in immunoglobulin A nephropathy, and therefore it may be involved in renal complications observed in HDP.26 CFHR5 mutation has been reported as the cause of the atypical hemolytic uremic syndrome.27 We speculate that increased CFHR5 could cause excessive activation of AP, leading to vascular endothelial damage, excessive inflammation, and renal injury in the HDP mother. Clusterin, a disulfide-linked heterodimeric glycoprotein, is a multifunctional protein implicated in various pathophysiological states including apoptosis, oxidative stress, hypoxia, renal injury and metabolic syndrome.28 Increased clusterin in the syncytiotrophoblast and villous endothelial cells of PE placentae and elevated circulating levels of clusterin in peripheral blood of PE patients have been previously reported.29–31 HDP is accompanied by hypoxia and oxidative stress of the placenta. Clusterin is proposed to be a form of secreted heat shock protein or a chaperone molecule, since its expression is inducible by oxidative, thermal, or mechanical stress.28 Based on these findings, increased plasma clusterin levels seem to reflect increased oxidative stress or endothelial cell dysfunction in HDP. Clusterin is stored in platelet granules from where it is released into extracellular fluid following platelet activation.32 Therefore, increased plasma clusterin levels may also reflect platelet activation in HDP.
Cytotrophoblasts differentiate and fuse with existing syncytiotrophoblast to form the multinucleated layer, providing for growth of the syncytium during placental development and for reepithelization of aged or damaged portions of villi. During differentiation and fusion, aged or damaged portions of the multinucleated syncytiotrophoblast, also called syncytial nuclear aggregates (SNAs), are extruded into the maternal circulation. This process of trophoblast turnover is essential for ensuring normal fetal development, but is increased in PE.33,34 CK18, an intermediate filament protein, is expressed in most epithelial cells and epithelial-derived tissues including trophoblast cells. It has been previously reported that CK18 is increased in the syncytiotrophoblast of PE placentae compared with normal placentae.35–37 Increased circulating levels of CK18 have also been reported in PE and the origin of circulating CK18 is the placental syncytiotrophoblast.35,36 The increased circulating levels of cytokeratins reflects increased shedding of damaged syncytiotrophoblast into the maternal circulation from PE placentae.35,36 Furthermore, increased CK18 may be related to the difference in villous morphology featured by increased SNAs and decreased syncytial bridges, which is indicative of aberrant trophoblast turnover related to HDP.37 However, increased CK18 levels before 20 weeks gestation in pre-GH in our study suggested that those pathological changes may occur prior to the onset of the clinical symptoms of the disease.
HRG is an abundant plasma glycoprotein with a multi-domain structure that can interact with a variety of ligands and has different functions in anti-angiogenesis, pro-angiogenesis, and coagulation that affect the function of the female reproductive system. These effects include ovarian function, embryonic implantation and placentation, especially in HDP.38,39 HRG alters the balance of angiogenesis during the development of HDP.40–42 HRG also has an impact on platelet and fibrinogen levels, and coagulation, which is associated with HDP.39,43,44 Plasma HRG levels in our study were significantly increased before 20 weeks gestation in pre-GH compared with controls. This result was contrary to the findings of Bolin et al who observed significantly lower plasma HRG levels in women who later developed PE compared with controls at 10, 25, and 28 weeks gestational age.40,41 However, similar to our study, Karehed et al demonstrated that HRG levels in the placental endothelial and stromal cells were increased in pregnant women with PE.42 The difference could possibly be explained by the fact that HRG has different expression levels at different gestational ages, and may have either positive or negative effects on HDP progression. HRG has been found to impact on tumor-associated macrophages of phenotype M1 and M2, promoting the anti-tumor angiogenesis function of M1 macrophages and inhibiting the tumor angiogenesis function of M2 macrophages.44 The interaction between HRG and M1/M2 macrophages has been confirmed in the decidual stroma.45 An increased function of M1 macrophages and decreased function of M2 macrophages negatively affects uterine spiral artery remodeling, a critical process in the pathogenesis of HDP.45 Another possibility is that HRG exerts its antiangiogenic effects through signal transduction targeting focal adhesions and thereby interrupting vascular endothelial growth factor (VEGF)-induced endothelial cell motility, eventually disturbing the formation of new blood vessels.46,47
However, angiogenic factors (sFlt-1 and PlGF) and iron status (serotransferrin) as known factors involved in the pathogenesis of PE were not confirmed in the present study.48,49 sFlt-1, PlGF or serotransferrin was not altered in GH, which perhaps reflected that the trophoblast invasion and spiral artery remodeling were not as severely affected in GH than as in PE.
The strength of this study is that the clinical cohort was designed and recruited in a prospective manner and the samples were collected before onset of the disease. On the other hand, one limitation in this work is the relatively small pre-GH sample size and further study on these proteins is warranted to elucidate their biological functions during trophoblast invasion and vascular remodeling.
Conclusion
This study indicated that plasma levels of SERPINC1, SERPINA5, CFHR5, clusterin, CK18 and HRG are increased before 20 weeks gestation in pregnant women who later developed GH. In addition, a prediction model using a combination of multi-biomarkers with good discriminatory performance for GH prediction was developed.
Funding
This work was sponsored by the Natural Science Foundation of China (Grant No. 81871716), as well as internal funding from Guangzhou Women and Children’ s Medical Center (Grant Nos. YIP-2019-024, IP-2019-009 and CWCMC2020-6-017).
Disclosure
The authors have no financial or commercial and/or any conflicts of interest.
References
1. American College of Obstetricians and Gynecologists. Hypertension in pregnancy. Report of the American College of Obstetricians and Gynecologists’Task Force on hypertension in pregnancy. Obstet Gynecol. 2013;122(5):1122–1131. doi:10.1097/01.AOG.0000437382.03963.88
2. Kuklina EV, Ayala C, Callaghan WM. Hypertensive disorders and severe obstetric morbidity in the United States. Obstet Gynecol. 2009;113(6):1299–1306. doi:10.1097/AOG.0b013e3181a45b25
3. Riise HKR, Sulo G, Tell GS, et al. Association between gestational hypertension and risk of cardiovascular disease among 617589 Norwegian women. J Am Heart Assoc. 2018;7(10):e008337. doi:10.1161/JAHA.117.008337
4. Lomeli JMM, Castro NM. [Differences and similarities of preeclampsia and gestational hypertension]. Ginecol Obstet Mex. 2005;73(1):48–53. Spanish.
5. Mannisto T, Mendola P, Vaarasmaki M, et al. Elevated blood pressure in pregnancy and subsequent chronic disease risk. Circulation. 2013;127(6):681–690. doi:10.1161/CIRCULATIONAHA.112.128751
6. Ying W, Catov JM, Ouyang P. Hypertensive disorders of pregnancy and future maternal cardiovascular risk. J Am Heart Assoc. 2018;7(17):e009382. doi:10.1161/JAHA.118.009382
7. Burton GJ, Jauniaux E. Placental oxidative stress: from miscarriage to preeclampsia. J Soc Gynecol Investig. 2004;11(6):342–352. doi:10.1016/j.jsgi.2004.03.003
8. Knight M, Redman CW, Linton EA, et al. Shedding of syncytiotrophoblast microvilli into the maternal circulation in pre-eclamptic pregnancies. Br J Obstet Gynaecol. 1998;105(6):632–640. doi:10.1111/j.1471-0528.1998.tb10178.x
9. Redman CW, Sargent IL. Placental debris, oxidative stress and preeclampsia. Placenta. 2000;21(7):597–602. doi:10.1053/plac.2000.0560
10. Conrad KP, Benyo DF. Placental cytokines and the pathogenesis of preeclampsia. Am J Reprod Immunol. 1997;37(3):240–249. doi:10.1111/j.1600-0897.1997.tb00222.x
11. Zhou C, Long Y, Yang H, et al. TRAIL is decreased before 20 weeks gestation in women with hypertensive disorders of pregnancy. PLoS One. 2015;10(6):e0128425. doi:10.1371/journal.pone.0128425
12. Auer J, Camoin L, Guillonneau F, et al. Serum profile in preeclampsia and intra-uterine growth restriction revealed by iTRAQ technology. J Proteomics. 2010;73(5):1004–1017. doi:10.1016/j.jprot.2009.12.014
13. Hensen A, Loeliger EA. Antithrombin iii. Its metabolism and its function in blood coagulation. Thromb Diath Haemorrh. 1963;83(SUPPL1):1–84.
14. Hu L, Ibrahim S, Liu C, et al. Induces tumor cell cycle activation and spontaneous growth by down-regulation of p27 Kip1, in association with the up-regulation of Skp2 and MiR-222. Cancer Res. 2009;69(8):3374–3381. doi:10.1158/0008-5472.CAN-08-4290
15. Hu L, Roth JM, Brooks P, et al. Twist is required for thrombin-induced tumor angiogenesis and growth. Cancer Res. 2008;68(11):4296–4302. doi:10.1158/0008-5472.CAN-08-0067
16. Hu L, Roth JM, Brooks P, et al. Thrombin up-regulates cathepsin D which enhances angiogenesis, growth, and metastasis. Cancer Res. 2008;68(12):4666–4673. doi:10.1158/0008-5472.CAN-07-6276
17. Larsson H, Sjöblom T, Dixelius J, et al. Antiangiogenic effects of latent antithrombin through perturbed cell-matrix interactions and apoptosis of endothelial cells. Cancer Res. 2000;60(23):6723–6729.
18. Sil H, Sen T, Chatterjee A. Fibronectin‐integrin (α5β1) modulates migration and invasion of murine melanoma cell line B16F10 by involving MMP-9. Oncol Res. 2011;19(7):335–348. doi:10.3727/096504011x13079697132925
19. Asanuma K, Yoshikawa T, Hayashi T, et al. Protein C inhibitor inhibits breast cancer cell growth, metastasis and angiogenesis independently of its protease inhibitory activity. Int J Cancer. 2007;121(5):955–965. doi:10.1002/ijc.22773
20. Lash GE, Otun HA, Innes BA, et al. Low oxygen concentrations inhibit trophoblast cell invasion from early gestation placental explants via alterations in levels of the urokinase plasminogen activator system. Biol Reprod. 2006;74(2):403–409. doi:10.1095/biolreprod.105.047332
21. Kim SM, Cho BK, Kang MJ, et al. Expression changes of proteins associated with the development of preeclampsia in maternal plasma: a case-control study. Proteomics. 2016;16(10):1581–1589. doi:10.1002/pmic.201500381
22. Kolla V, Jenö P, Moes S, et al. Quantitative proteomic (iTRAQ) analysis of 1st trimester maternal plasma samples in pregnancies at risk for preeclampsia. J Biomed Biotechnol. 2012;2012:305964. doi:10.1155/2012/305964
23. Alrahmani L, Willrich MAV. The complement alternative pathway and preeclampsia. Curr Hypertens Rep. 2018;20(5):40. doi:10.1007/s11906-018-0836-4
24. Csincsi ÁI, Kopp A, Zöldi M, et al. Factor H-related protein 5 interacts with pentraxin 3 and the extracellular matrix and modulates complement activation. J Immunol. 2015;194(10):4963–4973. doi:10.4049/jimmunol.1403121
25. Brocklebank V, Wood KM, Kavanagh D. Thrombotic microangiopathy and the kidney. Clin J Am Soc Nephrol. 2018;13(2):300–317. doi:10.2215/CJN.00620117
26. Zhu L, Guo WY, Shi SF, et al. Circulating complement factor H related protein 5 levels contribute to development and progression of IgA nephropathy. Kidney Int. 2018;94(1):150–158. doi:10.1016/j.kint.2018.02.023
27. Chen Q, Manzke M, Hartmann A, et al. Complement factor H-related 5-hybrid proteins anchor properdin and activate complement at self-surfaces. J Am Soc Nephrol. 2016;27(5):1413–1425. doi:10.1681/ASN.2015020212
28. Jones SE, Jomary C. Clusterin. Int J Biochem Cell Biol. 2002;34(5):427–431. doi:10.1016/s1357-2725(01)00155-8
29. Watanabe H, Hamada H, Yamada N, et al. Proteome analysis reveals elevated serum levels of clusterin in patients with preeclampsia. Proteomics. 2004;4(2):537–543. doi:10.1002/pmic.200300565
30. Shin JK, Han KA, Kang MY, et al. Expression of clusterin in normal and preeclamptic placentas. J Obstet Gynaecol Res. 2008;34(4):473–479. doi:10.1111/j.1447-0756.2008.00723.x
31. Hsu TH, Hsieh TT, Yang KD, et al. Proteomic profiling reveals a1-antitrypsin, a1-microglobulin, and clusterin as preeclampsia-related serum proteins in pregnant women. Taiwan J Obstet Gynecol. 2015;54(5):499–504. doi:10.1016/j.tjog.2014.01.007
32. Witte DP, Aronow BJ, Stauderman ML, et al. Platelet activation releases megakaryocyte-synthesized apolipoprotein J, a highly abundant protein in atheromatous lesions. Am J Pathol. 1993;143(3):763–773.
33. Huppertz B, Kingdom J, Caniggia I, et al. Hypoxia favours necrotic versus apoptotic shedding of placental 298 syncytiotrophoblast into the maternal circulation. Placenta. 2003;24(2–3):181–190. doi:10.1053/plac.2002.0903
34. Correa RR, Gilio DB, Cavellani CL, et al. Placental morphometrical and histopathology changes in the different clinical presentations of hypertensive syndromes in pregnancy. Arch Gynecol Obstet. 2008;277(3):201–206. doi:10.1007/s00404-007-0452-z
35. Hefler LA, Tempfer CB, Bancher-Todesca D, et al. Placental expression and serum levels of cytokeratin-18 are increased in women with preeclampsia. J Soc Gynecol Investig. 2001;8(3):169–173. doi:10.1016/S1071-5576(01)00108-3
36. Bancher-Todesca D, Hefler L, Zeisler H, et al. Placental expression of cytokeratin 18 and serum levels of tissue polypeptide antigen in women with pregnancy-induced hypertension. Hypertens Pregnancy. 2001;20(1):89–98. doi:10.1081/PRG-100104175
37. Li XL, Dong X, Xue Y, et al. Increased expression levels of E-cadherin, cytokeratin 18 and 19 observed in preeclampsia were not correlated with disease severity. Placenta. 2014;35(8):625–631. doi:10.1016/j.placenta.2014.04.010
38. Nordqvist S, Karehed K, Skoog Svanberg A, et al. Ovarian response is affected by a specific histidine-rich glycoprotein polymorphism: a preliminary study. Reprod Biomed Online. 2015;30(1):74–81. doi:10.1016/j.rbmo.2014.09.016
39. Poon IK, Patel KK, Davis DS, et al. Histidinerich glycoprotein: the Swiss Army knife of mammalian plasma. Blood. 2011;117(7):2093–2101. doi:10.1182/blood-2010-09-303842
40. Bolin M, Akerud P, Hansson A, et al. Histidine-rich glycoprotein as an early biomarker of preeclampsia. Am J Hypertens. 2011;24(4):496–501. doi:10.1038/ajh.2010.264
41. Bolin M, Wikstrom AK, Wiberg-Itzel E, et al. Prediction of preeclampsia by combining serum histidine-rich glycoprotein and uterine artery Doppler. Am J Hypertens. 2012;25(12):1305–1310. doi:10.1038/ajh.2012.112
42. Karehed K, Wikstrom AK, Olsson AK, et al. Fibrinogen and histidine-rich glycoprotein in early onset preeclampsia. Acta Obstet Gynecol Scand. 2010;89(1):131–139. doi:10.3109/00016340903295618
43. Jones AL, Hulett MD, Parish CR. Histidine-rich glycoprotein: a novel adaptor protein in plasma that modulates the immune, vascular and coagulation systems. Immunol Cell Biol. 2005;83(2):106–118. doi:10.1111/j.1440-1711.2005.01320.x
44. Johnson LD, Goubran HA, Kotb RR. Histidine rich glycoprotein and cancer: a multi-faceted relationship. Anticancer Res. 2014;34(2):593–603.
45. Brown MB, von Chamier M, Allam AB, et al. M1/M2 macrophage polarity in normal and complicated pregnancy. Front Immunol. 2014;5:606. doi:10.3389/fimmu.2014.00606
46. Dixelius J, Olsson AK, Thulin A, et al. Minimal active domain and mechanism of action of the angiogenesis inhibitor histidine-rich glycoprotein. Cancer Res. 2006;66(4):2089–2097. doi:10.1158/0008-5472.CAN-05-2217
47. Lee C, Dixelius J, Thulin A, et al. Signal transduction in endothelial cells by the angiogenesis inhibitor histidine-rich glycoprotein targets focal adhesions. Exp Cell Res. 2006;312(13):2547–2556. doi:10.1016/j.yexcr.2006.04.022
48. Shokry M, Bedaiwy MA, Fathalla MM, et al. Maternal serum placental growth factor and soluble fms‐like tyrosine kinase 1 as early predictors of preeclampsia. Acta Obstet Gynecol Scand. 2010;89(1):143–146. doi:10.3109/00016340903289892
49. Rayman MP, Barlis J, Evans RW, et al. Abnormal iron parameters in the pregnancy syndrome preeclampsia. Am J Obstet Gynecol. 2002;187(2):412–418. doi:10.1067/mob.2002.123895
 © 2021 The Author(s). This work is published and licensed by Dove Medical Press Limited. The full terms of this license are available at https://www.dovepress.com/terms.php and incorporate the Creative Commons Attribution - Non Commercial (unported, v3.0) License.
By accessing the work you hereby accept the Terms. Non-commercial uses of the work are permitted without any further permission from Dove Medical Press Limited, provided the work is properly attributed. For permission for commercial use of this work, please see paragraphs 4.2 and 5 of our Terms.
© 2021 The Author(s). This work is published and licensed by Dove Medical Press Limited. The full terms of this license are available at https://www.dovepress.com/terms.php and incorporate the Creative Commons Attribution - Non Commercial (unported, v3.0) License.
By accessing the work you hereby accept the Terms. Non-commercial uses of the work are permitted without any further permission from Dove Medical Press Limited, provided the work is properly attributed. For permission for commercial use of this work, please see paragraphs 4.2 and 5 of our Terms.