")
Back to Journals » Clinical Ophthalmology » Volume 14
Early Ophthalmic Changes in Macula Does Not Correlate with Visual Function
Authors Narayanan D, Wallstrom G, Rodriguez J , Welch D, Chapin M , Arrigg P , Patil R, Abelson M
Received 1 May 2020
Accepted for publication 12 August 2020
Published 3 September 2020 Volume 2020:14 Pages 2571—2576
DOI https://doi.org/10.2147/OPTH.S260787
Checked for plagiarism Yes
Review by Single anonymous peer review
Peer reviewer comments 2
Editor who approved publication: Dr Scott Fraser
Divya Narayanan,1 Garrick Wallstrom,2 John Rodriguez,1 Donna Welch,1 Matthew Chapin,1 Paul Arrigg,3,4 Rajkumar Patil,1 Mark Abelson1,4,5
1Ora, Inc, Andover, MA, USA; 2Statistics and Data Corporation, Tempe, AZ, USA; 3Joslin Diabetes Center, Boston, MA, USA; 4Ophthalmology, Harvard Medical School, Boston, MA, USA; 5Ophthalmology, Massachusetts Eye and Ear, Boston, MA, USA
Correspondence: Divya Narayanan
Ora, Inc., 300 Brickstone Square, Andover, MA 01810, USA
Tel +1 978-685-8900
Fax +1 978-689-0020
Email [email protected]
Purpose: Early detection and treatment of age-related macular degeneration require a clear understanding of the early progress of the disease. The purpose of this study was to investigate whether minimal macular ophthalmoscopic changes corresponded to changes in visual function.
Methods: Color macular photos from a group of older subjects who were classified as grade 0 on AREDS simplified grading were further evaluated by a retinal specialist using 5x magnification for possible minimal macular anomalies. Group 0-A (N = 15) were defined as subjects with no visible macular anomalies while Group 0-B (N = 19) comprised subjects for whom minimal macular mottling, pigment changes or very small drusen (< 63 μm) were observed in the study eye. All subjects had best VA of 20/25 or better and had no evidence of other retinal diseases in the study eye. All subjects underwent a series of visual function tests such as standard ETDRS VA, low luminance ETDRS VA, Pelli-Robson contrast sensitivity, variable contrast flicker (VCF) sensitivity, and reading speed (words per minute, wpm) using both MNRead and low luminance reading on a tablet.
Results: There was no significant difference between the mean age between the two groups (74.8 ± 5.2 years for 0-A vs 74.5 ± 4.4 for 0-B, p = 0.82). None of the visual function tests identified any significant difference between the two groups. Mean ETDRS VA was 0.0 ± 0.11 for 0-A subjects and 0.08 ± 0.12 for 0-B (p = 0.063). Mean Pelli-Robson log contrast sensitivity was 1.75 ± 0.29 for 0-A and 1.78 ± 0.17 for the 0-B group (p = 0.73). VCF threshold was 0.47 ± 0.25 for 0-A and 0.43 ± 0.22 for 0-B (p = 0.64). Reading speed using MNRead was 214 ± 47.4 wpm for 0-A and 210 ± 64.7 for 0-B (p = 0.85). Low luminance tablet reading speed was 137 ± 71.8 wpm for 0-A and 151 ± 39.4 (0-B) (p = 0.49).
Conclusion: A panel of psychophysical tests did not demonstrate significant differences between subjects with and without minimal macular changes.
Keywords: macula, visual function, AMD
Introduction
Age-related macular degeneration (AMD) is the leading cause of vision loss in developed countries. It is estimated that more than 11 million individuals in the US are affected by AMD with global prevalence of about 170 million.1 Current clinical diagnosis of AMD is based on macular appearance of drusen and/or pigmentary changes in the macula.2,3 In addition to these clinically visible fundus changes, it is known that several cellular level structural changes in Bruch’s membrane, choriocapillaris, retinal pigment epithelium and photoreceptors occur in AMD.4–7
While drusen size and pigment changes have driven diagnosis and disease severity classification systems in AMD, clinical observations from experienced ophthalmologists suggest that minimal mottling and textural changes of the macula are noticeable in older subjects. Because these changes are often minimal and are not obvious unless carefully examined under high magnification using high-resolution devices, such anomalies are often classified as normal age-related changes with low risk for developing an advanced form of AMD. The impact these minimal anomalies may have on visual psychophysical tests remains unknown and can offer valuable insight into early pathological process in this age-related disease.
It has been our belief that form follows function, i.e. functional deficits precede structural changes. During the course of our group’s work to develop novel endpoints for AMD, we noticed that when observed carefully under high magnification, several older subjects’ fundus that were classified as grade 0 on the AREDS scale (i.e. normal aging/very low risk) had minimal mottling and textural changes in the macula. While these changes were visible ophthalmoscopically as well, they appeared more robust when evaluated under a high-magnification setting. The goal of the current study was to determine if these minimal macular structural changes in older normal subjects were associated with deficits in visual function. We thus performed a series of visual function tests to compare these visual outcomes in older normal subjects with and without minimal macular changes.
Methods
The study protocol was approved by an independent Institutional Review Board (Alpha IRB, San Clemente, CA, USA) and all subjects provided written informed consent. The study was conducted in accordance with the ethical principles of the Declaration of Helsinki.
Subjects
All subjects were required to be 60 years or older and willing and able to perform all study procedures. Subjects were excluded from the study if they had a history of seizures or epilepsy, had a diagnosis or evidence of advanced AMD (GA or wet AMD), significant cataracts, history of ocular trauma or surgery (except cataract surgery) or other retinal diseases in the study eye. While subjects with systemic disease such as diabetes mellitus or systemic hypertension were not excluded, all subjects during the study visits reported that these systemic conditions were under control using medications and/or lifestyle modifications as prescribed by their physician. None of the subjects had any ocular complications as a result of these systemic conditions. During the initial screening visit all subjects underwent informed consent, detailed medical and ocular history, visual acuity testing using ETDRS chart, potential acuity meter (PAM), optical coherence tomography (OCT) and dilated fundus photos.
Retinal Imaging and Fundus Grading
During the initial visit, macular scans were obtained in both eyes using spectral domain OCT (Spectralis, Heidelberg). Both eyes were then dilated using 1% tropicamide and 2.5% phenylephrine. After optimal pupil dilation (> 7 mm diameter) digital color fundus photos were taken (450 plus camera; Carl Zeiss Meditec). Photos were evaluated by a retinal specialist and graded using the AREDS simplified grading.2 A grade of 0, 1, 2, 3 or 4 was assigned for each subject. For those with AREDS grade of 0, an additional evaluation was done at 5x magnification to look for the presence or absence of minimal foveal textural changes. Here textural changes refer to visible structural irregularities or disruptions of the foveal appearance caused by pigmentary changes, very small drusen or surface mottling. Based on the fundus photos evaluation, each subject was given a grade, 0-A (i.e. AREDS 0 and no minimal foveal textural changes seen) or 0-B (i.e. AREDS 0 and minimal foveal textural changes seen). While these macular changes are also detectable under ophthalmoscopic examination, fundus photos evaluations provide more robust and standardized setting to grade these findings.
Grouping
For each subject, based on best visual acuity (best of ETDRS VA and PAM) and fundus grading, a qualifying eye was designated as the study eye. If both eyes of a subject qualified then one eye was selected at random as the study eye by the examiner. A total of 102 subjects were originally screened for the study. After excluding subjects who screen failed or failed to complete all study procedures, 57 subjects completed all study procedures over 2 to 3 follow-up visits. For this study only a sub-group of subjects who had a fundus grade of 0 (either 0-A or 0-B) (see above) were included for analysis; 0-A Group: subjects with best VA 20/25 or better and fundus grade of 0-A (i.e. no minimal macular changes) in the study eye, N = 15; and 0-B Group: subjects with best VA 20/25 or better and fundus grade of 0-B (with minimal macular changes) in the study eye, N = 19 (see Table 1).
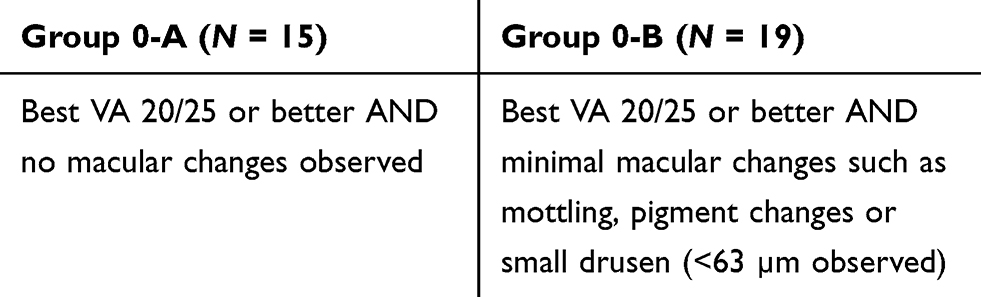 |
Table 1 Scaling Used to Define Groups with and without Minimal Macular Changes |
Visual Function Tests
A series of visual function tests were performed during follow-up visits. All subjects were tested in a similar manner and enough breaks were given between each test to avoid fatigue and to allow for recovery from previous tests. All tests were performed monocularly for the study eye with appropriate correction. The fellow eye remained occluded throughout the testing.
Standard ETDRS Visual Acuity and Low-Luminance (LL) 2.0 ND ETDRS Visual Acuity
ETDRS distance visual acuity as well as LL visual acuity (using 2.0 ND) was tested at 4 m.
Ora-VCFTM Test
A variable contrast flicker (VCF) stimuli presented on a computer monitor was used to assess contrast threshold. The stimuli comprised of a series of flickering lights presented at three temporal frequencies; low (<10 Hz), mid (10–20 Hz) and high (>20 Hz) and two background luminance levels in the upper mesopic range. Each stimulus varied in contrast with the background and the contrast at which a subject can no longer perceive the stimulus was identified as the threshold. Contrast threshold can range from 0 (best) to 1 (worst).
Tablet Reading
Reading tests were performed using an electronic tablet at 40cm under high contrast high luminance (HCHL) and different challenge conditions; mesopic LL (2.0 ND and <1% transmittance), low contrast, crowding, pepper words and vanishing optotypes. Time taken to read accurately was calculated in words per minute (wpm).
MNREAD
The MNREAD test was performed under standard condition as well as under low luminance (with 2.0 ND) using an MNREAD paper chart at 40 cm. Reading speed and accuracy for each font size was measured. Maximum reading speed in wpm and reading acuity were calculated.
Statistical Analysis
Comparison of means between the 0-A and 0-B groups were conducted using two-sided two-sample t-tests. Sensitivity analyses were conducted using the non-parametric Wilcoxon rank sum test. Linear regression was used to compare group means with adjustment for standard ETDRS VA. All statistical comparisons were made at the 0.05 significance level without multiplicity correction.
Results
Figures 1 and 2 show examples of minimal mottling and pigment changes noticed in subjects with fundus 0–B as compared to 0–A. Table 2 summarizes the mean and standard deviation for each test for the two groups.
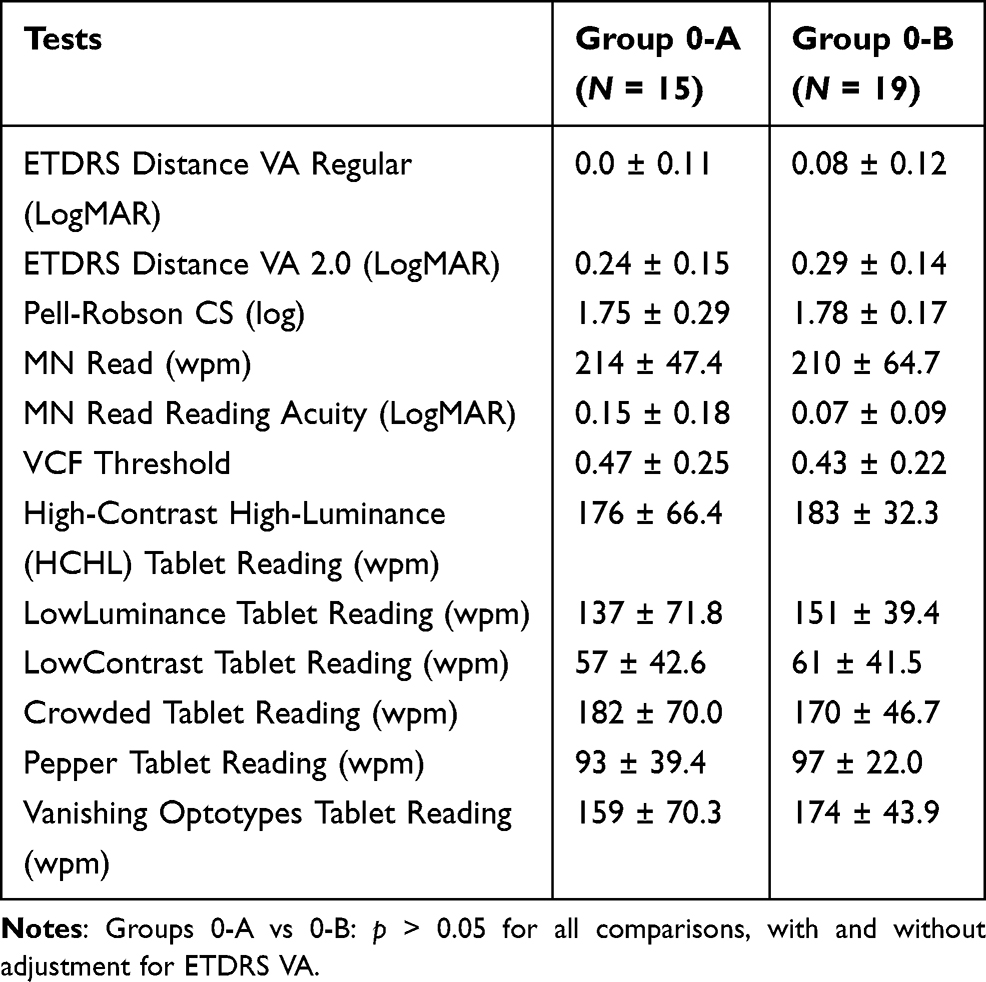 |
Table 2 Mean ± SD of Visual Function Tests for 0-A and 0-B Groups |
Current Commonly Used Clinical Endpoints
No differences between the two groups were found using some currently used common tests and endpoints. The mean standard ETDRS VA was 0.0 ± 0.11 for 0-A and 0.08 ± 0.12 for 0-B (p = 0.063). The low-luminance ETDRS VA was 0.24 ± 0.15 for 0-A and 0.29 ± 0.14 for 0-B (p = 0.31). Mean Pelli-Robson contrast sensitivity was 1.75 ± 0.29 for the 0-A group and 1.78 ± 0.17 for the 0-B group (p = 0.73). Reading speed using the MNRead test was 214 ± 47.4 wpm for 0-A and 210 ± 64.7 wpm for 0-B (p = 0.85). Reading acuity using the MNRead test was 0.15 ± 0.18 logMAR for 0-A and 0.07 ± 0.09 logMAR for 0-B (p = 0.17). In sensitivity analyses using the non-parametric Wilcoxon rank sum test, all p-values remained >0.05 except for standard ETDRS VA (p = 0.045). After adjusting for standard ETDRS VA, p-values for low-luminance ETDRS VA, Pelli-Robson contrast sensitivity, reading speed using MNRead test, and reading acuity using MNRead test were 0.99, 0.26, 0.31, and 0.059, respectively.
Novel Tests Developed for the Current Study
Similarly, no difference was found using the VCF test or tablet reading test. The VCF flicker threshold was 0.47 ± 0.25 for 0-A and 0.43 ± 0.22 for 0-B (p = 0.64; p = 0.44 after ETDRS VA adjustment). HCHL tablet reading was 176 ± 66.4 wpm for 0-A and 183 ± 32.3 wpm for 0-B (p = 0.68; p = 0.26 after ETDRS VA adjustment). Low-luminance tablet reading was 137 ± 71.8 wpm for 0-A and 151 ± 39.4 wpm for 0-B (p = 0.49; p = 0.17 after ETDRS VA adjustment). Low-contrast tablet reading was 57 ± 42.6 wpm for 0-A and 61 ± 41.5 wpm for 0-B (p = 0.81; p = 0.51 after ETDRS VA adjustment). Crowded tablet reading was 182 ± 70.0 wpm for 0-A and 170 ± 46.7 wpm for 0-B (p = 0.56; p = 0.76 after ETDRS VA adjustment). Pepper tablet reading was 93 ± 39.4 wpm for 0-A and 97 ± 22.0 wpm for 0-B (p = 0.72; p = 0.24 after ETDRS VA adjustment). Vanishing optotypes tablet reading was 159 ± 70.3 wpm for 0-A and 174 ± 43.9 wpm for 0-B (p = 0.45; p = 0.085 after ETDRS VA adjustment).
Discussion
In a small group of older normal subjects whose fundus photos were graded 0 using the AREDS simplified grading, a sub-group appeared to have minimal changes in the macula such as mottling, pigment abnormalities and very small drusen, when carefully examined under high magnification. We used a battery of visual function tests to evaluate if subjects with these minimal macular changes also exhibited deficits in visual function. We found that none of the visual function tests used in this study found significant difference between the two groups.
It is known that AMD is a slow progressive disease and the biggest risk factor for AMD is aging. Thus, it is reasonable to hypothesize that prior to developing clinically significant changes such as medium- or large-sized drusen that enables a subject to be classified as early or intermediate AMD, several slight macular changes could be ongoing at a subclinical level. These changes could be so minimal that perhaps they might not be readily detectable using standard clinical equipment, or might be visible but falling short of meeting current clinical threshold for warranting additional detailed evaluation. It is important to understand if there are underlying functional deficits associated with these structural changes as this can offer more insight into the disease process.
In the current study, while a sub-group of subjects showed minimal macular changes, these were not associated with visual function deficits in this group. There are several possible explanations for our observations. We used macular photos to evaluate these minimal changes. Because fundus photos do not offer a cross-sectional view of the anomalies noticed, it is not possible to pinpoint exactly the specific retinal structure contributing to these defects. While visual function tests provide a read-out of the entire retinal function, these visual outcomes are primarily driven by retinal neuronal function, photoreceptors to be more precise. Thus, a minor anomaly in the more outer retinal structures such as RPE or Bruch’s membrane might reflect as minimal structural change but might not necessarily contribute to robust changes in visual function. The importance of a highly sensitive visual function test to capture a slight anomaly cannot be overemphasized. Most clinical and research-based visual function tests are developed and validated in well-characterized disease groups. For example, in a recent study, we found that a variable contrast flicker test, a computer-based contrast sensitivity test, was highly sensitive in differentiating non-advanced AMD from age-matched normal controls compared to some common tests such as ETDRS VA and the Pelli-Robson test.8 The absence of a psychophysical visual correlate to ophthalmoscopy evidence of macular changes to pigment, mottling, and micro drusen presence is remarkable. Do these changes not affect photoreceptor function? Is redundancy of this critical function present or are the tests inappropriate for this early anatomically evident alteration? While the answer is unclear, our tests used in this study are not dynamic and more rapid detection requirements may be needed to detect early macular dysfunction. Towards this we have undertaken modifying testing a battery of dynamic and time-sensitive visual function tests. It is also important to note that the small sample size is a limitation of this study and much larger samples would be needed to detect subtle differences in visual function with statistical significance. With recent advancements in imaging technologies, implementing multi-modal imaging has allowed to evaluate various aspects of structural changes that occur in AMD.9–13 The implications of the findings reported in the current study when assessed using multi-modal imaging techniques not used in this study, needs to be explored further. We will continue to expand our study population to gather additional data and longitudinally track these subjects to observe for retinal structural and functional changes over time.
Conclusion
This paper is meant to highlight the presence of macular abnormalities on fundoscopy in the elderly unaccompanied by any measured loss of a visual function or OCT abnormalities. This suggests that these structural alterations are related to a yet to be tested or understood visual function outcome or represent an anatomical redundancy. At this simple level, this paper shows that normal VA and OCT can be seen associated with pathology of macular seen on ophthalmoscope. This supports a long-held clinical belief by our authors. A longitudinal study is ongoing to track functional and structural changes over time in this unique group.
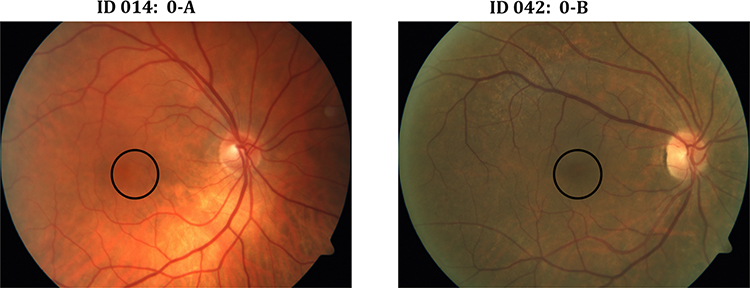 |
Figure 1 Examples of fundus photos from two study eyes graded as 0-A (left; no minimal macular changes) and 0-B (right; with minimal macular changes). The black circle indicates the region in the macula where fundus retinal changes were observed. |
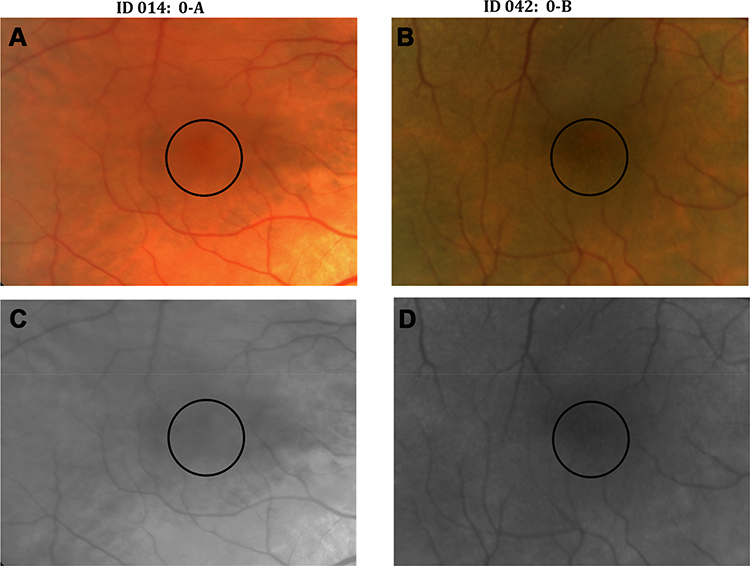 |
Figure 2 Images from same eyes as shown in Figure 1 under high magnification (A, B) and under gray scale (C, D) to better visualize the minimal macular changes seen in subject ID 042. The black circle indicates the region in the macula where fundus retinal changes were observed. |
Disclosure
DN, JR, DW, MC, RP and MA are employees of Ora, Inc. PA is consultant at Ora, Inc. GW is an employee of Statistics and Data Corp and reports personal fees from Ora, Inc. The authors report no other conflicts of interest in this work.
References
1. Pennington KL, DeAngelis MM. Epidemiology of age-related macular degeneration (AMD): associations with cardiovascular disease phenotypes and lipid factors. Eye Vision. 2016;3:34.
2. Ferris FL, Davis MD, Clemons TE, et al. A simplified severity scale for age-related macular degeneration: AREDS report no. 18. Arch Ophthalmol. 2005;123(11):1570–1574.
3. Olsen TW, Bottini AR, Mendoza P, Grossniklausk HE. The age-related macular degeneration complex: linking epidemiology and histopathology using the minnesota grading system (the inaugural Frederick C. Blodi Lecture). Trans Am Ophthalmol Soc. 2015;113:Blodi.
4. Green WR. Histopathology of age-related macular degeneration. Mol Vis. 1999;5:27.
5. Gehrs KM, Anderson DH, Johnson LV, Hageman GS. Age-related macular degeneration–emerging pathogenetic and therapeutic concepts. Ann Med. 2006;38(7):450–471. doi:10.1080/07853890600946724
6. Curcio CA, Millican CL. Basal linear deposit and large drusen are specific for early age-related maculopathy. Arch Ophthalmol. 1999;117(3):329–339. doi:10.1001/archopht.117.3.329
7. Zarbin MA, Casaroli-Marano RP, Rosenfeld PJ. Age-related macular degeneration: clinical findings, histopathology and imaging techniques. Dev Ophthalmol. 2014;53:1–32.
8. Chapin M, Narayanan D, Rodriguez J, Wallstrom G, Welch G, Abelson M. Variable contrast flicker tests in early dry age-related macular degeneration. Invest Ophthalmol Vis Sci. 2019;60:1211.
9. Wu Z, Bogunovic H, Asgari R, Schmidt-Erfurth U, Guymer RH. Predicting progression of age-related macular degeneration using optical coherence tomography and fundus photography. Ophthalmol Retina. 2020. doi:10.1016/j.oret.2020.06.026
10. Ly A, Yapp M, Nivison-Smith L, Assaad N, Hennessy M, Kalloniatis M. Developing prognostic biomarkers in intermediate age-related macular degeneration: their clinical use in predicting progression. Clin Exp Optom. 2018;101(2):172–181. doi:10.1111/cxo.12624
11. Casalino G, Stevenson MR, Bandello F, Chakravarthy U. Tomographic biomarkers predicting progression to fibrosis in treated neovascular age-related macular degeneration: a Multimodal Imaging Study. Ophthalmol Retina. 2018;2(5):451–461. doi:10.1016/j.oret.2017.08.019
12. Tiosano L, Byon I, Alagorie AR, Ji YS, Sadda SR. Choriocapillaris flow deficit associated with intraretinal hyperreflective foci in intermediate age-related macular degeneration. Graefes Arch Clin Exp Ophthalmol. 2020. doi:10.1007/s00417-020-04837-y
13. Guymer R, Wu Z. Age-related macular degeneration (AMD): more than meets the eye. The role of multimodal imaging in today’s management of AMD. Clin Exp Ophthalmol. 2020. doi:10.1111/ceo.13837
 © 2020 The Author(s). This work is published and licensed by Dove Medical Press Limited. The full terms of this license are available at https://www.dovepress.com/terms.php and incorporate the Creative Commons Attribution - Non Commercial (unported, v3.0) License.
By accessing the work you hereby accept the Terms. Non-commercial uses of the work are permitted without any further permission from Dove Medical Press Limited, provided the work is properly attributed. For permission for commercial use of this work, please see paragraphs 4.2 and 5 of our Terms.
© 2020 The Author(s). This work is published and licensed by Dove Medical Press Limited. The full terms of this license are available at https://www.dovepress.com/terms.php and incorporate the Creative Commons Attribution - Non Commercial (unported, v3.0) License.
By accessing the work you hereby accept the Terms. Non-commercial uses of the work are permitted without any further permission from Dove Medical Press Limited, provided the work is properly attributed. For permission for commercial use of this work, please see paragraphs 4.2 and 5 of our Terms.