")
Back to Journals » Drug Design, Development and Therapy » Volume 8
Early non-steady-state population pharmacokinetics of oral cyclosporine in renal transplant recipients
Authors Baek H, Han S , Yim D , Kim SJ, Lee S , Jang HR, Lee JE, Kim DJ, Kim Y, Oh HY, Huh W
Received 3 July 2014
Accepted for publication 26 August 2014
Published 7 November 2014 Volume 2014:8 Pages 2241—2249
DOI https://doi.org/10.2147/DDDT.S70595
Checked for plagiarism Yes
Review by Single anonymous peer review
Peer reviewer comments 5
Editor who approved publication: Professor Shu-Feng Zhou
Hyunjeong Baek,1,* Seunghoon Han,2,3,* Dong-Seok Yim,2,3 Sung Joo Kim,4 Soo-Youn Lee,5 Hye Ryoun Jang,6 Jung Eun Lee,6 Dae Joong Kim,6 Yoon-Goo Kim,6 Ha Young Oh,6 Wooseong Huh6
1Department of Medicine, Kangwon National University School of Medicine, Chuncheon, Republic of Korea; 2Department of Pharmacology, College of Medicine, the Catholic University of Korea, Seoul, Republic of Korea; 3PIPET (Pharmacometrics Institute for Practical Education and Training), Seoul, Republic of Korea; 4Department of Surgery, 5Department of Laboratory Medicine and Genetics, 6Department of Medicine, Samsung Medical Center, Sungkyunkwan University School of Medicine, Seoul, Republic of Korea
*These authors equally contributed to this work
Abstract: This study aimed to evaluate the change in the pharmacokinetics (PK) of cyclosporine in the non-steady-state period in the first week after renal transplantation; the factors influencing this change, including genetic variability; and the time point concentration that correlated best with drug exposure. Data were obtained from 69 patients, and PK studies were conducted on postoperative days (PODs) 2, 3, and 7. Samples were taken pre-dose and at 1, 2, 3, 4, 6, 8, and 12 hours after drug administration. MDR1, CYP3A4, and CYP3A5 were genotyped. A population PK analysis and correlational analysis between the concentration at each time point and the area under the time–concentration curve were performed. A two-compartment model with first-order absorption was chosen. The rate and extent of drug absorption showed a significant increase on POD3, followed by a slight decrease on POD7. Until POD3, 8 hours post-dose was the single time point concentration that correlated best with drug exposure and 3 hours was the best time point on POD7. In both analyses, the MDR1 genotype showed potential as a factor influencing PK change. We conclude that oral administration of cyclosporine and dose adjustment based on a single concentration measurement might result in unexpected drug exposure during this early posttransplantation period.
Keywords: renal transplantation, multidrug resistance 1 (MDR1) gene, cytochrome P450
Introduction
The calcineurin inhibitor cyclosporine (CsA) is a mainstay of immunosuppression in solid organ transplantation. However, the disadvantages of CsA are its narrow therapeutic index, highly variable pharmacokinetics (PK), and interactions with many other drugs that can alter the blood concentration of CsA.1,2 Daily doses are adjusted according to the drug concentration to improve efficacy and reduce toxicity. Traditionally, the trough (pre-dose) concentration (C0) is used to adjust the daily dose. However, C0 monitoring shows a poor correlation with drug exposure3,4 and does not correlate with acute rejection or nephrotoxicity.4 Recently, studies have shown that the 2-hour post-dose concentration (C2) of CsA correlates well with the area under the curve (AUC) derived from multiple point sampling and may be predictive of clinical outcomes.3,5,6 However, these studies reported the results in stabilized subjects receiving CsA therapy more than 1 week after transplantation. There is insufficient information on the PK of CsA during the early, non-steady-state posttransplantation period. In the clinical setting, there are suggestions that the PK parameters in the early period of CsA therapy tend to be inconsistent, resulting in variable outcomes.
In addition, many factors, such as age, sex, race, concomitant diseases, drug interactions, and genetic factors, may influence the interindividual and intraindividual variability of CsA PK. In particular, the CYP3A4, CYP3A5, or MDR1 genotype might be influential because the drug is a metabolic substrate for the cytochrome P450 3A enzymes, CYP3A4 and CYP3A5, and is transported out of cells via P-glycoprotein.7 Population PK analysis can provide quantitative estimates of interpatient and intrapatient variability and of the modifying influence of demographic and genetic covariates on the PK of CsA.
In this context, we used a population approach to examine the changes in the PK parameters of CsA during the first 7 days after transplantation and explored the factors that contributed to these changes, including demographics and MDR1, CYP3A4, and CYP3A5 polymorphisms. In addition, we searched for the single time point concentration that correlated best with the AUC, which might serve as the target drug concentration for therapeutic drug monitoring during this period.
Materials and methods
Patients and study design
Sixty-nine patients participated in the study after giving informed consent. The study was approved by the institutional review board of the Samsung Medical Center, Seoul, Korea. Patients older than 16 years who had undergone their first living-donor renal transplantation at the Samsung Medical Center were eligible for the study. The major exclusion criteria were congestive heart failure (ejection fraction <35%), chronic liver disease, systemic infection, malignant disease, multiple-organ transplantation, or positive serological evidence of human immunodeficiency virus. All patients received triple immunosuppression with CsA, mycophenolate mofetil (Cellcept®; Hoffman-La Roche Ltd., Basel, Switzerland), and steroids without induction therapy. On postoperative day (POD) 1, 4 mg/kg CsA (Cipol Inj.®; Chong Kun Dang, Seoul, Korea) was administered intravenously. On POD2, 8 mg/kg micro-emulsified CsA (Cipol-N® soft capsule; Chong Kun Dang) was administered orally in two doses and adjusted to a target trough level in the range 300–350 ng/mL during the first postoperative week. Mycophenolate mofetil was administered at a dose of 1,500 mg/day. Five hundred milligrams of methylprednisolone (MPD) was administered intravenously before and during the operation. One dose of 500 mg of MPD was administered on POD1, and thereafter the dose was tapered by 50% daily until POD4. During POD5–7, 60 mg/day of MPD was administered intravenously.
Full PK studies were conducted during the 12 hours after the morning dose of CsA on POD2, 3, and 7. Whole-blood samples were obtained pre-dose (C0) and at 1 (C1), 2 (C2), 3 (C3), 4 (C4), 6 (C6), 8 (C8), and 12 (C12) hours after drug administration. POD2 and 3 were the earliest days after the operation when study-related procedures could be performed, and the PK change was expected to be maximal during this period. POD7 was chosen for full PK study under the assumption that the PK would be stabilized to the characteristics not affected by renal transplantation.
Measurement of CsA concentration
Samples were collected in tubes containing ethylenediaminetetraacetic acid and frozen at −20°C until assayed. CsA concentration in whole blood sample was measured using a specific monoclonal enzyme-multiplied immunoassay technique (TDxFLx Analyzer; Abbott Laboratories, Abbott Park, IL, USA). The lower limit of quantification was 25 ng/mL, and the upper limit was 500 ng/mL. When results >500 ng/mL were obtained, the samples were diluted 1:4 with blank whole blood and reanalyzed.
Genotyping
The patients were genotyped for CYP3A4, CYP3A5, and MDR1 by polymerase chain reaction (PCR) and sequencing. DNA was extracted from peripheral blood leukocytes. For genotyping of CYP3A4 (GenBank accession number AF209389), we performed sequencing of exon 5 (5′–AGTTGTTGAATAAGTGTTCCTGTTT−3′ and 5′–CCTTGGAAAGGGACTGTGAT–3′) and exon 10 (5′–CTTAGGGATTTGAGGGCTTC–3′ and 5′–TCAGAGCCTTCCTACATAGAGTCA–3′) to analyze T878C (CYP3A4*1) and A392G (CYP3A4*1B) polymorphisms, respectively. The intron 3 region of CYP3A5 (GenBank accession number J04813) was amplified and sequenced to analyze CYP3A5*3 (6986A>G) polymorphism (5′–GGCATAGGAGATACCCACGTA–3′ and 5′–GGACAACGGAGCTGATTAAA–3′). For MDR1 (GenBank accession number M29445), only exon 26 was subjected to PCR and sequencing to examine the C3435T polymorphism (5′–TCACAGTAACTTGGCAGTTTCA–3′ and 5′–GGAGACCAGCCCCTTATAAATC–3′). All PCR products were sequenced using the ABI Prism BigDye Terminator Cycle Sequencing Kit and an ABI Prism 3100 Genetic Analyzer (Thermo Fisher Scientific, Waltham, MA, USA).
Population PK modeling
A population PK analysis was conducted with NONMEM (v 7.2; ICON, Ellicott City, MD, USA). The first-order conditional estimation with interaction option method was used for the estimation processes whenever applicable. Various PK models were tested, including single- and multicompartmental distribution models with or without absorption lag time (ALAG1). The relationship describing the between-subject variability (BSV) of each parameter is expressed in Equation 1:
Pij = θj · Exp(ηij) | (1) |
where Pij is the jth PK parameter for the ith individual, θj is the typical value of the jth population parameter, and ηij is a random variable for the ith individual in the jth parameter distributed with a mean of 0 and variance of ωj2. For intraindividual variability (residual error), both additive and proportional characteristics were initially allowed (Equation 2):
COBS = CPRED · (1 + ε1) + ε2, | (2) |
where COBS and CPRED are the observed and predicted concentrations of CsA, respectively. ε1 and ε2 are assumed to follow the distribution of N(0, σ12) and N(0, σ22), respectively. However, an inestimable component of the error model was excluded for the final model. Interoccasional variability was not explored extensively because our goal in this analysis was not to describe exactly the individual PK behavior but to elucidate the population PK characteristics for each POD. Objective function value (OFV) for nested models and the Akaike information criterion for non-nested models were used as numerical criteria for model selection in addition to the visual diagnostics using various diagnostic plots. All graphical procedures were performed using R software (v 2.15.3; The Comprehensive R Archive Network, Vienna, Austria).
Covariate analysis
Two continuous variables (age and weight) and five discrete variables (sex, CYP3A4 genotype, CYP3A5 genotype, MDR1 genotype, and POD) were tested as potential covariates for the parameters. Before testing each covariate for its ability to improve the model, a covariate-screening procedure was performed using Xpose4 (v 4.4.0; Department of Pharmaceutical Biosciences of Uppsala University, Uppsala, Sweden). The screening included both visual and numerical approaches. For visual screening, parameters versus covariates were plotted. A scatterplot was used for continuous variables and a box plot for discrete variables. In numerical screening, a generalized additive modeling procedure was applied. A decrease in the Akaike information criterion value was considered an indicator of a potential covariate. Variables that showed a potential relationship with any parameter in one or both of the screening procedures were included in the model and tested for their significance.
Covariates were selected using forward selection–backward elimination with the likelihood ratio test. Because the OFV follows a chi-square distribution, a difference in the OFV >3.84, associated with a P-value <0.05, was used to indicate statistical significance.
Model evaluation
Two kinds of simulation-based model diagnostic procedures were used for model evaluation. One method was a visual predictive check using $SIMULATION of NONMEM. In total, 7,000 concentration data points were obtained after performing 1,000 simulations (seven data points for each). Using these data, the 90% prediction interval for the concentration at each sampling time was estimated and presented on a time-versus-concentration plot. By overlaying the raw (or observed) time–concentration data, the adequacy of the final model was evaluated. The other method used was bootstrap implemented in Wings for NONMEM (v 720; N Holford, Auckland, New Zealand), where the observed dataset was resampled with replacement to generate a new dataset of the same size and population characteristics as the original dataset. This procedure was repeated 1,000 times to generate a distribution of the parameters with a median and 95% confidence interval. We checked whether the original parameter estimates were located within the 95% confidence interval of the newly obtained parameter estimates.
Correlational analysis
Simple linear regression models (SAS, v 9.1; SAS Institute Inc., Cary, NC, USA) were applied to assess the correlation between single concentration time points and 12-hour AUC (AUC0–12) calculated using the linear trapezoidal rule. Correlation coefficients and P-values were obtained and compared to find the time best reflecting the magnitude of the AUC0–12.
Results
Patients and dataset
Two of the 69 patients had acute rejection episodes on POD5 and 6, respectively, and did not undergo a PK study on POD7. The demographic data for all patients are summarized in Table 1. Table 2 shows the frequencies of each allele for MDR1 C3435T, CYP3A4, and CYP3A5 genotypes. For MDR1 C3435T, the homozygous wild-type CC genotype was observed in 24 (34.8%) patients, whereas at least one variant allele (heterozygous CT genotype or homozygous TT genotype) was carried by 45 (65.2%) patients. Most of the recipients (97.1%) had the CYP3A4*1/*1 wild-type genotype; only two recipients had the heterozygous *1/*1B genotype. We identified 20 (29%) CYP3A5 expressers (recipients with either the CYP3A5*1/*1 or the CYP3A5*1/*3) and 49 (71%) nonexpressers (recipients with the CYP3A5*3/*3). The observed and expected allele frequencies were compared using the Hardy–Weinberg equilibrium. The genotype frequencies were not significantly different from the predicted frequencies (P>0.05).
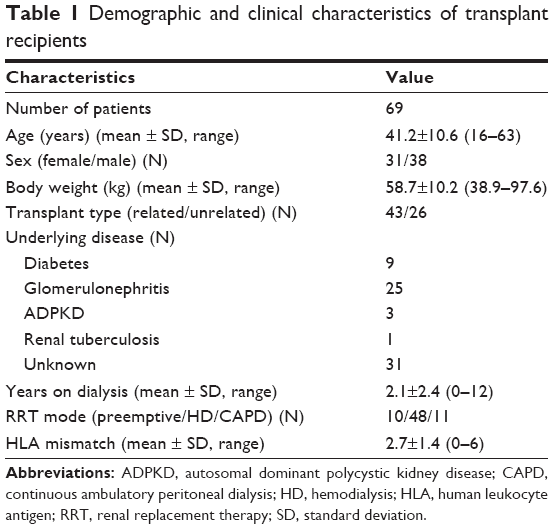 | Table 1 Demographic and clinical characteristics of transplant recipients |
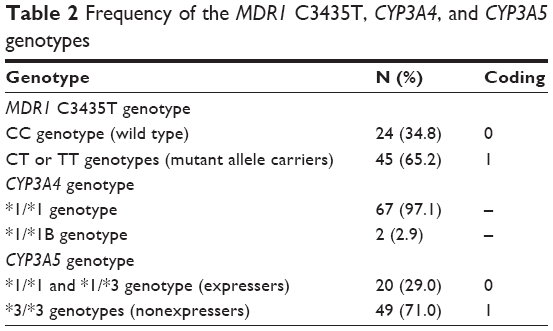 | Table 2 Frequency of the MDR1 C3435T, CYP3A4, and CYP3A5 genotypes |
A total of 1,640 whole-blood CsA concentration–time measurements were used to develop the PK model. The dataset consisted of subject identification number, sampling time, whole-blood CsA concentration, and potential influential variables such as age, body weight, sex, and genotype. However, the CYP3A4 genotype was excluded because, as shown in Table 2, most subjects had the *1/*1 allele, so the genotype could not be considered an influential variable. The CYP3A5 and MDR1 genotypes were recategorized because very few patients had the homozygous mutant MDR1 or CYP3A5*1/*1 genotype.
Population PK modeling
A two-compartment linear mammillary model with first-order absorption was chosen to explain the PK characteristics of CsA. The basic parameters were the elimination rate constant (k), the volume of the central compartment (V2), the volume of the peripheral compartment (V3), the intercompartmental clearance (Q), and the absorption rate constant (ka). The elimination constant k was estimated instead of clearance (CL) because the estimated value of CL in each individual was highly correlated with V2. ALAG1 was included in the final model for its significant contribution to model improvement. During the modeling process, when the bioavailability was not included as an independent parameter, the estimates for CL and V2 (actually CL/F and V2/F) changed in a synchronized pattern with the study day. To explain this tendency, the relative bioavailability (F1) on POD3 and POD7 compared with the bioavailability on POD2 was included because we considered that the absorption property is more likely to change during the study period (the first postoperative week) than are the disposition characteristics. The distribution of random residual errors could be explained using only the proportional parameter (ε1). The shrinkage level for every random-effect parameter estimated was <20%. The parameter estimates and the goodness-of-fit plot for the final model are given in Table 3 and Figure 1, respectively.
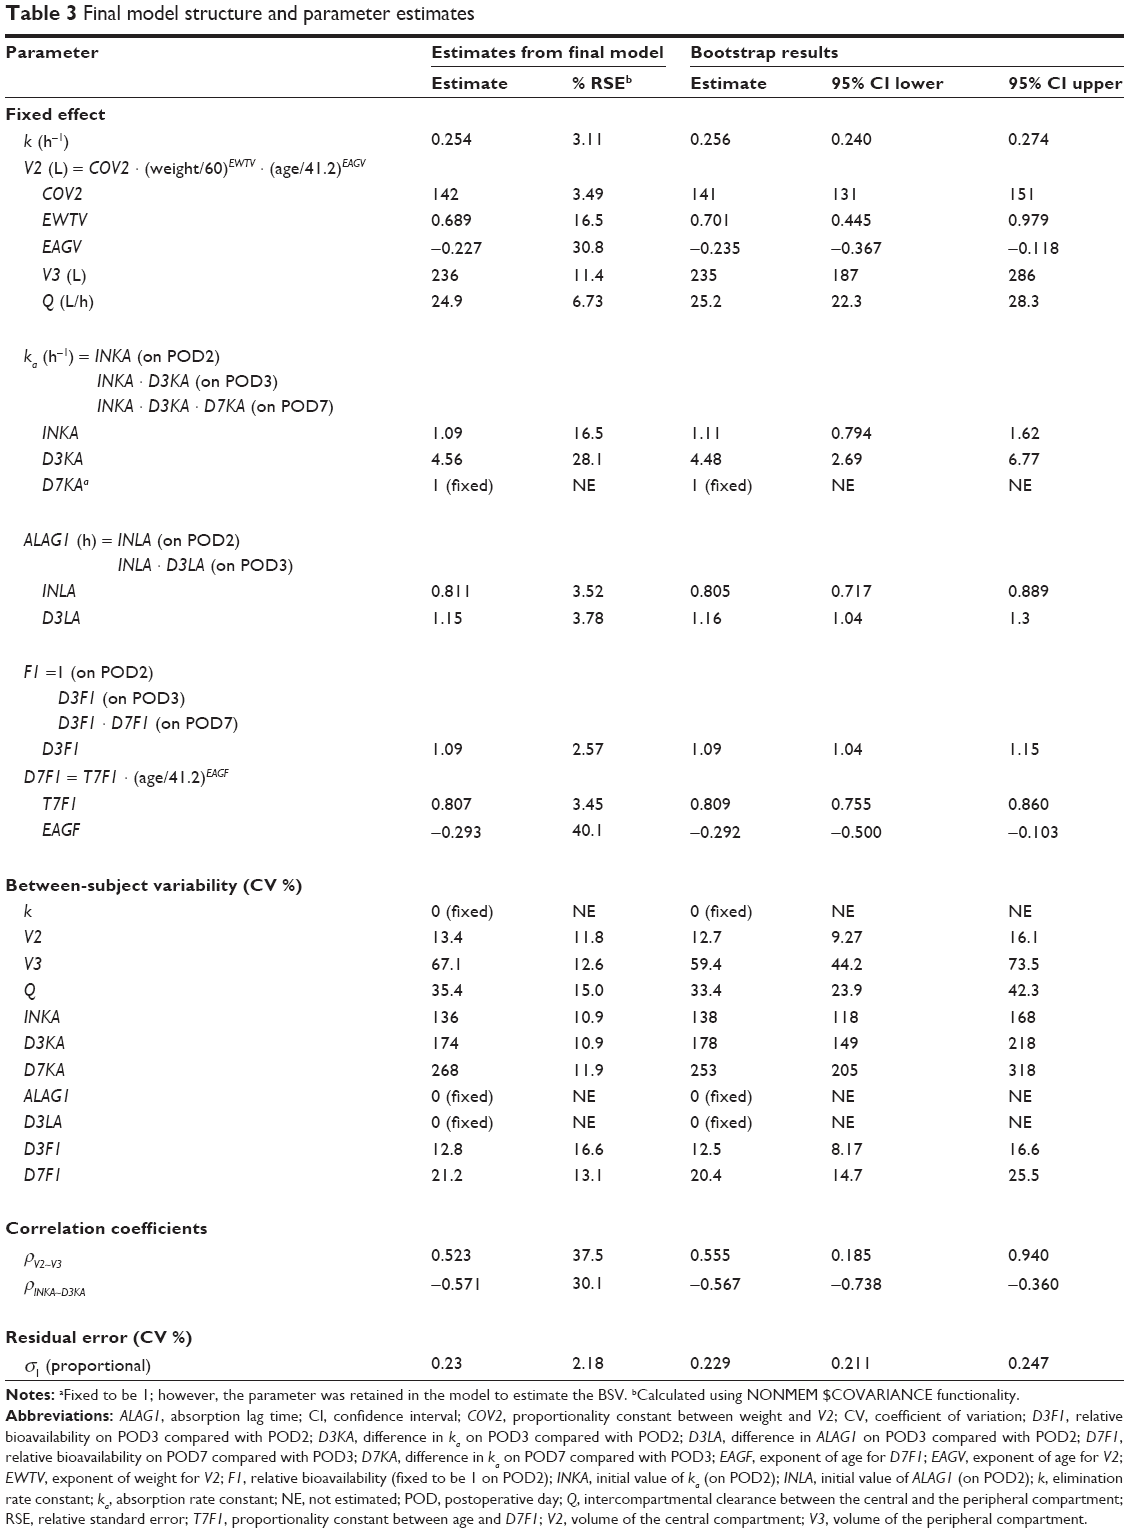 | Table 3 Final model structure and parameter estimates |
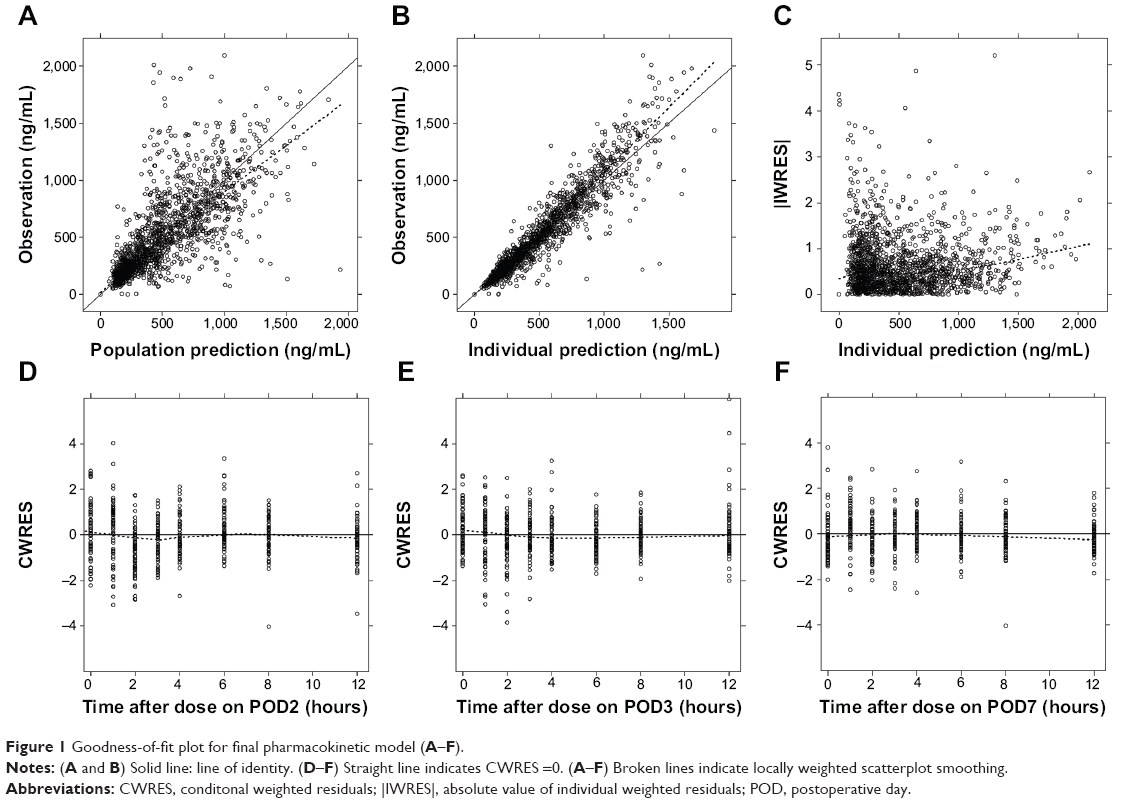 | Figure 1 Goodness-of-fit plot for final pharmacokinetic model (A–F). |
Absorption parameters such as ka, ALAG1, and F1 showed significant changes in the first 7 days after transplantation. The change in ka between POD2 and POD3 (D3KA) was 4.56, meaning that the ka increased 4.56 times from POD2 to POD3. The population estimate (median) of ka on POD7 was the same as that on POD3 (D7KA =1); however, the ka of each subject seemed to change significantly because the BSV of D7KA significantly improved the model. Therefore, we conducted a post hoc analysis of the estimated D7KA and found that subjects with the wild-type MDR1 genotype showed a pattern of decreasing ka, whereas subjects with the mutant allele showed a significant increase (P=0.002, t-test) for the post hoc D7KA estimate. However, the MDR1 genotype was not included in the final model because the inclusion of the genotype as a covariate produced a significant inflation of standard errors for the related parameter estimates. The ALAG1 increased 1.15 times from POD2 to POD3. The F1 increased 1.09 times from POD2 to POD3, and then decreased from POD3 to POD7. The change in F1 between POD3 and POD7 (D7F1) correlated negatively with patient age. BSVs for k, ALAG1, and the change in lag time between POD2 and POD3 (D3LA) were not estimable.
V2 correlated positively with body weight and negatively with age, and no significant covariates were found for V3. However, a correlation was found between the volume parameters, and the covariance between the parameters was estimated. The relationships between the parameters and the key covariates are shown in Figure 2.
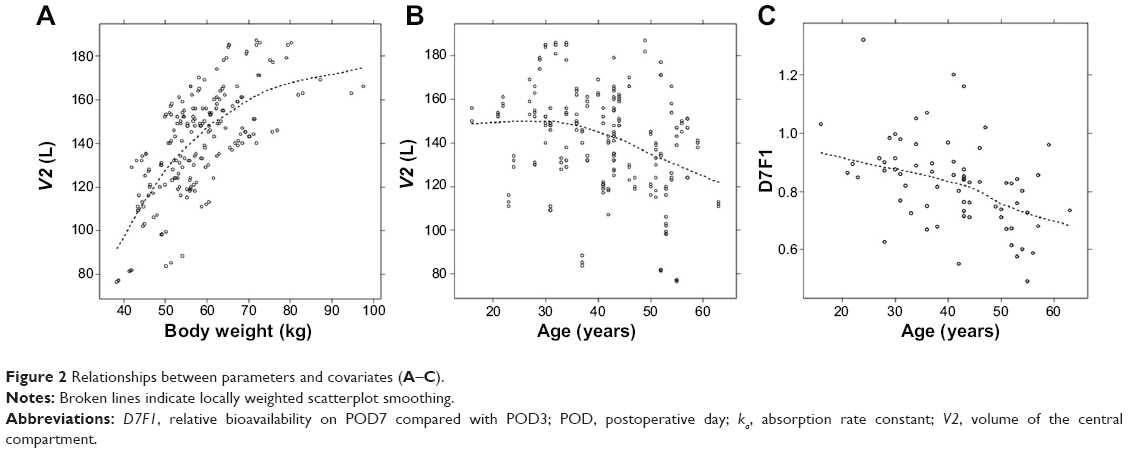 | Figure 2 Relationships between parameters and covariates (A–C). |
Model evaluation
The bootstrap results are presented in Table 3. All the parameter estimates were obtained appropriately and showed adequate reliability in bootstrapping. The prediction interval calculated from the visual predictive check is shown in Figure 3.
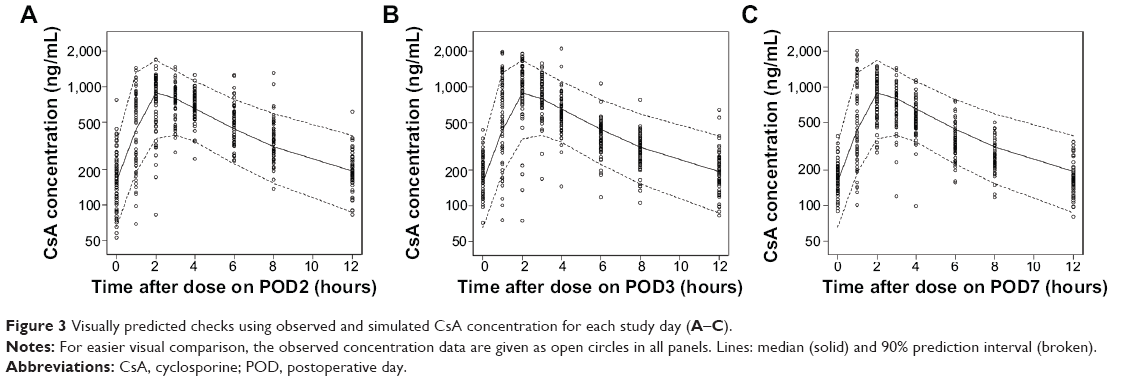 | Figure 3 Visually predicted checks using observed and simulated CsA concentration for each study day (A–C). |
Concentration–time correlations with AUC0–12
The relationships between the concentration at each sampling time and AUC0–12 are shown in Table 4. C8 seemed to be the best predictor of AUC0–12 on POD2 (r=0.701, P<0.0001) and was the best predictor at POD3 (r=0.716, P<0.0001). On POD7, the best predictor time changed to C3 (r=0.754, P<0.0001). We observed a difference between the MDR1 wild type and MDR1 mutant in terms of the change in the best predictor time between POD2 and POD7. On POD2, C8 was the best predictor in both groups. After this, in patients with wild-type MDR1, C6 was the best predictor on POD3 and C4 on POD7. However, in patients with mutant MDR1, the best predictor remained C8 on POD3, and became C2 on POD7.
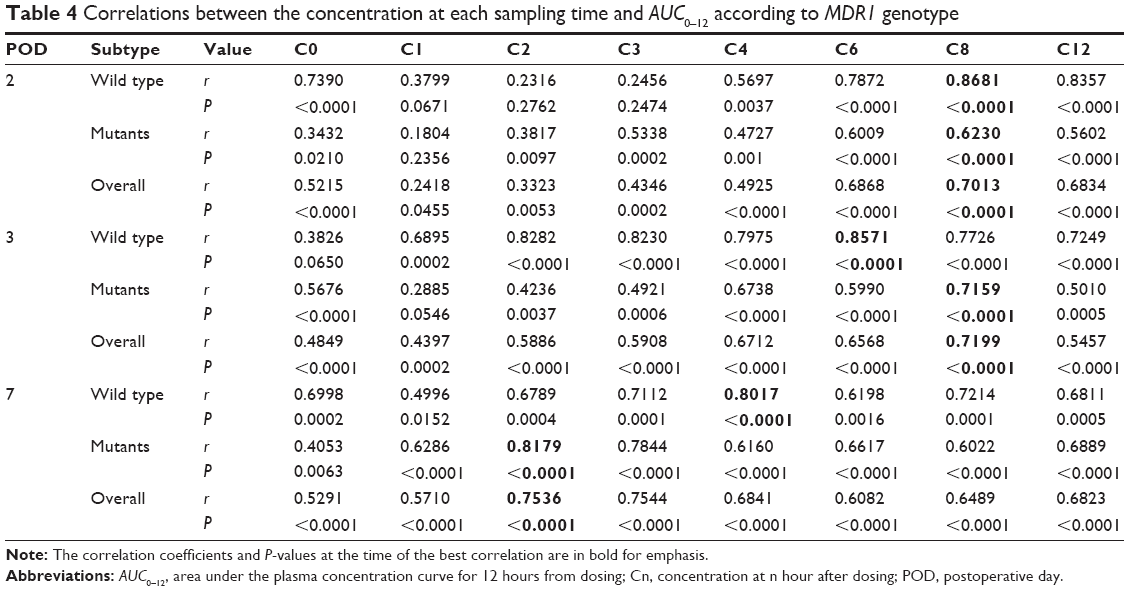 | Table 4 Correlations between the concentration at each sampling time and AUC0–12 according to MDR1 genotype |
Discussion
In this study, the PK parameters of CsA during the early period after kidney transplantation were estimated successfully using a population approach with NONMEM. In the final model, the absorption parameters, including ka, ALAG1, and F1, were affected by the time since transplantation. The estimates for distributional volumetric parameters in this study were larger than those in studies conducted in the late posttransplantation period.8,9 This may be the result of fluid therapy or an edematous state immediately after surgery.
We focused on the changes in absorption parameters during the 7 days after kidney transplantation and found that the most influential parameter affecting the drug concentration during the first week was the ka, which increased 4.56 times on POD3 compared with the estimate on POD2. This is likely to reflect recovery from gastrointestinal dysfunction related to the effects of anesthesia, postoperative hemodynamic instability, and use of opiate analgesia.10
Most previous studies that investigated the effect of genetic polymorphisms on the PK of CsA were conducted in stable transplant recipients receiving maintenance therapy, and many of these showed negative results.11–15 However, several recent studies demonstrated that there can be a notable effect of genotype of genes including MDR1, CYP3A4, or CYP3A5 in the early period after transplantation.16,17 Foote et al reported that the AUC0–4/mg/kg dose CsA was significantly higher on POD3 in MDR1 3435 CC (wild-type) patients than in MDR1 3435 CT and TT (mutant allele) carriers,18 and demonstrated an inverse correlation between the number of T alleles and AUC values such that every T allele was significantly associated with an ~15% decrease in AUC0–4/mg dose/kg on POD3. Similar results were found in the present study. Even though it was not statistically significant, the ka increase between POD2 and POD3 tended to be larger in the patients with wild-type MDR1 than in the mutant allele carriers. In addition, we observed that the increase in ka after POD3 was significantly higher (P=0.002) in the mutant allele carriers than in those with the wild type, as mentioned previously. However, this tendency is not as clear as the change in CsA PK according to the POD and may be an occasional outcome because of the small number of subjects studied. Thus, a definite conclusion on the genetic difference of the PK of CsA cannot be made from our study.
The population estimate for bioavailability increased on POD3 and decreased on POD7. This pattern is not explained well by improvement in gastrointestinal function alone. One possible explanation is the improvement in hepatic function. Nolin19 showed that both hepatic and renal drug clearance decrease in end-stage renal disease patients. A decrease in hepatic drug clearance causes poor elimination or increased bioavailability of a drug and ultimately an increase in drug concentration. After transplantation, hepatic function is expected to improve gradually as renal function recovers, which causes an increase in the first-pass effect. Because CsA is a drug that is extracted efficiently by the liver (high-extraction drug), the improvement of hepatic function may result in decreased bioavailability rather than increased clearance. We also found that, as patient age increased, the decrease in bioavailability on POD7 (D7F1) was greater (Figure 2). The exact mechanism responsible for this phenomenon is unknown.
In the correlational analysis, the single time point concentration that correlated best with AUC0–12 shifted from C8 on POD2 to C3 on POD7. The increase in ka together with bioavailability explains this phenomenon. Generally, an increase in ka causes the elevation of drug concentration immediately after drug administration, whereas the concentration in the elimination phase is relatively unchanged. In this manner, the concentration affects the AUC0–12 more at early time points than at later points. There was a difference between MDR1 wild-type and mutant allele carriers in the progress of the shortening of the best predictor time between POD3 and POD7. This could be explained by the abovementioned difference between groups in the change in ka. Because the ka value increased more in the wild-type group between POD2 and POD3 (nonsignificant), the best correlation time on POD3 moved to C6 in the wild-type group but to C8 in the mutant allele carrier group. Between POD3 and POD7, the ka value increased significantly more in the mutant allele carrier group than in the wild-type group. Therefore, the best correlation time changed from C6 to C4 in the wild-type group but from C8 to C2 in the mutant allele carrier group. Although these results were obtained in a small number of subjects and could be occasional as mentioned above, they consistently suggest that drug monitoring of CsA using C0 or C2 might be inadequate in the first postoperative week regardless of the genotype.
Most related studies have investigated the PK parameters of the CsA microemulsion Neoral (Novartis International AG, Basel, Switzerland).9,12–14,18 However, we administered a generic formulation of CsA microemulsion, Cipol-N® soft capsule (Chong Kun Dang). Use of a different CsA formulation could be considered to have affected the PK parameters. One study that investigated the PK of Neoral in eight heart transplant recipients during the first 5 days after surgery showed a substantial change in Neoral absorption between POD1 and POD5.10 We therefore presume that Neoral has similar characteristics to Cipol-N during the non-steady state of CsA PK. However, identifying the population PK of Neoral in the early posttransplantation period is necessary to confirm our expectations.
Conclusion
This study demonstrates a significant increase in the CsA ka and bioavailability between POD2 and POD3 after kidney transplantation. MDR1 C3435T genotype showed potential as a covariate that explains the difference in absorption PK in the immediate posttransplantation period. These findings suggest that oral administration of CsA and dose adjustment based on a single timed measurement of the drug concentration during the early kidney transplant period might result in an increase in drug exposure. To circumvent this risk, intravenous administration of CsA during the early posttransplantation period, especially from POD1 to POD3, is recommended. There is a report that intravenous administration could predispose patients to developing CsA-related neurotoxicity. Therefore, careful observation of patients and strict adherence to therapeutic drug monitoring are important during intravenous administration of CsA.20
Disclosure
The authors report no conflicts of interest in this work.
References
Utecht KN, Hiles JJ, Kolesar J. Effects of genetic polymorphisms on the pharmacokinetics of calcineurin inhibitors. Am J Health Syst Pharm. 2006;63(23):2340–2348. | ||
Dunn CJ, Wagstaff AJ, Perry CM, Plosker GL, Goa KL. Cyclosporin: an updated review of the pharmacokinetic properties, clinical efficacy and tolerability of a microemulsion-based formulation (neoral)1 in organ transplantation. Drugs. 2001;61(13):1957–2016. | ||
International Neoral Renal Transplantation Study Group. Cyclosporine microemulsion (Neoral) absorption profiling and sparse-sample predictors during the first 3 months after renal transplantation. Am J Transplant. 2002;2(2):148–156. | ||
Mahalati K, Belitsky P, Sketris I, West K, Panek R. Neoral monitoring by simplified sparse sampling area under the concentration-time curve: its relationship to acute rejection and cyclosporine nephrotoxicity early after kidney transplantation. Transplantation. 1999;68(1):55–62. | ||
Canadian Neoral Renal Transplantation Study Group. Absorption profiling of cyclosporine microemulsion (neoral) during the first 2 weeks after renal transplantation. Transplantation. 2001;72(6):1024–1032. | ||
Clase CM, Mahalati K, Kiberd BA, et al. Adequate early cyclosporin exposure is critical to prevent renal allograft rejection: patients monitored by absorption profiling. Am J Transplant. 2002;2(8):789–795. | ||
Staatz CE, Goodman LK, Tett SE. Effect of CYP3A and ABCB1 single nucleotide polymorphisms on the pharmacokinetics and pharmacodynamics of calcineurin inhibitors: part I. Clin Pharmacokinet. 2010;49(3): 141–175. | ||
Wu KH, Cui YM, Guo JF, et al. Population pharmacokinetics of cyclosporine in clinical renal transplant patients. Drug Metab Dispos. 2005;33(9):1268–1275. | ||
Tokui K, Kimata T, Uchida K, et al. Dose adjustment strategy for oral microemulsion formulation of cyclosporine: population pharmacokinetics-based analysis in kidney transplant patients. Ther Drug Monit. 2004;26(3):287–294. | ||
Banner NR, David OJ, Leaver N, et al. Pharmacokinetics of oral cyclosporine (Neoral) in heart transplant recipients during the immediate period after surgery. Transpl Int. 2002;15(12):649–654. | ||
Anglicheau D, Thervet E, Etienne I, et al. CYP3A5 and MDR1 genetic polymorphisms and cyclosporine pharmacokinetics after renal transplantation. Clin Pharmacol Ther. 2004;75(5):422–433. | ||
Hesselink DA, van Gelder T, van Schaik RH, et al. Population pharmacokinetics of cyclosporine in kidney and heart transplant recipients and the influence of ethnicity and genetic polymorphisms in the MDR-1, CYP3A4, and CYP3A5 genes. Clin Pharmacol Ther. 2004;76(6): 545–556. | ||
Hesselink DA, van Schaik RH, van der Heiden IP, et al. Genetic polymorphisms of the CYP3A4, CYP3A5, and MDR-1 genes and pharmacokinetics of the calcineurin inhibitors cyclosporine and tacrolimus. Clin Pharmacol Ther. 2003;74(3):245–254. | ||
Yates CR, Zhang W, Song P, et al. The effect of CYP3A5 and MDR1 polymorphic expression on cyclosporine oral disposition in renal transplant patients. J Clin Pharmacol. 2003;43(6):555–564. | ||
Haufroid V, Mourad M, Van Kerckhove V, et al. The effect of CYP3A5 and MDR1 (ABCB1) polymorphisms on cyclosporine and tacrolimus dose requirements and trough blood levels in stable renal transplant patients. Pharmacogenetics. 2004;14(3):147–154. | ||
Azarpira N, Aghdaie MH, Behzad-Behbahanie A, et al. Association between cyclosporine concentration and genetic polymorphisms of CYP3A5 and MDR1 during the early stage after renal transplantation. Exp Clin Transplant. 2006;4(1):416–419. | ||
Hu YF, Qiu W, Liu ZQ, et al. Effects of genetic polymorphisms of CYP3A4, CYP3A5 and MDR1 on cyclosporine pharmacokinetics after renal transplantation. Clin Exp Pharmacol Physiol. 2006;33(11): 1093–1098. | ||
Foote CJ, Greer W, Kiberd BA, et al. MDR1 C3435T polymorphisms correlate with cyclosporine levels in de novo renal recipients. Transplant Proc. 2006;38(9):2847–2849. | ||
Nolin TD. Altered nonrenal drug clearance in ESRD. Curr Opin Nephrol Hypertens. 2008;17(6):555–559. | ||
Bechstein WO. Neurotoxicity of calcineurin inhibitors: impact and clinical management. Transpl Int. 2000;13(5):313–326. |
 © 2014 The Author(s). This work is published and licensed by Dove Medical Press Limited. The full terms of this license are available at https://www.dovepress.com/terms.php and incorporate the Creative Commons Attribution - Non Commercial (unported, v3.0) License.
By accessing the work you hereby accept the Terms. Non-commercial uses of the work are permitted without any further permission from Dove Medical Press Limited, provided the work is properly attributed. For permission for commercial use of this work, please see paragraphs 4.2 and 5 of our Terms.
© 2014 The Author(s). This work is published and licensed by Dove Medical Press Limited. The full terms of this license are available at https://www.dovepress.com/terms.php and incorporate the Creative Commons Attribution - Non Commercial (unported, v3.0) License.
By accessing the work you hereby accept the Terms. Non-commercial uses of the work are permitted without any further permission from Dove Medical Press Limited, provided the work is properly attributed. For permission for commercial use of this work, please see paragraphs 4.2 and 5 of our Terms.