")
Back to Journals » Cancer Management and Research » Volume 10
Early diagnostic potential of APC hypermethylation in esophageal cancer
Authors Wang B, Song H , Jiang H , Fu Y, Ding X, Zhou C
Received 9 August 2017
Accepted for publication 27 November 2017
Published 1 February 2018 Volume 2018:10 Pages 181—198
DOI https://doi.org/10.2147/CMAR.S148677
Checked for plagiarism Yes
Review by Single anonymous peer review
Peer reviewer comments 2
Editor who approved publication: Professor Lu-Zhe Sun
Bujiang Wang,1 Haojun Song,1 Haizhong Jiang,1 Yangbo Fu,1 Xiaoyun Ding,1 Chongchang Zhou2
1Department of Gastroenterology, Laboratory of Digestive Diseases, Ningbo First Hospital, Ningbo, 2Department of Otorhinolaryngology Head and Neck Surgery, Lihuili Hospital of Ningbo University, Ningbo, Zhejiang, People’s Republic of China
Background: The hypermethylation of APC gene is observed in various cancers, including esophageal cancer (EC). However, the association between APC methylation and the initiation and progression of EC is poorly understood.
Purpose and methods: The current study systematically reviewed studies on abnormal methylation of APC in EC and quantitatively synthesized 18 studies by meta-analysis involving 1008 ECs, 570 Barrett’s esophagus (BE), and 782 controls.
Results: Our results showed higher methylation of APC in EC (OR = 23.33, P < 0.001) and BE (OR = 9.34, P < 0.001) than in normal controls. Whereas APC methylation in EC was similar to that in BE (P = 0.052), it was not associated with tumor stage (P = 0.204). Additionally, APC methylation was not significantly associated with overall survival (OS) and relapse-free survival (RFS) in patients with EC. The performance of APC methylation for the detection of EC and BE achieved areas under the receiver operating characteristic curves of 0.94 and 0.88, respectively.
Conclusion: Our results imply that APC methylation detection is a potential diagnostic biomarker for EC and BE.
Keywords: esophageal cancer, Barrett’s esophagus, methylation, APC
Introduction
Cancer poses a major public health burden after cardiovascular diseases, as its global incidence and mortality continue to increase.1 Esophageal cancer (EC) is the leading cause of cancer death; about 16,940 new cases and 15,690 deaths were estimated in the 2017 US statistics.2 Due to a lack of specific symptoms and preventive measures, many EC patients are diagnosed at an advanced stage. Multimodality therapy, consisting of surgery combined with chemotherapy, is the standard treatment for resectable advanced EC.3 In spite of improvements in surgery and chemotherapy, the prognosis for EC patients presenting with advanced stage disease is poor, with the most recent statistics showing 5-year survival rates <50%.4 EC arises from Barrett’s esophagus (BE), which is metaplastic change of the normal squamous mucosa to specialized columnar epithelium. BE ultimately progresses to dysplasia (low-grade dysplasia to high-grade dysplasia) and subsequently to EC. Therefore, early diagnosis of EC and proper endoscopic therapies for BE are key strategies for improving the survival of EC patients.
The etiology of EC is multifactorial, including interactions between various environmental, epigenetic, and genetic changes involved in inflammation.5 The relevant environmental factors have been elucidated by several large-scale and well-designed epidemiological studies and include obesity, Helicobacter pylori infection, and tobacco smoking.6–8 Genetic changes such as single-nucleotide polymorphisms involved in multiple cellular pathways may be biomarkers of EC risk.9,10 Recent studies have identified the important role of DNA methylation in esophageal carcinogenesis.11 DNA methylation is one of the important epigenetic modifications involved in the inactivation of numerous tumor suppressor genes (TSGs).12 It is well established that hypermethylation of multiple TSGs in association with the dysfunction of cellular biological pathways characterize human cancers. Additionally, DNA methylation biomarkers are of clinical value for early cancer diagnosis.
Adenomatous polyposis coli (APC) is a classical TSG located on chromosomal band 5q21-q22.13 APC was initially uncovered through genetic linkage analysis in colorectal cancer (CRC).13,14 APC protein serves as a negative regulator of the Wnt/beta-catenin pathway.15 Loss of APC expression leads to the stabilization and nuclear accumulation of beta-catenin that could result in the activation of downstream target genes involved in the initiation of tumorigenesis.16,17 In the past decades, the downregulation of APC through promoter hypermethylation has frequently been observed in many cancers, including EC.18–21 However, the diagnostic strength and association of APC methylation with EC progression has been less consistent. The present study aimed at summarizing recent studies on aberrant methylation of APC in EC progression.
Materials and methods
Identification of relevant studies
All relevant studies were systematically searched from PubMed, Google Scholar, Web of Science, China National Knowledge Infrastructure, and Wanfang literature databases and updated until June 11, 2017. The search strategies for potential studies applied different combinations of the following terms: adenomatous polyposis coli, APC, methylation, esophagus cancer, and esophagus carcinomas.
In addition, a manual search was performed to seek potential studies in the references of retrieved publications. All eligible studies had to have measured APC methylation status in EC patients rather than cancer cell lines. Neither reviews nor abstracts were included in our analysis. Studies without detailed information on APC methylation were excluded.
Data extraction
For the eligible studies, we extracted the first author’s name, year of publication, country of study subjects, methylation assessment methods, and frequency of gene methylation (Table S1). In addition, DNA methylation data of APC in EC were obtained from The Cancer Genome Atlas (TCGA) online database (https://cancergenome.nih.gov/). The methylation status of 186 ECs was analyzed using the human methylation 450K array (HM450). More than 450,000 CpG sites in the human genome were included in the HM450 platform. A total of 20 CpG sites (cg08636638, cg19115695, cg27062904, cg07661636, cg00190738, cg16110711, cg16451027, cg27379240, cg11057897, cg07003745, cg04011030, cg16481008, cg18315896, cg01528425, cg08934600, cg18536802, cg26660754, cg08512345, cg25922032, and cg04226363) in the promoter region of APC were included (Figure S1). We also downloaded clinical stage, gender, age, overall survival (OS), and relapse-free survival (RFS) data of the EC patients (Table S1).
Statistical analysis
The Stata-12.0 software (StataCorp LP, College Station, TX, USA) was used to calculate the pooled odds ratios (ORs) and the corresponding 95% confidence intervals (CIs). The heterogeneity across studies was represented as the I2 statistic with corresponding P-value.22 When there was remarkable heterogeneity (I2>50%, c2 test with P<0.05) in the meta-analysis, a Dersimonian–Laird (D + L) model was applied to calculate the pooled OR; otherwise, a Mantel–Haenszel (M–H) model was used.23 Besides, the potential source of heterogeneity was identified by meta-regression. For the pooled ORs of studies with unknown heterogeneity source, sensitivity analysis was applied to assess the robustness of the results. The sensitivity analysis estimated the stability of results by excluding single study to estimate the effect of the individual study on the overall pooled OR. Publication bias was estimated by Begg’s and Egger’s linear regression tests. Diagnostic meta-analyses were also performed. The pooled sensitivity, specificity, positive likelihood ratio (PLR), negative likelihood ratio (NLR), diagnostic OR (DOR), and their corresponding 95% CIs were calculated. Summary receiver operating characteristic (SROC) curves with the areas under the receiver operating characteristic curve (AUC) were then generated. Additionally, the failsafe number (Nfs) test was performed using the R software (version 3.3.0) to identify the robustness of our results when significant publication bias among the studies was observed. Cox regression models were used to calculate the adjusted hazard ratios to estimate the relationship between OS and RFS with other covariates (APC methylation level, clinical stage, age, and gender). The survival analysis was performed by SPSS. All P-values are two-sided, and a P-value of <0.05 was deemed statistically significant.
Results
Study characteristics
In order to analyze the relationship between APC methylation and EC progression, we quantitatively synthesized 18 studies including 1008 ECs, 570 BEs, and 782 controls.18,19,24–39 A total of 260 studies were identified using the search strategy described earlier, and 204 studies were excluded after careful filtration, of which 38 were duplicates, 21 were without methylation data, 55 were abstracts or reviews, and 94 were irrelevant. Finally, 18 studies (17 published in English and in Chinese) were included in the meta-analysis. The basic characteristics of all the included studies are shown in Table 1, and the selection process is illustrated in Figure 1.
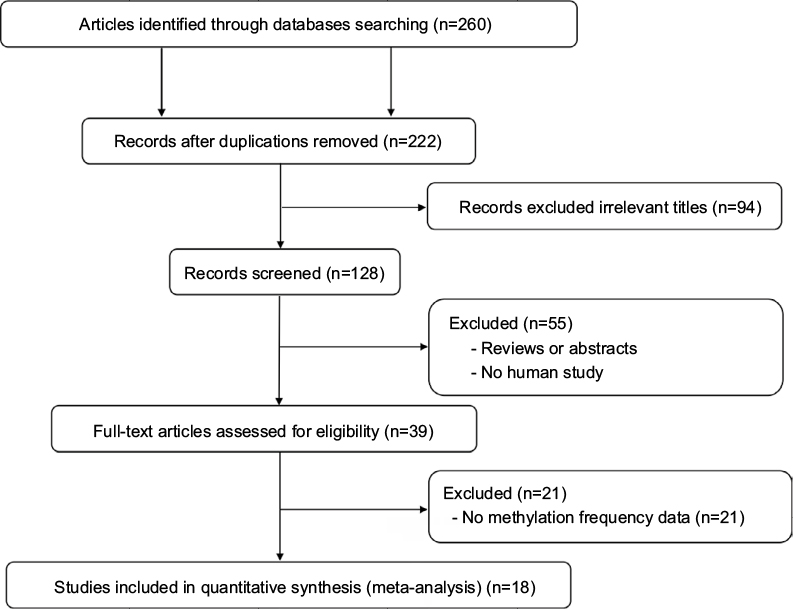 | Figure 1 Flow diagram of the search strategy for this meta-analysis. |
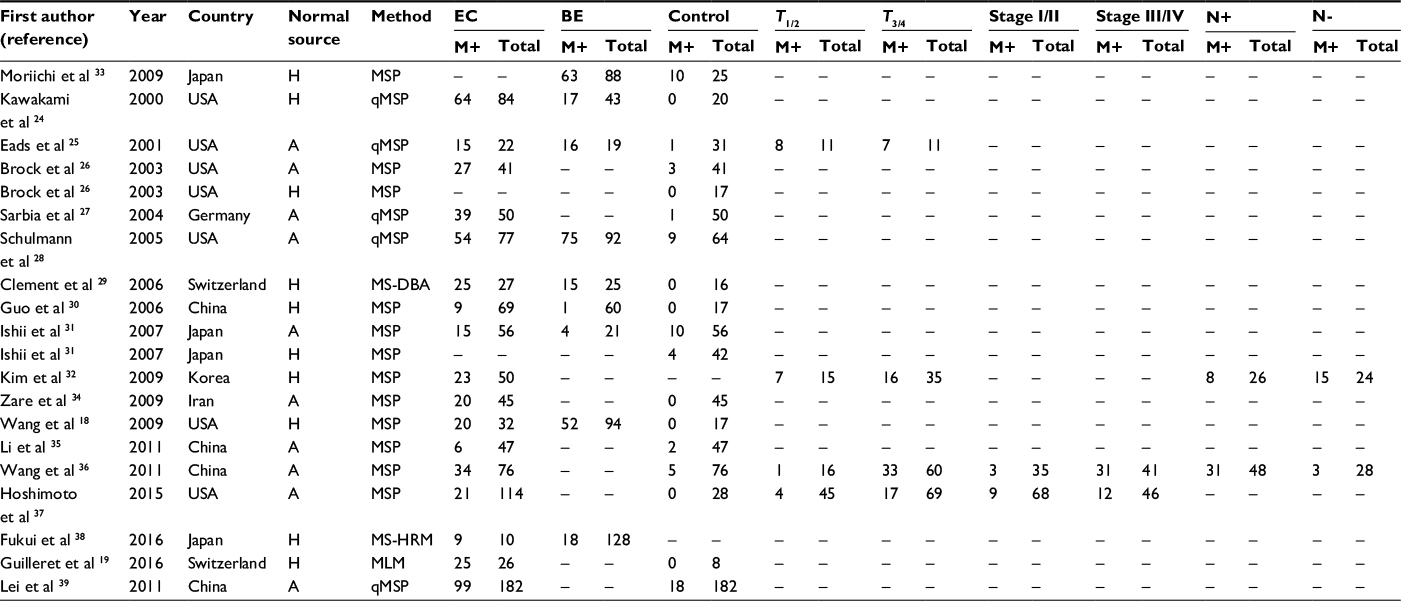 | Table 1 Main characteristics of studies included in the current analyses Notes: A, autologous (control sample from the same patients); H, heterogeneous (control samples from other individuals); M+, positive for APC methylation; N+, positive for lymph node metastasis; N-, negative for lymph node metastasis. Abbreviations: BE, Barrett’s esophagus; EC, esophageal cancer; MLM, methylation ligation-dependent macroarray; MSP, methylation-specific polymerase chain reaction; MD-DBA, methylation-sensitive dot-blot assay; MS-HRM, methylation-sensitive high-resolution melting; qMSP, quantitative methylation-specific polymerase chain reaction. |
Association of APC methylation with EC progression
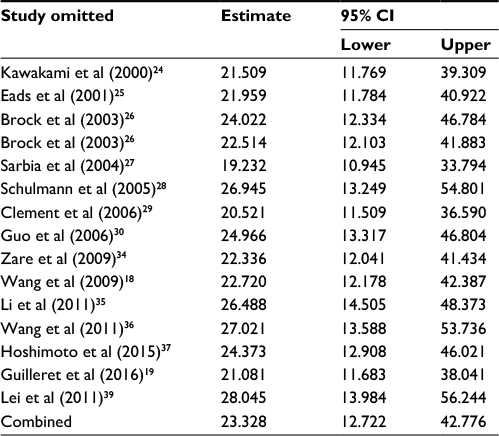
First, we performed a meta-analysis of 17 studies including 948 EC patients and 757 normal controls to ascertain if there were any APC methylation differences between the two groups. Considering the presence of significant heterogeneity across the studies (I2=68.3%, P<0.01, Table 2), a meta-regression was performed to assess the potential resource of heterogeneity. The results showed that the two studies from Japan might be responsible for the significant heterogeneity. Other parameters such as year of publication, methylation detection method, and normal controls contributed little to the heterogeneity (Table 3). Therefore, we compared the pooled ORs as well as the heterogeneity value before and after removal of these two studies. Our results showed a significant decrease in heterogeneity with exclusion of the two studies (I2=45.1%, P=0.03, Table 2). The pooled ORs therefore showed that APC methylation was associated with an increased risk of EC (OR = 23.33; range, 12.72-42.78; Table 2; Figure S2). The Begg’s test showed an absence of publication bias (P=0.175; Figure 2A), whereas the Egger’s test implied the presence of publication bias (P<0.001; Figure 2B). Therefore, we applied the Nfs test and sensitivity analysis to assess the efficacy of the meta-analysis. Both the Nfs test (Nfs0.05=1127 and Nfs0.01=878) and sensitivity analysis supported the robustness of our results (Table 4).
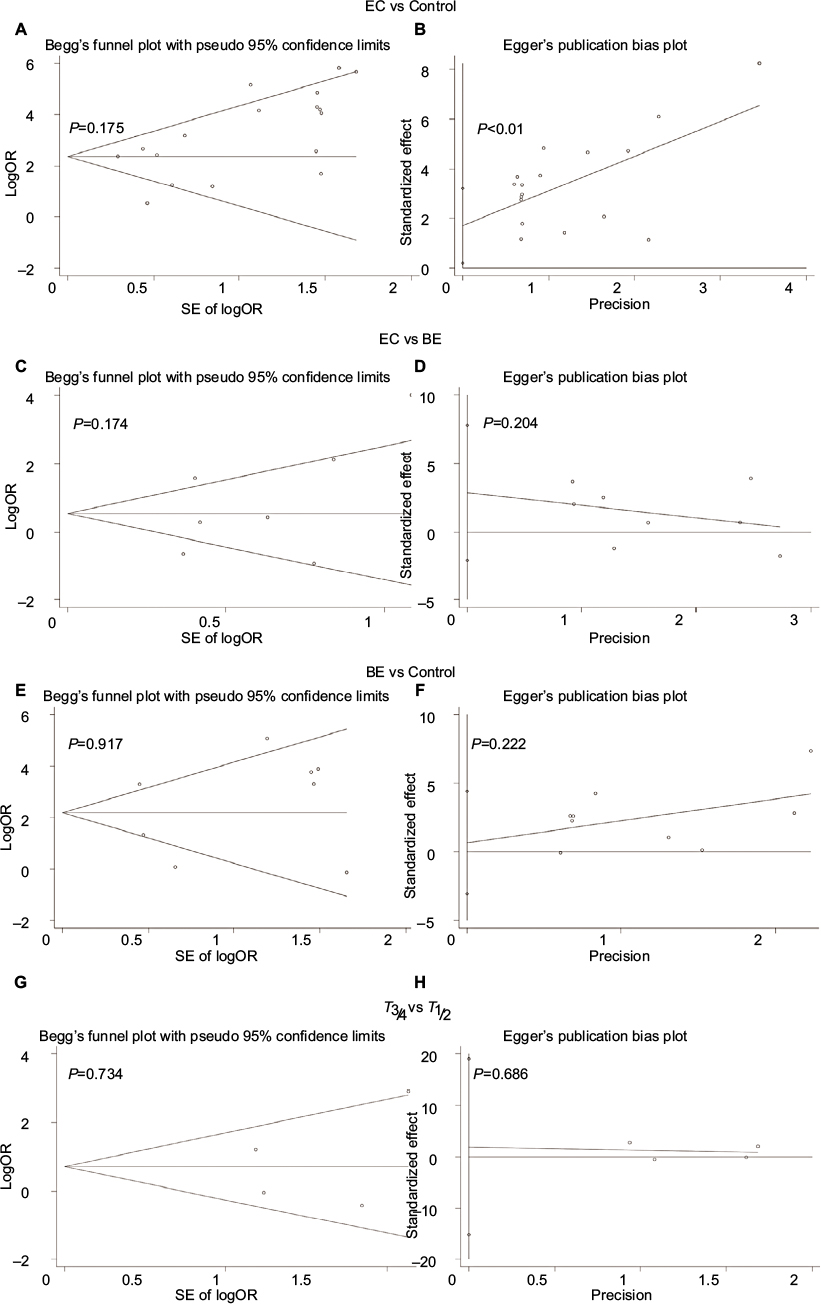 | Figure 2 Begg’s funnel and Egger’s plots of publication bias for APC methylation during esophageal carcinogenesis. Notes: (A and B) Cancer vs controls. (C and D) Cancer vs BE. (E and F) BE lesions vs control. (G and H) T3/4 vs T1/2. Abbreviations: BE, Barrett’s esophagus; EC, esophageal cancer; OR, odds ratio; SE, standard error. |
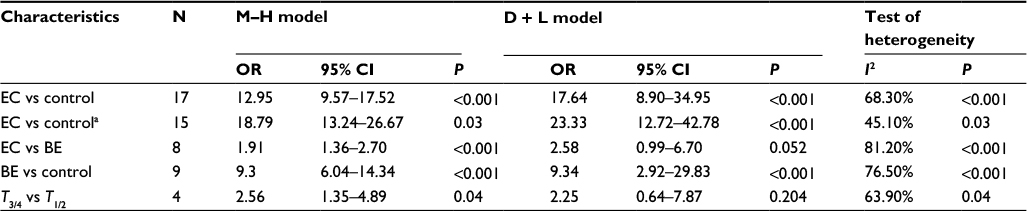 | Table 2 Summary of pooled OR of APC methylation during the carcinogenesis of EC Note: aThe pooled OR of APC methylation was computed after removal of two studies from Japan, which might be responsible for the significant heterogeneity in EC vs control. Abbreviations: BE, Barrett’s esophagus; CI, confidence interval; EC, esophageal cancer; OR, odds ratio. |
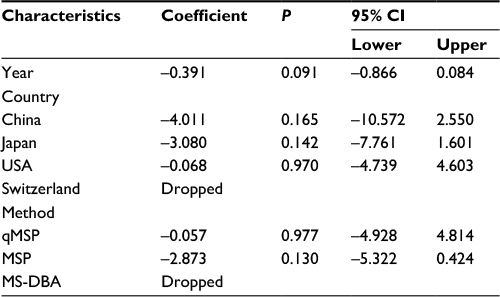
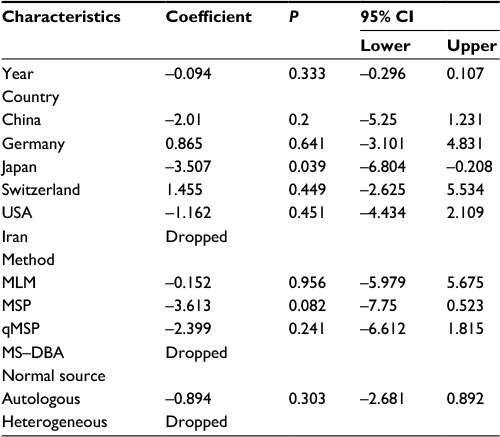 | Table 3 Meta-regression analysis of APC promoter methylation in EC vs control Abbreviations: CI, confidence interval; EC, esophageal cancer; MLM, methylation ligation-dependent macroarray; MSP, methylation-specific polymerase chain reaction; qMSP, quantitative methylation-specific polymerase chain reaction; MD-DBA, methylation-sensitive dot-blot assay; MS-HRM, methylation-sensitive high-resolution melting. |
 | Table 4 Sensitivity analysis of APC methylation in EC vs control Abbreviations: CI, confidence interval; EC, esophageal cancer. |
Second, a meta-analysis was performed on eight studies involving 377 EC and 482 BE patients. The difference in APC methylation level between the two groups was slight with no statistical significance (OR = 2.58; range, 0.99–6.70; Table 2; Figure S2). The D + L model was used to compute OR because of the presence of significant heterogeneity (I2=81.2%, P<0.001, Table 2). However, meta-regression failed to identify any potential resource of heterogeneity (Table 5). The Begg’s and Egger’s tests for publication bias were not statistically significant (P=0.174 and 0.204, respectively; Figure 2C and D).
 | Table 5 Meta-regression analysis of APC promoter methylation in EC vs BE Abbreviations: BE, Barrett’s esophagus; CI, confidence interval; EC, esophageal cancer; MLM, methylation ligation-dependent macroarray; MSP, methylation-specific polymerase chain reaction; qMSP, quantitative methylation-specific polymerase chain reaction; MD-DBA, methylation-sensitive dot-blot assay; MS-HRM, methylation-sensitive high-resolution melting. |
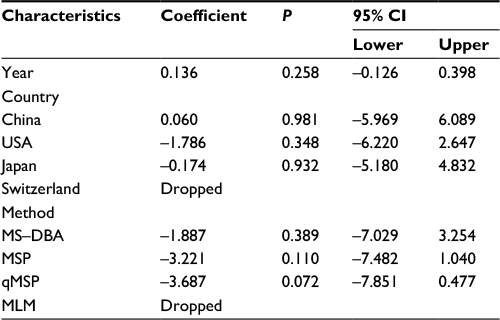
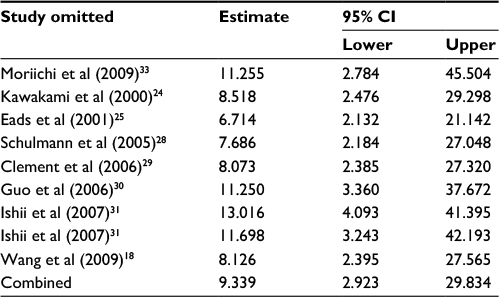
Third, the association between methylated APC and progression of BE was analyzed in nine studies, including 442 BEs and 288 controls. The pooled OR was computed by the D + L model, as significant heterogeneity was observed (I2=76.5%, P<0.001, Table 2). Our results demonstrated that methylation of APC was associated with an increased risk for developing BE (OR =9.34; range, 2.92–29.82). The pooled OR was not significantly transformed by the M–H model (Table 2), indicating that our results were robust. The sensitivity analysis also confirmed the stability and credibility of our results (Table 6). No potential source of heterogeneity was identified by meta-regression (Table 7). No publication bias was observed by Begg’s test (P=0.917; Figure 2E) and Egger’s test (P=0.222; Figure 2F).
 | Table 6 Sensitivity analysis of APC methylation in BE vs control Abbreviations: BE, Barrett’s esophagus; CI, confidence interval. |
 | Table 7 Meta-regression analysis of APC promoter methylation in BE vs control Abbreviations: BE, Barrett’s esophagus; CI, confidence interval; MSP, methylationspecific polymerase chain reaction; qMSP, quantitative methylation-specific polymerase chain reaction; MD-DBA, methylation-sensitive dot-blot assay; MS-HRM, methylation-sensitive high-resolution melting. |
Finally, in order to examine the association between APC methylation and the progression of EC, we quantitatively analyzed the association between APC methylation and tumor stage. A total of three studies including 76 patients classified as stage T1 or T2 and 164 patients classified as stage T3 or T4 were analyzed. Due to remarkable heterogeneity across the studies, a D + L model was applied and results showed no statistical significance (OR = 2.25; range, 0.64-7.87;Table 2; Figure S2). The results of Begg’s (P=0.734) and Egger’s (P=0.686) tests illustrated no publication bias among these three studies (Figure 2G and H).
The diagnostic accuracy of methylated APC for EC and BE
The diagnostic accuracy of methylated APC for EC was analyzed from 17 studies involving 948 EC patients and 757 controls. The summary specificity and sensitivity of methylated APC for distinguishing EC from controls were 0.96 (95% CI: 0.92–0.98) and 0.55 (95% CI: 0.39–0.69), respectively (Figure 3). The SROC based on the specificity and sensitivity is shown in Figure 3, and the AUC was 0.94 (95% CI: 0.91–0.95). The summary diagnostic OR was 30 (95% CI: 10–88). The PLR and NLR were 14.0 (95% CI: 5.9–32.8) and 0.47 (95% CI: 0.33–0.67), respectively. As indicated by the PLR, EC patients had a ~14 times higher chance of having methylated APC than normal controls. Also, as indicated by the NLR, normal controls had a twofold greater chance (the reciprocal of the value of NLR) of having unmethylated APC than EC patients. As shown in Figure 4, the Fagan plot analyses based on the PLR and NLR demonstrated that the probability of a patient being diagnosed with EC was, respectively, 82% and 93% following a positive methylated APC result, whereas the pretest probability of being diagnosed with EC was 25% and 50%, respectively. However, the probability of an exclusion diagnosis of EC was 14 and 32% following a negative methylated APC result. Besides, the Deek’s funnel plot test indicated no publication bias across the studies included in the diagnostic analysis (Figure 5).
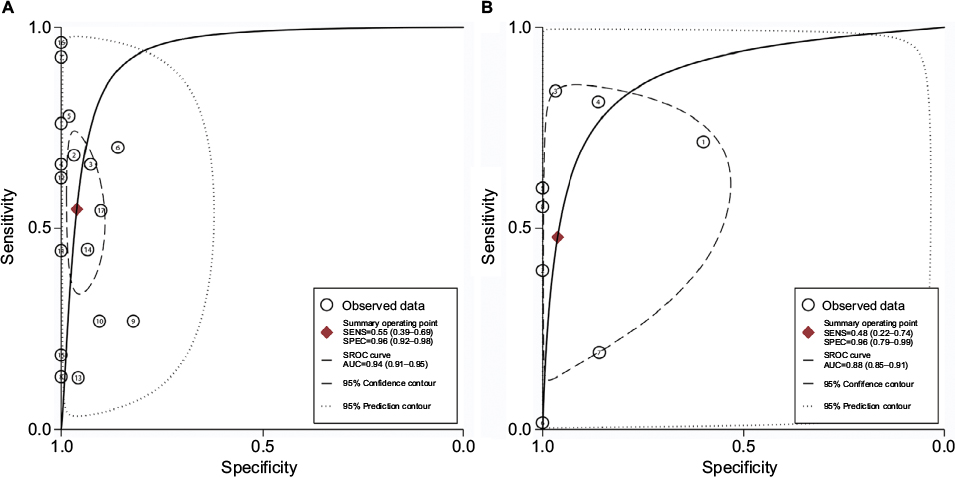 | Figure 3 SROC plots of methylated APC for the diagnosis of EC and BE. Notes: (A) Cancer vs control: specificity, 0.96 (95% CI: 0.92–0.98); sensitivity, 0.55 (95% CI: 0.39–0.69); AUC, 0.94 (95% CI: 0.91–0.95). (B) BE vs control: specificity, 0.96 (95% CI: 0.79–0.99); sensitivity, 0.48 (95% CI: 0.22–0.74); AUC, 0.88 (95% CI: 0.85–0.91). Abbreviations: AUC, area under the receiver operating characteristic curve; BE, Barrett’s esophagus; CI, confidence interval; EC, esophageal cancer; SROC, summary of receiver operating characteristic; SENS, sensitivity; SPEC, specificity. |
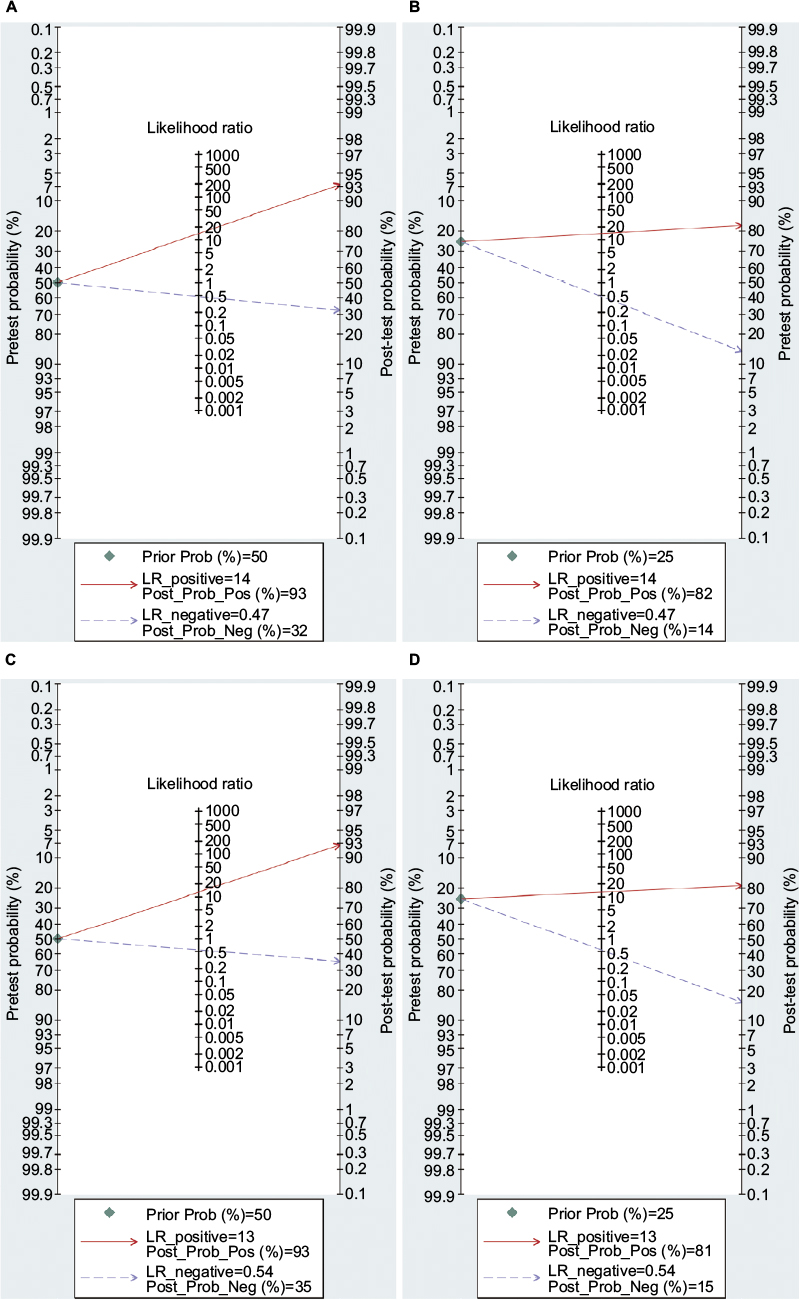 | Figure 4 Fagan plot analysis to evaluate the clinical applicability of screening for methylated APC in EC diagnosis. Notes: (A) The post-test probability of EC was 93% at a pretest probability of 50%. (B) The post-test probability of EC was 82% at a pretest probability of 25%. (C) The post-test probability of BE was 93% at a pretest probability of 50%. (D) The post-test probability of BE was 81% at a pretest probability of 25%. Abbreviations: BE, Barrett’s esophagus; EC, esophageal cancer; LR, likelihood ratio.
|
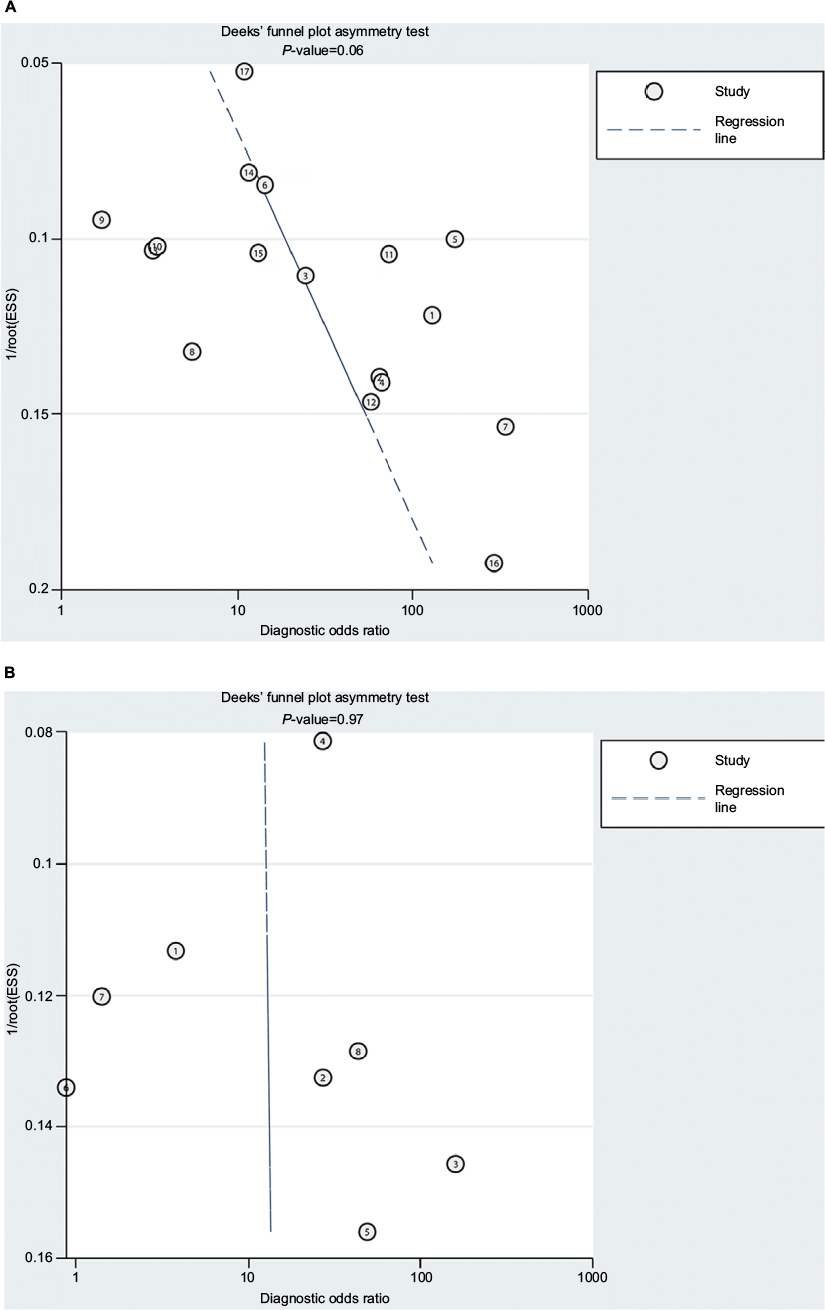 | Figure 5 Deek’s funnel plot test of publication bias across studies included in the diagnostic analysis. Notes: (A) Cancer vs control. (B) BE vs control. Abbreviations: BE, Barrett’s esophagus; ESS, effective sample size. |
The diagnostic accuracy of APC methylation for BE was analyzed in nine studies involving 442 BEs and 288 controls. The pooled specificity and sensitivity were 0.96 (95% CI: 0.79–0.99) and 0.48 (95% CI: 0.22–0.74), respectively (Figure 3). The area under the SROC was 0.88 (95% CI: 0.85–0.91). The summary diagnostic OR was 24 (95% CI: 3–163). The PLR and NLR were 12.8 (95% CI: 2.2–74.7) and 0.54 (95% CI: 0.32–0.93), respectively. As indicated by the PLR, BE patients had a ~13 times higher chance of having methylated APC than normal controls. Similarly, as indicated by the NLR, normal controls had a 1.9-fold greater chance (the reciprocal of the value of NLR) of having unmethylated APC than BE patients. The Fagan plot analyses based on the PLR and NLR demonstrated that the probability of a patient being diagnosed with BE was, respectively, 81 and 93% following a positive methylated APC result, whereas the pretest probability of being diagnosed with BE was 25% and 50%, respectively (Figure 4). However, the probability of an exclusion diagnosis of BE was 15% and 35%, following a negative methylated APC result. There was no publication bias observed by the Deek’s funnel plot test (Figure 5).
Association between methylation of APC and prognosis of EC
In the current study, we analyzed 11 different probes located in the promoter region of APC including the transcription start site (chr 5:112043265-112043265) and CpG island (chr 5:112043080-112043917). The association between APC methylation and RFS was analyzed using 144 EC patients from TCGA. Analysis of the relationship between APC methylation and OS was conducted using data from 186 patients. Cox proportional-hazards regression models were applied to adjust multiple variables to estimate the OS and RFS. As we speculated, no statistically significant difference was found between APC methylation and the examined clinical parameters (Table 8).
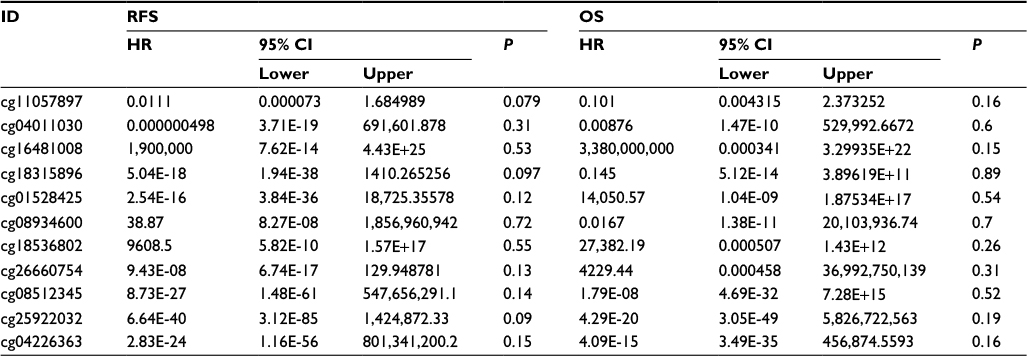 | Table 8 Survival analysis of 11 CpG island probes located in the promoter region of APC applying TCGA cohort Abbreviations: CI, confidence interval; HR, hazard ratio; OS, overall survival; RFS, relapse-free survival. |
Discussion
Esophageal carcinoma is thought to develop from BE following accumulation of genetic and epigenetic abnormalities leading to the activation of oncogenes and/or inactivation of TSGs.40–42 These aberrant genetic and epigenetic changes result in the failure to maintain the equilibrium of multiple biological pathways. The Wnt/beta-catenin pathway is a main regulator of development through impacting the cell cycle at various points.43 Dysfunction of the Wnt/beta-catenin pathway components underlies multiple growth-related pathologies and human cancers.43 Genomic studies have identified various epigenetically silenced genes such as SFRP5, SOX17, WIF1, and APC involved in the Wnt/beta-catenin pathway.43 The APC protein is the core constituent of the Wnt pathway that was first identified in CRC.44 A direct correlation between APC methylation and loss of expression has been observed in ~70–80% of CRC.44–46 As the third deadly malignancy of the digestive system, the effect of APC hypermethylation on the progression of EC remains inconsistent and inconclusive. The study by Kawakami et al24 identified APC methylation in ~40% of BE and 80% of EC patients compared with normal controls. However, other study30 reported that 3% of their patients with low-grade esophageal dysplasia harbored high frequency of APC methylation, with none observed in patients with high-grade dysplasia and healthy normal controls. Considering the distribution of subjects in the study by Guo et al30 (39 patients with low-grade dysplasia and only nine patients with high-grade dysplasia), it is necessary to analyze the association between APC methylation and esophageal carcinogenesis using a large sample.
The current study systematically reviewed all relevant evidences and synthesized data from 18 studies inclusive of 1008 ECs, 570 BEs, and 782 normal controls using meta-analysis. The main finding of this study was the significant association between APC promoter methylation and increased risk of BE and EC. In particular, the APC methylation was 23 and 10 times more likely to predict EC and BE, respectively, although the effects came from heterogeneous sources. Whereas the frequency of APC hypermethylation was similar between EC and BE, and these results are consistent with previous studies.25,28 Besides, our analysis of tumor stage appears consistent with a previous study32 in terms of the slight effect of APC methylation on EC progression. These findings suggest that APC promoter hypermethylation is an early event in esophageal carcinogenesis.
Field cancerization was first proposed for oral cancer with the description of occult multifocal precancerous lesions in the epithelium of normal appearing oral mucosa.47 These lesions can now be detected by molecular analyses for genetic or epigenetic alterations associated with tumorigenesis and could precede morphological tumor formation.48 An emerging indication that alterations in epigenetic marks could be used as biomarkers (especially DNA methylation) was provided by analyses of hypermethylation of O-6-methylguanine-DNA methyltransferase (MGMT)49 in gliomas and glutathione S-transferase pi 1 (GSTP1) in prostate cancer.50 These hypermethylation events have been shown to be effective in the diagnosis of cancers. The detection of epigenetic alterations is therefore a promising auxiliary cancer diagnostic tool. APC promoter methylation seems an ideal cancer biomarker because previous study demonstrates this to be an early event in a number of different malignancies.51 However, the diagnostic power of APC hypermethylation in EC has been less investigated. Therefore, we performed a pooled analysis of 18 studies, including 2360 samples. Our results showed that the pooled AUC of APC methylation in distinguishing EC from normal control was 0.94, with 96% specificity and 55% sensitivity, and the pooled AUC for differentiating BE from normal controls was 0.88, with 96% specificity and 48% sensitivity. Besides, we mapped Fagan plots to analyze the clinical utility of APC methylation as an auxiliary diagnostic biomarker of EC and BE. The Fagan plot indicated that the probability of EC or BE diagnosis was remarkably increased with the detection of significant APC hypermethylation frequency even in people with low risks of developing EC or BE based on other clinical parameters. These findings suggest that the hypermethylation of APC has a potential in the diagnosis of EC and BE.
Conclusion
The notable findings of the current study are the significant association between APC methylation and increased risk of EC and BE and its potential role as an early diagnostic biomarker of EC. However, further studies regarding the role of APC methylation in EC progression are required.
Acknowledgment
This study was supported by the Ningbo Natural Science Foundation (grant numbers 2014A610226, 2016A610158, and 2017A610236) and the Scientific Benefit for People Project of Ningbo (grant number 2014C51001).
Author contributions
BW, HS, XD, and CZ contributed to the conception, design, and final approval of the submitted version. BW, HS, YF, HJ, and CZ contributed to the meta-analysis, interpretation of data, and preparation of figures and tables. All authors are responsible for the content and writing of the paper. All the authors read and approved the final manuscript. All authors contributed toward data analysis, drafting and critically revising the paper and agree to be accountable for all aspects of the work.
Disclosure
The authors report no conflicts of interest in this work
References
Siegel RL, Miller KD, Jemal A. Cancer statistics, 2016. CA Cancer J Clin. 2016;66(1):7–30. | ||
Society AC. Cancer Facts & Figures 2017. 2017. Available from: https://www.cancer.org/content/dam/cancer-org/research/cancer-facts-and-statistics/annual-cancer-facts-and-figures/2017/cancer-facts-and-figures-2017.pdf. Accessed January 05, 2017. | ||
Shapiro J, van Lanschot JJ, Hulshof MC, et al; CROSS Study Group. Neoadjuvant chemoradiotherapy plus surgery versus surgery alone for oesophageal or junctional cancer (CROSS): long-term results of a randomised controlled trial. Lancet Oncol. 2015;16(9):1090–1098. | ||
Rutegard M, Charonis K, Lu Y, Lagergren P, Lagergren J, Rouvelas I. Population-based esophageal cancer survival after resection without neoadjuvant therapy: an update. Surgery. 2012;152(5):903–910. | ||
Lagergren J, Lagergren P. Recent developments in esophageal adenocarcinoma. CA Cancer J Clin. 2013;63(4):232–248. | ||
Whiteman DC, Parmar P, Fahey P, et al; Australian Cancer Study. Association of Helicobacter pylori infection with reduced risk for esophageal cancer is independent of environmental and genetic modifiers. Gastroenterology. 2010;139(1):73–83; quiz e11–72. | ||
Hoyo C, Cook MB, Kamangar F, et al. Body mass index in relation to oesophageal and oesophagogastric junction adenocarcinomas: a pooled analysis from the international BEACON consortium. Int J Epidemiol. 2012;41(6):1706–1718. | ||
Lubin JH, Cook MB, Pandeya N, et al. The importance of exposure rate on odds ratios by cigarette smoking and alcohol consumption for esophageal adenocarcinoma and squamous cell carcinoma in the Barrett’s esophagus and esophageal adenocarcinoma consortium. Cancer Epidemiol. 2012;36(3):306–316. | ||
McElholm AR, McKnight AJ, Patterson CC, et al; Finbar Group. A population-based study of IGF axis polymorphisms and the esophageal inflammation, metaplasia, adenocarcinoma sequence. Gastroenterology. 2010;139(1):204–212.e203. | ||
Cheung WY, Zhai R, Bradbury P, et al. Single nucleotide polymorphisms in the matrix metalloproteinase gene family and the frequency and duration of gastroesophageal reflux disease influence the risk of esophageal adenocarcinoma. Int J Cancer. 2012;131(11):2478–2486. | ||
Li P, Liu X, Dong ZM, Ling ZQ. Epigenetic silencing of HIC1 promotes epithelial-mesenchymal transition and drives progression in esophageal squamous cell carcinoma. Oncotarget. 2015;6(35):38151–38165. | ||
Suva ML, Riggi N, Bernstein BE. Epigenetic reprogramming in cancer. Science. 2013;339(6127):1567–1570. | ||
Kinzler KW, Nilbert MC, Su LK, et al. Identification of FAP locus genes from chromosome 5q21. Science. 1991;253(5020):661–665. | ||
Nishisho I, Nakamura Y, Miyoshi Y, et al. Mutations of chromosome 5q21 genes in FAP and colorectal cancer patients. Science. 1991;253(5020):665–669. | ||
Papkoff J, Rubinfeld B, Schryver B, Polakis P. Wnt-1 regulates free pools of catenins and stabilizes APC-catenin complexes. Mol Cell Biol. 1996;16(5):2128–2134. | ||
Cole AM, Myant K, Reed KR, et al. Cyclin D2-cyclin-dependent kinase 4/6 is required for efficient proliferation and tumorigenesis following Apc loss. Cancer Res. 2010;70(20):8149–8158. | ||
Panarelli NC, Vaughn CP, Samowitz WS, Yantiss RK. Sporadic microsatellite instability-high colon cancers rarely display immunohistochemical evidence of Wnt signaling activation. Am J Surg Pathol. 2015;39(3):313–317. | ||
Wang JS, Guo M, Montgomery EA, et al. DNA promoter hypermethylation of p16 and APC predicts neoplastic progression in Barrett’s esophagus. Am J Gastroenterol. 2009;104(9):2153–2160. | ||
Guilleret I, Losi L, Chelbi ST, et al. DNA methylation profiling of esophageal adenocarcinoma using methylation ligation-dependent macroarray (MLM). Biochem Biophys Res Commun. 2016;479(2):231–237. | ||
Shakeri H, Fakhrjou A, Nikanfar A, Mohaddes-Ardebili SM. Methylation analysis of BRCA1 and APC in breast cancer and it’s relationship to clinicopathological features. Clin Lab. 2016;62(12):2333–2337. | ||
Ali A, Kumar S, Kakaria VK, et al. Detection of promoter DNA methylation of APC, DAPK, and GSTP1 genes in tissue biopsy and matched serum of advanced-stage lung cancer patients. Cancer Invest. 2017;35(6):423–430. | ||
Higgins JP. Commentary: heterogeneity in meta-analysis should be expected and appropriately quantified. Int J Epidemiol. 2008; 37(5):1158–1160. | ||
Jackson D. The power of the standard test for the presence of heterogeneity in meta-analysis. Stat Med. 2006;25(15):2688–2699. | ||
Kawakami K, Brabender J, Lord RV, et al. Hypermethylated APC DNA in plasma and prognosis of patients with esophageal adenocarcinoma. J Natl Cancer Inst. 2000;92(22):1805–1811. | ||
Eads CA, Lord RV, Wickramasinghe K, et al. Epigenetic patterns in the progression of esophageal adenocarcinoma. Cancer Res. 2001;61(8):3410–3418. | ||
Brock MV, Gou M, Akiyama Y, et al. Prognostic importance of promoter hypermethylation of multiple genes in esophageal adenocarcinoma. Clin Cancer Res. 2003;9(8):2912–2919. | ||
Sarbia M, Geddert H, Klump B, Kiel S, Iskender E, Gabbert HE. Hypermethylation of tumor suppressor genes (p16INK4A, p14ARF and APC) in adenocarcinomas of the upper gastrointestinal tract. Int J Cancer. 2004;111(2):224–228. | ||
Schulmann K, Sterian A, Berki A, et al. Inactivation of p16, RUNX3, and HPP1 occurs early in Barrett’s-associated neoplastic progression and predicts progression risk. Oncogene. 2005;24(25):4138–4148. | ||
Clement G, Braunschweig R, Pasquier N, Bosman FT, Benhattar J. Methylation of APC, TIMP3, and TERT: a new predictive marker to distinguish Barrett’s oesophagus patients at risk for malignant transformation. J Pathol. 2006;208(1):100–107. | ||
Guo M, Ren J, House MG, Qi Y, Brock MV, Herman JG. Accumulation of promoter methylation suggests epigenetic progression in squamous cell carcinoma of the esophagus. Clin Cancer Res. 2006;12(15):4515–4522. | ||
Ishii T, Murakami J, Notohara K, et al. Oesophageal squamous cell carcinoma may develop within a background of accumulating DNA methylation in normal and dysplastic mucosa. Gut. 2007;56(1):13–19. | ||
Kim YT, Park JY, Jeon YK, et al. Aberrant promoter CpG island hypermethylation of the adenomatosis polyposis coli gene can serve as a good prognostic factor by affecting lymph node metastasis in squamous cell carcinoma of the esophagus. Dis Esophagus. 2009;22(2):143–150. | ||
Moriichi K, Watari J, Das KM, et al. Effects of Helicobacter pylori infection on genetic instability, the aberrant CpG island methylation status and the cellular phenotype in Barrett’s esophagus in a Japanese population. Int J Cancer. 2009;124(6):1263–1269. | ||
Zare M, Jazii FR, Alivand MR, Nasseri NK, Malekzadeh R, Yazdanbod M. Qualitative analysis of adenomatous polyposis coli promoter: hypermethylation, engagement and effects on survival of patients with esophageal cancer in a high risk region of the world, a potential molecular marker. BMC Cancer. 2009;9:24. | ||
Li B, Wang B, Niu LJ, Jiang L, Qiu CC. Hypermethylation of multiple tumor-related genes associated with DNMT3b up-regulation served as a biomarker for early diagnosis of esophageal squamous cell carcinoma. Epigenetics. 2011;6(3):307–316. | ||
Wang CC, Mao WM, Ling ZQ. [Expression of DNA methylation of APC in peripheral blood and tumor tissue in patients with esophageal squamous cell carcinoma]. Zhonghua Wei Chang Wai Ke Za Zhi. 2011; 14(9):719–722. Chinese. | ||
Hoshimoto S, Takeuchi H, Ono S, et al. Genome-wide hypomethylation and specific tumor-related gene hypermethylation are associated with esophageal squamous cell carcinoma outcome. J Thorac Oncol. 2015;10(3):509–517. | ||
Fukui S, Watari J, Tomita T, et al. Localization of specialized intestinal metaplasia and the molecular alterations in Barrett esophagus in a Japanese population: an analysis of biopsy samples based on the “Seattle” biopsy protocol. Hum Pathol. 2016;51:32–40. | ||
Lei C, Zhiqiang L, Weiming M. Methylation of 5f 5of specialized intesmoter region of APC gene in csophageal carcinoma tissues. Chin J Cancer Prev Treat. 2011;18(3):200–204. | ||
Ma K, Cao B, Guo M. The detective, prognostic, and predictive value of DNA methylation in human esophageal squamous cell carcinoma. Clin Epigenetics. 2016;8:43. | ||
Das M, Sharma SK, Sekhon GS, Mahanta J, Phukan RK, Jalan BK. p16 gene silencing along with p53 single-nucleotide polymorphism and risk of esophageal cancer in Northeast India. Tumour Biol. 2017;39(5):1010428317698384. | ||
Xi T, Zhang G. Epigenetic regulation on the gene expression signature in esophagus adenocarcinoma. Pathol Res Pract. 2017;213(2):83–88. | ||
Nusse R, Clevers H. Wnt/beta-catenin signaling, disease, and emerging therapeutic modalities. Cell. 2017;169(6):985–999. | ||
Kinzler KW, Vogelstein B. Lessons from hereditary colorectal cancer. Cell. 1996;87(2):159–170. | ||
Jen J, Powell SM, Papadopoulos N, et al. Molecular determinants of dysplasia in colorectal lesions. Cancer Res. 1994;54(21):5523–5526. | ||
Smith AJ, Stern HS, Penner M, et al. Somatic APC and K-ras codon 12 mutations in aberrant crypt foci from human colons. Cancer Res. 1994;54(21):5527–5530. | ||
Slaughter DP, Southwick HW, Smejkal W. Field cancerization in oral stratified squamous epithelium; clinical implications of multicentric origin. Cancer. 1953;6(5):963–968. | ||
Hockel M, Dornhofer N. The hydra phenomenon of cancer: why tumors recur locally after microscopically complete resection. Cancer Res. 2005;65(8):2997–3002. | ||
Esteller M, Garcia-Foncillas J, Andion E, et al. Inactivation of the DNA-repair gene MGMT and the clinical response of gliomas to alkylating agents. N Engl J Med. 2000;343(19):1350–1354. | ||
Esteller M, Corn PG, Urena JM, Gabrielson E, Baylin SB, Herman JG. Inactivation of glutathione S-transferase P1 gene by promoter hypermethylation in human neoplasia. Cancer Res. 1998;58(20):4515–4518. | ||
Coppede F, Lopomo A, Spisni R, Migliore L. Genetic and epigenetic biomarkers for diagnosis, prognosis and treatment of colorectal cancer. World J Gastroenterol. 2014;20(4):943–956. |
Supplementary materials
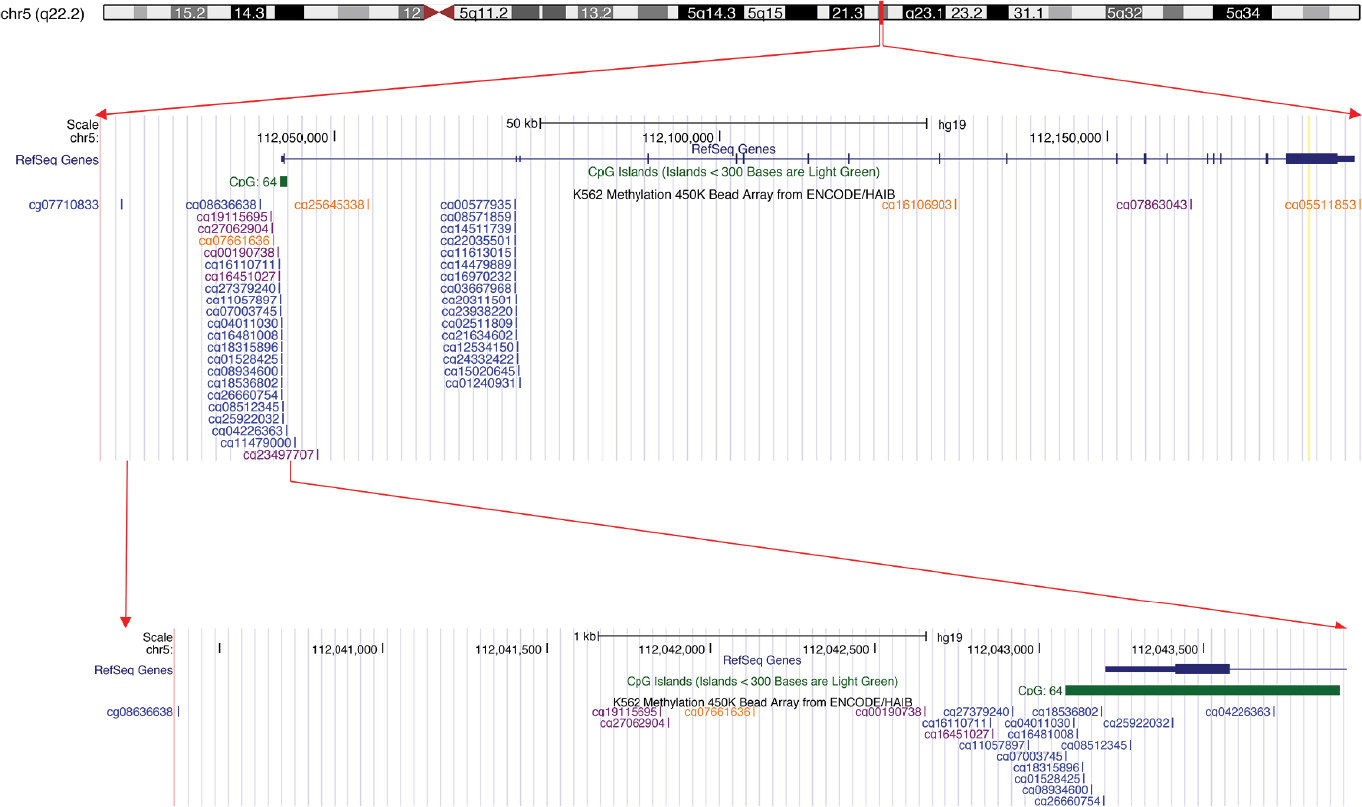 | Figure S1 All the CpG island probes located in the APC. |
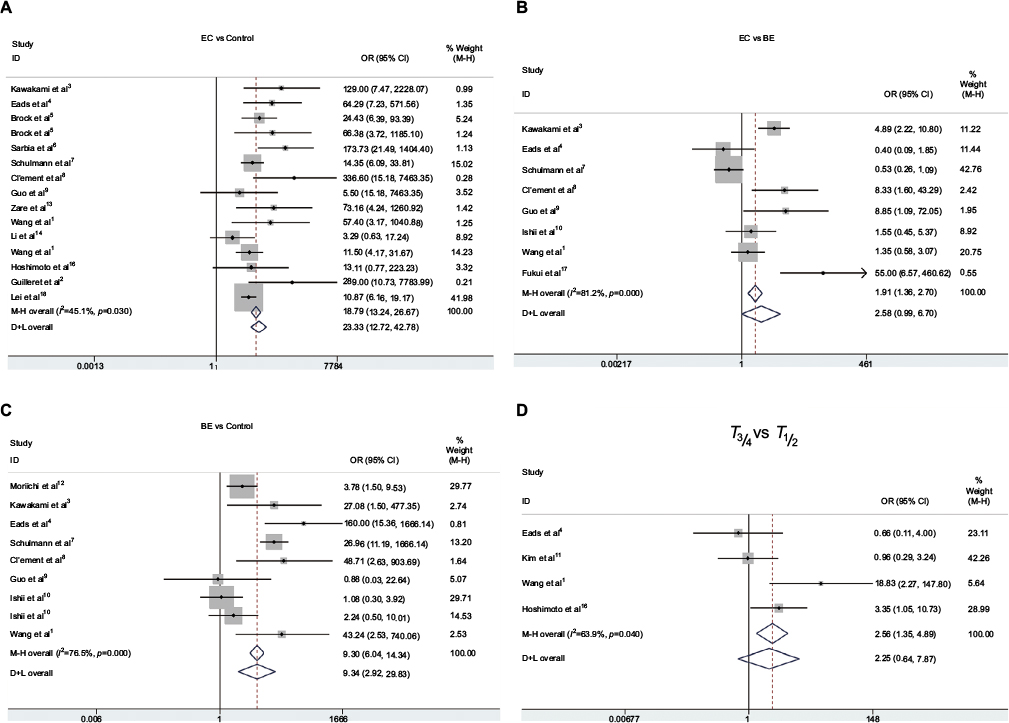 | Figure S2 Pooled forest plot of APC methylation status during the carcinogenesis of EC. Note: (A) Cancer vs. control: OR = 23.33; 95% CI, 12.72 – 42.78. (B) Cancer vs. BE: OR = 2.58; 95% CI,0.99– 6.70. (C) BE vs. control: OR = 9.34; 95% CI, 2.92 – 29.82. (D) T3/4 vs. T1/2: OR = 2.25; 95% CI, 0.64 – 7.87. Abbreviations: BE, Barrett’s esophagus; EC, esophageal cancer. |
Abbreviations: EC, esophageal cancer; TCGA, The Cancer Genome Atlas.
References
Wang JS, Guo M, Montgomery EA, et al. DNA promoter hypermethylation of p16 and APC predicts neoplastic progression in Barrett’s esophagus. Am J Gastroenterol. 2009;104(9):2153–2160. | ||
Guilleret I, Losi L, Chelbi ST, et al. DNA methylation profiling of esophageal adenocarcinoma using Methylation Ligation-dependent Macroarray (MLM). Biochem Biophys Res Commun. 2016;479(2):231–237. | ||
Kawakami K, Brabender J, Lord RV, et al. Hypermethylated APC DNA in plasma and prognosis of patients with esophageal adenocarcinoma. J Natl Cancer Inst. 2000;92(22):1805–1811. | ||
Eads CA, Lord RV, Wickramasinghe K, et al. Epigenetic patterns in the progression of esophageal adenocarcinoma. Cancer Res. 2001;61(8):3410–3418. | ||
Brock MV, Gou M, Akiyama Y, et al. Prognostic importance of promoter hypermethylation of multiple genes in esophageal adenocarcinoma. Clin Cancer Res. 2003;9(8):2912–2919. | ||
Sarbia M, Geddert H, Klump B, Kiel S, Iskender E, Gabbert HE. Hypermethylation of tumor suppressor genes (p16INK4A, p14ARF and APC) in adenocarcinomas of the upper gastrointestinal tract. Int J Cancer. 2004;111(2):224–228. | ||
Schulmann K, Sterian A, Berki A, et al. Inactivation of p16, RUNX3, and HPP1 occurs early in Barrett’s-associated neoplastic progression and predicts progression risk. Oncogene. 2005;24(25):4138–4148. | ||
Clement G, Braunschweig R, Pasquier N, Bosman FT, Benhattar J. Methylation of APC, TIMP3, and TERT: a new predictive marker to distinguish Barrett’s oesophagus patients at risk for malignant transformation. J Pathol. 2006;208(1):100–107. | ||
Guo M, Ren J, House MG, Qi Y, Brock MV, Herman JG. Accumulation of promoter methylation suggests epigenetic progression in squamous cell carcinoma of the esophagus. Clin Cancer Res. 2006;12(15):4515–4522. | ||
Ishii T, Murakami J, Notohara K, et al. Oesophageal squamous cell carcinoma may develop within a background of accumulating DNA methylation in normal and dysplastic mucosa. Gut. 2007;56(1):13–19. | ||
Kim YT, Park JY, Jeon YK, et al. Aberrant promoter CpG island hypermethylation of the adenomatosis polyposis coli gene can serve as a good prognostic factor by affecting lymph node metastasis in squamous cell carcinoma of the esophagus. Dis Esophagus. 2009;22(2):143–150. | ||
Moriichi K, Watari J, Das KM, et al. Effects of Helicobacter pylori infection on genetic instability, the aberrant CpG island methylation status and the cellular phenotype in Barrett’s esophagus in a Japanese population. Int J Cancer. 2009;124(6):1263–1269. | ||
Zare M, Jazii FR, Alivand MR, Nasseri NK, Malekzadeh R, Yazdanbod M. Qualitative analysis of Adenomatous Polyposis Coli promoter: hypermethylation, engagement and effects on survival of patients with esophageal cancer in a high risk region of the world, a potential molecular marker. BMC Cancer. 2009;9:24. | ||
Li B, Wang B, Niu LJ, Jiang L, Qiu CC. Hypermethylation of multiple tumor-related genes associated with DNMT3b up-regulation served as a biomarker for early diagnosis of esophageal squamous cell carcinoma. Epigenetics. 2011;6(3):307–316. | ||
Wang CC, Mao WM, Ling ZQ. [Expression of DNA methylation of APC in peripheral blood and tumor tissue in patients with esophageal squamous cell carcinoma]. Zhonghua Wei Chang Wai Ke Za Zhi. 2011;14(9):719–722. | ||
Hoshimoto S, Takeuchi H, Ono S, et al. Genome-wide hypomethylation and specific tumor-related gene hypermethylation are associated with esophageal squamous cell carcinoma outcome. J Thorac Oncol. 2015;10(3):509–517. | ||
Fukui S, Watari J, Tomita T, et al. Localization of specialized intestinal metaplasia and the molecular alterations in Barrett esophagus in a Japanese population: an analysis of biopsy samples based on the “Seattle” biopsy protocol. Hum Pathol. 2016;51:32–40. | ||
Lei C, zhiqiang L, weiming M. Methylation of 5f 5of specialized intesmoter region of APC gene in csophageal carcinoma tissues. Chinese Journal of Cancer Prevention and Treatment. 2011;18(03):200–204. |
 © 2018 The Author(s). This work is published and licensed by Dove Medical Press Limited. The full terms of this license are available at https://www.dovepress.com/terms.php and incorporate the Creative Commons Attribution - Non Commercial (unported, v3.0) License.
By accessing the work you hereby accept the Terms. Non-commercial uses of the work are permitted without any further permission from Dove Medical Press Limited, provided the work is properly attributed. For permission for commercial use of this work, please see paragraphs 4.2 and 5 of our Terms.
© 2018 The Author(s). This work is published and licensed by Dove Medical Press Limited. The full terms of this license are available at https://www.dovepress.com/terms.php and incorporate the Creative Commons Attribution - Non Commercial (unported, v3.0) License.
By accessing the work you hereby accept the Terms. Non-commercial uses of the work are permitted without any further permission from Dove Medical Press Limited, provided the work is properly attributed. For permission for commercial use of this work, please see paragraphs 4.2 and 5 of our Terms.