")
Back to Journals » Clinical Ophthalmology » Volume 12
Early centripetal displacements of capillaries in macular region caused by internal limiting membrane peeling
Authors Kumagai K, Ogino N, Furukawa M, Ooya R , Horie E
Received 4 December 2017
Accepted for publication 28 February 2018
Published 27 April 2018 Volume 2018:12 Pages 755—763
DOI https://doi.org/10.2147/OPTH.S158826
Checked for plagiarism Yes
Review by Single anonymous peer review
Peer reviewer comments 3
Editor who approved publication: Dr Scott Fraser
Kazuyuki Kumagai,1 Nobuchika Ogino,2 Mariko Furukawa,1 Rieko Ooya,1 Eiji Horie3
1Kamiiida Daiichi General Hospital, Nagoya, Japan; 2Nishigaki Eye Clinic, Nagoya, Japan; 3Yata Eye Clinic, Izunokuni, Japan
Purpose: The aim of this study was to determine whether the centripetal displacement of the capillaries in the macular region after vitrectomy is caused by internal limiting membrane (ILM) peeling.
Methods: Eighteen patients with different types of retinal diseases but with a normal or approximately normal foveal contour underwent successful vitrectomy with (n=12) or without (n=6) ILM peeling. Optical coherence tomography angiography (OCTA) images of the inner retinal vascular plexus in the macular region were analyzed pre- and postoperatively. Four concentric polygonal areas were marked in the OCTA images with the corners selected to be easily identified by vessel bifurcations. The areas of the postoperative foveal avascular zone (FAZ) and the four polygonal regions at about 1 month postoperatively were compared to the baseline areas.
Results: Vitrectomy was performed for eleven eyes with vitreomacular tractions, three with macular-on retinal detachments, and four with thin epiretinal membranes. A significant decrease in the FAZ area was observed postoperatively in only the ILM-peeled eyes (P=0.0002). The four polygonal areas in the ILM-peeled eyes decreased after surgery, and the decrease was fit by a linear regression line (R2=0.985–0.999; n=7). The time course of the postoperative decrease of the FAZ area was fit by a hyperbolic curve (R2=0.969–0.998; n=6). The average postoperative time required to reach one-half of the final FAZ area was 1.16 days (0.81–1.62 days).
Conclusion: These findings suggest that ILM peeling causes an early centripetal displacement of the capillaries in the macular region.
Keywords: epiretinal membrane, foveal avascular zone, internal limiting membrane, macular hole, optical coherence tomography angiography
Introduction
A displacement of the retina has been reported after vitrectomy for different types of retinal diseases including retinal detachments (RDs),1 macular holes (MHs),2–7 thin epiretinal membranes (ERMs),8 and diabetic macular edema.9 The direction of the retinal displacements has been shown to include a downward movement,1,7 a centripetal movement toward the foveal center,2,3,7 and a displacement toward the optic disc.3–7,9
The cause(s) of the retinal movements has not been definitively determined, although it is possible that the release of the vitreomacular traction (VMT) by the vitrectomy, and the other surgical procedures such as ILM peeling and gas tamponade might be the causes of the displacements.
The retinal displacements have been examined by scanning laser ophthalmoscopy,2 optical coherence tomography (OCT),3,6,7,9 fundus photography,4 and fundus autofluorescence imaging.1,5,8 Optical coherence tomography angiography (OCTA) was recently introduced as a noninvasive method that can obtain en face images of the capillary plexuses at different depths of the retina and choroid.10 We have obtained OCTA images that showed a centripetal movement of identifiable capillaries toward the foveal center after vitrectomy with internal limiting membrane (ILM) peeling for a VMT11 and for a thin ERM.12
However, as best we know, there has not been a study that compared the position of the capillary beds before and after vitrectomy with and without ILM peeling. Thus, the purpose of this study was to determine whether the displacements of the capillaries in the macular region after vitrectomy are due to ILM peeling. To accomplish this, we measured the areas of the foveal avascular zone (FAZ) and four concentric polygonal regions surrounding the fovea in eyes that underwent vitrectomy for different types of retinal diseases but with a normal or approximately normal foveal contour. The preoperative OCTA images were compared to the postoperative images.
Methods
Participants
This was a multicenter, retrospective, interventional case series that was performed at the Yata Eye Clinic, the Kamiiida Daiichi General Hospital, and the Nishigaki Eye Clinic from May 2016 through June 2017. This study involved patients who had undergone vitrectomy with or without ILM peeling for different retinal diseases.
Informed consent
A signed informed consent was obtained from all patients for the surgery, data collection, and the use of the data for research studies. The procedures used in this study conformed to the tenets of the Declaration of Helsinki and were approved by the Institutional Review Board of the different institutions.
Inclusion and exclusion criteria
The inclusion criteria for the eyes were symptomatic focal VMT (eleven eyes), symptomatic thin ERM with a normal foveal contour (four eyes), and rhegmatogenous RD without the involvement of the macula (three eyes). Eyes with systemic risk factors such as diabetes mellitus or uncontrolled ocular hypertension that could affect the capillary plexus were excluded. Also, the participants did not have other ocular disorders such as high myopia, glaucoma, and age-related macular degeneration that could affect the retinal morphology.
Surgical treatments
All patients underwent 25- or 27-gauge pars plana vitrectomy with the creation of a posterior vitreous detachment if attached. Brilliant Blue G-assisted ILM peeling was performed within the vascular arcade (6×6 mm) to prevent post-vitrectomy ERM development.13 Air tamponade with facedown positioning was performed if needed. All phakic patients underwent pars plana vitrectomy with phacoemulsification and implantation of a posterior chamber intraocular lens.
Comprehensive ophthalmological examination
Each of the participants had a comprehensive ophthalmological examination including measurements of the refractive error, best-corrected visual acuity with a Landolt chart at 5 m, axial length by ocular biometry (IOLMaster; Carl Zeiss Meditec, Inc, Jena, Germany), and intraocular pressure with a Goldmann applanation tonometer. In addition, the eyes were examined by slit-lamp biomicroscopy, dilated indirect slit-lamp biomicroscopy with and without a contact lens, indirect ophthalmoscopy, and OCT and OCTA.
Optical coherence tomography angiography
The OCTA was performed with the Optovue RTVue XR (Avanti Optovue, Inc, Fremont, CA, USA) or the Cirrus HD-OCT 5000 (Carl Zeiss Meditec, Inc), or with DRI OCT-1 (Atlantis; Topcon, Tokyo, Japan) OCTA instrument. A 3×3 mm en face OCTA image was recorded in the angioretina mode. The images were recorded preoperatively and at about 1 month postoperatively using the same instrument. The OCTA en face images of the superficial retinal vascular plexus were used for the analyses. In Case 6, 6×6 mm OCTA en face images that included the fovea and optic disc were additionally recorded preoperatively and at 1 month postoperatively.
At least five B-scan images of 6 mm length that passed through the fovea along the horizontal and vertical axes were recorded to obtain cross-sectional images of the vitreoretinal interface. These images were used to determine the shape of the foveal contour and the papillofoveal distance. The papillofoveal distance was defined as the distance from the disc margin to the presumed foveal center in the horizontal B-scan OCT image.
Measurements of the FAZ
The margins of the FAZ were delineated automatically, and the FAZ area was determined with the embedded software. Analyses of sequential changes in the FAZ area in eyes with ILM peeling were performed in six patients.
Measurements of concentric polygonal areas and the distance
We selected four concentric polygonal areas with the corners set at easily identifiable sites around the fovea in seven cases. The four areas plus the FAZ are shown preoperatively and 1 month postoperatively in Figure 1A and B, respectively. The shapes of the corresponding polygonal areas were very similar before and after surgery in all cases indicating a uniform decrease over the entire retina. We measured an imaginary radius of each polygonal area.
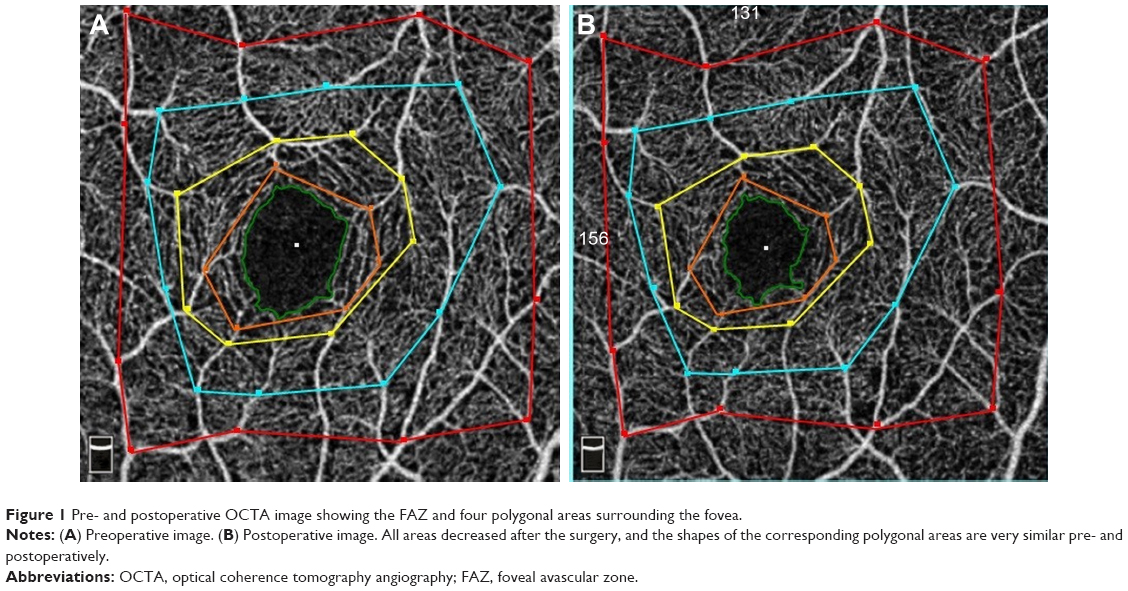 | Figure 1 Pre- and postoperative OCTA image showing the FAZ and four polygonal areas surrounding the fovea. |
The pre- and postoperative distances between the identified bifurcations and the foveal center and the disc center were measured in six cases and one case, respectively. Each polygonal area and the distance between the two points were measured with the ImageJ software (National Institutes of Health, Bethesda, MD, USA).
Displacements of capillaries in the papillofoveal area
The 6×6 mm OCTA en face images that included the fovea and optic disc were used to measure the displacements of the capillaries in the papillofoveal area. These images were recorded preoperatively and at 1 month postoperatively in Case 6 after vitrectomy. The pre- and postoperative distances between the positions of the bifurcations and the foveal center and the disc center were measured. The changes in the distances were analyzed.
Statistical analyses
Unpaired t-tests were used to determine the significance of the differences in the FAZ area and the papillofoveal distance with and without ILM peeling. Linear regression analyses were used to determine the associations between the pre- and postoperative measurements. P<0.05 was accepted as statistically significant. Statview software V.5.0 (SAS Institute, Cary, NC, USA) was used for the statistical analyses.
Results
Vitrectomy was performed on eleven eyes with VMT, three eyes with a rhegmatogenous RD, and four eyes with a thin ERM. After the surgery, the VMT was resolved in all patients, and the visual acuity improved in 13 patients and was unchanged in five patients. The ILM was peeled in 12 patients and not peeled in six patients. The demographics of the patients, and the characteristics before and after the surgery are presented in Table 1.
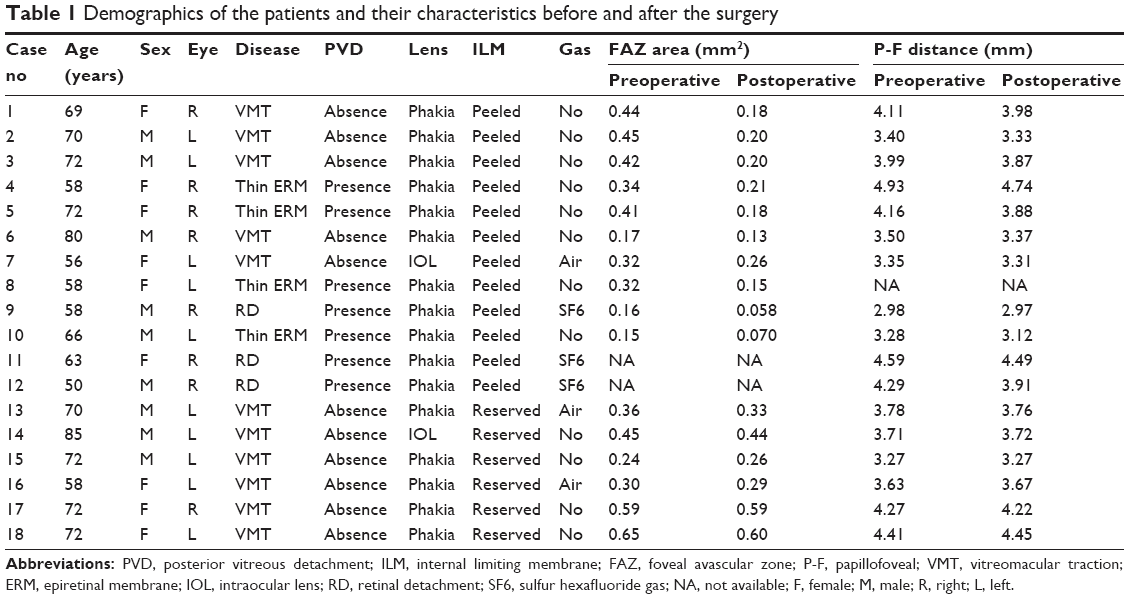 | Table 1 Demographics of the patients and their characteristics before and after the surgery |
FAZ areas with and without ILM peeling (n=16)
The average FAZ area of the ILM-peeled eyes significantly decreased from 0.32 mm2 to 0.16 mm2 postoperatively (P=0.0002). The average FAZ area in the ILM-preserved eyes was 0.43 mm2 preoperatively and 0.42 mm2 postoperatively (P=0.24). Thus, the average area of the FAZ decreased significantly in eyes with ILM peeling but not significantly in eyes without ILM peeling.
Papillofoveal distance with and without ILM peeling (n=17)
The average papillofoveal distance in the ILM-peeled eyes decreased significantly from 0.387 to 0.373 mm postoperatively (P=0.0007) but did not change significantly in the eyes without ILM peeling (0.385 to 0.385 mm; P=0.80). Thus, the average papillofoveal distance decreased significantly in eyes with ILM peeling but not significantly in eyes without ILM peeling.
Sequential changes in the FAZ area after ILM peeling (n=6)
The sequential changes in the FAZ area during the follow-up period are shown in Figure 2 for six cases. The course of the postoperative decrease of the FAZ area can be fit by a hyperbolic curve (R2=0.969–0.998). The results are shown in Table 2.
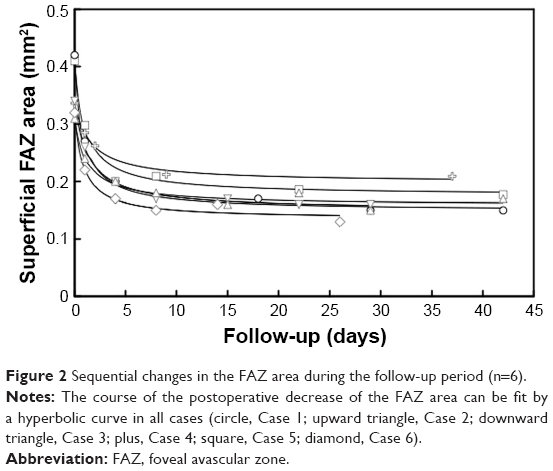 | Figure 2 Sequential changes in the FAZ area during the follow-up period (n=6). |
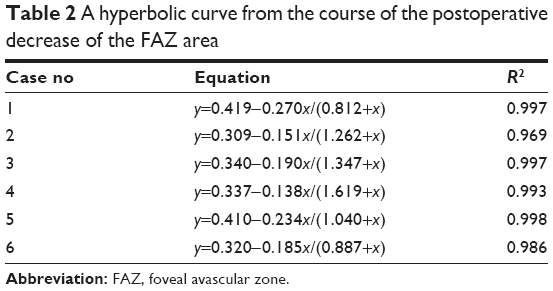 | Table 2 A hyperbolic curve from the course of the postoperative decrease of the FAZ area |
The average postoperative time to reach one-half of the final FAZ area was 1.16 days with a range of 0.81–1.62 days.
Changes in the FAZ area and four polygonal areas in ILM-peeled eyes (n=7)
The areas of the preoperative and postoperative FAZ and four polygonal sectors of seven ILM-peeled eyes are plotted in Figure 3A.
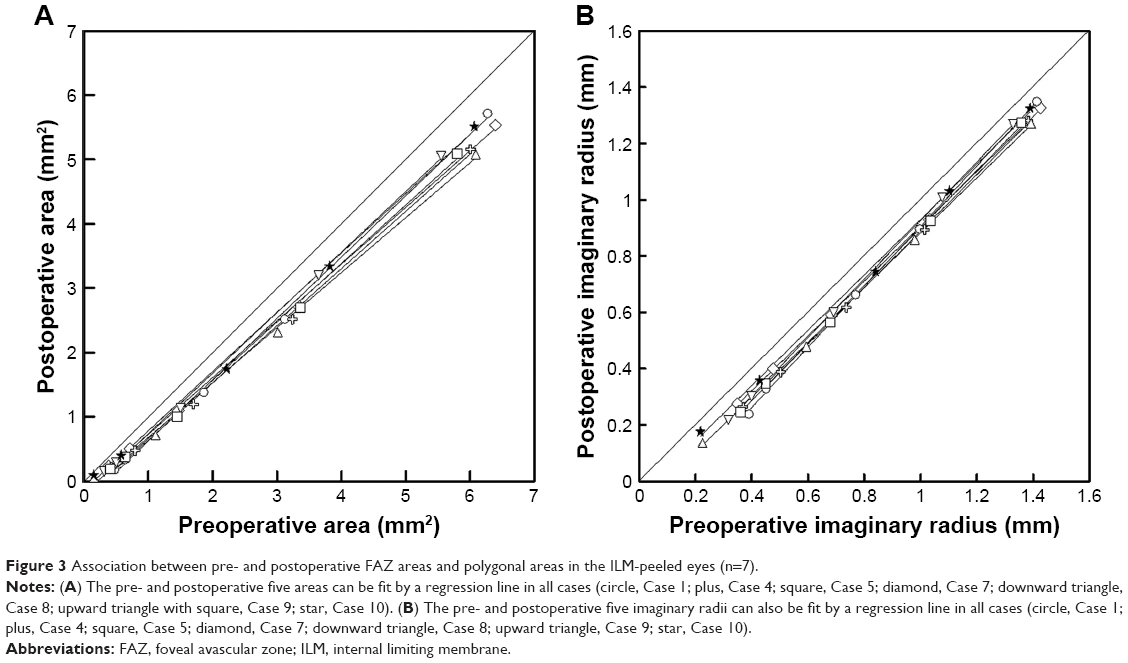 | Figure 3 Association between pre- and postoperative FAZ areas and polygonal areas in the ILM-peeled eyes (n=7). |
In all cases, the changes in the pre- and postoperative corresponding areas could be fit by a linear regression line (R2=0.985–0.999). The results are shown in Table 3.
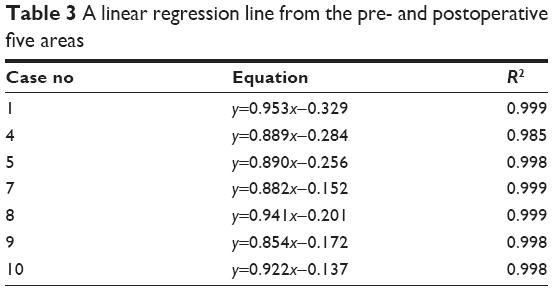 | Table 3 A linear regression line from the pre- and postoperative five areas |
The pre- and postoperative imaginary radii could also be fit by a regression line (R2=0.999–1.00; Figure 3B). The results are shown in Table 4.
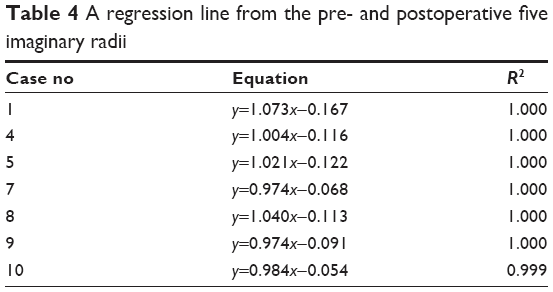 | Table 4 A regression line from the pre- and postoperative five imaginary radii |
Changes in the distance between vessel bifurcations and the fovea in ILM-peeled eyes (n=6)
The pre- and postoperative distances between vessel bifurcations and the foveal center are plotted for six ILM-peeled eyes. In all cases, the preoperative and postoperative corresponding distance can be fit by a linear regression line (R2=0.972–0.996). The results are shown in Table 5.
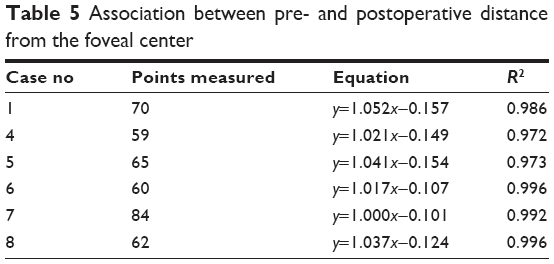 | Table 5 Association between pre- and postoperative distance from the foveal center |
Displacements of capillaries in the papillofoveal area from Case 6
In the angioretina mode, 6×6 mm OCTA en face images that included the fovea and optic disc were recorded preoperatively and at 1 month postoperatively in Case 6. The displacements of the capillaries in the papillofoveal area after vitrectomy with ILM peeling for VMT are shown in Figure 4.
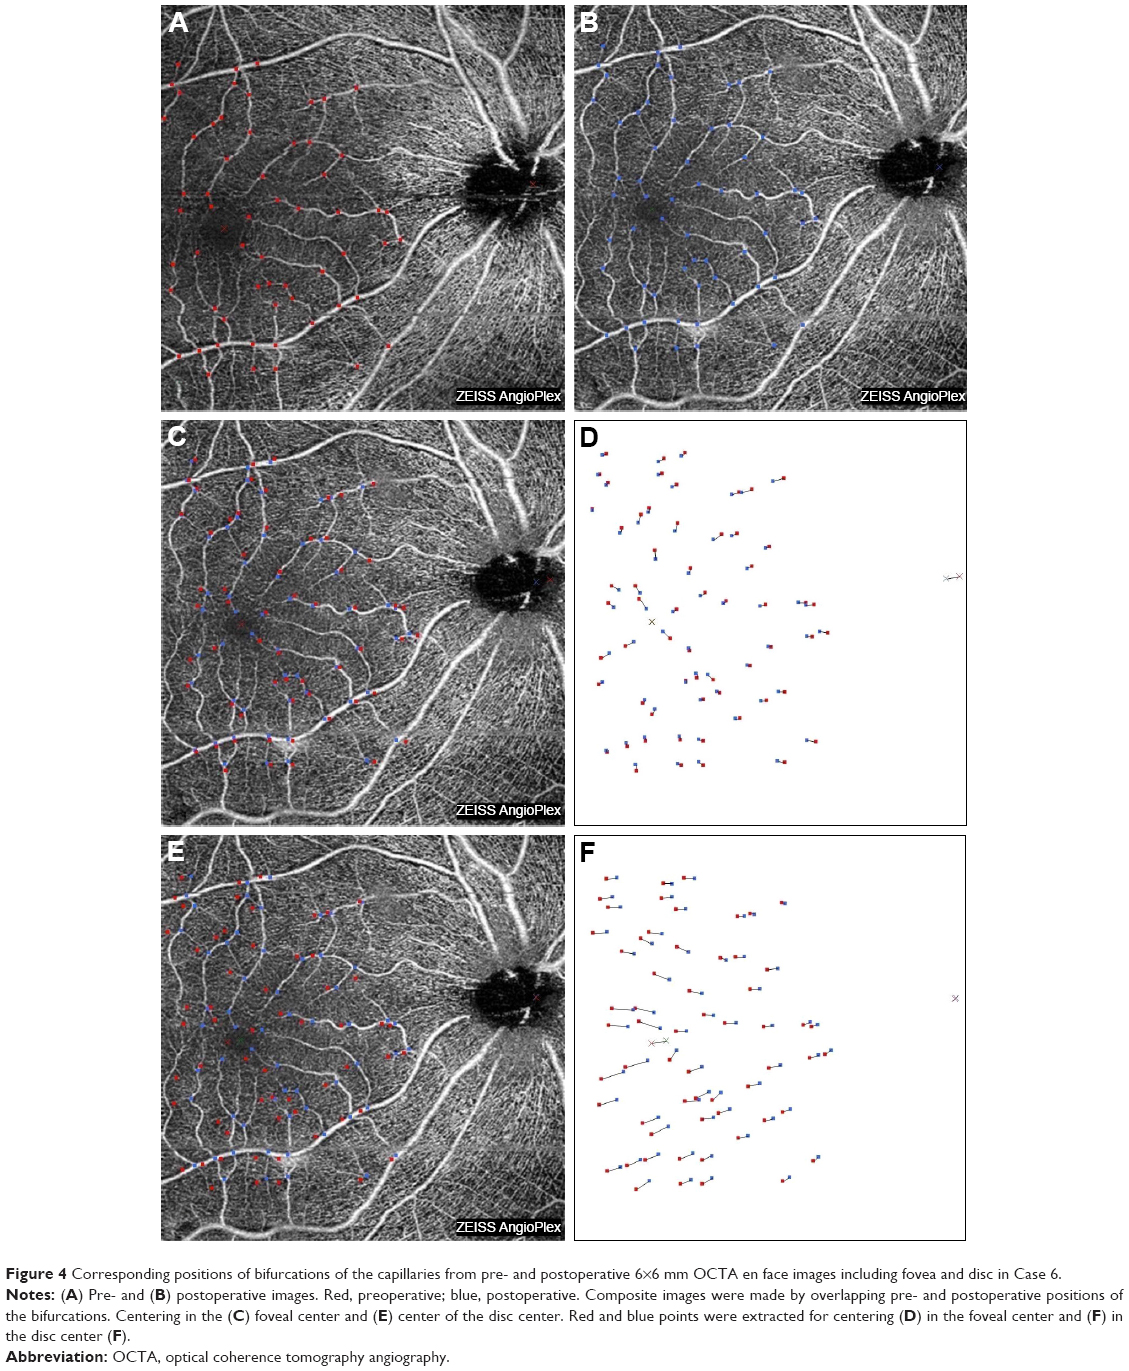 | Figure 4 Corresponding positions of bifurcations of the capillaries from pre- and postoperative 6×6 mm OCTA en face images including fovea and disc in Case 6. |
The corresponding positions of the bifurcations of the capillaries in the pre- and postoperative OCTA images are shown in Figure 4A and B. The corresponding positions of the bifurcations of the capillaries from the preoperative (red squares) and the postoperative (blue squares) OCTA images centered on the fovea are shown in Figure 4C. The composite images made by overlapping preoperative and postoperative positions of the bifurcations are shown in Figure 4D with the fovea marked with an “x”. The displacements appear to be centripetally toward the fovea.
The corresponding positions of the bifurcations of the capillaries from the pre- and postoperative OCTA images centered on the optic disc are shown in Figure 4E. The composite images that were made by overlapping the pre- and postoperative positions of the bifurcations are shown in Figure 4F. The two corresponding bifurcations appear to show a displacement of the loci toward the disc center postoperatively.
The pre- and postoperative distances to the fovea from the image of Case 6 centered on the fovea are plotted in Figure 5A. The distance before and after surgery can be fit by a linear regression line (y=1.017x–0.107; R2=0.996; Table 5). This indicates that the positions moved toward the fovea to the same degree.
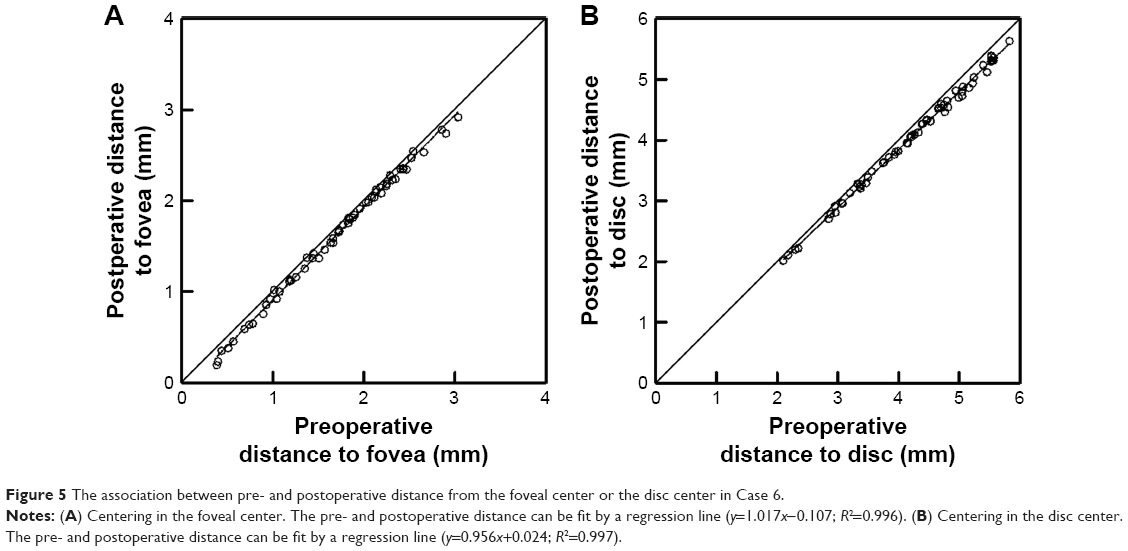 | Figure 5 The association between pre- and postoperative distance from the foveal center or the disc center in Case 6. |
The pre- and postoperative distances to the center of the optic disc from the image of Case 6 centered on the optic disc are plotted in Figure 5B. The distance before and after surgery can be fit by a regression line (y=0.956x+0.024; R2=0.997). This indicates that the positions move toward the optic disc center and the amount of displacement was far larger from the disc center.
Discussion
To determine whether ILM peeling was the cause of the displacement of the retina, we measured corresponding positions of the capillaries in the macular region before and after vitrectomy. The results indicated the ILM peeling played a role in the decrease of the FAZ area and papillofoveal distance. The results also showed that ILM peeling most likely caused the early and centripetal movement of the capillaries in the macular region and the displacement of the fovea toward the optic disc simultaneously.
The reduction in the FAZ area has been reported in patients with an MH14,15 and ERM15 after vitrectomy with ILM peeling. The decrease in the papillofoveal distance has also been reported in patients with MH3–7 and diabetic macular edema.9 These agreements indicate that the ILM peeling was probably the cause of the decrease of the FAZ area and the papillofoveal distance. However, the release of the retinal traction after vitrectomy suggests that it might also have been involved in the decrease. We have reported two cases that showed a decrease in the FAZ area and the papillofoveal distance after vitrectomy with ILM peeling for a VMT and thin ERM.11,12 In this study, we compared the decrease of the FAZ area and papillofoveal distance with or without ILM peeling. A significant decrease in the FAZ area and papillofoveal distance was observed postoperatively only in the ILM-peeled eyes. To the best of our knowledge, the relationship between ILM peeling for VMT, a thin ERM, and macular-on RD and the decreases in the FAZ area and papillofoveal distance has not been reported to be statistically significant.
The visual improvement after vitrectomy for several macular diseases can be expressed as a hyperbolic curve.16 Recently, we have reported that the course of the postoperative decrease of the FAZ area could be fit by a hyperbolic curve in one case.12 However, the mechanism was not determined, and we did not try to find other equations that might suit our data. In this study, we added five additional cases, and our analysis showed that the course of the postoperative decrease of the FAZ area could be fit by a hyperbolic curve (R2=0.969–0.998; n=6). The average postoperative time required to attain one-half of the final FAZ area is 1.16 days with a range of 0.81–1.62 days. Thus, the reduction of the FAZ area was very early.
The shapes of the pre- and postoperative polygonal areas were very similar in all cases, and the pre- and postoperative change in the size of the five areas, the FAZ and four polygonal areas, could be fit by a linear regression line (R2=0.985–0.999). In addition, the pre- and postoperative corresponding distances from the foveal center could be fit by a linear regression line (R2=0.972–0.996; Table 5). These results suggest that there was a centripetal displacement of the inner retina that occurred within 1 month after the surgery. The early displacements are similar to those after MH surgery.17
The retina around a full-thickness MH moves centripetally during the MH closure.2 Vitrectomy and gas tamponade cause retinal movements as reported in the treatment of RDs.1 Our study did not include eyes with full-thickness MHs, and the decrease of the FAZ area occurred in eyes without a gas tamponade. Thus, the ILM peeling was the most likely cause of this displacement.
One explanation for the centripetal displacement is that the ILM may have some intrinsic forces stretching the retina centrifugally, and the removal of the ILM may remove such forces leading to a centripetal movement. The second explanation is that the structural changes to the Mueller cells may be influencing the inner retinal movement. The Mueller cells extend vertically for the full thickness of the retina, except for the foveal center, and they stretch eccentrically from the foveal center to the parafoveal region.18 The footplates of the Mueller cells form the ILM. Thus, the structural changes of the footplates of the Mueller cells after ILM peeling may be involved in the retinal displacement. Additional studies are needed to determine why and how this occurs.
The mechanism(s) involved in the displacement of the foveal center toward the optic disc center after ILM peeling has not been determined. Two studies proposed endogenous forces of the retinal parenchyma.3,9 Thus, Kawano et al3 suggested that the release of unknown forces in the retinal parenchyma might be the major cause of shifting the fovea nasally after ILM peeling. Under natural conditions, the traction of the ILM on the fovea from the temporal side may be stronger than that from the nasal side because there is no ILM on the optic disc.
The present cases also showed a shortening of the papillofoveal distance. This suggests that the centripetal movement of the central retina toward the foveal center and a displacement toward the optic disc occurred simultaneously (Figure 4). Further studies are needed to determine the mechanism(s) underlying these complex retinal movements.
The study has several limitations. First, the OCTA images of the central macular region (3×3 mm) are too small to evaluate the movement of the macular region. Thus, examinations of a broader area are needed. Second, this study included eyes with VMT, thin ERM, and RD. It is possible that the capillary movements are affected by the release of traction or other surgical procedures. Third, all the 18 patients were with different types of retinal diseases, which will cause bias between the ILM-peeled and ILM-on groups. The reason is some retinopathies such as macular membrane could affect the centripetal juxtafoveal contraction. However, it is not possible to perform ILM peeling without vitrectomy on normal eyes. Fourth, Brilliant Blue G can also affect the centripetal retinal contraction around the fovea. It would be better to peel the ILM without any ILM staining assistant. Last, the relevance of the findings is unclear. It raises a question as to the correct size of the FAZ and whether a reduction or increase in size is of significance.
In conclusion, our results indicate that ILM peeling causes a centripetal displacement of the retina toward the foveal center during the early postoperative period. Further studies are needed to determine the mechanism(s) causing the movements and the effects of the movements on functional and anatomical outcomes.
Disclosure
The authors report no conflicts of interest in this work.
References
Shiragami C, Shiraga F, Yamaji H, et al. Unintentional displacement of the retina after standard vitrectomy for rhegmatogenous retinal detachment. Ophthalmology. 2010;117(1):86–92. | ||
Yanagita T, Shimizu K, Fujimura F, Takano M. Fixation point after successful macular hole surgery with internal limiting membrane peeling. Ophthalmic Surg Lasers Imaging. 2009;40:109–114. | ||
Kawano K, Ito Y, Kondo M, et al. Displacement of foveal area toward optic disc after macular hole surgery with internal limiting membrane peeling. Eye. 2013;27(7):871–877. | ||
Nakagomi T, Goto T, Tateno Y, Oshiro T, Iijima H. Macular slippage after macular hole surgery with internal limiting membrane peeling. Curr Eye Res. 2013;38(12):1255–1260. | ||
Ishida M, Ichikawa Y, Higashida R, Tsutsumi Y, Ishikawa A, Imamura Y. Retinal displacement toward optic disc after internal limiting membrane peeling for idiopathic macular hole. Am J Ophthalmol. 2014;157(5):971–977. | ||
Itoh Y, Inoue M, Rii T, Ando Y, Hirakata A. Asymmetrical recovery of cone outer segment tips line and foveal displacement after successful macular hole surgery. Invest Ophthalmol Vis Sci. 2014;55(5):3003–3011. | ||
Pak KY, Park KH, Kim KH, et al. Topographic changes of the macula after closure of idiopathic macular hole. Retina. 2017;37(4):667–672. | ||
Nitta E, Shiraga F, Shiragami C, Fukuda K, Yamashita A, Fujiwara A. Displacement of the retina and its recovery after vitrectomy in idiopathic epiretinal membrane. Am J Ophthalmol. 2013;155(6):1014–1020. | ||
Yoshikawa M, Murakami T, Nishijima K, et al. Macular migration toward the optic disc after inner limiting membrane peeling for diabetic macular edema. Invest Ophthalmol Vis Sci. 2013;54(1):629–635. | ||
Spaide RF, Klancnik JM Jr, Cooney MJ. Retinal vascular layers imaged by fluorescein angiography and optical coherence tomography angiography. JAMA Ophthalmol. 2015;133(1):45–50. | ||
Kumagai K, Hangai M, Furukawa M, Suetsugu T, Ogino N. Centripetal movement of the capillaries in the central macular region after internal limiting membrane peeling. Retina Cases Brief Rep. Epub 2017 Jan 11. | ||
Kumagai K, Uemura A, Furukawa M, Suetsugu T, Ogino N. Decrease of the foveal avascular zone area after internal limiting membrane: single case study. Int Med Case Rep J. 2017;10:81–85. | ||
Akiyama K, Fujinami K, Watanabe K, Tsunoda K, Noda T. Internal limiting membrane peeling to prevent post-vitrectomy epiretinal membrane development in retinal detachment. Am J Ophthalmol. 2016;171:1–10. | ||
Baba T, Kakisu M, Nizawa T, Oshitari T, Yamamoto S. Superficial foveal avascular zone determined by optical coherence tomography angiography before and after macular hole surgery. Retina. 2017;37(3):444–450. | ||
Kumagai K, Furukawa M, Suetsugu T, Ogino N. Foveal avascular zone area following internal limiting membrane peeling for epiretinal membrane and macular hole compared to that of fellow eyes and healthy controls. Retina. Epub 2017 Aug 1. | ||
Kumagai K, Ogino N, Larson E. Mathematical function describing visual gain curves following vitrectomy for different macular diseases. Jpn J Ophthalmol. 2011;55(2):89–92. | ||
Hasler PW, Prünte C. Early foveal recovery after macular hole surgery. Br J Ophthalmol. 2008;92(5):645–649. | ||
Spaide RF. Closure of an outer lamellar macular hole by vitrectomy: hypothesis for one mechanism of macular hole formation. Retina. 2000;20(6):587–590. |
 © 2018 The Author(s). This work is published and licensed by Dove Medical Press Limited. The full terms of this license are available at https://www.dovepress.com/terms.php and incorporate the Creative Commons Attribution - Non Commercial (unported, v3.0) License.
By accessing the work you hereby accept the Terms. Non-commercial uses of the work are permitted without any further permission from Dove Medical Press Limited, provided the work is properly attributed. For permission for commercial use of this work, please see paragraphs 4.2 and 5 of our Terms.
© 2018 The Author(s). This work is published and licensed by Dove Medical Press Limited. The full terms of this license are available at https://www.dovepress.com/terms.php and incorporate the Creative Commons Attribution - Non Commercial (unported, v3.0) License.
By accessing the work you hereby accept the Terms. Non-commercial uses of the work are permitted without any further permission from Dove Medical Press Limited, provided the work is properly attributed. For permission for commercial use of this work, please see paragraphs 4.2 and 5 of our Terms.