")
Back to Journals » International Journal of Nanomedicine » Volume 17
Early Assessment of Atherosclerotic Lesions and Vulnerable Plaques in vivo by Targeting Apoptotic Macrophages with AV Nanobubbles
Authors Ma X, Wang J, Li Z, Zhou X, Liang X, Wang J, Duan Y , Zhao P
Received 19 July 2022
Accepted for publication 3 October 2022
Published 19 October 2022 Volume 2022:17 Pages 4933—4946
DOI https://doi.org/10.2147/IJN.S382738
Checked for plagiarism Yes
Review by Single anonymous peer review
Peer reviewer comments 2
Editor who approved publication: Professor Lei Yang
Xiaoju Ma,1,2,* Jia Wang,1,* Zhelong Li,1 Xueying Zhou,3 Xiao Liang,1 Junyan Wang,4 Yunyou Duan,1 Ping Zhao1
1Department of Ultrasonic Medicine, Tang Du Hospital, Air Force Medical University, Xi’an, 710038, People’s Republic of China; 2Ultrasonic Department, Lin Tong Rehabilitation and Convalescent Center, Lintong, 710600, People’s Republic of China; 3Ultrasonic Department, Air Force Hospital of Central Theater, Datong, 037006, People’s Republic of China; 4Department of Nuclear Medicine, Tang Du Hospital, Air Force Medical University, Xi’an, 710038, People’s Republic of China
*These authors contributed equally to this work
Correspondence: Ping Zhao; Yunyou Duan, Email [email protected]; [email protected]
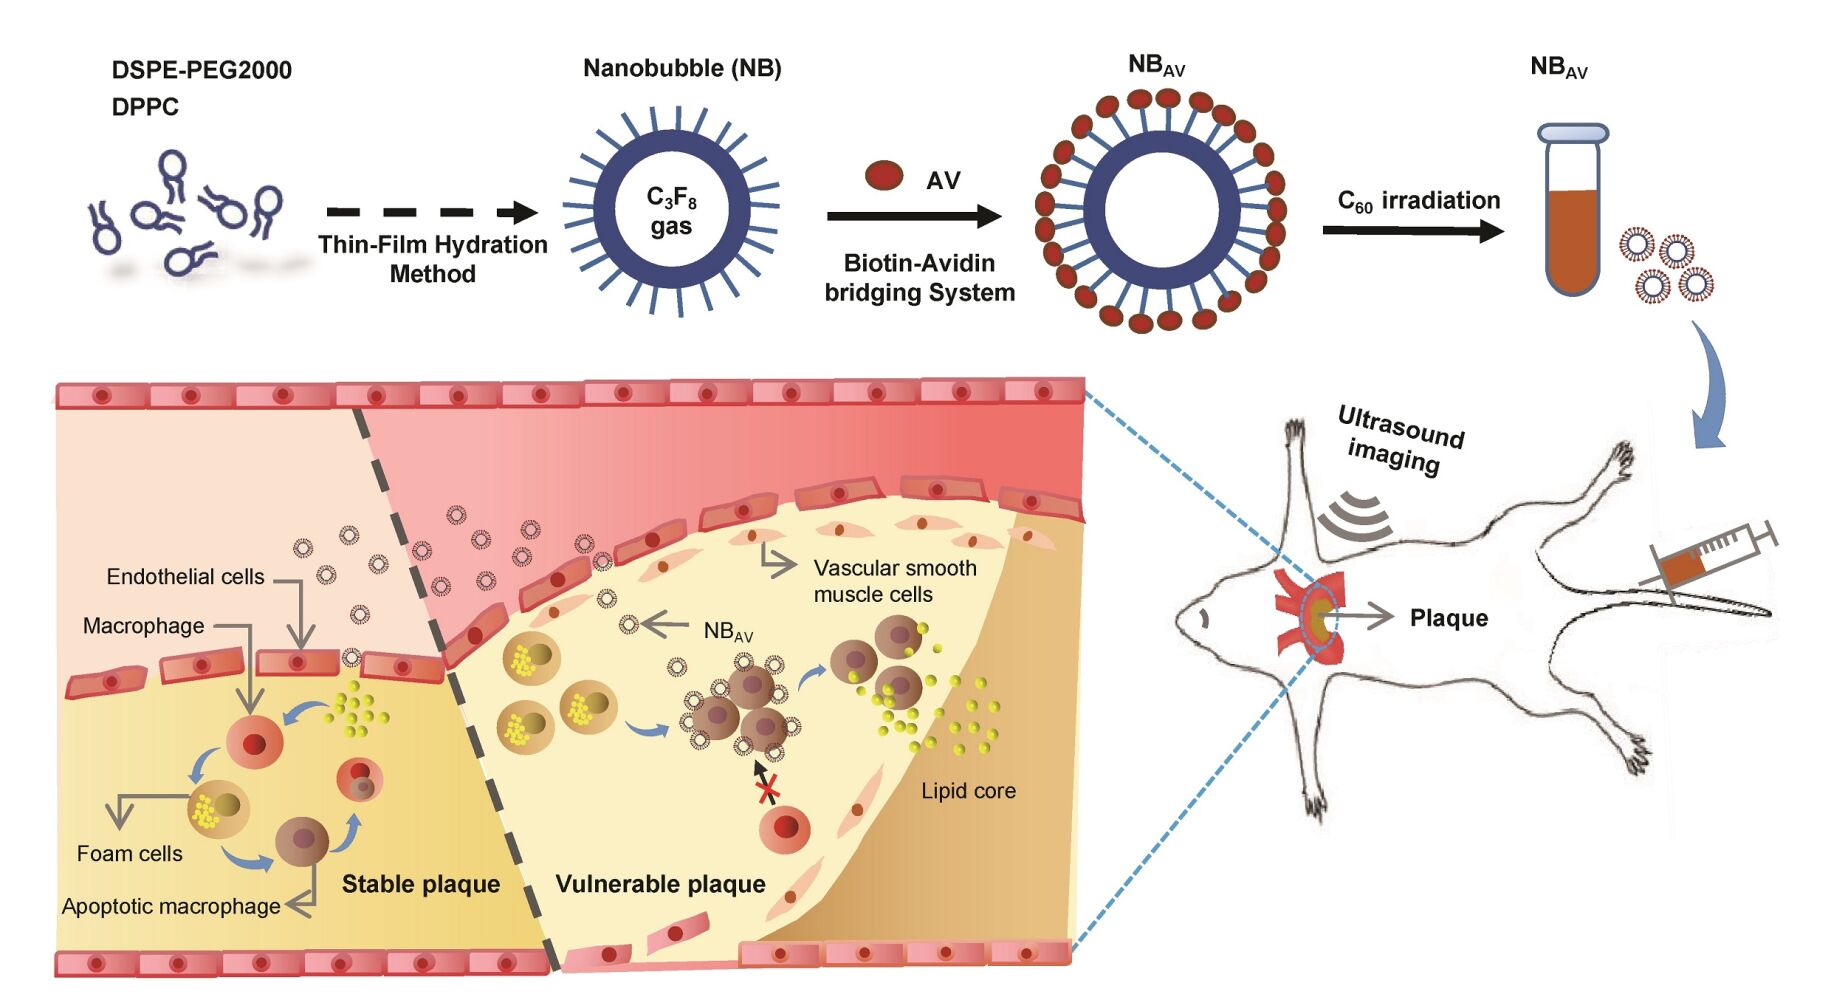
Background: The early detection of atherosclerotic lesions is particularly important for risk prediction of acute cardiovascular events. Macrophages apoptosis was significantly associated with the degree of AS lesions and especially contributed to plaque vulnerability. In this research, we mainly sought to explore the feasibility of a home-made AV-nanobubbles (NBAV) for visualization of apoptotic macrophages and assessment of atherosclerosis (AS) lesions by contrast-enhanced ultrasound (CEUS) imaging.
Methods: NBAV were prepared by “Optimized Thin-Film Hydration” and “Biotin-Avidin-Biotin” methods. Then, the characterization and echogenicity of NBAV were measured and analyzed in vitro. The targeting ability of NBAV to ox-LDL–induced apoptotic macrophages was observed by laser scanning confocal microscope. The ApoE−/− mice mode fed with high fat diet were observed by high-frequency ultrasound, microanatomy and oil red O staining. CEUS imaging in vivo was performed on AS plaques with NBAV and NBCtrl injection through the tail vein in turn in ApoE−/− mice. After CEUS imaging, the plaques were confirmed and analyzed by histopathological and immunological assessment.
Results: The prepared NBAV had a nano-scale size distribution with a low PDI and a negative zeta potential. Moreover, NBAV showed an excellent stability and exhibited a significantly echogenic signal than saline in vitro. In addition, we found that NBAV could target apoptotic macrophages induced by ox-LDL. Compared with NBCtrl, CEUS imaging of NBAV showed strong and sustained echo enhancement in plaque area of aortic arch in vivo. Further research showed that NBAV sensitive plaques presented more significant pathological changes with several vulnerable plaque features and abundant TUNEL-positive area.
Conclusion: NBAV displayed a sensitive indicator to evaluate apoptotic macrophages, indicating a promising CEUS molecular probe for AS lesions and vulnerable plaques identification.
Keywords: atherosclerosis, vulnerable plaques, macrophage, apoptosis, AV-nanobubbles
Graphical Abstract:
Introduction
Numerous studies have demonstrated that acute cardiovascular events were directly associated with rupture of atherosclerosis (AS) vulnerable plaques.1–3 Therefore, it is significant to predict the AS lesions severity and particularly the vulnerability of plaques at early stages, which may have a positive impact on prevention of acute events as soon as possible. At present, the attention of the scientific community has focused on the development of higher sensitivity and specificity new tools on this issue.3–6
Apoptosis was a key process in the pathogenesis of AS diseases7–9 and a decisive factor in the progression of stable plaque lesions to vulnerable plaque lesions.10 Several cell types that co-inhabit the atheroma can undergo apoptosis, including macrophages, smooth muscles cells, and endothelial cells.11–13 As the main innate immune cells, macrophages were the first inflammatory cells invaded in AS lesions and could be recruited in large numbers during the development of atherosclerotic plaques.14–16 The intraplaque macrophages undergo apoptosis during all stages of AS lesions.17 Numerous apoptosis of macrophages promotes thinning of the fibrous cap and the development of the necrotic core.18 Therefore, we reasoned that noninvasive detection of apoptosis could be used to identify AS lesions severity and instability or vulnerability of atherosclerotic plaques.
Currently, molecular imaging can show specific biological pathways or cellular processes for a better understanding of the molecular events responsible for plaque destabilization.19,20 Ultrasound molecular imaging technology presented great potentials to characterize and image the occurrence and development of diseases on the molecular level.21–23 In particular, the development of a wide range of imaging contrast agents, functionalized with targeting ligands such as antibodies, peptides or aptamers,24,25 could be promising for probing the molecular biomarkers of the atherosclerotic processes, promoting the translational potential of novel technologies. During apoptotic cell death, the phosphatidylserine (PS) exposed on the surface of cell membrane.9 Annexin V can selectively bind to the externalized PS with high affinity (Kd in the range of 0.1~2 nm).26 AV as an imaging agent for vulnerable atherosclerotic plaques has been reported in MRI, SPECT and other molecular imaging modes,27,28 but not in ultrasound imaging. In this study, we used AV-nanobubbles (NBAV) for the assessment of apoptosis in atherosclerotic lesions and analysis of its ability to identify vulnerable plaques in an experimental mice model.
Materials and Methods
Materials and Reagents
1.2-dipalmitoyl-sn-glycero-3-phosphocholine (DPPC) was purchased from Sigma-Aldrich (St.Louis, US) and 1.2-distearoyl-sn-glycero-3-Phosphoethanolamine-N-[biotinyl (Polyethylene Glycol) 2000] (DSPEPEG2000-Biotin) was from Avanti Polar Lipids, Inc. 1, 1′-Dioctadecyl-3, 3, 3′, 3′-tetramethylindocarbocyanine perchlorate (DiI) in powder form was purchased from Molecular Probes (Eugene, OR, USA). Cell proliferation and toxicity detection kit was obtained from 7 sea Pharmaceutical Co. Ltd. High oxidized low-density lipoprotein (LDL) was purchased from Yiyuan Biotechnology (Guangzhou, China), and mouse tissue factor ELISA kit was purchased from Jiangsu Jingmei Biotechnology Co. Ltd. Hoechst 33,342 was purchased from beyotime Technology (Shanghai, China) and chloroform was purchased from Kehao Co. Ltd. Cell counting kit-8 (CCK-8) was purchased from boster Bioengineering Co., Ltd. (Wuhan, China). Fetal bovine serum (FBS), Dulbecco’s modified Eagle’s medium/high glucose (DMEM/high glucose), phosphate buffered saline (PBS) and penicillin-streptomycin (double antibody) were purchased from GE Healthcare Life Sciences (hyclone). DAPI, anti-CD68 mouse mAb, anti-alpha smooth muscle actin mouse mAb and Cy3 labeled goat anti-mouse IgG (secondary antibody) were provided by Servicebio. All other chemicals were analytical grade and did not require further purification when used. Homozygous apolipoprotein E knockout mice (ApoE−/−) mice (SPF grade, 6–8 weeks of age) were purchased from Vital River Laboratory Animal Technology Co. Ltd. (Beijing, China). Murine macrophage cell line (RAW264.7) was purchased from ATCC.
Preparation of NBAV
The Nanobubbles (NBs) were prepared with optimal thin-film hydration method as previously reported.25 In order to get bubbles of uniform size, the synthesised NBs were filtered through fixed aperture (nuclear pore membrane) filter. Then NBAV were obtained by coupling the Bio-AV molecules to the surface of NBs with the “biotin-avidin-biotin” method. Briefly, 2.5 μL of Bio-AV (0.5 mg/mL) was firstly conjugated to 7.5 μL of streptavidin (0.5 mg/mL, Invitrogen) by incubation and slight oscillation at 4 ℃ for 20 min. Excessive streptavidin allows conjugated streptavidin-Bio-AV with free sites to bind NBs. Subsequently, the mixture was incubated with 500 μL of diluted NB (8.0 ± 0.8×10⁸ bubbles/mL) at room temperature for 30 min. Finally, the resulting solutions were placed on ice to induce stratification, and the targeted NBAV suspensions were acquired by isolating the upper-middle layer. Theoretically, there would be two hundred AV molecules on the surface per NBAV. NBAV was sterilized by CO60 irradiation for 15 min and then stored at 4 ℃ for the following experiments.
Characterization of NBAV
The morphology of NBAV was observed by scanning electron microscopy (SEM, S-4800, HITACHI, Japan) and the images were captured by software (HITACHI S-4800, PC-SEM). During the NBAV preparation, the lipid dye DiI (5 μM) was dissolved in the lipid solution for better observation. All other procedures remained the same. The obtained NBAV were examined under a fluorescence microscope (Olympus CKX53, Japan), and images were captured (Camera: Olympus CCD DP74).
The characterization of NBAV, such as size distribution, zeta potential, polydispersity index and stability of NBAV, were measured as described below. The diluted NBAV (4.5 ± 1.0×10⁸ bubbles/mL) solutions were kept at 4 ℃, and then the size distribution was analyzed after 0, 12, 24, 36, 48, 60 and 72 h, respectively, by a NanoPlus-3 zeta/nano particle analyzer (Micromeritics Instrument CORP, USA). Furthermore, 1mL of NBAV stock solution was diluted with a 9 mL mixture of PBS (0.01 M) and fetal bovine serum (10%, FBS, HyClone, USA), and then size was measured after 0, 20, 40, 60, 80, 100 and 120 min at 37 ℃. The zeta potential of NBAV was also measured with this analyzer. All the experiments were repeated three times.
Echogenicity of NBAV in vitro
To characterize the echogenicity of NBAV in tissue, a custom-designed tank was included in which the cylindrical tank consisted of agar-based material that can produce a reference echo signal mimicking tissue. This tank (3 cm in diameter, 3 cm in height, 0.5 cm in thickness) was fabricated with an agarose gel (1% agarose, 99% H2O). 2 mL of NBAV suspension was injected into the tank and then measured using a VisualSonics Vevo 2100 Ultrasound System (FUJIFILM, Toronto, Canada). A MS250 linear array ultrasound probe was placed perpendicular to the gel tank (mechanical index, MI <0.1) for echogenicity. Equal volumes of saline were included as control. Quantitative analysis of the echo intensity was performed by Image J software.
Targeted Binding of NBAV to Apoptotic Macrophages in vitro
RAW264.7 cells were cultured in Dulbecco’s modified Eagle medium/high glucose (DMEM/high glucose) containing 10% heat inactivated fetal bovine serum and 1% penicillin/streptomycin in a 37 ℃ incubator containing 5% CO2.
To establish apoptotic model of macrophages in vitro, RAW246.7 cells were inoculated with 2.5×10⁵ cells/mL in 6-well plates (2 mL per well) for routine culture for 24 h, and then replaced with the same amount of serum-free medium for another 12 h. Next, these cells were treated with high ox-LDL at different concentrations (50 µg/mL, 75 µg/mL, 100 µg/mL) or control PBS buffer solution for 12 h, respectively. After that, the cells were randomly divided into two parts. One part of cells were collected and then stained according to the apoptosis detection kit of manufacturer’s instructions (Key GEN Biological Technology Co., Nanjing, China). The ratio of apoptosis was measured by flow cytometry and analyzed quantitatively using Flow Jo software. The other part of cells were used for immunofluorescence assay. Briefly, 100 µL DiI-labeled NBAV were added into cells for 0.5 h and then washed with PBS twice. The cell nucleus was labeled with DAPI. The fluorescent imaging was viewed by a confocal laser scanning microscope (SP8, leica, Germany). The quantitative assay was performed from five random view fields of fluorescent images and the number of macrophages targeted by NBAV from per 10 cells from these five random view fields.
Animal Model of AS Plaque
All animal experiments were performed under protocols approved by the Animal Care and Use Committee of Fourth Military Medical University and comply with the NIH Guide for the Care and Use of Laboratory Animals (8th edition, 2011). Twenty male ApoE−/− mice aged 6–8 w (24.82 ± 0.26 g) were fed in separate cages at 20 ± 2 ℃ with 45% relative humidity and a daily 12/12 light/dark cycle. After one week of normal diet, the mice were switched to be fed with high fat diet (MD12015, containing 21% milk fat, 0.15% cholesterol, Jiangsu Medicience Ltd.) for at least 8 weeks to induce the formation of atherosclerotic lesions. C57 mice fed with similar diet were used as control group.
For observation of AS plaques of ApoE−/− mice, high-frequency ultrasound imaging was performed. In brief, the ApoE−/− mice were anesthetized with isoflurane and then imaged by Vevo 2100 high-frequency ultrasound imaging (Visual Sonics, Canada) with 18–38 MHz high-frequency linear array probe (MS 400). The evaluation of plaque was performed every two weeks to observe the thickness and echo intensity of the intima-media of the arteries, the presence of plaques, echo and shape of plaques (especially aorta and carotid artery).
For assessment of lipid deposition, the mice (n = 3) were anesthetized with intraperitoneal injection of 100 μL 4% pentobarbital sodium and then killed by dragging the neck. The heart and aorta, including partial carotid artery, were exposed and cleaned from surrounding adipose tissues. Aortic arch bifurcation images were captured by a digital camera equipped with a stereomicroscope. Subsequently, the aorta-to-iliac bifurcation was isolated and stained with oil-red-O according to the routine protocol. The area of lesions and the size of lipid core were measured by Image J software.
Contrast-Enhanced Ultrasound (CEUS) Imaging of NBAV
The ApoE−/− mice fed with high fat diet (n = 5) more than 8w were kept in a supine position and anesthetized with isoflurane (2% induction, 1.2% maintenance) before ultrasonic imaging. Then, the anesthetized mice were placed on temperature-controlled heating pads to maintain normal body temperature, and depilated from neck to the lower abdomen. CEUS imaging was performed by Vevo 2100 high-frequency ultrasound apparatus with a MS250 scanning probe (13~ 24 MHz). First, the optimal imaging view of atherosclerotic plaque was selected by two dimensions mode. Then, the imaging modality was switched to ultrasound contrast enhanced mode, simultaneously the imaging parameters were adjusted to maximize visualization of the contrast signal. The atherosclerotic mice (n = 10) received 150 mL NBAV injection via tail vein in random order. Real-time imaging was performed from 10s to 10 min after injection. During CEUS imaging, the heart rate of mice was maintained at 360–420 beats/min and the respiratory curve was kept stable. The contrast intensity was recorded synchronously and all the images of artery plaque in the areas of interest (AOI) were stored without delay. Twenty-four hours after injection of NBAV, the same mice received equal volume of control NBs (NBCtrl) for observation the artery plaque in AOI again. All of the other parameters were held constant. Contrast intensities of AOI in all images were analyzed at defined time points using software program (Vevo Lab). Quantitative analyses of the mean grayscale intensities were performed with software (Image J). Finally, AS plaques were grouped according to imaging performance of NBAV and NBCtrl.
Analysis of Apoptosis ex vivo
After CEUS imaging, the mice were processed for analysis of apoptotic area in atherosclerotic plaques. The ApoE−/− mice were randomly sacrificed. Then, the arteries in AOI were sliced and stained for the TdT-mediated dUTP-biotin nick end-labeling (TUNEL) assay (Roche Diagnostics Corp.) by immunofluorescence examination. The C57 mice fed with high fat diet were control groups. TUNEL positive cells were viewed by a confocal laser scanning microscope (Carl Zeiss, Germany). The immunofluorescent intensity was analyzed with ImageJ software.
Histopathological and Immunological Staining
In order to verify the results of CEUS imaging and further analyse the plaque characterization, the histopathological and immunological assay of AOI plaques were performed. The mice after CEUS were anesthetized with injection of 100 μL 4% pentobarbital sodium and then perfused with PBS. According to the ultrasonic localization and CEUS imaging results, the place of AS plaque areas with different imaging performance were prepared for arterial pathological specimens. The aorta and carotid in AOI were dissected and post-fixed at 4% paraformaldehyde for 24 h.
For histopathological assay, the samples were embedded in paraffin and sectioned at 8 μm. The histological changes were analyzed by H&E staining. Masson’s trichrome was used for collagen staining. The area of lipid deposition in lesions was stained with Oil-red-O. All the slides were scanned by a Pannoramic Scanner (P250, 3D HISTECH, Hungary). The percentage of lesion area in histopathological image was calculated with computer-assisted morphometric analysis system ImageJ.
For immunofluorescence assay, the aorta and carotid in the AOI were extracted for frozen section to detect the content of macrophages and smooth muscle cells. The sections were incubated with anti-α-SMA antibody and anti-CD68 antibody (1:200, Abcam), respectively, for 24 h at 4 ℃, and then washed, followed by incubation with corresponding secondary antibodies for 30 min at 37 ℃. DAPI was used to restain the nuclei. The fluorescent imaging was viewed by a confocal laser scanning microscope. The entire process was conducted in the dark. Quantitative analyses of the mean fluorescence intensities were performed with software (Image-Pro Plus). In all above-mentioned experiments, the plaque of aorta and carotid arteries outside the AOI were used as control group. The artery of C57 mice were set as negative control. All of the other operation procedures were held constant.
Statistical Analysis
All quantitative data were expressed as mean ± SD (standard deviation) from at least three independent experiments unless otherwise stated. The statistical significance was determined with Student’s t-test or one-way ANOVA using GraphPad Prism 6.0 software (GraphPad, San Diego, CA). Data with uneven variances were corrected by Welch test. The level of statistical significance was set at P < 0.05.
Results
Characterization of NBAV
As shown in Figure 1A, the lipid membranes after oscillatory shedding were thin and translucent. The NBAV suspension was visibly creamy white and stratified after standing (Figure 1B). The NBAV were monodisperse spherical particles with a diameter of about 500 nm by SEM (Figure 1C). NBAV labeled with DiI presented scattered red fluorescent spots under fluorescence microscope (Figure 1D). The results of particle size analyzer showed that NBAV had a size distribution of 519.9 ± 9.4 nm with a polydispersity index (PDI) of 0.142 ± 0.038 and Zeta potential of −22.04 ± 2.1 mV (Figure 1E and F). Under 4℃, the particle size of NBAV did not change significantly within 48h, and then gradually increased at 60h (627.47 ± 20.81 nm) (Figure 1G). After 120 min of storage at 37 ℃, the particle size stabilized within ~650 nm. Therefore, NBAV prepared within 48 h was selected for subsequent experiments (Figure 1H). As illustrated in Figure 1I, the experimental setup is a custom-designed agarose mold, which was used as model simulating tissue in vitro. The NBAV exhibited a significant echo signal (Figure 1J) with intensity of 120.10 ± 2.13 (gray-scale), which was higher than that of saline (8.66 ± 0.25, P < 0.01, Figure 1K and L), indicating that the NBAV can be used for subsequent in vivo ultrasound molecular imaging studies.
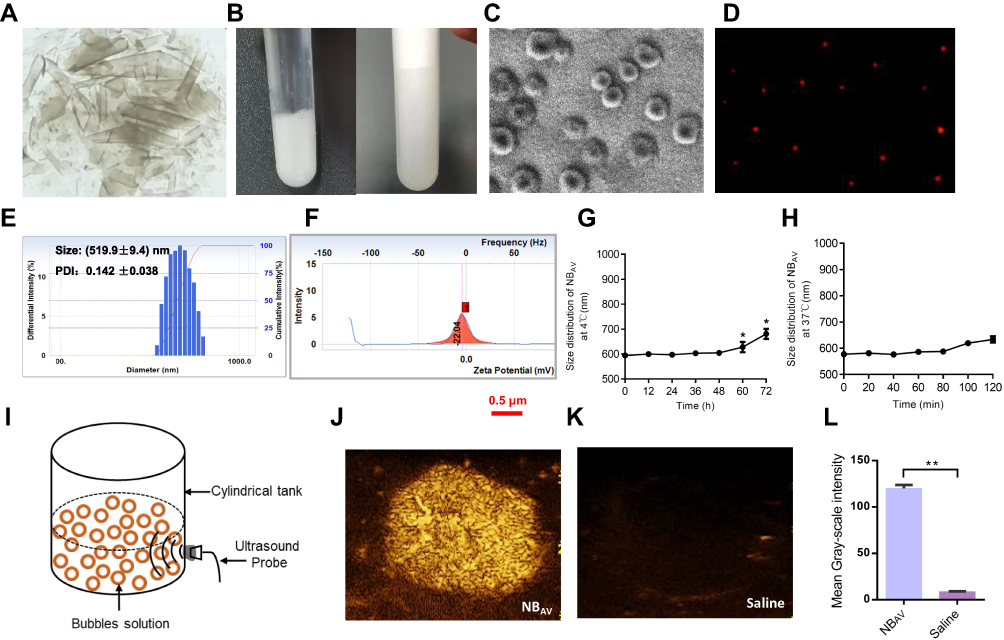 |
Figure 1 Characterization of NBAV. (A) The thin and translucent lipid membrane prepared by optimized film hydration method. (B) Milky white NBAV suspension (left panel) and stratified NBAV suspension after dilution (right panel). (C and D) Morphology of NBAV under SEM and Fluorescence microscopy. (E and F) The average particle size, PDI and Zeta potential of NBAV. (G and H) Size distribution of NBAV at 4 ℃ and 37 ℃. (I) Cylindrical agarose experimental device for simulating tissue echo in vitro. (J and K) The echogenicity images of NBAV and saline in vitro. (L) Quantitative analysis of echo intensity (gray-scale). *P < 0.05, **P < 0.01. |
Targeting of Macrophage Apoptosis by NBAV in vitro
To induce apoptosis in vitro, RAW246.7 cells were exposed to the different concentrations of ox-LDL for 12 h. The ox-LDL treatment has been shown to markedly induce apoptosis of RAW246.7 cells (Figure 2A), with the apoptotic proportion of 28.22 ± 1.10% (50 μg/mL), 56.77 ± 1.90% (75 μg/mL) and 65.52 ± 1.50% (100 μg/mL), compared with 2.05 ± 0.50% in the control group (P < 0.05, Figure 2C). The apoptosis rate of RAW264.7 cells induced by the 100 µg/mL concentration of ox-LDL was slightly higher than that of 75 µg/mL concentration group, no significant difference between them (P > 0.05, Figure 2C). Therefore, ox-LDL was used at 75 µg/mL of concentration in the following experiments.
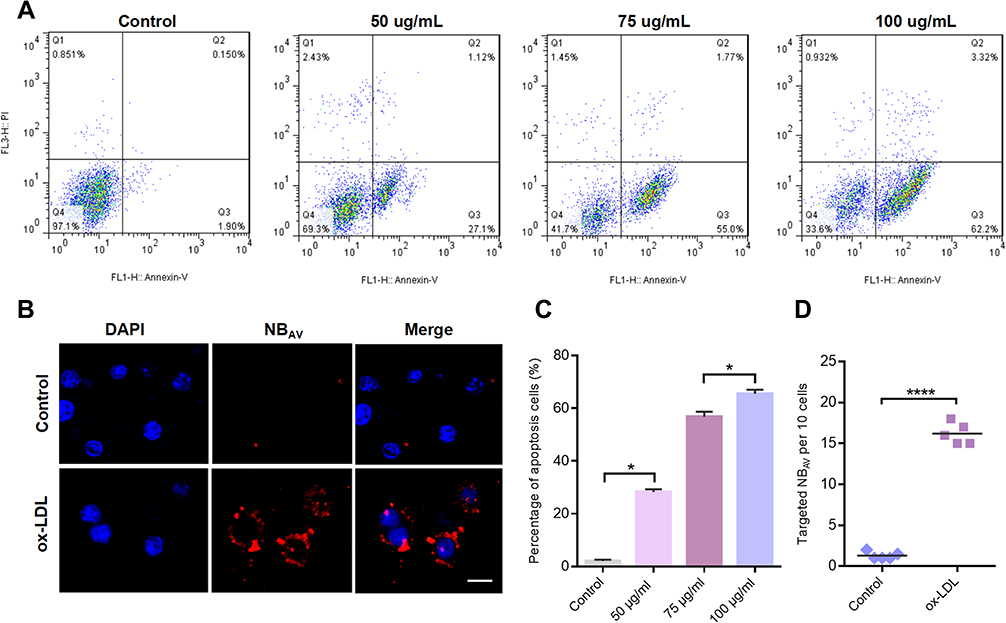 |
Figure 2 NBAV targeted macrophage apoptosis induced by ox-LDL in vitro. (A) Flow cytometry analysis of the percentage of apoptotic macrophages induced by different concentrations ox-LDL. (B) Representative images of targeted binding of NBAV to macrophages induced by ox-LDL. NBAV were labeled with DiI. Nuclei were stained with DAPI. Scale bar = 20 μm. (C) Quantification of the apoptotic index. *P < 0.05. (D) Quantitative assay of the number of macrophages targeted by NBAV from per 10 cells from five random view fields. ****P < 0.0001. |
To explore the targeting capability of NBAV on the apoptotic cells in vitro, the RAW264.7 cells were induced by 75 µg/mL ox-LDL for 12 h. As shown in Figure 2B, under confocal laser microscope, a large number of DiI-labeled NBAV accumulated on the cell surface, while nothing was observed in the control group (P < 0.01, Figure 2D). These results indicated that the NBAV could recognize the apoptotic macrophages in vitro.
Atherosclerotic Plaque Model
The two-dimensional ultrasonography was used to show the AS plaques. After 4–6 weeks of high fat feeding, the artery of ApoE−/− mice showed echo-enhanced arterial intima-media membrane, and appeared in the atherosclerotic plaque after 8–10 weeks. Figure 3A–D showed the representative images of normal and obvious plaques in longitudinal and transverse views of major artery, such as brachiocephalic artery, aortic arch, carotid artery and its branches. Compared with the control arteries, the atherosclerotic arteries presented intima-media thickness or different echogenic and sizes plaques in the lumen (Figure 3A–D). Among them, the atherosclerotic plaques of brachiocephalic artery (Figure 3B) and aortic arch (Figure 3C and D) were the most easily displayed.
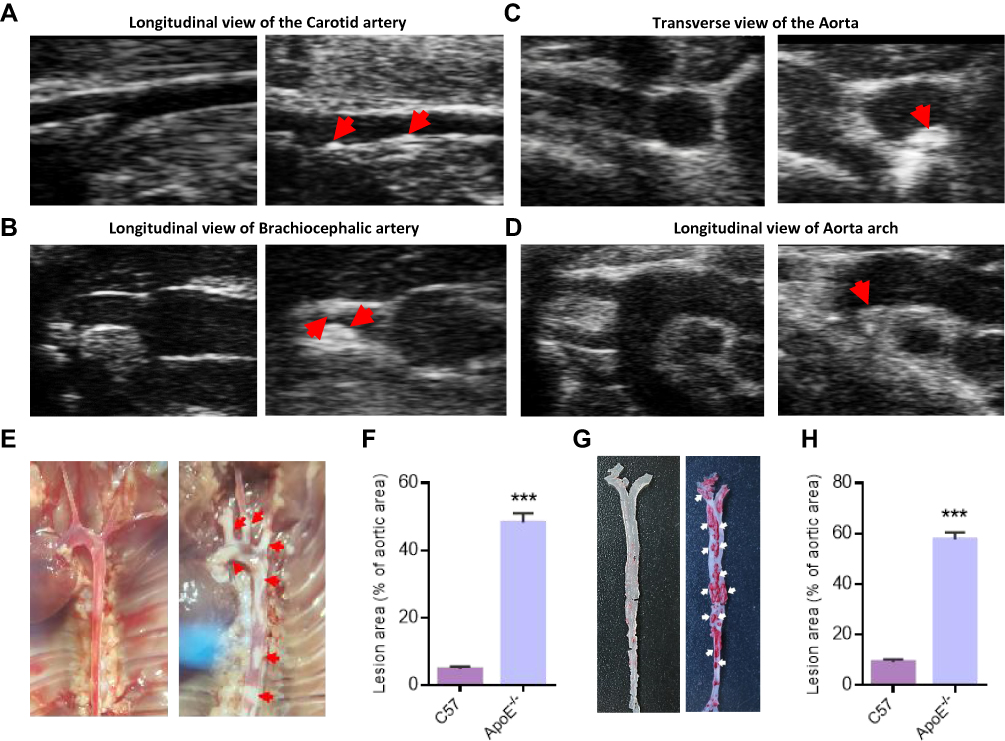 |
Figure 3 Atherosclerotic plaque model. (A) Longitudinal view of carotid artery. Control C57 mice (left panel) and atherosclerotic plaque in ApoE−/− mice (right panel, red arrow). (B) Longitudinal view of brachiocephalic artery. Control C57 mice (left panel) and atherosclerotic plaque on anterior and posterior wall (right panel, red arrow). (C) Transverse view of aorta. Control C57 mice (left panel) and atherosclerotic plaque on the side of small Bend (right panel, red arrow). (D) Longitudinal view of aorta arch. Control C57 mice (left panel) and atherosclerotic plaque on the side of small Bend (right panel, red arrow). (E) The gross view of arteries under anatomical microscope in control C57 mice (left panel) and ApoE−/− mice (right panel). Red arrows indicate plaques. (F) Percentage of the atherosclerotic area from (E). (G) Representative images of Oil-red O staining of arteries in control C57 mice (left panel) and ApoE−/− mice (right panel). White arrows indicate red dyed lipids. (H) Quantitative analysis of the atherosclerotic lesion area of (G). ***P < 0.001. |
From the gross view of anatomical microscope, a large number of milky lipids were observed on the arterial wall of ApoE−/− mice, especially at the lesser curvature of the aortic arch and the beginning of the carotid artery (Figure 3E), but few in control mice. The difference was statistically significant (48.23 ± 1.58% vs 4.764 ± 0.43%, P < 0.001, Figure 3F). In addition, the results of oil-red O staining of arteries ex vivo showed that ApoE−/− mice fed with high-fat diet had a large number of red stained positive lipid distribution in the aorta and its branches (Figure 3G), and the positive area was significantly higher than that in the control group (56.67 ± 1.62% vs 9.17 ± 0.61%, P < 0.001, Figure 3H).
CEUS Imaging in vivo
As shown in Figure 4A, the transverse view of the aortic arch was used to observe the echo enhancement and residence time of plaques (areas of interests, AOI) after NBAV and NBCtrl injection. Specific results are as shown in Figure 4B, within 10s after injection of NBCtrl and NBAV, obvious echo filling could be seen in the vascular lumen. The change of the echo signal for NBAV was consistent with that for NBCtrl at 10s injection in plaque area (130.67 vs 126.00, t = 3.8829, P = 0.018, Figure 4C). After 1~5 min injection, the echo of NBCtrl in vessel lumen and plaque gradually decreased, but strong echo of NBAV still existed in the plaque area. After 10 min injection, the echo of NBCtrl in lumen and plaque area both disappeared, but the echo signal intensity in plaque area of NBAV still existed and far higher than that of NBCtrl (72.67 ± 10.2 vs 22.00 ± 5.2, t = 18.17, P < 0.001, Figure 4D). According to the results of CEUS imaging, plaques with different performance of CEUS in NBAV and NBCtrl were included in the group of NBAV sensitive plaques, and that with similar performance of CEUS were incorporated in the group of NBAV insensitive plaques.
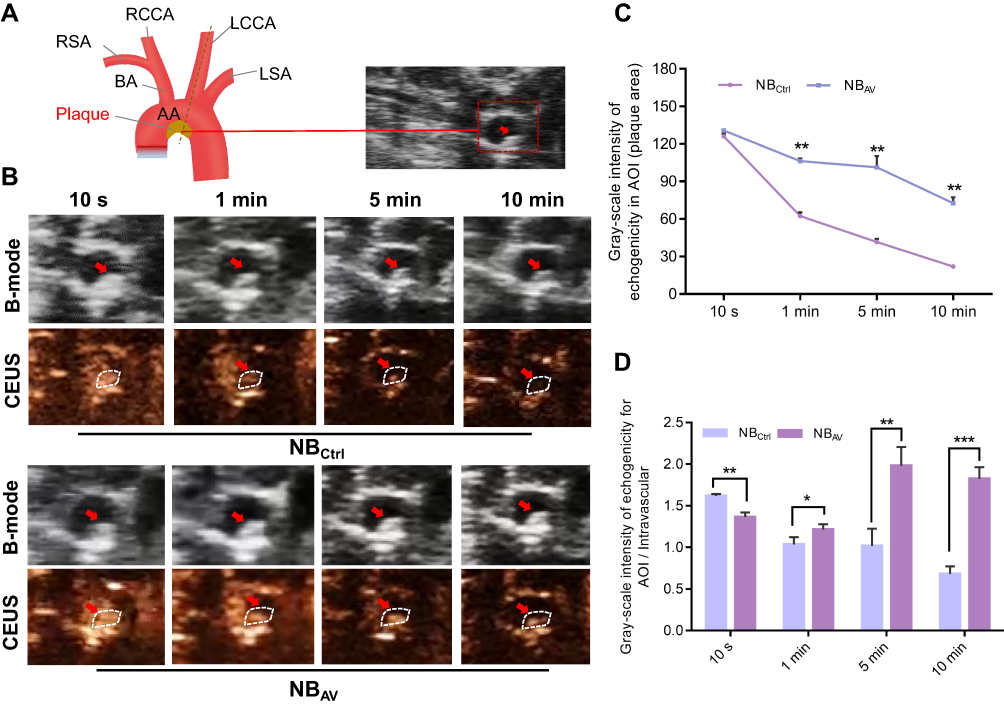 |
Figure 4 CEUS imaging of aorta arch (AA) in ApoE−/−mice. (A) Schematic illustration of the AA with its diverging branches (left panel) and two-dimensional ultrasonography of the aorta with AS plaque (right panel). Right common carotid artery (RCCA); Left common carotid artery (LCCA); Right subclavian artery (RSA); Left subclavian artery (LSA); Brachiocephalic trunk artery (BA). (B) B-Mode and CEUS imaging at the indicated time after intravenous injection of NBAV and NBCtrl, respectively. The representative atherosclerotic lesions were set as areas of interests (AOI, white dotted circles). (C) Quantitative analysis of the time-dependent contrast-enhanced intensity curve in AOI. (D) Quantitative analysis of time-contrast enhancement intensity in AOI area/vascular lumen. Data were expressed as mean ± SD. *P < 0.05, **P < 0.01, ***P < 0.001. |
Histopathological Results
Normal vascular endothelium is tightly and neatly arranged, but atherosclerotic vessels presented significant morphological changes, as seen from a large amount of vacuolar adipose tissue with disordered structure by HE staining, particularly the NBAV sensitive plaques (Figure 5A). Oil red O staining showed increment of atherosclerotic burden with abundant red stained lipid distribution in atherosclerotic arteries (Figure 5B). Compared with the NBAV insensitive plaques, the NBAV sensitive plaques has a larger area of OiI-Red-O lipid-positive areas (Figure 5D, P < 0.05). Compared with control plaque, atherosclerotic vessels showed lesser blue stained collagen fibers with more significant performance in the NBAV sensitive plaques (Figure 5C and E, P < 0.01).
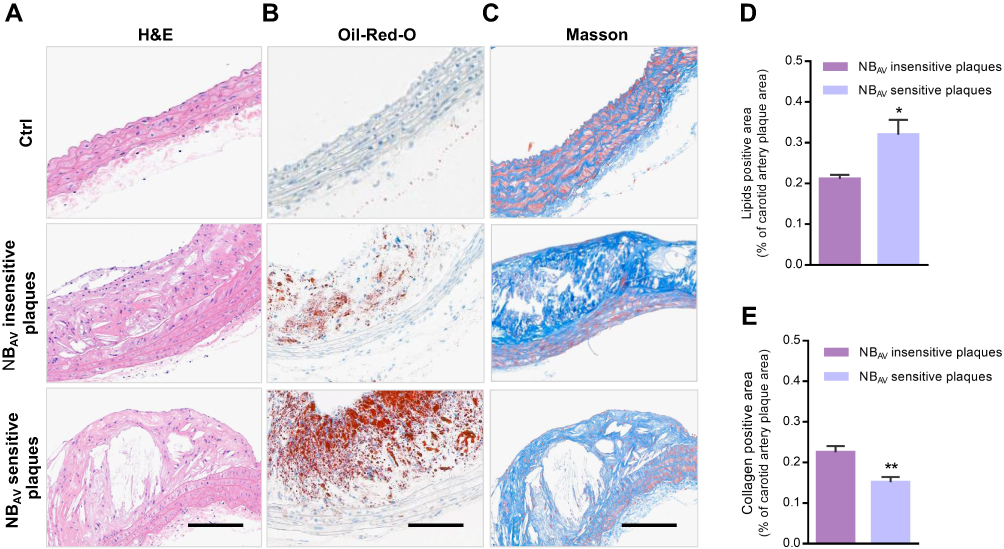 |
Figure 5 Histopathological staining of atherosclerotic plaques. (A–C) Representative images of normal control, NBAV insensitive plaques and NBAV sensitive plaques with H&E staining, Oil red O staining and Masson’s trichrome staining, respectively. (D and E) Quantitative analysis of OiI-Red-O lipid-positive areas and collagen-positive areas. Scale bar = 200 μm. *P < 0.05, **P < 0.01. |
Immunofluorescence Results
Figure 6A and B showed the immunofluorescence results of CD68 and α-SMA, which were specific markers of macrophages and smooth muscle cells, respectively. As expected, we found that reduced α-SMA expression and more CD68 positive cells near the vascular lumen within the NBAV sensitive plaques. By comparison, NBAV insensitive plaques did not find the above significant features. Further quantitative analysis revealed that the percentage of CD68 positive cells in NBAV sensitive plaques was significantly higher than that in NBAV insensitive plaques (14.73 ± 2.34% vs 7.30 ± 0.81%, P < 0.05, Figure 6D), but the percentage of α-SMA positive cells was opposite between them (4.80 ± 0.40% vs 11.50 ± 1.50%, P < 0.05, Figure 6C). In addition, abundant TUNEL-positive cells were observed in NBAV sensitive plaques and a significant difference with that of control mice was observed (P < 0.05, Figure 6E and F).
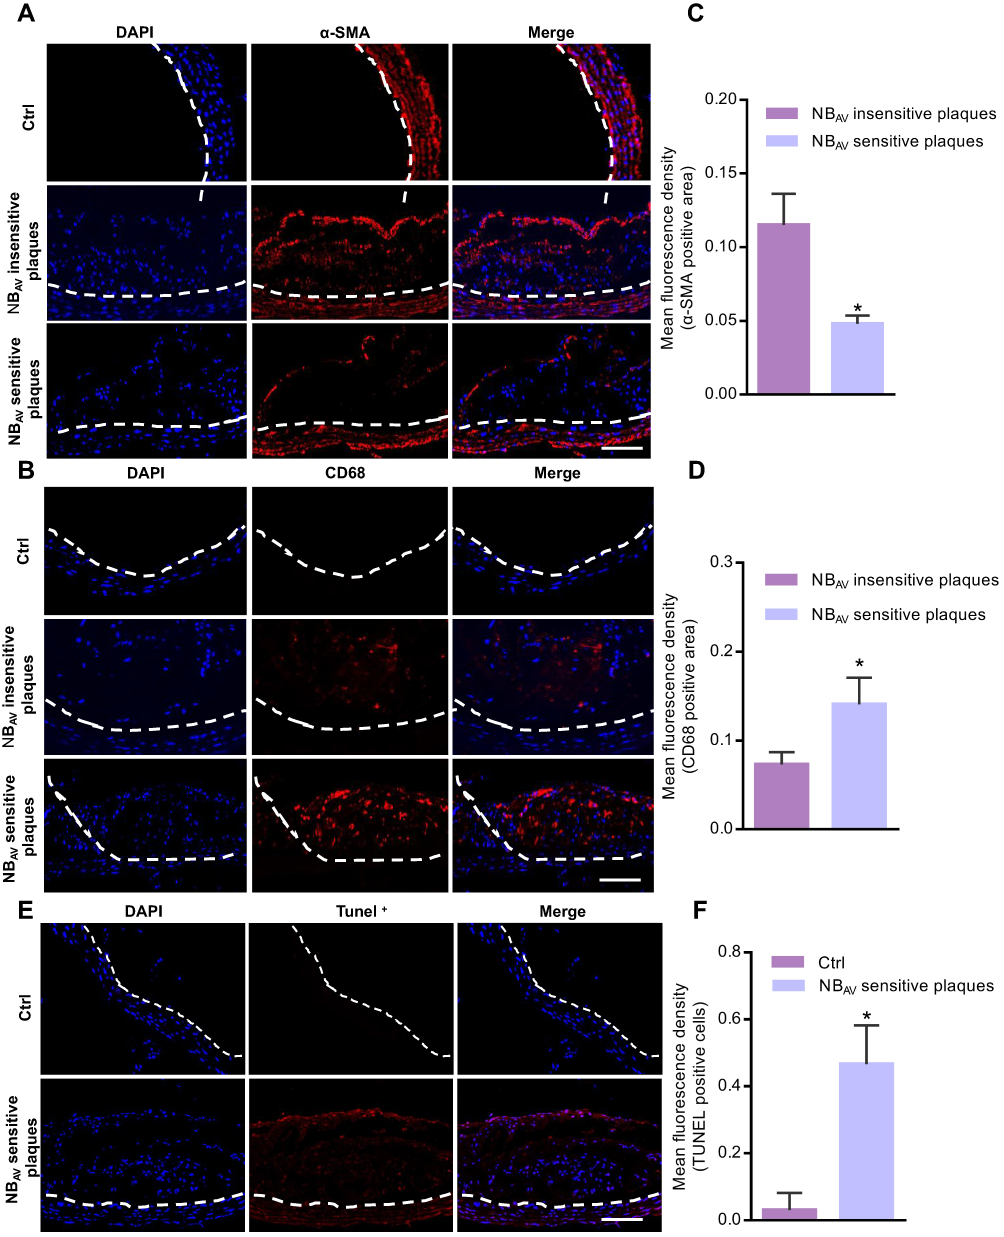 |
Figure 6 Immunofluorescence examination of atherosclerotic plaques. (A and B) Representative images of plaques as labeled with α-SMA and CD68 antibody in ApoE−/− mice. (C and D) Quantification data of α-SMA positive area and CD-68 positive area, respectively. (E) TUNEL positive apoptotic cells in NBAV sensitive plaques group and control group. (F) Quantitative analysis results of Tunel positive cells. Data were expressed as mean ± SD (n = 3). Scale bar = 100 μm. *P < 0.05. |
Discussion
At present, the mechanisms underlying the transition of atherosclerosis stable plaques to clinically significant lesions are currently not fully clear, which involve a complex interplay of several biological processes, including inflammation, matrix remodeling, angiogenesis and apoptosis.29,30 In plaques, several biological processes occurred simultaneously, such as lipid accumulation, cell proliferation, apoptosis, extracellular matrix degradation, and repair. The balance among these processes is essential for plaque progression and clinical outcome. According to a new clinical study, only apoptosis (particularly of macrophages and SMCs) was significantly associated with a younger physical plaque age.7 As was proved by many researches, apoptosis was a prominent feature of advanced atherosclerotic plaques.8,31,32 These findings support the importance of apoptosis in plaque progression, unravelling its potential use for diagnostic and therapeutic strategies for patients with fast-progressing plaques.
As we know, several kinds of cells undergo apoptosis during plaque formation, including smooth-muscle cells and endothelial cells. However, macrophages are implicated in all stages of atherosclerotic lesion development and play a critical role in the initiation and development of AS.33,34 As mentioned before, macrophage apoptosis is a key cellular event in the development of early atherosclerotic lesions into vulnerable plaques, which determines the vulnerability of plaques to a certain extent,35 and provides a more specific potential target for ultrasonic molecular imaging in the pathological process of plaques. Detection of macrophage apoptosis may help identify AS lesions severity.7,9,36 Annexin V-PS conjugates serve as an indicator of the early stages of apoptosis.25,37 In this research, we prepared nanoscale bubbles carrying apoptosis molecular probe AV by optimized film hydration and “biotin-avidin” methods, as previously reported.25 The NBAV has a diameter of 519.9 ± 9.4 nm with a very low PDI value and excellent stability under 4 ℃ and 37 ℃. In addition, we found that NBAV could target apoptotic macrophages induced by ox-LDL and exhibited a high echogenicity signal intensity in vitro. These results confirmed that NBAV may potentially be used as a targeted ultrasound contrast agent for in tissue applications.
Studies have shown that neovascularization within plaque is fragile and permeable probably due to the lack of mural cells and poorly formed endothelial cell junctions.38–41 The normal vascular physiology results in tight (<2 nm) endothelial junctions, which will restrict nanoscale particle distribution, whereas a dysfunctional endothelium leads to large gaps that allow macromolecules and nanoparticles to extravasate from the bloodstream at local sites and remain retained locally owing to impaired lymphatic drainage.39,42 Our home-fabricated NBAV has an appropriate range to easily penetrate into the vascular wall and accumulate in vulnerable lesions through enhanced permeability and leakage of inflammatory endothelium. The leakage of NBAV into atherosclerotic lesions through endothelium gap can be considered as a non-specific targeting process (passive targeting), whereas PS externalized on the surface of apoptotic cells targeted by ligand AV is an active effect. Taken together, these may be the reason for obvious sensitivity and specificity of NBAV than common NBCtrl in the diagnosis of vulnerable plaque. As expected, we found that NBAV could exactly displayed a potential indicator to evaluate the AS lesions and vulnerable plaques via CEUS molecular imaging in vivo.
Many research reported different imaging modalities for identification and visualization of AS lesions or plaque vulnerability,19,43 such as micro-CT imaging,44 intravascular ultrasound (IVUS) imaging,45 optical coherence tomography (OCT) imaging,46 contrast-enhanced MRI,47 as well as CEUS.48–50 However, these researches mainly focused on monitoring the outcomes of plaque formation, such as assessment of plaque neovascularization, macrophage distribution, vascular plaque burden and atherosclerotic plaque composition. In contrast, the purpose of our research emphasized on the feasibility of NBAV to monitor early plaque vulnerability for prediction of AS severity as soon as possible. In our study, plaques with strong echo signal of CEUS imaging were defined as NBAV sensitive plaques because of the presence of numerous apoptotic macrophages in these plaques and active targeting effect of NBAV on these apoptotic cells. What needs to be emphasized is that these NBAV sensitive plaques does not mean that the AS lesion has developed into a very severe degree. The fact is that it still takes time from vulnerable plaques to plaques prone to rupture or rapidly form a thrombus leading to acute cardiovascular events.
Moreover, we quantitatively analyzed the content of lipid and collagen in plaques by oil red O staining and Masson staining. Poor clearance of apoptotic macrophages may lead to the accumulation of cell debris in the lipid-rich core of atherosclerotic plaques. Therefore, lipid-associated oil Red O staining could reflect the number of apoptotic macrophages and the vulnerability of AS plaques. In addition, CD68 and α-SMA, specific markers of macrophage and smooth muscle cells, were also identified as core parameters of vulnerability plaque assessment. We found that NBAV sensitive plaques presented several instability features, including large necrotic nucleus, decreased collagen content, more macrophage infiltration, and thin plaque fibre cap. These results further confirmed our result of CEUS imaging, indicating that NBAV as an ultrasonic targeted molecular imaging probe has great feasibility in diagnosing plaque vulnerability. Of course, prospective outcome studies in a larger group of animals were needed to establish the value of this imaging method. With the intensive studies on macrophage apoptosis and AS vulnerable plaques, the development of nano-scale ultrasound contrast agents for the targeted diagnosis of AS lesions and vulnerable plaques can provide a reference for pre-clinical ultrasound imaging strategies used early screening, early diagnosis and early treatment of AS lesions.
In this study, the ApoE−/− atherosclerotic plaque model was established by high-fat and high-cholesterol feeding alone and then verified by high-frequency ultrasound imaging and histology. High-frequency ultrasound showed that 6–8 weeks old ApoE−/− mice fed with high-fat and high cholesterol diet had enhanced intimal echo after 4–6 weeks, slightly stronger plaque echo protruding from the intimal surface after 8–10 weeks, and plaque echo widely distributed in various sections of the aorta and major branches (innamial artery and common carotid artery) that could be detected by ultrasound. At present, in view of the advantages and disadvantages of different modeling methods of AS plaque, our study adopted a simple high-fat and high-cholesterol diet to establish AS plaque model, which greatly reduced the accidental death of mice caused by mechanical injury such AS arterial ligation.
Conclusion
In summary, this study provides a tool of ultrasound molecular imaging for assessment of atherosclerotic lesions and identification of vulnerable plaques in vivo by targeting apoptotic macrophages with NBAV in AS mouse models, suggesting that NBAV can be used as a molecular probe for identification of AS vulnerable plaques.
Acknowledgments
This study was funded by the Natural Science basic Research Program of Shaanxi Province (2022JQ-835) and the Social Talent Fund Program of Tang Du hospital (2021SHRC014). The authors thank Pro. Jian zhang (Air Force Medical University) for assistance of equipment in the cell study.
Disclosure
The authors declare no competing financial interests and no conflicts of interest for this work.
References
1. Vancraeynest D, Pasquet A, Roelants V, Gerber BL, Vanoverschelde JL. Imaging the vulnerable plaque. J Am Coll Cardiol. 2011;57(20):1961–1979. doi:10.1016/j.jacc.2011.02.018
2. Saba L, Saam T, Jäger HR, et al. Imaging biomarkers of vulnerable carotid plaques for stroke risk prediction and their potential clinical implications. Lancet Neurol. 2019;18(6):559–572. doi:10.1016/S1474-4422(19)30035-3
3. Mushenkova NV, Summerhill VI, Zhang D, Romanenko EB, Grechko AV, Orekhov AN. Current advances in the diagnostic imaging of atherosclerosis: insights into the pathophysiology of vulnerable plaque. Int J Mol Sci. 2020;21:8. doi:10.3390/ijms21082992
4. Hafiane A. Vulnerable plaque, characteristics, detection, and potential therapies. J Cardiovasc Dev Dis. 2019;6(3):26. doi:10.3390/jcdd6030026
5. Fernández-Ruiz I. NIRS to identify vulnerable plaques. Nat Rev Cardiol. 2019;16(12):701. doi:10.1038/s41569-019-0299-6
6. Jiang L, Zhu H, Li Y, Wu X, Wang H, Cheng Z. Detecting vulnerable atherosclerotic plaques by (68) Ga-labeleddivalent cystine knot peptide. Mol Pharm. 2019;16(3):1350–1357. doi:10.1021/acs.molpharmaceut.8b01291
7. Edsfeldt A, Stenström KE, Sun J, et al. Human atherosclerotic plaque progression is dependent on apoptosis according to bomb-pulse (14)C dating. JACC Basic Transl Sci. 2021;6(9–10):734–745. doi:10.1016/j.jacbts.2021.08.005
8. Tawakol A, Abohashem S, Zureigat H, Zureigat H. Imaging apoptosis in atherosclerosis: from cell death, a ray of light. J Am Coll Cardiol. 2020;76(16):1875–1877. doi:10.1016/j.jacc.2020.09.010
9. Chaudhry F, Kawai H, Johnson KW, et al. Molecular imaging of apoptosis in atherosclerosis by targeting cell membrane phospholipid asymmetry. J Am Coll Cardiol. 2020;76(16):1862–1874. doi:10.1016/j.jacc.2020.08.047
10. Tajbakhsh A, Kovanen PT, Rezaee M, Banach M, Moallem SA, Sahebkar A. Regulation of efferocytosis by caspase-dependent apoptotic cell death in atherosclerosis. Int J Biochem Cell Biol. 2020;120:105684. doi:10.1016/j.biocel.2020.105684
11. Paone S, Baxter AA, Hulett MD, Poon IKH. Endothelial cell apoptosis and the role of endothelial cell-derived extracellular vesicles in the progression of atherosclerosis. Cell Mol Life Sci. 2019;76(6):1093–1106. doi:10.1007/s00018-018-2983-9
12. Grootaert MOJ, Moulis M, Roth L, et al. Vascular smooth muscle cell death, autophagy and senescence in atherosclerosis. Cardiovasc Res. 2018;114(4):622–634. doi:10.1093/cvr/cvy007
13. Littlewood TD, Bennett MR. Apoptotic cell death in atherosclerosis. Curr Opin Lipidol. 2003;14(5):469–475. doi:10.1097/00041433-200310000-00007
14. Gonzalez L, Trigatti BL. Macrophage apoptosis and necrotic core development in atherosclerosis: a rapidly advancing field with clinical relevance to imaging and therapy. Can J Cardiol. 2017;33(3):303–312. doi:10.1016/j.cjca.2016.12.010
15. Gao C, Liu C, Chen Q, et al. Cyclodextrin-mediated conjugation of macrophage and liposomes for treatment of atherosclerosis. J Control Release. 2022;349:2–15. doi:10.1016/j.jconrel.2022.06.053
16. Gao C, Huang Q, Liu C, et al. Treatment of atherosclerosis by macrophage-biomimetic nanoparticles via targeted pharmacotherapy and sequestration of proinflammatory cytokines. Nat Commun. 2020;11(1):2622. doi:10.1038/s41467-020-16439-7
17. Seimon T, Tabas I. Mechanisms and consequences of macrophage apoptosis in atherosclerosis. J Lipid Res. 2009;50(Suppl):S382–S387. doi:10.1194/jlr.R800032-JLR200
18. Tabas I, Seimon T, Timmins J, Li G, Lim W. Macrophage apoptosis in advanced atherosclerosis. Ann N Y Acad Sci. 2009;1173(Suppl 1):E40–E45. doi:10.1111/j.1749-6632.2009.04957.x
19. Kondakov A, Lelyuk V. Clinical molecular imaging for atherosclerotic plaque. J Imaging. 2021;7(10):211. doi:10.3390/jimaging7100211
20. Nakahara T, Narula J, Strauss HW. Molecular imaging of vulnerable plaque. Semin Nucl Med. 2018;48(3):291–298. doi:10.1053/j.semnuclmed.2018.02.004
21. Baier J, Rix A, Kiessling F. Molecular ultrasound imaging. Recent Results Cancer Res. 2020;216:509–531. doi:10.1007/978-3-030-42618-7_15
22. Ozawa K, Lindner JR. Ultrasound molecular imaging: insights into cardiovascular pathology. J Echocardiog. 2020;18(2):86–93. doi:10.1007/s12574-020-00463-z
23. Kosareva A, Abou-Elkacem L, Chowdhury S, Lindner JR, Kaufmann BA. Seeing the invisible-ultrasound molecular imaging. Ultrasound Med Biol. 2020;46(3):479–497. doi:10.1016/j.ultrasmedbio.2019.11.007
24. Brown E, Lindner JR. Ultrasound molecular imaging: principles and applications in cardiovascular medicine. Curr Cardiol Rep. 2019;21(5):30. doi:10.1007/s11886-019-1117-9
25. Zhou T, Cai W, Yang H, et al. Annexin V conjugated nanobubbles: a novel ultrasound contrast agent for in vivo assessment of the apoptotic response in cancer therapy. J Control Release. 2018;276:113–124. doi:10.1016/j.jconrel.2018.03.008
26. Kupcho K, Shultz J, Hurst R, et al. A real-time, bioluminescent annexin V assay for the assessment of apoptosis. Apoptosis. 2019;24(1–2):184–197. doi:10.1007/s10495-018-1502-7
27. Cheng D, Li X, Zhang C, et al. Detection of vulnerable atherosclerosis plaques with a dual-modal single-photon-emission computed tomography/magnetic resonance imaging probe targeting apoptotic macrophages. ACS Appl Mater Interfaces. 2015;7(4):2847–2855. doi:10.1021/am508118x
28. Hu Y, Liu G, Zhang H, et al. A Comparison of [(99m)Tc]Duramycin and [(99m)Tc]Annexin V in SPECT/CT imaging atherosclerotic plaques. Mol Imaging Biol. 2018;20(2):249–259. doi:10.1007/s11307-017-1111-9
29. Araki M, Yonetsu T, Kurihara O, et al. Predictors of rapid plaque progression: an optical coherence tomography study. JACC Cardiovasc Imagin. 2021;14(8):1628–1638. doi:10.1016/j.jcmg.2020.08.014
30. Naghavi M, Libby P, Falk E, et al. From vulnerable plaque to vulnerable patient: a call for new definitions and risk assessment strategies: part I. Circulation. 2003;108(14):1664–1672. doi:10.1161/01.CIR.0000087480.94275.97
31. Shekhar A, Heeger P, Reutelingsperger C, et al. Targeted imaging for cell death in cardiovascular disorders. JACC Cardiovasc Imaging. 2018;11(3):476–493. doi:10.1016/j.jcmg.2017.11.018
32. Sinha SK, Miikeda A, Fouladian Z, et al. Local M-CSF (macrophage colony-stimulating factor) expression regulates macrophage proliferation and apoptosis in atherosclerosis. Arterioscler Thromb Vasc B. 2021;41(1):220–233. doi:10.1161/ATVBAHA.120.315255
33. Teng C, Lin C, Huang F, et al. Intracellular codelivery of anti-inflammatory drug and anti-miR 155 to treat inflammatory disease. Acta Pharm Sin B. 2020;10(8):1521–1533. doi:10.1016/j.apsb.2020.06.005
34. Magar KT, Boafo GF, Zoulikha M, et al. Metal phenolic network-stabilized nanocrystals of andrographolide to alleviate macrophage-mediated inflammation in-vitro. Chin Chem Lett. 2022. doi:10.1016/j.cclet.2022.04.051
35. Wang X, Sun Z, Yuan R, et al. K-80003 inhibition of macrophage apoptosis and necrotic core development in atherosclerotic vulnerable plaques. Cardiovasc Drugs Ther. 2021. doi:10.1007/s10557-021-07237-4
36. Martinet W, Coornaert I, Puylaert P, De Meyer GRY. Macrophage death as a pharmacological target in atherosclerosis. Front Pharmacol. 2019;10:306. doi:10.3389/fphar.2019.00306
37. Zhang D, Gao M, Jin Q, et al. Development of duramycin-based molecular probes for cell death imaging. Mol Imaging Biol. 2022. doi:10.1007/s11307-022-01707-3
38. Doyle B, Caplice N. Plaque neovascularization and antiangiogenic therapy for atherosclerosis. J Am Coll Cardiol. 2007;49(21):2073–2080. doi:10.1016/j.jacc.2007.01.089
39. Liu H, Pietersz G, Peter K, Wang X. Nanobiotechnology approaches for cardiovascular diseases: site-specific targeting of drugs and nanoparticles for atherothrombosis. J Nanobiotechnology. 2022;20(1):75. doi:10.1186/s12951-022-01279-y
40. Kolodgie FD, Narula J, Yuan C, Burke AP, Finn AV, Virmani R. Elimination of neoangiogenesis for plaque stabilization: is there a role for local drug therapy? J Am Coll Cardiol. 2007;49(21):2093–2101. doi:10.1016/j.jacc.2006.10.083
41. Lobatto ME, Fuster V, Fayad ZA, Mulder WJ. Perspectives and opportunities for nanomedicine in the management of atherosclerosis. Nat Rev Drug Discov. 2011;10(11):835–852. doi:10.1038/nrd3578
42. Ramji DP, Davies TS. Cytokines in atherosclerosis: key players in all stages of disease and promising therapeutic targets. Cytokine Growth Factor Rev. 2015;26(6):673–685. doi:10.1016/j.cytogfr.2015.04.003
43. Sun Z. Atherosclerosis and atheroma plaque rupture: imaging modalities in the visualization of vasa vasorum and atherosclerotic plaques. Sci World J. 2014;2014:312764. doi:10.1155/2014/312764
44. Self TS, Ginn-Hedman AM, Kaulfus CN, Newell-Fugate AE, Weeks BR, Heaps CL. Iodine-enhanced micro-computed tomography of atherosclerotic plaque morphology complements conventional histology. Atherosclerosis. 2020;313:43–49. doi:10.1016/j.atherosclerosis.2020.09.012
45. Li YC, Shen TY, Chen CC, Chang WT, Lee PY, Huang CJ. Automatic detection of atherosclerotic plaque and calcification from intravascular ultrasound images by using deep convolutional neural networks. IEEE Trans Ultrason Ferroelectr Freq Control. 2021;68(5):1762–1772. doi:10.1109/TUFFC.2021.3052486
46. Spinu M, Olinic DM, Olinic M, Homorodean C. In vivo imaging of complicated atherosclerotic plaque - role of optical coherence tomography (OCT). Rom J Morphol Embryol. 2018;59(2):469–478.
47. Van Hoof RH, Heeneman S, Wildberger JE, Kooi ME. Dynamic contrast-enhanced MRI to study atherosclerotic plaque microvasculature. Curr Atheroscler Rep. 2016;18(6):33. doi:10.1007/s11883-016-0583-4
48. Yan F, Sun Y, Mao Y, et al. Ultrasound molecular imaging of atherosclerosis for early diagnosis and therapeutic evaluation through leucocyte-like multiple targeted microbubbles. Theranostics. 2018;8(7):1879–1891. doi:10.7150/thno.22070
49. Lyu Q, Tian X, Ding Y, et al. Evaluation of carotid plaque rupture and neovascularization by contrast-enhanced ultrasound imaging: an exploratory study based on histopathology. Transl Stroke Res. 2021;12(1):49–56. doi:10.1007/s12975-020-00825-w
50. Camps-Renom P, Prats-Sánchez L, Casoni F, et al. Plaque neovascularization detected with contrast-enhanced ultrasound predicts ischaemic stroke recurrence in patients with carotid atherosclerosis. Eur J Neurol. 2020;27(5):809–816. doi:10.1111/ene.14157
 © 2022 The Author(s). This work is published and licensed by Dove Medical Press Limited. The full terms of this license are available at https://www.dovepress.com/terms.php and incorporate the Creative Commons Attribution - Non Commercial (unported, v3.0) License.
By accessing the work you hereby accept the Terms. Non-commercial uses of the work are permitted without any further permission from Dove Medical Press Limited, provided the work is properly attributed. For permission for commercial use of this work, please see paragraphs 4.2 and 5 of our Terms.
© 2022 The Author(s). This work is published and licensed by Dove Medical Press Limited. The full terms of this license are available at https://www.dovepress.com/terms.php and incorporate the Creative Commons Attribution - Non Commercial (unported, v3.0) License.
By accessing the work you hereby accept the Terms. Non-commercial uses of the work are permitted without any further permission from Dove Medical Press Limited, provided the work is properly attributed. For permission for commercial use of this work, please see paragraphs 4.2 and 5 of our Terms.