")
Back to Journals » Journal of Hepatocellular Carcinoma » Volume 2
Early α-fetoprotein response predicts survival in patients with advanced hepatocellular carcinoma treated with sorafenib
Authors Lee S, Kim BK, Kim SU , Park JY, Kim DY , Ahn SH, Han K
Received 16 December 2014
Accepted for publication 10 February 2015
Published 28 April 2015 Volume 2015:2 Pages 39—47
DOI https://doi.org/10.2147/JHC.S79353
Checked for plagiarism Yes
Review by Single anonymous peer review
Peer reviewer comments 5
Editor who approved publication: Dr Ahmed Kaseb
Sangheun Lee,1,* Beom Kyung Kim,2–5,* Seung Up Kim,2–5 Jun Yong Park,2–5 Do Young Kim,2–5 Sang Hoon Ahn,2–6 Kwang-Hyub Han2–6
1Department of Internal Medicine, International St Mary’s Hospital, Catholic Kwandong University, Incheon Metropolitan City, Republic of Korea; 2Department of Internal Medicine, 3Institute of Gastroenterology, 4Liver Cancer Special Clinic, Yonsei University College of Medicine, Seoul, Republic of Korea; 5Liver Cirrhosis Clinical Research Center, Seoul, Republic of Korea; 6Brain Korea 21 Project for Medical Science, Seoul, Republic of Korea.
*These authors contributed equally to this work
Background: It is not clear whether tumor marker responses can predict survival during sorafenib treatment in hepatocellular carcinoma (HCC). We investigated whether the α-fetoprotein (AFP) response is associated with survival in patients with advanced HCC treated with sorafenib.
Methods: We retrospectively reviewed the records of 126 patients with advanced HCC treated with sorafenib between 2007 and 2012. An AFP response was defined as >20% decrease from baseline. At 6–8 weeks after commencing sorafenib, AFP and radiological responses were assessed by modified Response Evaluation Criteria in Solid Tumors.
Results: The median overall survival (OS) and progression-free survival (PFS) were 6.2 and 3.5 months, respectively. Of the study population, a partial response (PR) was identified in 5 patients (4.0%), stable disease (SD) in 65 patients (51.6%), and progressive disease (PD) in 57 patients (44.4%), respectively. AFP non-response was an independent prognostic factor for poor OS (median 10.9 months for AFP response vs 5.2 months for AFP non-response), together with Child-Pugh B, tumor diameter ≥10 cm, and portal vein invasion (all P<0.05), and PFS (median 5.3 months for AFP response vs 2.9 months for AFP non-response), together with tumor diameter ≥10 cm and portal vein invasion (all P<0.05). SD or PR was more frequently found in AFP responders than in non-responders (72.1% vs 47.0%, respectively; P=0.007). In a sub-group with SD, OS (median 12.7 vs 5.8 months, respectively) and PFS (median 9.1 vs 3.7 months, respectively) were significantly longer in AFP responders than in non-responders (all P<0.05).
Conclusion: Early AFP response may be useful for predicting survival in patients with advanced HCC treated with sorafenib.
Keywords: α-fetoprotein, hepatocellular carcinoma, response, prognosis, treatment outcome, sorafenib
Introduction
Hepatocellular carcinoma (HCC) is the third leading cause of cancer-related death in the world.1 If curative therapies including hepatic resection, liver transplantation, and local ablation are possible, favorable prognosis can be expected.2–4 However, the overall survival (OS) following the diagnosis of HCC ranges from approximately 6–20 months because a significant proportion of patients are not diagnosed until advanced stage.5–7 Sorafenib, an oral multi-kinase inhibitor, is the treatment of choice for advanced HCC. Sorafenib suppresses tumor growth and angiogenesis by inhibiting the Raf/MEK/ERK signaling pathway and by inhibiting receptor tyrosine kinases, including vascular endothelial growth factor receptor and platelet-derived growth factor receptor-β.8 Two large, global phase III trials demonstrated that sorafenib significantly improved both time-to-progression and OS in advanced-stage HCC compared with placebo.9,10
Radiological assessment remains the gold standard in evaluating treatment response for solid cancers including HCC. Regarding HCC, two representative standards for radiological response evaluation, the European Association for the Study of the Liver (EASL) criteria and modified Response Evaluation Criteria in Solid Tumors (mRECIST), have been most commonly used; both methods estimate the reduction in viable tumor area using contrast-enhanced radiological imaging, taking into account tumor necrosis induced by anti-HCC treatment.11,12 According to previous investigations, an objective response, which includes complete and partial responses (CR and PR), is the main independent predictor for better survival outcomes in patients with HCC.13,14 However, for those treated with sorafenib, achievement of CR is extremely rare and PR is achieved in only a small proportion of patients. Indeed, it has been reported that approximately 45%–71% of patients receiving sorafenib achieved stable disease (SD) as a best response.9,10,15 Therefore, there has been considerable interest in finding ancillary methods beyond radiological assessment for measuring treatment responses in patients undergoing sorafenib treatment for advanced HCC.
Serum α-fetoprotein (AFP), a glycoprotein detected in the blood of approximately 70% of HCC patients, is widely used in clinical practice for diagnosis, pre-treatment prognosis, and for predicting tumor response after anti-HCC treatment, since it is thought to continuously reflect tumor activity and viable burden. The AFP response after anti-HCC treatments such as radiation therapy or cytotoxic systemic chemotherapy has been investigated, and its clinical usefulness has been verified.16–19 However, only a few small studies have investigated the clinical implication of the AFP response in patients with advanced HCC treated with sorafenib.20–24 Therefore, we evaluated the correlation between the AFP response with radiological treatment response and survival outcome in patients with advanced HCC treated with sorafenib.
Materials and methods
Patient enrollment
We retrospectively analyzed records for 126 patients treated with sorafenib for advanced HCC between 2007 and 2012 at Severance Hospital, Yonsei University College of Medicine, Seoul, Republic of Korea. Inclusion criteria were: age between 20 and 80 years old, Eastern Cooperative Oncology Group (ECOG) performance status ≤2, >2 weeks of sorafenib administration, Barcelona Clinic Liver Cancer (BCLC) stage C, Child-Pugh class A or B, baseline AFP level ≥20 ng/mL, or laboratory findings adequate for systemic chemotherapy (leukocyte count ≥2,000 cells/mm3, platelet count ≥50×109/L, hemoglobin level ≥8.5 g/dL, and serum creatinine level <1.5 mg/dL).
This study was performed in accordance with the ethical guidelines of the 1975 Declaration of Helsinki and was approved by the Institutional Review Board of Severance Hospital, Yonsei University College of Medicine, Seoul, Republic of Korea.
Diagnosis of HCC
The diagnosis of HCC was based on histological examination or clinico-radiological criteria, according to guidelines proposed by the Korea Liver Cancer Study Group:25 patients with one or more risk factors (hepatitis B or C virus infection, cirrhosis) and one of the following: 1) AFP ≥400 ng/mL and a positive finding on at least one of three typical imaging studies (dynamic computed tomography [CT], dynamic magnetic resonance imaging [MRI], or hepatic angiography); or 2) serum AFP <400 ng/mL and positive findings on at least two of the three imaging studies. A positive finding for typical HCC on dynamic CT or MRI was defined as increased arterial enhancement followed by decreased enhancement compared with the liver (washout) in the portal or equilibrium phase.
Treatment and assessment of therapeutic responses
All patients were thoroughly informed about the frequent side effects of sorafenib before receiving 400 mg oral sorafenib twice daily on a continuous dosing schedule. Sorafenib was continued until significant radiological or clinical progression, or intolerable toxicity. Patients were followed up for response evaluation every 6–8 weeks using dynamic CT, dynamic MRI, or positron emission tomography. In this study, mRECIST criteria were used as a radiological assessment tool. Tumor response was assessed by an experienced radiologist (Dr MS Park, Yonsei University College of Medicine, Seoul, Republic of Korea). Responses were quantitatively defined as CR, indicated by complete disappearance of measurable lesions, or PR, defined as a 30% decrease from baseline. Progressive disease (PD) was defined as a 20% increase from baseline, and SD was defined as a value between PD and PR. Objective response was defined as CR or PR, and disease control as CR, PR, or SD. The radiologic evaluations of treatment response were conducted between 6 and 8 weeks after the initiation of sorafenib. Safety was assessed every month during regular follow-up. Toxicity grade was assessed before each treatment cycle using the National Cancer Institute Common Toxicity Criteria (version 4.0).
Examination of AFP level and definition of early AFP response
Serum AFP levels were measured at baseline and every 6–8 weeks after the start of sorafenib until tumor progression or discontinuation of treatment. Serum AFP levels were measured by a micro-particle enzyme immunoassay (Bayer AG, Leverkusen, Germany). If patients experienced a decrease in AFP level more than 20% compared to the baseline after 6–8 weeks of sorafenib treatment, they were defined as AFP responders. If not, the patients were considered as AFP non-responders.
Statistical analysis
The primary outcome of the study was OS, and secondary outcomes included progression-free survival (PFS) and disease control rate. OS was calculated as the time interval between the date of the initiation of sorafenib and the date of death or final follow-up. PFS was assessed from the date of the initiation of sorafenib until the date of first progression or death. Survival time was estimated by the Kaplan–Meier method, and differences between groups were assessed by the log-rank test. The Cox proportional hazards model was used for multivariate analysis of survival. Student’s t-test or Mann–Whitney U test, if appropriate, was used to statistically compare continuous variables, and chi-square or Fisher’s exact test was used for categorical variables. The prognostic significance of age, sex, etiology, ECOG, Child-Pugh class, tumor size, tumor number, tumor morphology, portal vein invasion, the presence of extrahepatic spread and/or regional node involvement, AFP response, and Protein Induced by Vitamin K Absence or Antagonist-II (PIVKA-II) response were tested in univariate analysis. All variables that were significant in the univariate analysis were included in the multivariate model. Statistical analyses were performed using SAS version 9.1.3 (SAS Institute Inc, Cary, NC, USA). A two-sided P-value of <0.05 was considered statistically significant.
Results
Baseline characteristics
Table 1 shows the baseline characteristics of the entire patient population. The median age was 58 years, 101 (80.2%) patients were male, and 96 (76.2%) patients were Child-Pugh class A for liver function. The median tumor size was 7.8 cm, and 50 (39.7%) patients had the infiltrative type of HCC. Portal vein invasion was found in 48 (38.1%) patients, whereas extrahepatic spread and/or regional lymph nodal involvement was identified in 87 (69.0%) patients. The median AFP and PIVKA-II levels were 291.6 ng/mL and 491.5 AU/L, respectively.
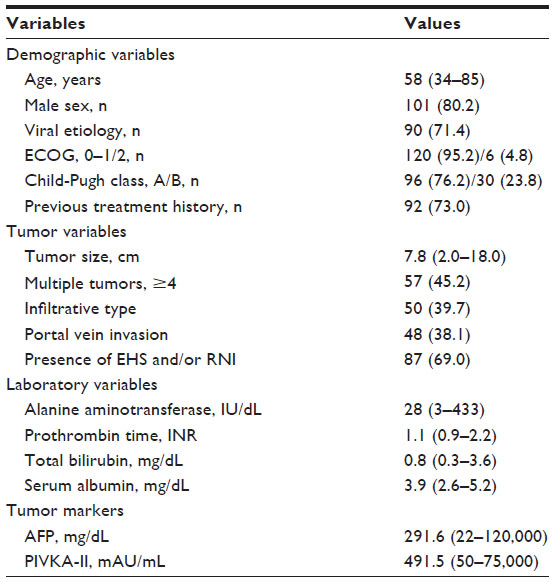 | Table 1 Baseline characteristics of patients (n=126) |
Evaluation of AFP and radiological responses
Within the entire cohort, the median AFP level increased from 291.6 ng/dL (range 22–120,000 ng/dL) at baseline to 353.5 ng/dL (range 1.28–120,000 ng/dL), despite 6–8 weeks of sorafenib treatment. In the first radiological response evaluation at 6–8 weeks after initiation of sorafenib treatment, PR, SD, and PD were observed in 5 (4.0%), 65 (51.6%), and 56 (44.4%) patients, respectively, whereas no CR was identified.
Of the study population, 43 (34.1%) patients were classified as AFP responders and the remaining 83 (65.9%) were AFP non-responders. Among AFP responders, PR, SD, and PD were observed in 1 (2.3%), 30 (69.8%), and 12 (27.9%) patients, respectively, contrasting with 4 (4.8%), 35 (42.2%), and 44 (53.0%) PR, SD, and PD cases in AFP non-responders, respectively. With the exception of the significantly higher disease control rate in AFP responders vs non-responders (72.1% [31 of 43 patients] vs 47.0% [39 of 83 patients], respectively; P=0.007), baseline characteristics were statistically similar between AFP responders and non-responders (all P>0.05) (Table 2).
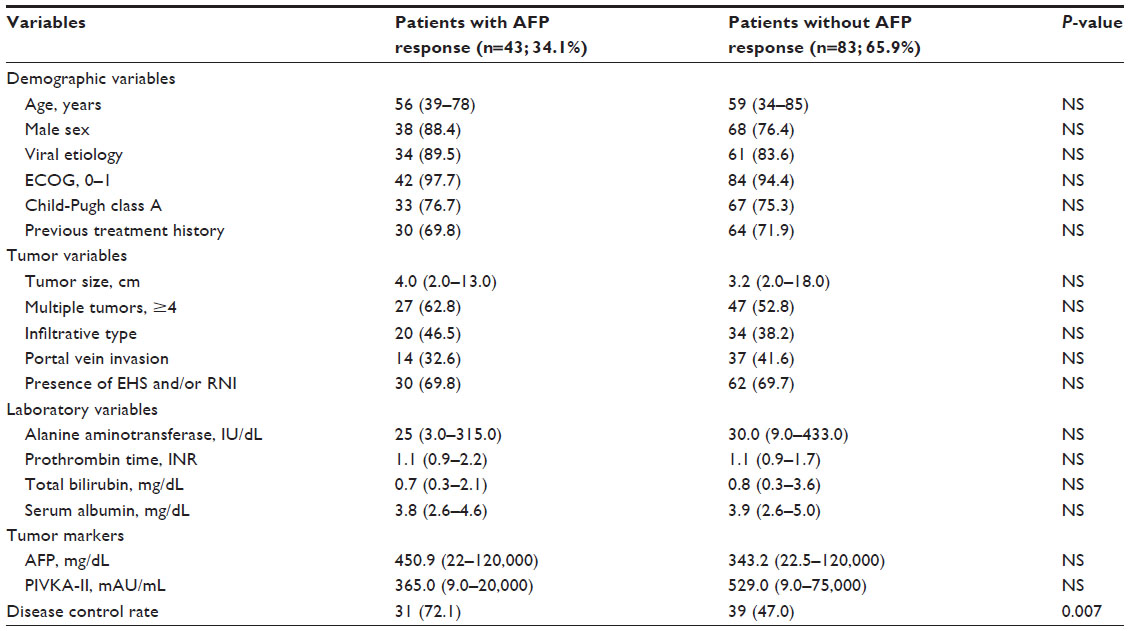 | Table 2 Comparison between patients with and without AFP response |
Survival outcomes
The median OS of the entire population was 6.2 (95% confidence interval [CI], 5.1–7.2) months. On univariate analysis, patients with Child-Pugh class A, tumor diameter <10 cm, the absence of portal vein invasion, and AFP response were likely to have longer OS compared to Child-Pugh class B (median 7.1 [95% CI 5.4–8.7] vs 5.2 [95% CI 4.2–6.1] months), tumor diameter ≥10 cm (median 7.4 [95% CI 5.5–9.2] vs 4.3 [95% CI 1.6–8.0] months), the presence of portal vein invasion (median 7.8 [95% CI 5.4–10.1] vs 4.8 [95% CI 4.1–5.4] months) and AFP non-response (median 10.9 [95% CI 7.4–14.3] vs 5.2 [95% CI 4.2–6.1] months), respectively (all P<0.05). Subsequently, multivariate analysis identified AFP non-response as a prognostic factor for poor OS (P=0.001; hazard ratio [HR], 2.6; 95% CI, 1.5–4.3), together with Child-Pugh class B, tumor diameter ≥10 cm, and the presence of portal vein invasion (Table 3).
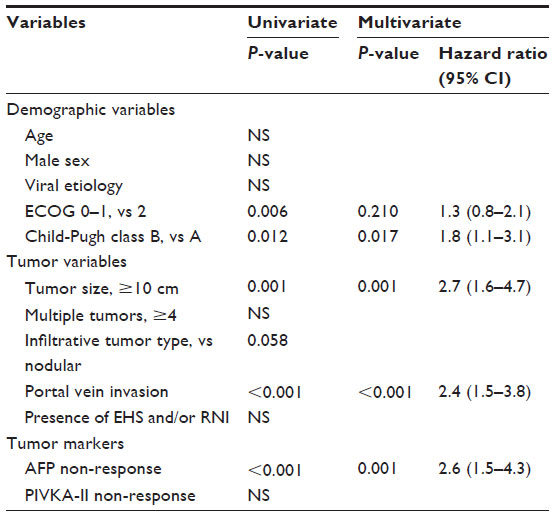 | Table 3 Independent predictors of overall survival |
The median PFS of the entire population was 3.5 (95% CI, 2.9–4.0) months. On univariate analysis, patients with tumor diameter <10 cm, the absence of portal vein invasion, and AFP response were likely to have longer PFS compared to tumor diameter ≥10 cm (3.6 [95% CI 2.5–4.6] vs 2.5 [95% CI 1.8–3.1] months), the presence of portal vein invasion (3.6 [95% CI 1.7–5.4] vs 2.9 [95% CI 2.5–3.2] months) and AFP non-response (5.3 [95% CI 1.0–9.5] vs. 2.9 [95% CI 2.6–3.1] months), respectively (all P<0.05). Subsequently, multivariate analysis identified AFP non-response as a poor prognostic factor of OS (P=0.001; HR, 2.1; 95% CI, 1.3–3.3), together with tumor diameter ≥10 cm and the presence of portal vein invasion (Table 4). Kaplan–Meier curves for OS and PFS according to AFP response are provided in Figure 1.
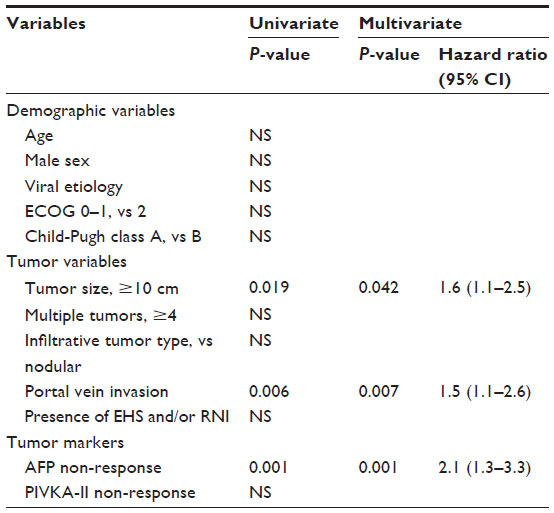 | Table 4 Independent predictors of progression-free survival |
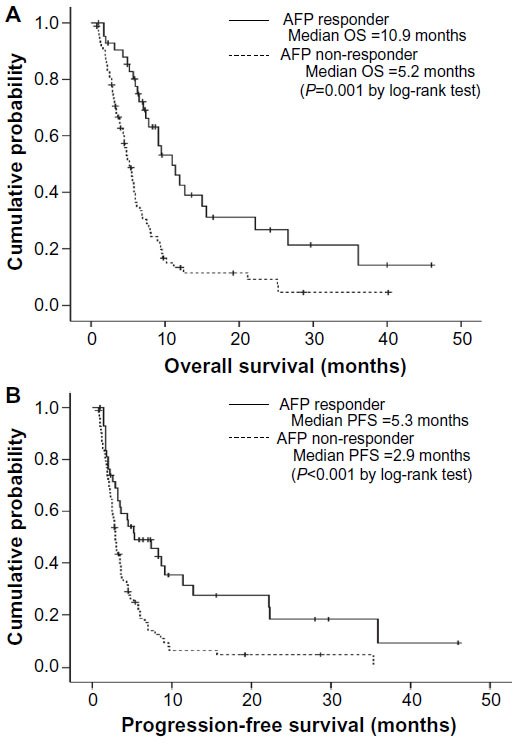 | Figure 1 Kaplan–Meier curves of overall survival (OS) (A) and progression-free survival (PFS) (B) according to α-fetoprotein (AFP) response. Patients with an AFP response had significantly longer OS and PFS than patients without an AFP response (median 10.9 versus 5.2 months, log-rank test P=0.001 for OS and 5.3 versus 2.9 months, log-rank test P<0.001 for PFS). |
Using four independent risk factors from multivariate Cox proportional hazard model, we established a formula to assess the risk of death:
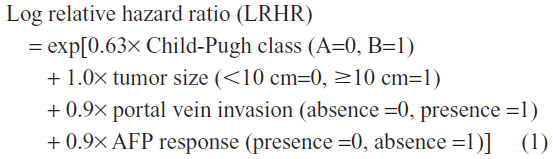
If a given patient had all four risk factors, LRHR increased up to 30.8. When the study population was stratified according to the mean LRHR value, patients with LRHR <4 showed significantly better OS compared to those with LRHR ≥4 [median 6.2 months (95% CI, 3.8–8.5) vs 2.9 months (95% CI, 1.7–4.0), P<0.001 by log-rank test)] (Figure S1).
Correlation of the AFP response and OS in different radiological responses
Because the AFP response was an independent predictor of favorable OS, we further investigated whether the AFP response could be used to identify patients with a favorable prognosis in each subpopulation with the same radiological response. In the subpopulation with SD, AFP responders had significantly better OS and PFS than non-responders (median, 12.7 vs 5.8 months, respectively; log-rank test, P=0.027 for OS; median, 9.1 vs 3.7 months, respectively; log-rank test, P=0.019 for PFS) (Figure 2). In the subpopulation with PD, AFP responders tended to have longer OS than non-responders (median, 6.3 vs 4.5 months, respectively; log-rank test, P=0.080), whereas PFS was statistically similar between AFP responders and non-responders (median, 1.7 vs 2.2 months, respectively; log-rank test, P=0.602).
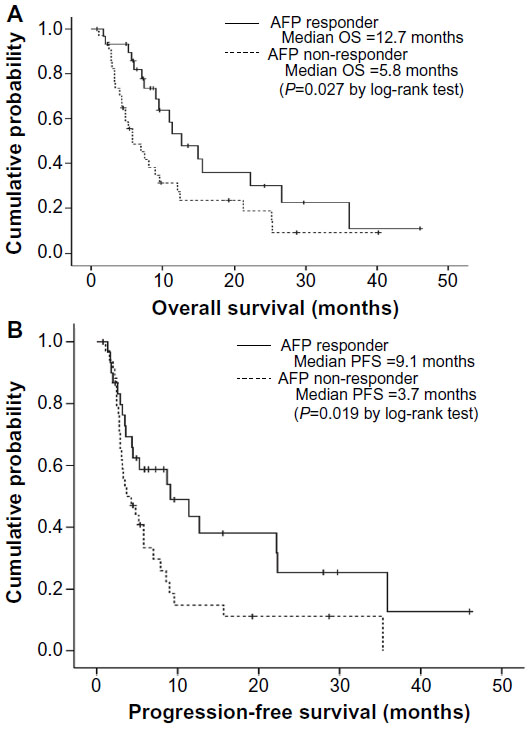 | Figure 2 curves of overall survival (OS) (A) and progression-free survival (PFS) (B) according to α-fetoprotein (AFP) response among patients with stable disease at the first radiological response evaluation. Patients with an AFP response had significantly longer OS and PFS than patients without an AFP response (median 12.7 versus 5.8 months, log-rank test P=0.027 for OS and 9.1 versus 3.7 months, log-rank test P=0.019 for PFS). |
The OS of patients with both AFP and radiological response was significantly longer than those with only one response (AFP response or radiological response) and those without any response (median, 15.0 months [95% CI, 7.8–22.1] vs median, 6.3 months [95% CI, 4.0–8.5] and median, 4.0 months, respectively [95% CI, 2.5–5.4]; all P<0.001). Similar results for PFS were obtained (median PFS, 9.1 months [95% CI, 3.7–14.4] for patients with both responses vs median, 3.3 months [95% CI, 2.6–3.9] for those with only one response and median, 2.1 months [95% CI, 1.6–2.5] for those without any response; all P<0.001).
Toxicity
Treatment-related adverse effects were common, and those of grade 2 or more are described in Table 5. The most common toxicity related to sorafenib treatment was the hand–foot skin reaction (HFSR, 41.2%), followed by diarrhea (30.4%). Grade 3 or 4 toxicities were relatively rare: greater than grade 3 HFSR and diarrhea were found in 10 (7.9%) and 7 (5.6%) patients, respectively. Gastrointestinal symptoms including nausea in 15 (11.9%) patients and abdominal pain in 25 (19.8%) patients occurred during sorafenib treatment. However, all adverse events were manageable with medical support and dose adjustment of sorafenib.
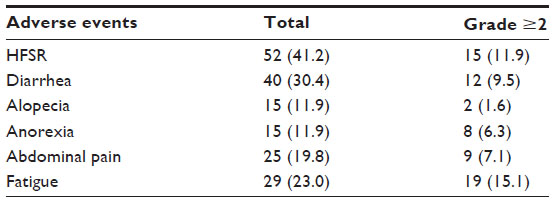 | Table 5 Adverse events |
Discussion
Radiological assessment is generally regarded as the current gold standard of response evaluation after treatment of HCC.13 Recently, significant advances in the methods of radiological response assessment from WHO to mRECIST criteria have been made based on the concept that tumor necrosis or decreased tumor viability after HCC treatments should be included as favorable responses, despite a lack of change in tumor size.26 Accordingly, more precise assessment of the prognosis in patients with HCC has become possible. However, discrepancies between the responses assessed by radiological tools and the changes in tumor markers can be encountered, because radiological assessment does not consider the biological characteristics of HCC.
To date, it has been proven that the changes in tumor markers are closely correlated with treatment response after anti-cancer therapy in various solid tumors.27,28 Regarding HCC, a conventional tumor marker, AFP, has been well-known as a surveillance and diagnostic marker as well as a biological marker of tumor burden and activity.29 In the surgical setting, the recurrence and long-term prognosis after curative resection and liver transplantation for HCC can be predicted using the dynamics of AFP levels before and after surgery.30–33 Similarly, the predictive values of the changes in AFP levels after transarterial chemoembolization for HCC has also been reported.34 In addition, several recent studies have proposed the usefulness of the AFP response in assessing treatment response in various treatment settings. The >50% decline in serum AFP was predictive of the efficacy of thalidomide therapy and other palliative chemotherapy in HCC.16,35,36 Moreover, Shao et al17 proposed that an AFP response of >20% decrease within 6–8 weeks of chemotherapy in combination with various anti-angiogenic agents including sorafenib was predictive of treatment response and prognosis. In addition, Personeni et al21 reported that the AFP response observed with sorafenib treatment independently contributed to a lower risk of death with an HR of 0.59 (P=0.040), whereas radiological disease control assessed by RECIST criteria was not statistically predictive for OS. Thus, Personeni et al21 concluded that the AFP response can be an alternative response assessment method for RECIST after sorafenib treatment.
Sorafenib is a small cytostatic multi-target tyrosine kinase inhibitor that blocks tumor angiogenesis and proliferation, but does not eliminate the tumor directly, unlike other conventional cytotoxic chemotherapeutic agents.37 While sorafenib treatment for HCC has a proven survival benefit, radiological CR and PR, which are the most robust favorable predictors of treatment response, and abrupt changes in the viable area with enhancement are rarely observed in clinical practice.38 In addition, even if radiological SD was achieved with sorafenib, differences in prognosis due to differences in tumor biology are anticipated because radiological criteria for SD, for example mRECIST, have a relatively broad definition that includes a 20% increase to a 30% decrease from baseline enhanced tumor size. Thus, it is easily postulated that the prognostic value of imaging-based response evaluation using mRECIST might be insufficient and that mRECIST might fail to stratify patients with different prognoses, even patients with the same radiological SD. Thus, there is a great need for identifying an ancillary method to complement radiological response evaluation, especially for patients receiving sorafenib.
In our study, we found that the AFP response independently predicted OS (together with Child-Pugh score, tumor size, and the presence of portal vein invasion) and PFS (together with tumor size and the presence of portal vein invasion). In addition, the AFP response could be used to stratify patients with different OS, even those with the same radiological responses of SD after sorafenib treatment. Furthermore, patients with both AFP and radiological responses showed significantly longer OS than that of patients with only one response (AFP response or radiological response) and those without any response. This information can help optimize the management strategy for patients with advanced HCC receiving sorafenib. That is, we can expect more favorable prognosis in patients with both SD and an AFP response, whereas in those with SD, but an AFP non-response, close observation might be required to detect disease progression. In addition, although statistical significances were not reached, PFS tended to be longer in AFP responders, even with radiological PD. Thus, it can be cautiously proposed that sorafenib treatment can be prolonged, if an AFP response is identified, in spite of radiological PD. Based on our results, the addition of an AFP response to the radiological response criteria can be newly established for more detailed prognostication for this study population, although future studies should validate our results.
Several issues still remain unresolved in our study. First, this was a retrospective study that might have included selection bias. However, because the median OS and PFS were almost similar to those of the Asia-Pacific trial for sorafenib10 and the primary aim of this study was not the treatment efficacy of sorafenib, reflected by survival outcomes, but rather the study was performed to identify the predictors of treatment response, the influence of the potential selection bias might not be significant. Second, because the sample size was relatively small, the prognostic value of the AFP response in subgroups of each radiological response might be influenced. Further large scale studies are warranted to confirm the significance of the AFP response. Third, we excluded patients with a low AFP level (<20 ng/mL) in order to calculate the changes in AFP level before and after sorafenib treatment. Thus, our results might not be applicable to the subpopulation without elevated AFP levels at baseline (>20 ng/mL). Fourth, although we proposed a risk prediction formula using four independent risk factors (Child-Pugh class, tumor size, portal vein invasion, and AFP response) and found that this formula can identify subgroups with different prognosis, further studies are required to validate our results.
In conclusion, we have shown that an early AFP response was an independent prognostic factor for determining survival outcomes in HCC patients treated with sorafenib. In addition, the AFP response can stratify patients with different survival outcomes, even with the same radiological responses after sorafenib treatment. Thus, considering that the measurement of AFP change is simple, rapid, reproducible, and operator-independent, AFP response can be used as a complementary method for radiological assessment for evaluating treatment response in sorafenib treatment of advanced HCC.
Disclosure
The authors report no conflicts of interest in this work.
References
Jemal A, Bray F, Center MM, Ferlay J, Ward E, Forman D. Global cancer statistics. CA Cancer J Clin. 2011;61(2):69–90. | |
Llovet JM, Fuster J, Bruix J. Intention-to-treat analysis of surgical treatment for early hepatocellular carcinoma: resection versus transplantation. Hepatology. 1999;30(6):1434–1440. | |
Bismuth H, Majno PE, Adam R. Liver transplantation for hepatocellular carcinoma. Semin Liver Dis. 1999;19(3):311–322. | |
Yao FY, Ferrell L, Bass NM, et al. Liver transplantation for hepatocellular carcinoma: expansion of the tumor size limits does not adversely impact survival. Hepatology. 2001;33(6):1394–1403. | |
Llovet JM, Burroughs A, Bruix J. Hepatocellular carcinoma. Lancet. 2003;362(9399):1907–1917. | |
Bruix J, Sherman M; American Association for the Study of Liver Diseases. Management of hepatocellular carcinoma: an update. Hepatology. 2011;53(3):1020–1022. | |
Kim BK, Kim SU, Park JY, et al. Applicability of BCLC stage for prognostic stratification in comparison with other staging systems: single centre experience from long-term clinical outcomes of 1717 treatment – naive patients with hepatocellular carcinoma. Liver Int. 2012;32(7):1120–1127. | |
Wilhelm SM, Carter C, Tang L, et al. BAY 43-9006 exhibits broad spectrum oral antitumor activity and targets the RAF/MEK/ERK pathway and receptor tyrosine kinases involved in tumor progression and angiogenesis. Cancer Res. 2004;64(19):7099–7109. | |
Llovet JM, Ricci S, Mazzaferro V, et al. Sorafenib in advanced hepatocellular carcinoma. N Engl J Med. 2008;359(4):378–390. | |
Cheng AL, Kang YK, Chen Z, et al. Efficacy and safety of sorafenib in patients in the Asia-Pacific region with advanced hepatocellular carcinoma: a phase III randomised, double-blind, placebo-controlled trial. Lancet Oncol. 2009;10(1):25–34. | |
Eisenhauer EA, Therasse P, Bogaerts J, et al. New response evaluation criteria in solid tumours: revised RECIST guideline (version 1.1). Eur J Cancer. 2009;45(2):228–247. | |
Bruix J, Sherman M, Llovet JM, et al; EASL Panel of Experts on HCC. Clinical management of hepatocellular carcinoma. Conclusions of the Barcelona-2000 EASL conference. European Association for the Study of the Liver. J Hepatol. 2001;35(3):421–430. | |
Gillmore R, Stuart S, Kirkwood A, et al. EASL and mRECIST responses are independent prognostic factors for survival in hepatocellular cancer patients treated with transarterial embolization. J Hepatol. 2011;55(6):1309–1316. | |
Kim BK, Kim SU, Kim MJ, et al. Number of Target Lesions for EASL and Modified RECIST to Predict Survivals in Hepatocellular Carcinoma Treated with Chemoembolization. Clin Cancer Res. 2013; doi:10.1158/1078-0432.CCR-12-2721. | |
Shim JH, Park JW, Choi JI, Park BJ, Kim CM. Practical efficacy of sorafenib monotherapy for advanced hepatocellular carcinoma patients in a Hepatitis B virus-endemic area. J Cancer Res Clin Oncol. 2009; 135(4):617–625. | |
Vora SR, Zheng H, Stadler ZK, Fuchs CS, Zhu AX. Serum alpha-fetoprotein response as a surrogate for clinical outcome in patients receiving systemic therapy for advanced hepatocellular carcinoma. Oncologist. 2009;14(7):717–725. | |
Shao YY, Lin ZZ, Hsu C, Shen YC, Hsu CH, Cheng AL. Early alpha-fetoprotein response predicts treatment efficacy of antiangiogenic systemic therapy in patients with advanced hepatocellular carcinoma. Cancer. 2010;116(19):4590–4596. | |
Kim BK, Ahn SH, Seong JS, et al. Early alpha-fetoprotein response as a predictor for clinical outcome after localized concurrent chemoradiotherapy for advanced hepatocellular carcinoma. Liver Int. 2011;31(3):369–376. | |
Lee MH, Kim SU, Kim do Y, et al. Early on-treatment predictions of clinical outcomes using alpha-fetoprotein and des-gamma-carboxy prothrombin responses in patients with advanced hepatocellular carcinoma. J Gastroenterol Hepatol. 2012;27(2):313–322. | |
Kawaoka T, Aikata H, Murakami E, et al. Evaluation of the mRECIST and alpha-fetoprotein ratio for stratification of the prognosis of advanced-hepatocellular-carcinoma patients treated with sorafenib. Oncology. 2012;83(4):192–200. | |
Personeni N, Bozzarelli S, Pressiani T, et al. Usefulness of alpha-fetoprotein response in patients treated with sorafenib for advanced hepatocellular carcinoma. J Hepatol. 2012;57(1):101–107. | |
Okuyama H, Ikeda M, Kuwahara A, et al. Prognostic factors in patients with hepatocellular carcinoma refractory or intolerant to sorafenib. Oncology. 2014;88(4):241–246. | |
da Fonseca LG, Barroso-Sousa R, Bento Ada S, et al. Pre-treatment neutrophil-to-lymphocyte ratio affects survival in patients with advanced hepatocellular carcinoma treated with sorafenib. Med Oncol. 2014;31(11):264. | |
Li X, Chen ZH, Ma XK, et al. Neutrophil-to-lymphocyte ratio acts as a prognostic factor for patients with advanced hepatocellular carcinoma. Tumour Biol. 2014;35(11):11057–11063. | |
Korean Liver Cancer Study G, National Cancer Center K. [Practice guidelines for management of hepatocellular carcinoma 2009]. Korean J Hepatol. 2009;15(3):391–423. Korean. | |
Vouche M, Kulik L, Atassi R, et al. Radiological-pathological analysis of WHO, RECIST, EASL, mRECIST and DWI: Imaging analysis from a prospective randomized trial of Y90 ± sorafenib. Hepatology. 2013;58(5):1655–1666. | |
Kurebayashi J, Nishimura R, Tanaka K, et al. Significance of serum tumor markers in monitoring advanced breast cancer patients treated with systemic therapy: a prospective study. Breast Cancer. 2004;11(4):389–395. | |
Jang NY, Kang SB, Kim DW, et al. The role of carcinoembryonic antigen after neoadjuvant chemoradiotherapy in patients with rectal cancer. Dis Colon Rectum. 2011;54(2):245–252. | |
Forner A, Bruix J. Biomarkers for early diagnosis of hepatocellular carcinoma. Lancet Oncol. 2012;13(8):750–751. | |
Chon YE, Choi GH, Lee MH, et al. Combined measurement of preoperative alpha-fetoprotein and des-gamma-carboxy prothrombin predicts recurrence after curative resection in patients with hepatitis-B-related hepatocellular carcinoma. Int J Cancer. 2012;131(10):2332–2341. | |
Yamamoto K, Imamura H, Matsuyama Y, et al. Significance of alpha-fetoprotein and des-gamma-carboxy prothrombin in patients with hepatocellular carcinoma undergoing hepatectomy. Ann Surg Oncol.2009;16(10):2795–2804. | |
Toyoda H, Kumada T, Kaneoka Y, et al. Prognostic value of pretreatment levels of tumor markers for hepatocellular carcinoma on survival after curative treatment of patients with HCC. J Hepatol. 2008;49(2):223–232. | |
Shetty K, Timmins K, Brensinger C, et al. Liver transplantation for hepatocellular carcinoma validation of present selection criteria in predicting outcome. Liver Transpl. 2004;10(7):911–918. | |
Lee YK, Kim SU, Kim do Y, et al. Prognostic value of alpha-fetoprotein and des-gamma-carboxy prothrombin responses in patients with hepatocellular carcinoma treated with transarterial chemoembolization. BMC Cancer. 2013;13:5. | |
Chen LT, Liu TW, Chao Y, et al. Alpha-fetoprotein response predicts survival benefits of thalidomide in advanced hepatocellular carcinoma. Aliment Pharmacol Ther. 2005;22(3):217–226. | |
Chan SL, Mo FK, Johnson PJ, et al. New utility of an old marker: serial alpha-fetoprotein measurement in predicting radiologic response and survival of patients with hepatocellular carcinoma undergoing systemic chemotherapy. J Clin Oncol. 2009;27(3):446–452. | |
Wilhelm SM, Adnane L, Newell P, Villanueva A, Llovet JM, Lynch M. Preclinical overview of sorafenib, a multikinase inhibitor that targets both Raf and VEGF and PDGF receptor tyrosine kinase signaling. Mol Cancer Ther. 2008;7(10):3129–3140. | |
Takeda H, Nishikawa H, Osaki Y, et al; Japanese Red Cross Liver Study Group. Clinical features associated with radiological response to sorafenib in unresectable hepatocellular carcinoma: a large multicenter study in Japan. Liver Int. Epub May 16, 2014. |
Supplementary material
 | Figure S1 Kaplan–Meier analysis according to log relative hazard ratio (LRHR) which was established using four independent risk factors: LRHR = exp[0.63 × Child-Pugh class (A=0, B=1) + 1.0 × tumor size (<10 cm=0, <10 cm=1) + 0.9 × portal vein invasion (absence =0, presence =1) + 0.9 × AFP response (presence =0, absence =1)]. When the study population was stratified according to the mean LRHR value, patients with LRHR <4 showed significantly better OS compared to those with LRHR ≥4 [median 6.2 months (95% CI, 3.8–8.5) versus 2.9 months (95% CI, 1.7–4.0), P<0.001 by log-rank test). |
 © 2015 The Author(s). This work is published and licensed by Dove Medical Press Limited. The full terms of this license are available at https://www.dovepress.com/terms.php and incorporate the Creative Commons Attribution - Non Commercial (unported, v3.0) License.
By accessing the work you hereby accept the Terms. Non-commercial uses of the work are permitted without any further permission from Dove Medical Press Limited, provided the work is properly attributed. For permission for commercial use of this work, please see paragraphs 4.2 and 5 of our Terms.
© 2015 The Author(s). This work is published and licensed by Dove Medical Press Limited. The full terms of this license are available at https://www.dovepress.com/terms.php and incorporate the Creative Commons Attribution - Non Commercial (unported, v3.0) License.
By accessing the work you hereby accept the Terms. Non-commercial uses of the work are permitted without any further permission from Dove Medical Press Limited, provided the work is properly attributed. For permission for commercial use of this work, please see paragraphs 4.2 and 5 of our Terms.