")
Back to Journals » OncoTargets and Therapy » Volume 13
Dysregulation of MiR-30a-3p/Gastrin Enhances Tumor Growth and Invasion throughSTAT3/MMP11 Pathway in Gastric Cancer
Authors Liu Y , Gao M, An J, Wang X , Jia Y, Xu J, Zhu J, Cui J, Li W, Xing R, Song L , Liu K, He Y, Sheng J , Qi S, Pan Y, Lu Y
Received 17 October 2019
Accepted for publication 26 July 2020
Published 25 August 2020 Volume 2020:13 Pages 8475—8493
DOI https://doi.org/10.2147/OTT.S235022
Checked for plagiarism Yes
Review by Single anonymous peer review
Peer reviewer comments 2
Editor who approved publication: Dr Sanjay Singh
Yan Liu,1,2,* Meng Gao,3,* Juan An,2,* Xin Wang,4 Yan Jia,4 Junfeng Xu,4 Jihai Zhu,5 Jiantao Cui,1 Wenmei Li,1 Rui Xing,1 Li Song,6 Kejia Liu,6 Yuqi He,4 Jianqiu Sheng,4 Shengmei Qi,3 Yuanming Pan,1,4 Youyong Lu1
1Laboratory of Molecular Oncology, Key Laboratory of Carcinogenesis and Translational Research, Ministry of Education, Beijing Cancer Hospital/Institute, School of Oncology, Peking University, Beijing, Haidian District 100142, People’s Republic of China; 2Department of Basic Medical Sciences, Medical College of Qinghai University, Xining City, Qinghai 810001, People’s Republic of China; 3OnkoRx Ltd. Beijing, Beijing, Haidian District 100085, People’s Republic of China; 4Department of Gastroenterology, The 7th Medical Center of Chinese PLA General Hospital, Beijing, Dongcheng District 100700, People’s Republic of China; 5Department of Cardiothoracic Surgery, The Affiliated Hospital of Qinghai University, Xining City, Qinghai 810001, People’s Republic of China; 6Yidu Cloud (Beijing) Technology Co., Ltd. 8F, Health Work, Beijing, Haidian District 100083, People’s Republic of China
*These authors contributed equally to this work
Correspondence: Youyong Lu, MD, Ph.D.
Laboratory of Molecular Oncology, Key Laboratory of Carcinogenesis and Translational Research, Ministry of Education, Beijing Cancer Hospital/Institute, School of Oncology, Peking University, Beijing 100142, People’s Republic of China
Tel +86-10-88196765
Fax +86-10-88122437
Email [email protected]
Background: Gastrin (GAST) is a well-known hormone regulating gastric biofunctions in the secretion of acid and maintaining its structural integrity. Furthermore, the dysregulation of GAST is also involved in the development of various forms of cancer. However, there are some limitations for illustrating the cellular regulation of GAST and its regulatory mechanisms in gastric malignant transformation and the potential epigenetic regulators systematically.
Methods: We explored the role of GAST expression in gastric cancer (GC) and normal tissues with the clinical features and investigated the potential relationship between GAST and STAT3/MMP11 pathway by gain or loss of function analyses. Besides, based on our microRNA/mRNA expression profiles, miR-30a-3p was the potential epigenetic regulator and additional experiments were performed to identify the hypothesis.
Results: Elevated GAST expression was frequently detected in GC and was associated with worse outcomes (p< 0.001). And we firstly demonstrated that GAST was negatively regulated by miR-30a-3p. Moreover, GAST induced GC cell proliferation, migration and invasion mediating STAT3/MMP11 pathway in this study.
Conclusion: MiR-30a-3p was the promising suppressor gene through negatively regulating the expression of GAST, and dysregulation of GAST was a prognostic signature associated cell proliferation and metastasis through STAT3/MMP11 pathway in GC.
Keywords: gastrin, proliferation, invasion, miR-30a-3p, STAT3/MMP11 pathway, gastric cancer
Plain Language Summary
Numerous information has accumulated showing that GAST plays the essential role in cancer progression in colorectal, stomach, liver, and pancreatic organs. However, the potential molecular pathways of GAST affecting tumorigenesis and the inner mechanisms involved in the regulation of GAST should be further investigated in gastric cancer (GC). In this study, we found that elevated GAST expression was frequently detected in GC at mRNA and protein levels, which was associated with poor clinical outcomes (overall survival). It induced GC cell proliferation, migration and invasion by upregulating MMP11 expression through activation of STAT3 signaling pathway using knockdown or restoration of GAST expression in GC cell lines and xenograft animal models. Interestingly, we also firstly demonstrated that GAST was negatively regulated by miR-30a-3p and miR-30a-3p was a promising tumor suppressor gene in GC. Collectively, we identified GAST expression was the potential target gene of miR-30a-3p, and miR-30a-3p was the promising tumor suppressor gene in GC. Furthermore, the subsequently elevated GAST expression promoted cell invasion and migration through STAT3 phosphorylation mediating the up-transactivation of downstream gene MMP11 in GC progression and development.
Introduction
Gastrin (GAST), a peptide hormone produced primarily by antral gastrin expressing cells (G-cells) in normal gastric antrum. Subsequent studies have confirmed that the post-translational processed form of GAST is an important physiological regulator of acid output and a regulator of proliferation in gastric epithelium in stomach, while hypergastrinemia characterizes autoimmune gastritis, with body and fundic gland atrophy and increased risk for both gastric adenocarcinoma and neuroendocrine tumors.1 Numerous information has accumulated showing that GAST plays an essential role in cancer progression in colorectal, stomach, liver, and pancreatic organs.2–4 However, the potential molecular pathways by GAST affecting tumorigenesis and the inner mechanisms involved in the regulation of GAST should be further investigated in GC. In this study, we initially observed that GAST was overexpressed in GC and its high level of expression was associated with advanced GC, lymph node metastasis and poor prognosis. It is well known that aberrant expression of GAST is influenced by environmental factors at the post-transcriptional level, such as H.pylori infection.5 In our previous study, we constructed a differential microRNA/mRNA expression profile and identified 17 miRNAs that downregulated in GC. In this study, we combined miRNA and mRNA expression profiles to select miRNAs co-expressed with GAST and then predicted the target of these miRNAs by using TargetScan. Based on this strategy, we identified GAST as the miR-30a-3p potential target gene and which will be further performed additional experiments to identify the hypothesis.
Using short-hairpin RNAs (shRNAs) are used to specifically suppress the expression GAST in GC cells, and we will illustrate the effects of knockdown GAST in cellular function and biology in this study. And the possible downstream pathway of GAST with STAT3/MMP11 signaling was identified and confirmed by Western blotting analyses using JAK2/STAT3 inhibitor WP1066 addition.
Methods
Cell Lines and Patient Specimens
Human gastric cancer cell-lines BGC823, MGC803, SGC7901, AGS, N87 and GES-1 (GES-1, human-derived immortalized gastric epithelial cell line) were ordered from the Type Culture Collection of the Chinese Academy of Sciences (Shanghai, China). All the cell lines were obtained the approval statement from the institutional review board of Beijing Cancer Hospital. These cells were cultured in Dulbecco’s modified Eagle’s medium (DMEM, GIBCO-BRL, Life Technologies, USA) with 5% or 10% FBS at 37°C in the presence of 5% CO2. Human gastric tumor tissues were collected from the tumor bank of Beijing Cancer Hospital and all samples were diagnosed with GC based on histopathological evaluation. The tumor histological grade was assessed according to the World Health Organization Criteria and was staged using the TNM staging of the American Joint Committee on Cancer (AJCC) 8th edition stage system of gastric cancer. The present clinical retrospective study and in the whole study related to these above cell lines were performed in accordance with the Declaration of Helsinki and the study protocol was reviewed and approved by the institutional review board of Beijing Cancer Hospital. Eligibility for inclusion in the present study should meet the following inclusion criteria: 1) aged ≥18 years with histopathologically confirmed gastric cancer; 2) had gastrectomy plus lymphadenectomy (radical or non-radical); 3) no preoperative neoadjuvant therapies (including chemotherapy and radiotherapy). While other patients who were pregnant or taking breastfeeding had previous or other synchronous malignancies, died in the perioperative period, had a history of familial coagulopathy, active disseminated intravascular coagulation, or thromboembolism, were diagnosed with acute inflammatory disease, liver cirrhosis or chronic rental failure, or who had received either anticoagulant or anti-aggregate therapies, were excluded from this study. In total, we enrolled 159 consecutive GC patients with complete clinical data and tumor tissues. All recruited patients had been followed up after surgery for more than 5 years prospectively. The outcomes were evaluated during clinical appointments at the outpatients clinic or by telephone contact.
Vector Construction and Transfection
The miR-30a-3p and GAST cDNA were PCR amplified with 50 ng of genomic DNA from BGC823 cell line. The DNA amplified was cloned into the BamH1/Xho1 sites of pcDNA-EGFP plasmid (Invitrogen, USA) to construct miR-30a-3p expression vector pc-miR-30a-3p. The wild-type full-length GAST CDS was cloned into the Xho I-Not I site of psiCHECK-2 plasmid (Promega, USA). Mutagenesis of miR-30a-3p binding site in the GAST CDS region was performed using QuickChange II XL site-directed mutagenesis kit. The CDS mutants were also cloned into psiCHECK-2 (Promega, USA) at restriction sites Xho I and Not I, and samples named as GAST-wt-Luci and GAST-mut-Luci. Two fragments of GAST knockdown were designed by the pSilencer 3.1 vector (Lifetech, USA). All the constructs were confirmed by DNA sequencing (Supplementary Figure 4). MiR-30a-3p mimics, miR-30a-3p inhibitors and their cognate control RNAs were purchased from Invitrogen. Transfection was performed using Lipofectamine 2000 (Invitrogen, USA) according to the manufacturer’s instructions. For transfection of the RNA oligonucleotides, 50 nmol/L of miRNA mimics or antisense oligonucleotides was used. For plasmids, 4 μg DNA was used in a six-well plate. G418 (400 μg/mL) was added 24 h after transfection to screen stably transfected cell clones. All the oligonucleotide sequences are listed in Supplementary Table 4.
RT-PCR
Total RNA from tissues and cells were extracted using a standard Trizol protocol (Invitrogen, Life Technologies, Grand Island, NY, USA), and 5 μg of RNA were used to synthesize cDNA using the SuperScriptVR III First-Strand Synthesis System according to the manufacturer’s instructions (Invitrogen). Real-time PCR was done using SYBR Premix Ex Taq (TaKaRa, Japan) to detect GAST gene expression; the annealing temperature was 62°C. The expression of GAST was calculated relative to an endogenous reference (β-actin). The primers used were exhibited in Supplementary Table 4.
Quantitative-PCR
Reverse transcription reactions are performed using the TaqMan microRNA Reverse Transcription Kit and microRNA-specific stem-loop primers (Lot No.4366597, Applied BioSystems, Inc.) Real-time PCR reactions were performed in 20 μL reaction volumes using 10 μL TaqMan 2× Universal PCR Master Mix with 1 μL miRNA-specific primer, and 1.33 μL diluted RT product per reaction. All assays were carried out on the Applied Biosystems 7500 Fast Real-Time PCR System (Applied Biosystems) using the following conditions: 95°C for 10 min, followed by 40 cycles of 95°C for 15 s and 60°C for 1 min. The comparative threshold cycle (ΔCt) method was used to measure the expression level of miR-30a-3p relative to the expression of an internal control (U6 small nuclear RNA). All the primers are listed in Supplementary Table 4.
Western Blot Analysis
The cells were collected and lysed in lysis buffer. Equal amounts of protein (50 μg) were separated by 12% SDS-PAGE and transferred to PVDF membrane using a standard protocol. The membrane was blocked with 5% skimmed milk in PBST for 1 h. Blots were then incubated with the primary specific antibody against gastrin-17 (GAST, 1:800, Abcam), STAT3 (1:500, Santa Cruz), p-STAT3 (Tyr705, 1:500, CST) and MMP11 (1:500, Abcam) overnight at 4°C, and sequentially with horseradish peroxidase-conjugated secondary antibodies (1:2000, Santa Cruz) for 1 h. β-Actin antibody (1:10,000, Sigma, St. Louis, MO, USA) was used as a control. The immune complexes were visualized using the ECL system (GE Health Care) following the manufacturer’s instruction.
Dual-Luciferase Reporter Gene Assay
BGC823 cells were transiently transfected with wild-type or mutant reporter plasmid and miR-30a-3p mimics using Lipofectamine 2000 (Invitrogen) according to manufacturer’s protocol. Reporter assays were performed 48h post-transfection using Dual-Luciferase Reporter Assay System (Promega), normalized for transfection efficiency by co-transfected Renilla-luciferase. All the primers are listed in Supplementary Table 4 and all experiments were performed at least three times.
In situ Hybridization
In situ detection of miR-30a-3p was performed on paraffin sections using DIG-labeled miRCURYTM Detection probe according to the manufacturer’s instructions (Exiqon, Denmark). Thirty-one cases of GC and non-tumor adjacent tissues were selected. Sections were deparaffinized and deproteinated, which was followed by prehybridization, hybridization, a stringency wash and immunological detection. The sections were then exposed to a streptavidin-peroxidase reaction system and developed with 3,3ʹ-diaminobenzidine (DAB). The miR30a-3p probe had the sequence/5DigN/GCTGCAAACATCCGACTGAAAG/3Dig_N/(predicted Tm: 80°C, measured Tm: 52°C). A U6 probe (sequence: CACGAATTTGCGTGTCATCCTT, predicted Tm: 75°C, measured Tm: 62°C, Exiqon, Denmark) was used as the positive control and a 22-mer scrambled probe with a random sequence was included as a negative control. (GTGTAACACGTCTATACGCCCA, predicted Tm: 78°C, Exiqon, Denmark).
Immunofluorescence Analysis of in situ Protein Expression
Cells were cultured on slides in 35 mm plates at 37°C, 5% CO2 for 24 h, fixed in 4% formaldehyde for 15 min and permeabilized in 0.5%Triton X-100 PBS 5 min at room temperature. The slides were then incubated with primary antibodies against GAST (diluted 1:200, Abcam), p-STAT3 (diluted 1:200, Santa Cruz) and MMP11 (diluted 1:200, CST) for overnight at 4°C. Slides were washed three times with 0.5% Triton X-100 PBS to remove excess primary antibody, and treated with goat anti-rabbit FITC conjugated secondary antibody (diluted 1:50) for 1 h at room temperature and then stained with DAPI to visualize nuclei, covered with glass coverslips and fluorescence photomicrographs were obtained by a DMI4000 confocal laser-scanning microscope (TCS-SP5; Leica, Mannheim, Germany).
Histo-Cytometry
Slides loaded with clinical GC tissue microarrays or lung tissues in GC associated metastasis animal model were deparaffinized in xylene and rehydrated in a graded alcohol series. Antigen retrieval was performed in citrate buffer (pH 6.0) at 95°C for 20 min and cooled down at room temperature. After the quenching of endogenous peroxidase in 3% H2O2, the slides were incubated with blocking reagent (ZSGB-BIO, Beijing, China) for 30 min at room temperature. Antigens were then successively detected using the Opal protocol: each primary antibody was incubated at 4°C overnight, followed by detection using HRP-conjugated secondary antibody (GBI Labs, Bothell, WA, USA) and TSA-fluor (1:100, PerkinElmer, Santa Clara, CA, USA), after which the primary and secondary antibodies were thoroughly eliminated by heating the slides in citrate buffer (pH 6.0) for 10 min at 95°C. In a serial fashion, each antigen was labeled with distinct fluorophores. Nuclei were subsequently visualized with DAPI (1:2000, DAKO), and the slides were cover-slipped using ProLong Gold Antifade Mountant (Thermo Fisher, Waltham, MA, USA). This Opal protocol of GAST (1:200, Abcam; Opal 690), p-STAT3 (Tyr705, 1:200, CST; Opal 620), MMP11 (1:200, Abcam; Opal 520), was applied to the GC tissue microarrays or lung tissues in GC associated metastasis animal models. The multiple fluorophore-antibody staining on the same tissue was photographed and analyzed by PerkinElmer.
MTT Assay
For the assessment of cell growth, the transfected cells were cultured into 96-well plates at a density of 5×10³ cells/well. One hundred μL MTT (5mg/mL) was added at 24, 48, 72 and 96 h, respectively. After 4 h of incubation at 37°C, the medium was replaced with 200μL dimethyl sulfoxide (DMSO) (Sigma) and vortexed to solubilize the formazan product for 15 min at room temperature. Optical density (OD) was read at 570 nm using a microplate reader (Bio-Rad, Hercules, CA, United States). Three independent experiments were done and data were collected and analyzed statistically.
Soft Agar Colony Formation Assay
The abilities of transfected cells to form macroscopically visible colonies in soft agar were determined according to standard protocol. 1.5×10³ cells were trypsin-digested into single-cell suspension and placed in triplicate onto 60 mm dishes in DMEM containing 0.3% agarose overlying a 0.6% agarose under-layer. Plates were incubated at 37°C, 5% CO2 for about 28 days and the colonies were stained with 0.2% p-Iodonitrotetrazolium violet (INT) and photographed.
Tumorigenicity Assay in Nude Mice
Six-week-old female BALB/c nude mice were housed under specific pathogen-free conditions in groups of five that were used in these experiments. Single-cell suspensions (5×10⁵ in 0.1 mL Hank’s buffered salt solution (HBSS)) were subcutaneously injected into the left flank of nude mice and the right side inoculated with control cells. The tumors were measured every 3 days with a caliper, and the diameters were recorded. Tumor volume was calculated using the formula: a2b/2, where a is the length and b is the width of the tumor.
Invasion and Migration Assays
Invasion assay was performed using the BD Biocoat Matrigel chamber in 24-well plates. 1.5×10⁵ of cells resuspended in the serum-free medium were placed in the top chamber of transwell invasion chambers. The lower chamber was filled with 750 µL DMEM supplemented with 10% FBS. In some cases, JAK2/STAT3 inhibitor (WP1066, Sigma) was also added to the upper and lower chambers. After 24 h incubation at 37°C, 5% CO2 incubator, the non-invading cells on the upper surface of the filter were carefully removed with a cotton swab. Migrated cells were fixed with methanol and stained with crystal violet for 20 min, stained with 0.1% crystal violet for 10 min at room temperature. The total number of cells adhering to the lower surface of the membrane was acquired in six representative fields (100× magnification). The migration assay was performed in the same way as the invasion assay except that the membrane was not coated with Matrigel (BD Biosciences, San Jose, CA, USA).
Scratch Assay
The cells were seeded into 60 mm culture dishes for 24 h at a concentration of 5×10⁵ cells/mL and cultured in medium containing 5% FBS to nearly confluent cell monolayers. Then, a linear wound was generated in the monolayer with a sterile 200μL plastic pipette tip. Plates were washed twice with PBS to remove detached cells and incubated at 37°C with 5% CO2. Three representative images (0 h, 12 h, 24 h) from culture dishes showing the scratched areas under each condition were photographed to estimate the relative migration of transfected cells. The experiments were repeated three times.
Metastasis Assay in xenograft models
GAST knockdown cells and control cells (2×10⁶ cells in 500 mL of PBS) were injected into the lateral tail veins of 4 week-old BALB/c nude female mice, respectively (six mice per group). After 4 weeks, all the mice were killed under anesthesia. The lungs were collected and fixed in 10% formalin. For tissue morphology evaluation, HE staining and histo-cytometry immunofluorescence observations were performed on sections from embedded samples.
Statistical Analysis
Statistical analysis was performed using the SPSS22.0 software. Data were expressed as Mean±SD of at least three independent experiments. The Student’s t-test was used to analyze the differences between the two groups. The relationship between miR-30a-3p and GAST mRNA expression or the expression of GAST and STAT3/MMP11 pathway was explored by Pearson's correlation. Differences were considered statistically significant at * p<0.05 and ** p<0.01.
Results
Enhanced GAST Was Associated with Poor Outcome in GC
We first evaluated the status of GAST expression on a panel of GC cell lines and an immortalized normal cell-line GES-1, in order to subsequently focus on a model cell-line for systematic biological characteristic exploration. RT-PCR and Western blot data were shown that BGC823 and N87 cells had markedly elevated levels of GAST, while the lowest expression level in SGC7901 cells (Figure 1A and 1B).
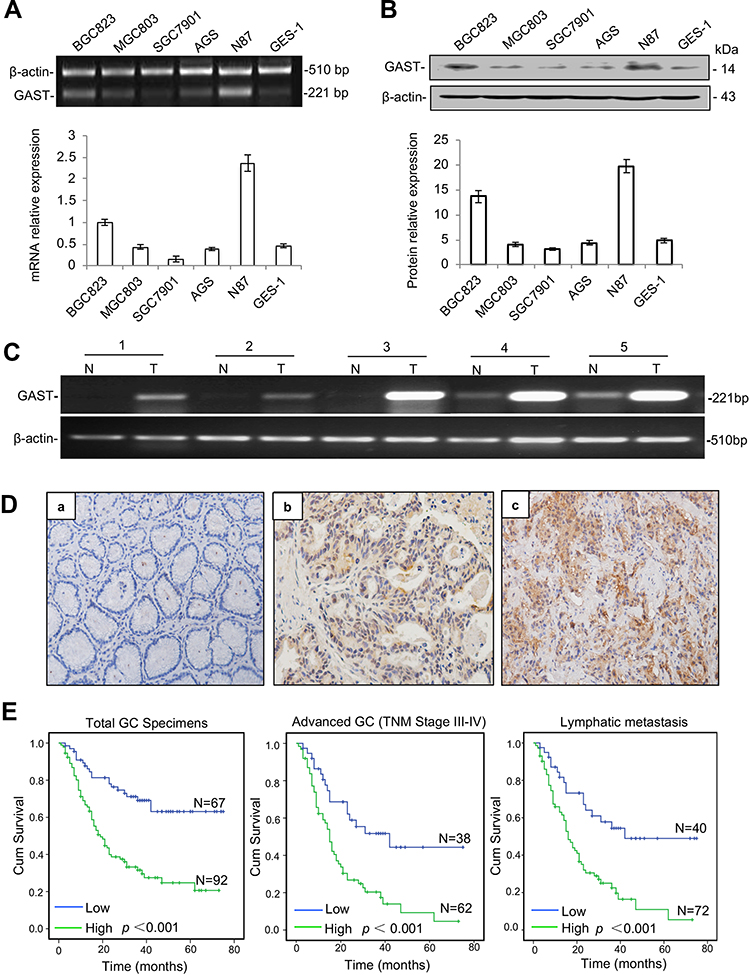 |
Figure 1 Enhanced GAST expression was associated with poor survival in GC. (A) GAST mRNA level was measured by RT-PCR (top) and qPCR (bottom) in gastric cell lines described in Materials and Methods and which was repeated for three times. (B) GAST protein level was measured and repeated for three times using Western blot analysis in these gastric cell lines (top), and the columns represented grey scanning analysis from Western blot results (bottom). (C) Differential expression of GAST mRNA in matched GC samples detected by RT-PCR analysis. (D) GAST protein was assessed by IHC assay (400×). (a) Negative staining of GAST in adjacent normal tissues. (b, c) Positive staining of GAST in GC tissues. (E) Kaplan–Meier analysis of overall survival of GC patients according to GAST expression in all the GC patients, (n=159, p<0.001), the patients with advanced GC (n=100, p<0.001) and the patients with lymphatic metastasis (n=112, p<0.001), respectively. |
To compare with the level of GAST expression between GC and adjacent normal tissues, we performed five matched fresh GC samples using RT-PCR and 159 paraffin-embedded GC samples with 102 adjacent normal tissues from surgical operation by immunostaining assay. The higher level of GAST mRNA expression was detected in GC samples than that in paired normal ones (Figure 1C). At the protein level, the high level of GAST was 92 of 159 (57.9%) GC and in 31 of 102 (30.4%) normal tissues (Figure 1D, Table 1, p<0.001). We analyzed the association between GAST expression and 159 patients’ survival status by Kaplan-Meier survival analysis. The survival curves showed that a high level of GAST expression significantly was related to the poor survival (Table 2 and Figure 1E, p<0.001). Moreover, in advanced GC group (n=100) or patients with lymph node metastasis (n=112), high level of GAST expression group had worse outcome than low-level group, respectively (p<0.001, p<0.001, Figure 1E). To further understand the pathophysiological significance of GAST with clinical characteristics, the clinicopathological data are summarized in Table 3. According to Table 3, we found that the high level of GAST expression was apparently associated with survival status (p<0.001) and lymph node metastasis (p=0.008).
 |
Table 1 The Different Expression of GAST, MMP11 and p-STAT3 Between GC Samples and Normal Tissues |
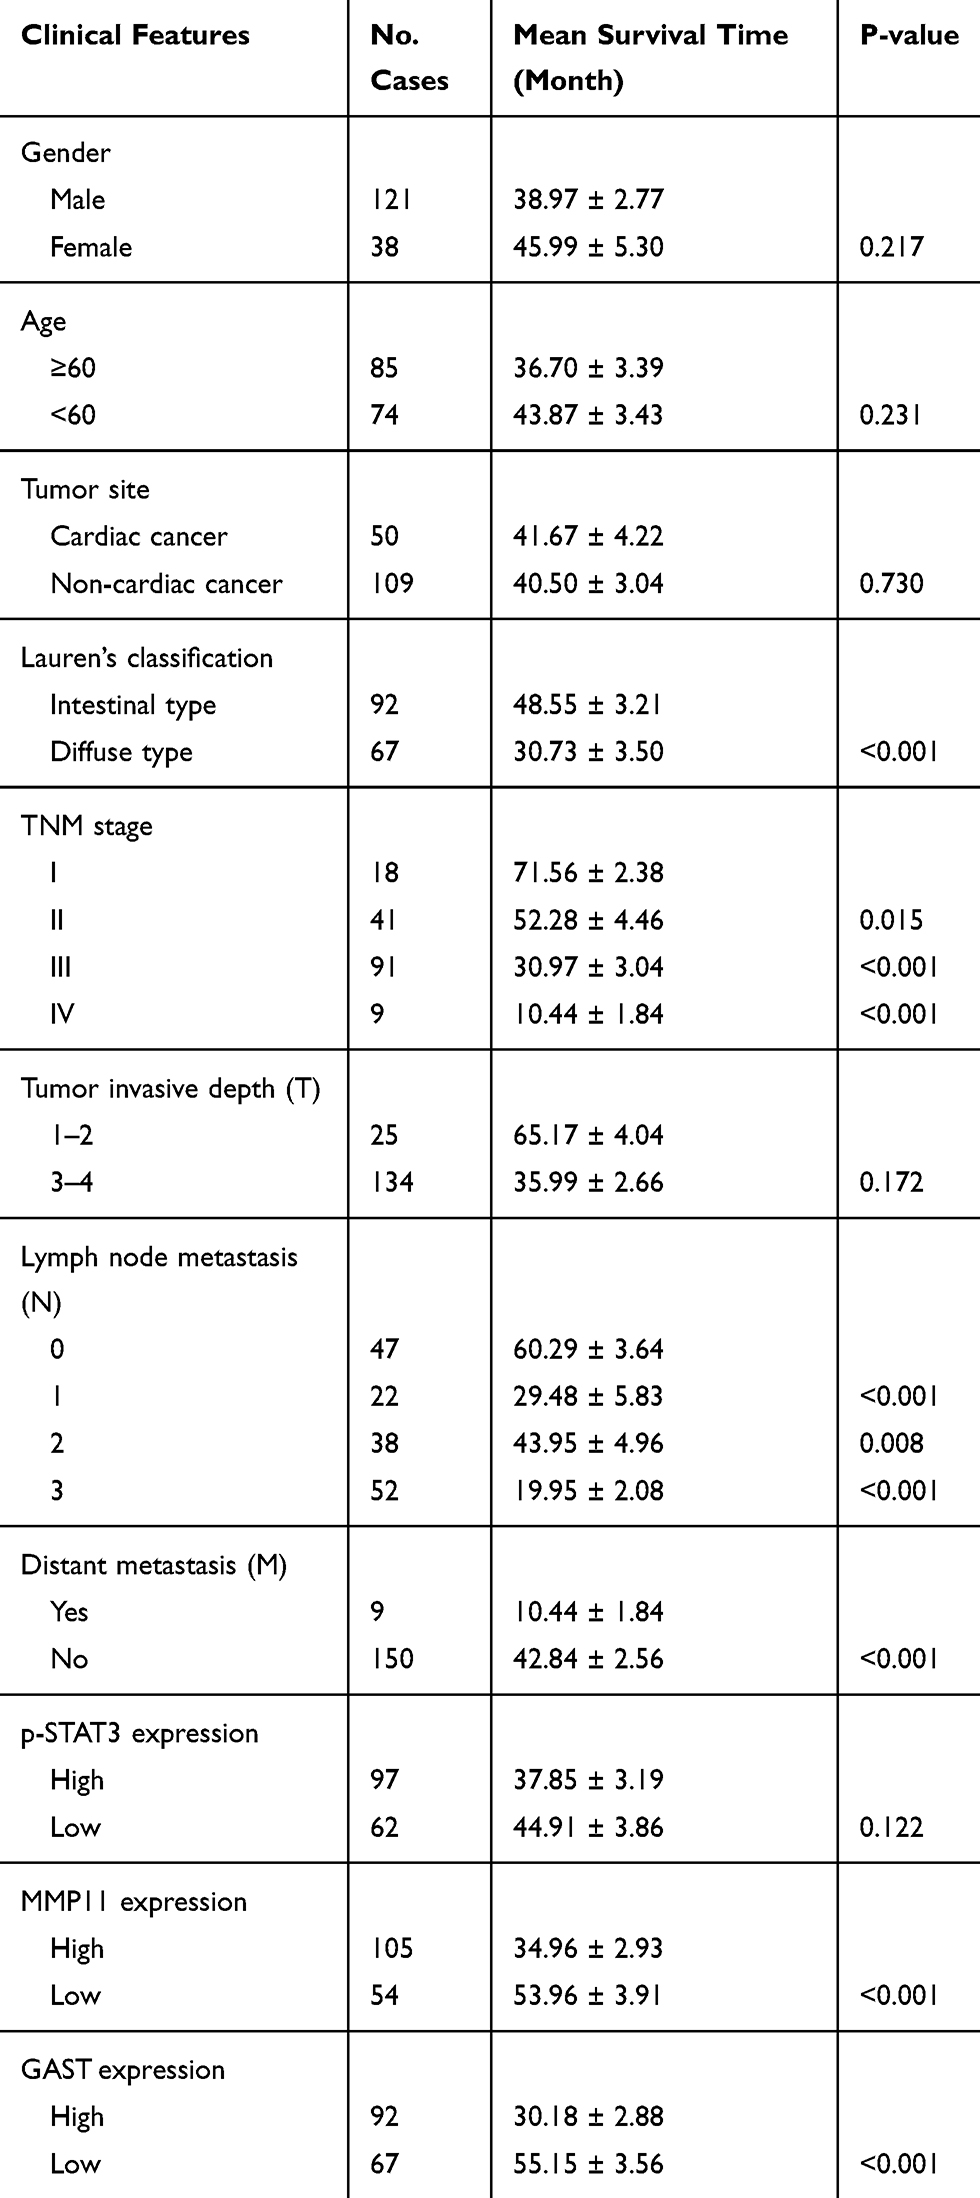 |
Table 2 Univariate Analysis of Clinical Features Associated with Overall Survival of Patients with GC |
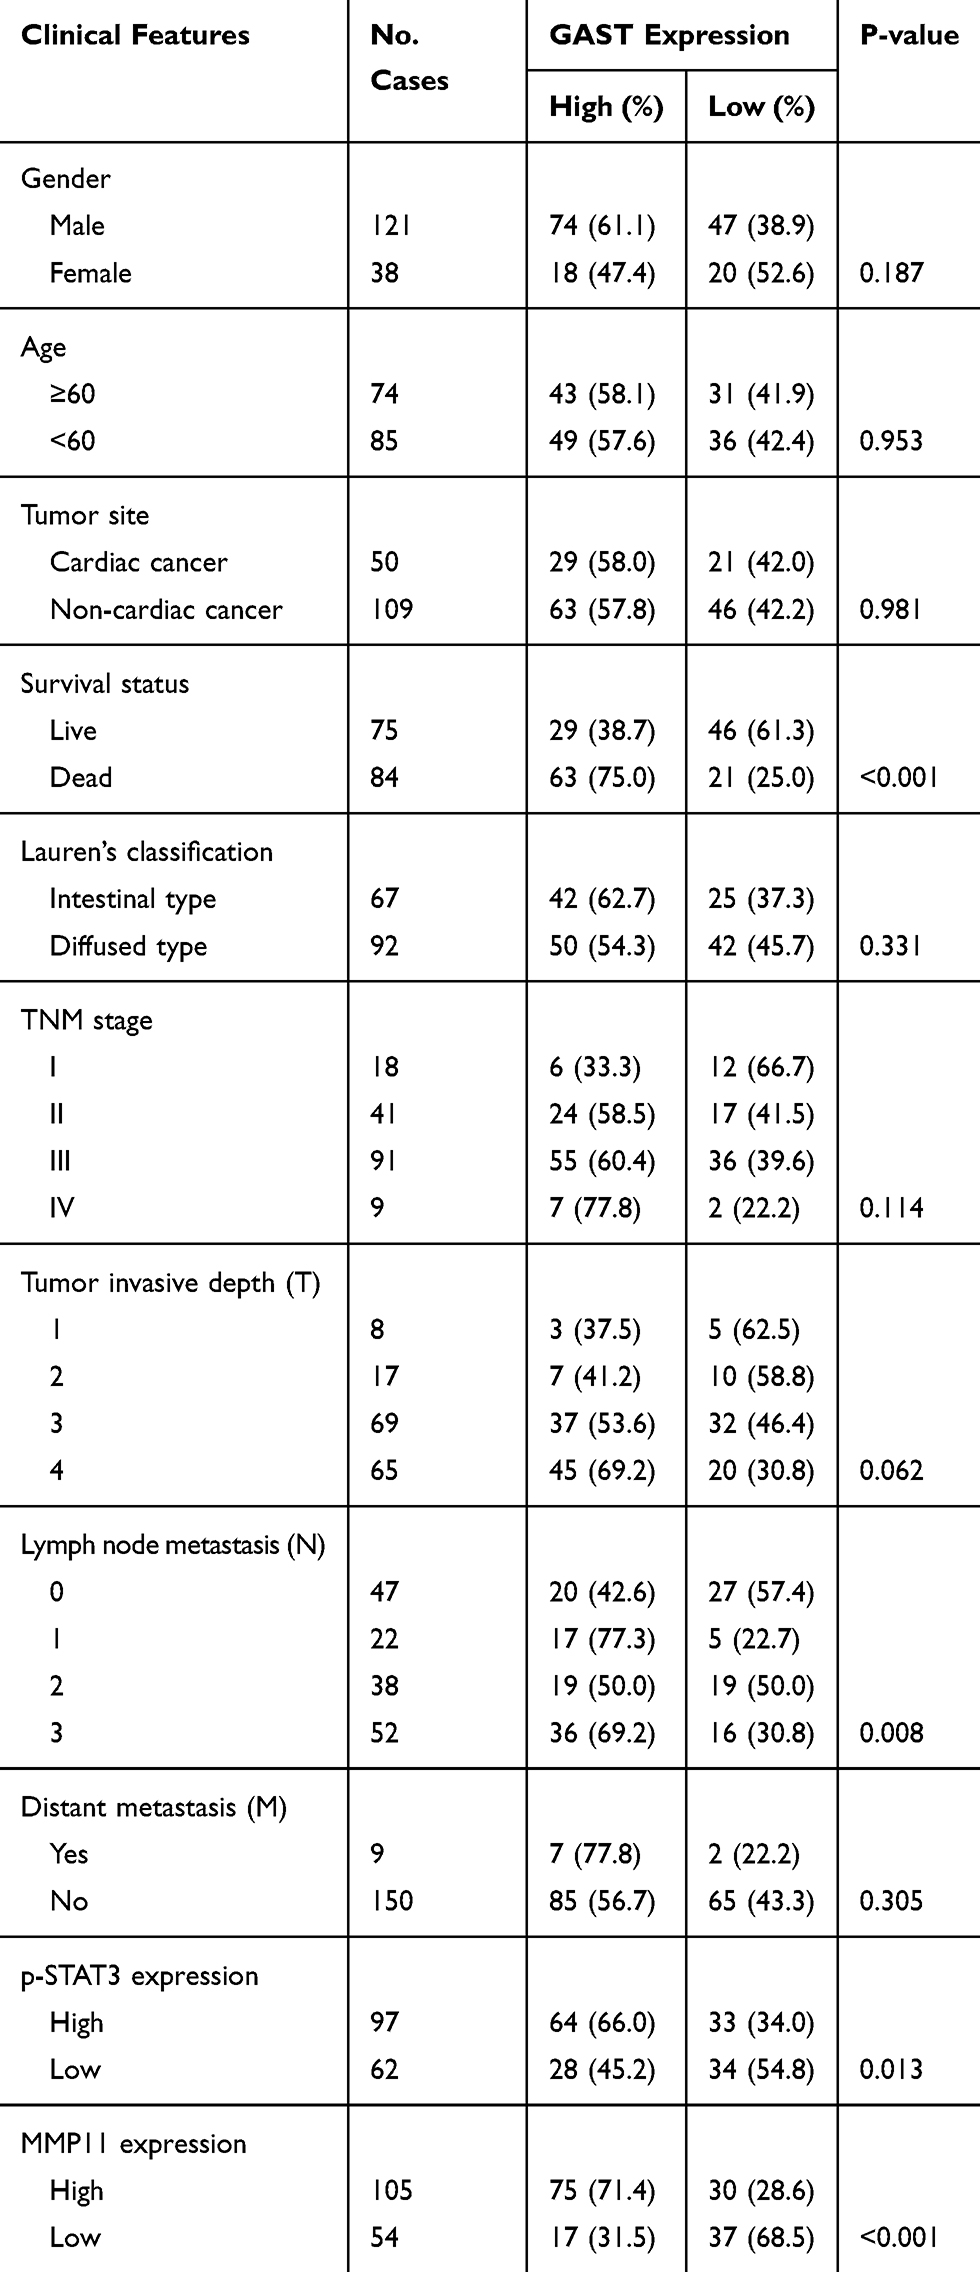 |
Table 3 The Correlations Between GAST Expression and Other Clinical Features |
To further understand the pathophysiological contribution of clinical features associated with the overall survival of GC patients using Univariate analysis (Table 2) and multivariate Cox regression analyses (Table 4).
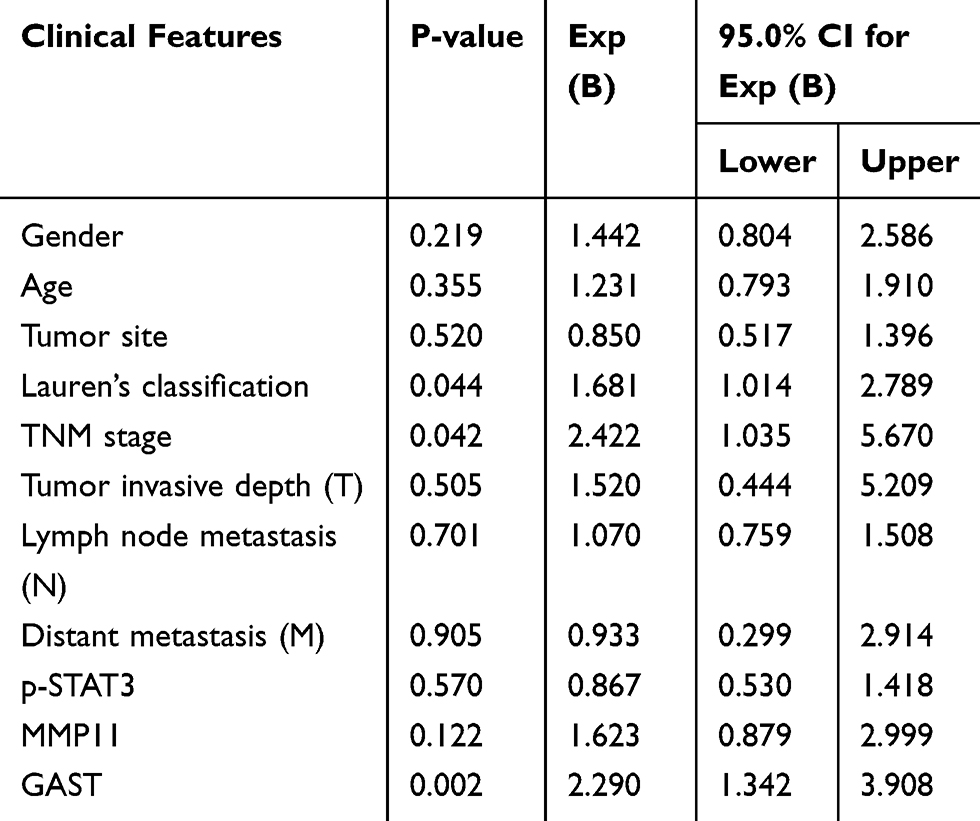 |
Table 4 Multivariate Analysis of Clinical Features Associated with Overall Survival of Patients with GC |
Kaplan-Meier estimation of survival functions indicated that Lauren’s classification (p<0.001), TNM stage (p<0.05), lymph node metastasis (p<0.05), distant metastasis (p<0.001) and elevated GAST expression were associated with the outcome of GC patients using Univariate analysis (Table 2). Furthermore, in multivariate Cox regression analysis, Lauren’s classification (p=0.044), TNM stage (p=0.042) and GAST expression (p=0.002) were the independent factors for the overall survival in GC patients (Table 4).
Collectively, these findings strongly suggest a high level of GAST was detected in GC samples, and patients with a high level of GAST were associated with worse prognosis, which was associated with lymph node metastasis. The inner mechanism of GAST in the malignant proliferation and metastasis should be investigated.
Silenced GAST Suppresses Cell Malignancy in this study
Overexpressed GAST occurred in GC development and progression. In order to study the effects of silenced GAST on the cellular growth, we used short-hairpin RNAs (shRNAs) to specifically target and suppress the GAST gene expression in BGC823 cells. We demonstrated significantly decreased growth rates in stable interference cell-clones pshRNA-1 and pshRNA-2 compared to that of the control cells (p<0.05, Figure 2A). The reduced growth rate correlated directly with the reduced GAST gene expression. Next, soft agar colony formation assay was performed to evaluate the capacity of cells to form macroscopically visible colonies. Compared to the non-inhibited control, both shGAST-1 and shGAST-2 cell clones exhibited not only lesser amounts of colonies (p<0.01, Figure 2B), but also smaller sizes of colonies (p<0.01, Figure 2B).
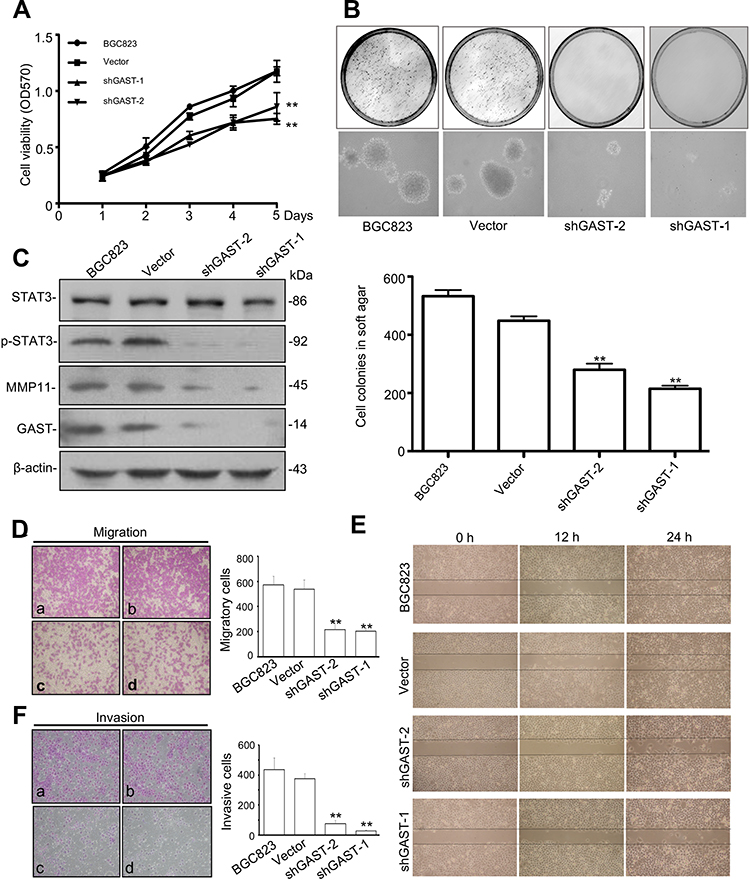 |
Figure 2 GAST regulated the malignancy through p-STAT3 activation and MMP11 expression in GC cells. (A) The proliferation curves were determined using MTT assay in BGC823 parent cells and cells transfected with empty vector or silenced GAST plasmids. The data were presented as Mean±SD from three independent experiments. (B) Representative image of colony formation by knockdown of GAST expression in BGC823 cells. The cell colonies were stained with 0.2% INT solution and photographed. Colony-forming ability was dramatically decreased in shGAST transfected cells compared with empty controls (100×). The column represented the mean number of colonies from three independent experiments. (C) Silenced GAST deceased the activation of p-STAT3 and MMP11 expression using Western blotting analysis. (D, E) Cell migration and invasion were performed with the transwell assay. Knockdown of GAST expression suppressed cell migration and invasion in BGC823 cells. Data are presented as Mean±SD. (F) Cell monolayer scratching assay showing the different time points of cell migration ability of BGC823 cells with transfected with shGAST constructs or the empty vector. All the experiments were repeated for three times. (**p<0.01). |
Due to the observation that the patients with GC overexpressing GAST represented the more aggressive phenotype, we hypothesized that GAST could induce or promote metastatic behaviors in GC. The transwell assay was employed to detect any effect on the migration and invasion of GC cells following silenced GAST expression. First, we detected invasive activity using a trans-well chamber coated with matrigel prior to silenced GAST using transfected cells. Then, GAST-knockdown transfected cells were added to the inside of the upper chamber, after 24 h, cells that passed through matrigel-coated filter pores and invaded into the lower surface of the filters were counted under a microscope. As shown in Figure 2F, the number of invasive cells was considerably reduced when compared with non-knockdown control cells, and the shGAST-1 colonies had the obviously decreased compared with the shGAST-2 colonies in GC cell lines (p<0.01). Thus, the invasive ability of BGC823 down-regulated after GAST-shRNA was significantly diminished compared with that of the control cells expressing higher levels of GAST.
Additionally, we tested the effects of knockdown of GAST on cell growth and metastasis in animal models. As shown in Figure 4C, the groups with GAST-knockdown cells formed substantially smaller tumor sizes or tumor weights in nude mice than did the empty vector groups (Figure 4A and 4C, p < 0.05, respectively). Using IHC analysis, we observed the stronger staining of GAST in non-knockdown control tumors. In striking contrast, almost less staining with GAST, MMP11 and p-STAT3 antibodies were observed in the shGAST transfected xenografts (Figure 4B). Moreover, data from metastasis assay in xenograft models (Figure 4D), the number of lung metastatic sites in shGAST group was less than that in the negative control (Vector) (P<0.01). Less micro-metastases were detected in shGAST group than that in the negative control (Vector) by HE staining. Moreover, we also find that low levels of GAST, MMP11 and p-STAT3 expression were detected by Western blotting, IHC staining and multiple fluorophore-antibody staining in shGAST group compared with that in negative control (Vector) (Figures 2C, 4B and E).
To further explore the potential role of GAST in metastasis, we evaluated the effects of control and knockdown GAST on GC cell migration using the trans-well chambers not-coated with Matrigel. Consistent with the prior invasion assays, these results showed that the numbers of GAST-knockdown motile cells that passed through non-Matrigel filters and migrating to the lower surfaces of the filters was decreased significantly compared with non-knockdown control cells (p<0.01, Figure 2D). To validate this observation more firmly, we subsequently analyzed the cell migration ability using the “scratch wounding” assay, which measures the expansion of a cell population on solid surfaces. As can be seen in Figure 2E, knockdown GAST cells moved more slowly than the control ones; after 24 h, in the control group, the gap in the scratch wounds were almost sealed, but there was still a large gap remaining in the GAST-knockdown transfected cell group (Figure 2E), all the experiments were repeated for three times. Taken together, these results indicated that silenced GAST expression had a significant inhibitory effect on GC cell migration.
To further evaluate the effects of GAST on GC cell proliferation, we successfully obtained the GAST overexpressing SGC7901 cell line using RT-PCR, qPCR, Western blotting and immunostaining assays (Figure 5A–5D). The MTT result was shown that cell proliferation of GAST-overexpressing SGC7901 cell colonies (SGC7901-G1 & SGC7901-G9) were quicker than that of the empty vector ones (SGC7901-V) and parent cells for each tested time point (p<0.05, Figure 5E). Soft agar colony formation assay was shown that, as compared to the vector-transfected SGC7901 (SGC7901-V) and parent cells, both SGC7901-G1 and SGC7901-G9 cell colonies exhibited not only more amounts of colonies but also bigger sizes of colonies (Figure 5F, p<0.01). Moreover, we also tested the effects of GAST overexpression on cell growth in tumor-bearing models. As shown in Figure 5G and Supplementary Figure 2A, animals bearing GAST-overexpressing cells formed bigger tumor sizes and tumor weights substantially than those with lower GAST expressing control (p < 0.05, respectively), without the significant differences between the average body weights in these groups (Supplementary Figure 2B). IHC analysis also confirmed a stronger staining of GAST in overexpressing GAST SGC7901 cells. These above MTT assay, soft agar colony formation assay and xenograft study revealed that overexpressed GAST promoted cell growth both in this study.
To further explore the effect of GAST on tumor metastasis in animal models, the experimental pulmonary metastasis experiment using xenograft model of the GAST-knockdown BGC823 cells in the nude mice was examined, which was a well-established model to detect the effect of genes on metastasis. Accordingly, GAST-knockdown transfected cells were transplanted into nude mice by tail-vein injection. After 4 weeks, mice were anesthetized and lungs were dissected, HE and IHC immunostaining was performed to evaluate tissue morphology. As shown in Figure 5D and 5F, GAST-knockdown interference cells had small pulmonary metastatic nodules, whereas the non-knockdown control group had extensive and higher levels of lung metastasis, suggesting a critical role of GAST as a significant promoter of metastasis in animal models (Supplementary Figure 2C).
GAST Regulated MMP11 Expression Through Activation of STAT3 Signaling
To investigate the possible mechanisms of GAST involved in the regulation of cell metastasis, we focused on the proteins in STAT3 signaling pathway, which closely associated with cellular metastasis. Western blot, immunofluorescence and IHC analyses were exhibited that silenced GAST led to a prominent reduction of phosphorylated STAT3 (Tyr705) (Figures 2C, 3A, 4B and 4E), while the level of total STAT3 protein was not altered (Figure 2C). Especially, consistent with Western blot results, the confocal image exhibited strong p-STAT3 expression in cytoplasm and nucleus of control cells, but rather weak cytoplasmic expression and negligible nuclear expression in the silenced GAST cells. We also saw a strong level of MMP11 expression in the cytoplasm of non-knockdown control cells but a much weaker level of MMP11 expression in the GAST-knockdown transfected GC cells. Furthermore, the downstream gene of MMP11 was significantly down-regulated in JAK2/STAT3 pathway after knockdown of GAST expression (Figures 2C, 3A, 4B and 4E). These findings suggest that downregulated GAST expression in BGC823 cell led to the significant attenuating of p-STAT3 and MMP11 expression. Meanwhile, in the ectopic expressing GAST of SGC7901 cells, p-STAT3 and MMP11 were elevated in tumor-bearing models (Figure 5H).
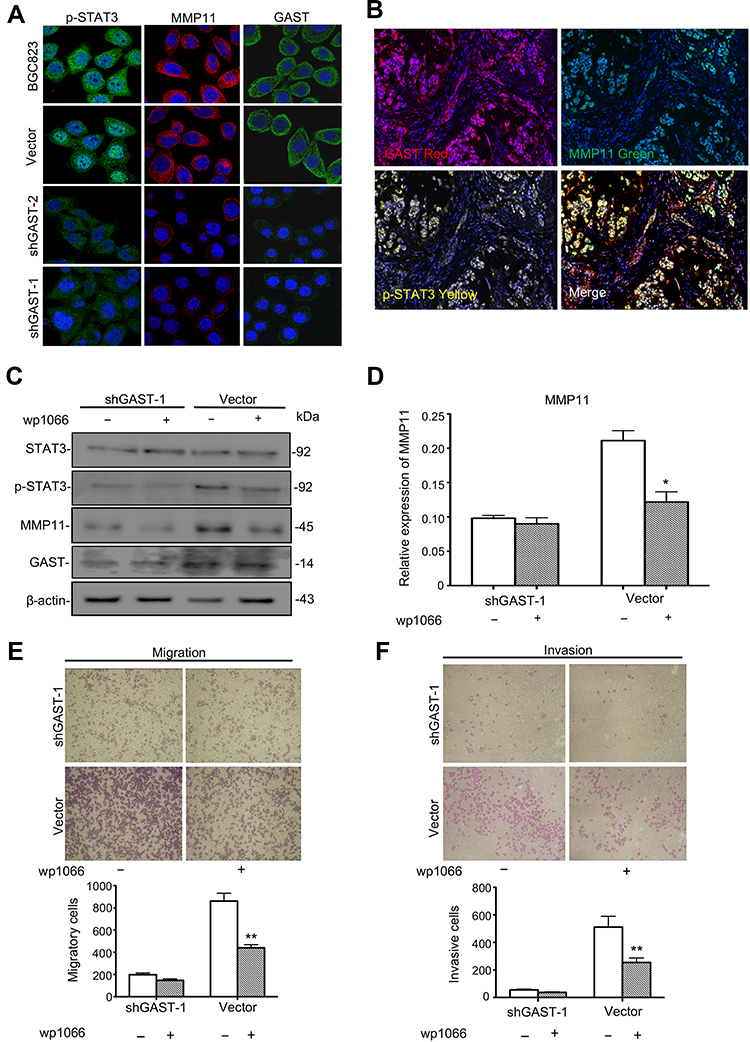 |
Figure 3 The potential role of GAST in the STAT3/MMP11 pathway. (A) Immunofluorescence detection of p-STAT3, MMP11 and GAST expression in BGC823 cell clones stably transfected with shGAST plasmids or empty vector. Immunofluorescence images of GAST-silenced cells and control cells stained for p-STAT3 (green), MMP11 (red) and GAST (green) (cell nuclei counterstained with DAPI in blue). (B) Immunofluorescence detection of p-STAT3, MMP11 and GAST expression in the same GC specimens. (C) Western blot analysis was used to detect the expression level of STAT3, p-STAT3 (Tyr705), MMP11 and GAST in the stable transfected cell clones with or without the JAK2/STAT3 inhibitor WP1066 addition by Western blot analysis, β-actin was used as the internal control. (D) Gray scanning analysis showed the expression levels of MMP11 with or without the JAK2/STAT3 inhibitor WP1066 addition in the relative transfected cells. The more decrease of MMP11 in cells with knockdown of GAST than that in cells with WP1066 addition. (E, F) Invasion and migration assays were conducted in transfected cells with or without WP1066 addition. The numbers represented Mean±SD in three independent experiments respectively. *p<0.05, **p<0.01. |
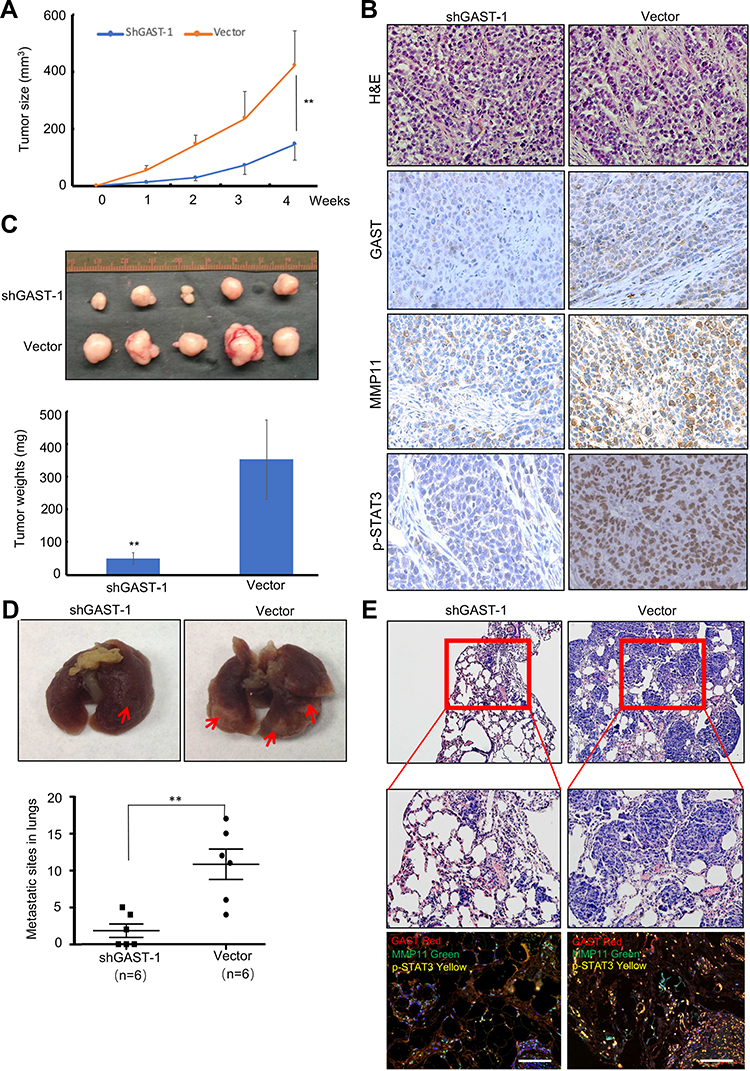 |
Figure 4 Silenced GAST suppressed the tumorigenicity and metastasis in animal models. (A) Tumor growth curves were recorded based on mean tumor volume at different time points. (B) Representative Tumor macroscopic appearances dissected from the nude mice of different groups and the average tumor weight in ShGAST-1 group was smaller than that in vector group. Data were presented as Mean±SD. (C) IHC staining of GAST, MMP11 and p-STAT3 (Tyr705) in paraffin-embedded sections from the silenced GAST group and empty vector group. Silenced GAST led to the decrease of p-STAT3 and MMP11. (D) Representative images of lungs. Lungs isolated from mice of interference cells and control cells. Red arrows exhibited the pulmonary metastatic nodules. The numbers of pulmonary metastatic nodules in lungs were counted and analyzed by the Student’s t-test method. Statistical plot showed the metastasis loci counted under the microscope per visual field. (E) Representative images of hematoxylin and eosin (HE)-staining of lungs. The lung tissues were made HE dying and observed under a light microscope (Up:100×, Bottom: 200×). GAST knockdown significantly inhibited xenograft tumor invasion into lungs. Confocal analyses of GAST, p-STAT3 and MMP11 expression were exhibited in the shGAST-1 and vector groups. **p<0.01. |
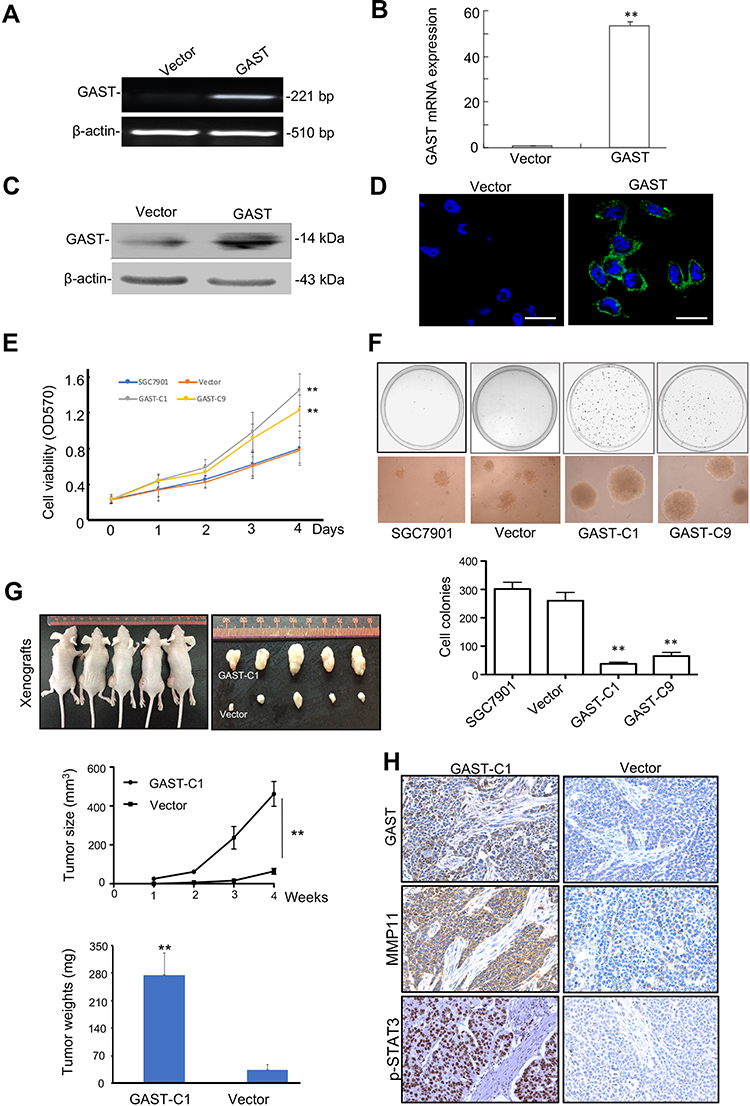 |
Figure 5 Ectopic expression of GAST promoted SGC7901 cell proliferation in this study. (A, B, C, D) Ectopic expression of GAST in SGC7901 cells detected by RT-PCR, qPCR, Western blotting and Immunofluorescence analyses, respectively. All the experiments were repeated for three times. (E) Cell viability was detected by MTT assay between stably transfection with empty vector and overexpressed GAST colonies (GAST-C1 and GAST-C9) for three independent experiments. The data are presented as Mean±SD. (F) More aggressive malignancy was detected in SGC7901 cells transfected with ectopic expressed GAST construct by soft agar assay for three independent experiments. Colony-forming ability was dramatically increased in GAST-overexpression cells compared with control cells (100×). The cell colonies were stained with 0.2% INT solution and photographed. (G) Ectopic expression of GAST promotes SGC7901 tumorigenicity in nude mice through tumor size measurement for each week and tumor weights after sacrificing the tumor-bearing mice. (H) The differential expression of GAST, p-STAT3 and MMP11 using IHC staining in the tumor xenografts sections. ** p<0.01. |
In the clinical samples, we further investigated the correlation between GAST expression and the STAT3/MMP11 pathway. GAST expression was moderately positively correlated with p-STAT3 status (p=0.013, Spearman’s R=0.206, Table 3 and Supplementary Table 3) or MMP11 expression in GC samples (p<0.001, Spearman’s R=0.383, Table 3 and Supplementary Table 3). While in normal samples, the similar correlations between GAST expression and the STAT3/MMP11 pathway were also proved (p = 0.002 between GAST and p-STAT3 expression, Spearman’s R=0.322; p<0.001 between GAST and MMP11 expression, Spearman’s R=0.367, Table 3 and Supplementary Table 3). Moreover, the co-expression of GAST, MMP11 and p-STAT3 expression was mostly observed in the same GC samples using Confocal analysis (Figure 3B).
To investigate if the activation of STAT3 was directly involved in GAST-induced metastasis of GC cells, we studied the effect of pharmacologic inhibitors of STAT3 (WP1066) on GAST-induced stimulation of migration and invasion. After the STAT3 inhibitor addition, WP1066, with the concentration of 5 µM for 2 h, a prominent decreased expression of MMP11 was observed in the control cells, but this decline was only slightly noted in the GAST-knockdown cells, indicating that GAST probably regulated the expression of MMP11 mainly through activating p-STAT3 (Figure 3C and 3D, p<0.05). Moreover, treatment of GC cells with WP1066 could inhibit the invasive and migratory abilities of BGC823 cells and we noted that the inhibition rates of WP1066 on invasive and migration abilities of control cells were 49.7% and 50.6%, respectively, significantly higher than 32.7% and 25.8% of the GAST-silenced cells. These experimental results suggested that the STAT3 pathway likely mediated transactivation of MMP11 induced by GAST (Figure 3E and 3F, p<0.05).
Inverse Correlation Between MiR-30a-3p and GAST Expression in GC
In a previous study, we found a significant decrease in a set of miRNAs in GC in comparison to normal tissue using microRNA profiling (Figure 6A). Integrating the above miRNA expression profiling data with TargetScan predictions, miR-30a-3p was selected to regulate GAST expression (Supplementary Figure 3). As shown in Figure 6B, the miRNA: mRNA alignment analysis showed that the CDS of GAST contains putative binding sites for miR-30a-3p located at 358–364 nt. Next, the levels of miR-30a-3p and GAST expression were detected in gastric cell lines. As indicated in Figure 6C, miR-30a-3p levels were relatively lower in BGC83 and N87 cells, which expressed a higher level of GAST (Figure 1B), but miR-30a-3p levels were higher in SGC7901 cells that expressed a low level of GAST (Figure 1B). This relationship between miR-30a-3p is apparently inversely correlated with GAST gene expression in human GC cell lines (Figure 6E).
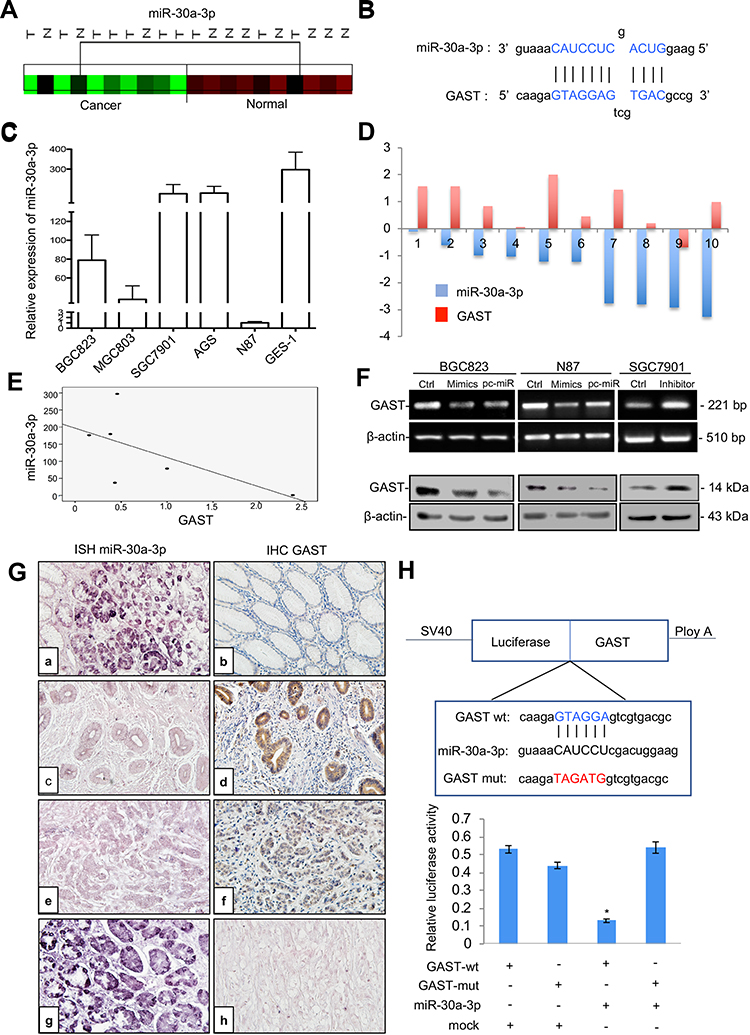 |
Figure 6 GAST was the direct target gene of miR-30a-3p in GC. (A) Cluster analysis of miR-30a-3p expression patterns in our GC miRNA profiling data. (B) The binding sites of miR-30a-3p sequences in the CDS of GAST gene. (C) qPCR analysis detected miR-30a-3p expression levels in a panel of gastric cell lines. U6 was used as the endogenous control for microRNA expression analysis. (D) Histogram showing the expression of GAST and miR-30a-3p in GC tissues and matched normal tissues. The levels of GAST mRNA were quantified by RT-PCR analysis. TaqMan qPCR analysis of miR-30a-3p in 10 paired GC samples. (E) The apparently inverse correlation between GAST and miR-30a-3p expression in gastric cell lines. (F) RT-PCR (upper) and Western blots (lower) analyses were used to monitor the effect of miR-30a-3p on the expression level of GAST in BGC823 and N87 GC cells liens. (B) RT-PCR (upper) and Western blot (lower) analyses were used to monitor the effect of miR-30a-3p inhibitor or mimics on the expression level of GAST in GC cell lines, which indicated the potential inverse correlation between miR-30a-3p and GAST. (G) ISH and IHC staining assays were used to detect the expression patterns of miR-30a-3p and GAST in 31 cases of GC and matched normal ones, respectively. (A) MiR-30a-3p was highly expressed in normal tissues. (C, E) Decreased or absent miR-30a-3p expression was detected in GCs. (B) Decreased or absent GAST expression was detected in normal tissues. d, f. GAST was highly expressed in GCs. (G) DIG-labeled LNA snRNA U6 probe were used as the positive control. DIG-labeled LNA scrambled sequence probe was used as the negative control. There was a statistically significant inverse correlation between miR-30a-3p and GAST (R=−0.265, p<0.01) in these samples. (H) The results from three independent dual-luciferase reporter assays indicated that GAST was the direct targeting of miR-30a-3p. Compared with the mutant-type and wild-type of GAST CDS groups, the reporter assays showed a significantly decreased luciferase activity in the wild-type group. *p<0.01. |
To explore whether this observation could be extrapolated to primary GCs, we examined GAST and miR-30a-3p expression in 10 paired GC specimens using RT-PCR and TaqMan qPCR. We found that GAST was increased in 70% of GC compared with normal tissues, but miR-30a-3p was significantly decreased in all 10 of these tumor tissues (Figure 6D).
Further, we expanded the potential miRNA analysis by quantitating miR-30a-3p and GAST protein level in 31 cases of paired GC tissues using in situ hybridization and IHC assays. Consistent with the PCR data, downregulation of miR-30a-3p was observed in tumor tissues compared to the primary normal tissues and GAST expression was inversely correlated with miR-30a-3p expression. Pearson’s correlation analysis showed a statistically significant inverse correlation (R2=−0.62, p=0.038) in these samples. These data strongly suggested that miR-30a-3p reduction might be contributed to the overexpression of GAST in GC samples (Figure 6G).
Previously, we constructed differential microRNA/mRNA expression profile by using 10 pairs of GC tissues, and identified 17 miRNA that down-regulated in GC tissues. In this study, we combined miRNA and mRNA expression profiles to select miRNAs co-expressed with GAST, and then predicted the target of these miRNAs by using TargetScan. Based on this strategy, miR-30a-3p, miR-30d and let-7c were identified (Supplementary Figure 3A). By using RT-PCR (Supplementary Figure 3B) and Western Blot (Supplementary Figure 3C), we focused that miR-30a could markedly regulate the expression of GAST.
To confirm that GAST expression was a potential target gene of miR-30a-3p, we selected BGC823 and N87 cells, expressed a higher level of GAST using miR-30a-3p mimics or the relative scrambled negative control (Ctrl) transfection, and SGC7901 cells with the lower expression of GAST were transfected with miR-30a-3p inhibitor or the relative negative control. RT-PCR and Western blot analysis indicated that the mRNA and protein levels of GAST were negatively regulated by miR-30a-3p in GC cells (Figure 6F). To further validate the direct targeting of GAST by miR-30a-3p, dual-luciferase reporter assays were conducted. We created wild-type and mutant-type CDS constructs for the putative GAST binding sites of miR-30a-3p and co-transfected BGC823 cells with these miR-30a-3p mimics. Compared with mutant-type and wild-type control groups, the reporter assays showed a significantly decreased luciferase activity in the wild-type group (Figure 6H, p<0.05). Taken together, our results suggested that GAST was the candidate target gene of miR-30a-3p in GC cells.
MiR-30a-3p Was the Tumor Suppressor Gene in GC
MiR-30a acts as a tumor suppressor for regulating the growth and migration of H.pylori infected gastric cancer by targeting COX-2 and BCL9. Compared with H.pylori infected wild-type mice, H.pylori-infected miR-30a knockout mice showed an increased incidence of chronic gastritis, chronic atrophic gastritis, atypical hyperplasia, and other precancerous lesions or adenocarcinoma manifestations in the antral or gastric mucosa of mice, as well as regulation of genes closely associated with tumor development. In our study, we further identified that miR-30a-3p was the promising tumor suppressor gene in GC using in this study assays (Figure 7). We selected six colonies with overexpressing miR-30a plasmid transfection. And the Colone-1 (miR-30a-3p-1) and Colone-4 (miR-30a-3p-4) had the higher expression of miR-30a-3p than others using real-time PCR analyses. And we used miR-30a-3p-1 and miR-30a-3p-4 colonies for further investigation. The stable expression of miR-30a-3p was detected in these colones. And a higher level of miR-30a-3p was detected in miR-30a-3p-1 colone than that in miR-30a-3p-4 colone for three times repeats (Figure 7A). After obtaining the overexpressing miR-30a-3p, cell viability and colonies formation were decreased significantly (Figure 7B and 7C, respectively), accompanied by the reduction in invasive cells and migrative cells (Figure 7D). Moreover, the tumorigenicity was suppressed in the group with overexpressing miR-30a-3p using tumor size measurement (Figure 7E), and from the tumor sections, decreased GAST staining was detected in the overexpressing miR-30a-3p xenografts model (Figure 7F). Collectively, miR-30a-3p was the potential tumor suppressor gene correlated with GAST expression to some extent.
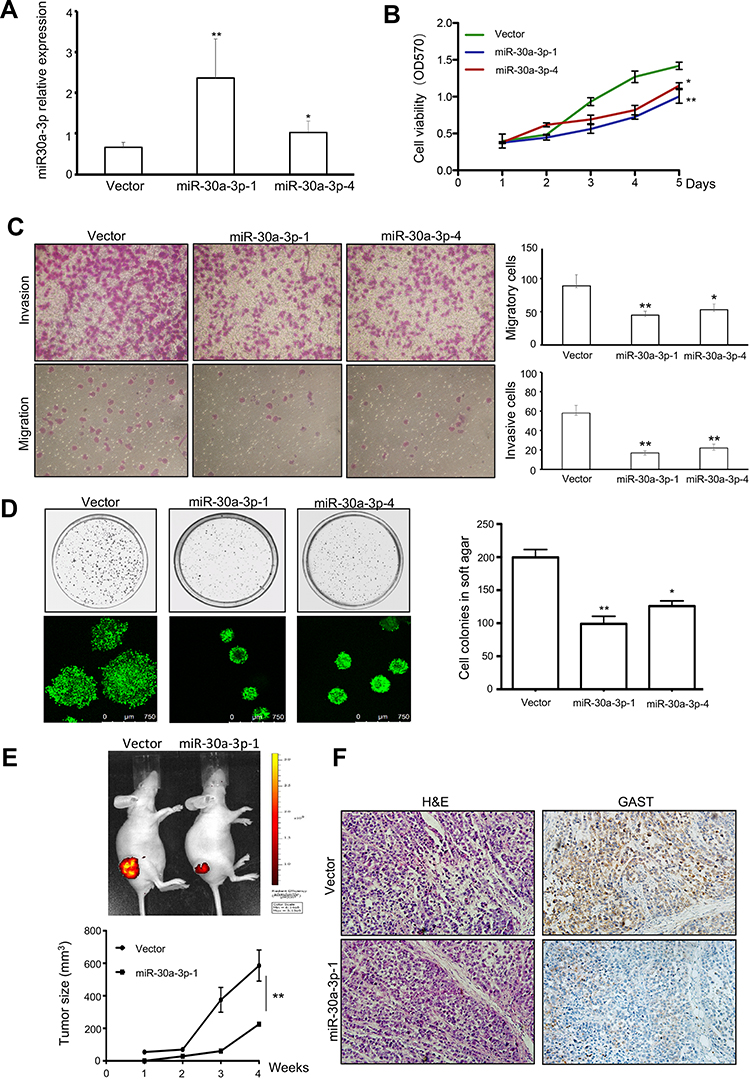 |
Figure 7 MiR-30a-3p was the promising tumor suppressor gene in GC. (A) Representative of Mean±SD for identification the differential miR-30a-3p expression after stable transfection with relative plasmids using qPCR analysis. (B) Cell viability was exhibited by MTT assay. Overexpressing miR-30a-3p reduced cell proliferation. (C) The invasion and migration assays were used in transfected cells. Columns were exhibited as Mean±SD for three independent experiments. (D) Soft agar assay indicated that ectopic expressing miR-30a-3p can decrease the number and size of colonies. Columns were exhibited as Mean±SD for three independent experiments. (E) Tumor-bearing mice model was performed and indicated the tumorigenesis of relative stably transfected cells. The tumor size was reduced after ectopic expressing miR-30a-3p in BGC823 cell xenografts. (F) HE staining and IHC immunostaining for GAST expression were detected in tumor sections. *p<0.05, **p<0.01. |
Discussion
The molecular pathways of GAST contributing to tumor cell growth and migration are more complex and many features remain to be clarified. In this study, we have shown that GAST is increased in GC tissues and its expression is associated with worse clinical outcomes. In fact, patients with over-expressed GAST had a worsened prognosis than those with a low level of GAST. These data provide compelling pathogenic evidence that elevated GAST expression increased the risk of death in GC patients.
Moreover, the question should be figured out that what factors may cause the increased GAST expression in GC. From animal study, an increase in GAST mRNA in H.pylori-infected mice were reported through MAP kinase-dependent signaling but not NF-κB-dependent signaling. H.pylori induction of GAST promoter through a GC-rich motif was mediated by the inducible binding of Sp1 and Sp3 transcription factors. Collectively, co-culturing live H.pylori bacteria with human cells were sufficient to induce GAST gene expression.5 H.pylori alters the expression of tumor suppressor genes, including miRNAs by epigenetic deregulation, including DNA methylation and microRNAs, are important regulatory events that modulate all the pathways in the cellular network.6 Since microRNAs (miRNAs) are known as one of the major epigenetic modifications of their cognate target genes by sequence-specific binding to messenger RNA and could trigger translation repression or RNA degradation, thereby playing the important role in cancer progression. Our previous study on microRNA expression profiles in GC tissues by microarray demonstrated that a unique set of miRNAs were down-regulated in these cancers. In this study, we identified miR-30a-3p as a predicted regulator for GAST, and confirmed that miR-30a-3p was indeed down-regulated in GC cell lines and tissues, and more importantly that there existed an inverse correlation between the expression levels of miR-30a-3p and GAST. The GC samples having relatively low endogenous miR-30a-3p expression level had exhibited high levels of GAST as determined by quantitative PCR and in situ hybridization. Further, we showed an obvious down-regulation of GAST using miR-30a-3p mimics and in miR-30a-3p overexpression groups compared to lower expression control groups, whereas the up-regulation of GAST expression was observed in the miR-30a-3p inhibition group compared to controls. Importantly, using the luciferase reporter assay, we found miR-30a-3p targeted to the coding sequence of GAST can efficiently silence GAST gene expression. Taken together, these results suggested that overexpression of GAST in GC might well be causally correlated with the observed down-regulation of miR-30a-3p. Interestingly, miR-30a-3p was the promising tumor suppressor gene in many types of cancers, which could inhibit cancer cell growth, migration, and invasion through different target genes in this study.7 Several reports have confirmed that miR-30a can significantly inhibit cancer cell proliferation. Overexpression of miR-30a-3p facilitates apoptosis through suppression of PI3K/AKT signaling8–10 and reverses the effects of many pro-oncogenes, such as DNA Methyltransferase 3a (DNMT3a), Wnt Family Member 2 (WNT2), Cyclooxygenase-2 (COX-2), B-cell lymphoma 9 protein (BCL9), Mitotic Arrest Deficient 2 Like 1 (MAD2L1), and matrix metalloproteinase-3 (MMP3) in many types of cancers.10–13 Therefore, miR-30a-3p may be a potential therapeutic target for gastric cancer treatment. Interestingly, during GC progression, H.pylori-infected miR-30a knockout mice showed increased the incidence of chronic gastritis, chronic atrophic gastritis, atypical hyperplasia, and other precancerous lesions or adenocarcinoma manifestations in the antral or gastric mucosa of mice, as well as regulation of genes closely associated with tumor development.14
GAST, as an anti-apoptotic and pro-survival factor in carcinogenesis, has been reported to be involved in tumor invasion and metastasis. In this present study, we found a significant correlation between GAST over-expression and lymph node metastases. Compared with lower levels of gastrin in non-lymph node tissue, GAST was observed to be more highly overexpressed in the tissues associated with lymph node metastases. These data suggested that GAST expression may be one of the earlier events in the metastasis of GC.
Our next functional assays showed that the downregulation of GAST resulted in the decrease of GC cell invasion and migration ability in this study by knockdown of GAST, using Western blot and confocal analyses. In particular, we found that silenced GAST down-regulated the expression of MMP11 and phosphorylation of STAT3. MMP11 was a member of MMPs family, which was considered to be one of the biomarkers in cancer progression and prognostic prediction in our study (p<0.001, Table 2 and Supplementary Figure 1), which was correlated with TNM stage (p=0.0004), tumor invasive depth (T) (p=0.001), lymph node metastasis (p=0.017), distant metastasis (p=0.029), p-STAT3 expression (p<0.001) and GAST expression (p<0.001) in Supplementary Table 1. Elevated MMP11 was also reported in breast cancer, non-small cell lung cancer and gastric cancer, and its overexpression was correlated with a more aggressive phenotype. At an early stage of tumor invasion, MMP11 appeared to be critical and helps the implantation of cancer cells into adjacent connective tissue through cancer cell-adipocyte interaction.15,16 In our previous study, we found that MMP11 was significantly upregulated in GC cells and tissues and can promote tumor proliferation. Taking these premises into account, we speculated that an important invasive effect of GAST on GC cells may be achieved through its up-regulation of MMP11. Meanwhile, GAST also increased other MMP members in cell migration and invasion, such as MMP1, MMP7, MMP9.17–20
Previous study has proposed that GAST can activate the JAK2/STAT3 pathway in tumorigenesis.21,22 Then, STAT3 positively stimulated the expression of MMP members, including MMP11.23–25 Our experiments clearly showed treatment with WP1066, an inhibitor of STAT3 reduced GAST-mediated expression of MMP11 in human GC BGC823 cell. Significantly, inhibition of this pathway with a specific chemical inhibitor of STAT3 not only decreases the invasive potential but also blocked GC cell migration, indicating that STAT3 appears as a critical mediator of motility and is involved in the GAST-induced expression of MMP11 an important proteinase widely expressed in many cancers and associated with malignant metastasis. In our study, p-STAT3 was the potential prognostic biomarker in GC (p=0.122, Table 2 and Supplementary Figure 1), which is correlated with lymph node metastasis (p=0.027), MMP11 expression (p<0.001) and GAST expression (p=0.013) in Supplementary Table 2.
In conclusion, our studies demonstrate that GAST is generally increased in GC tissues, which accounts for the tumorigenesis through cellular proliferation and migration in GC cells. Besides, we identify GAST expression is the potential target gene of miR-30a-3p, and miR-30a-3p was the promising tumor suppressor gene in GC. Furthermore, the subsequently elevated GAST expression can promote cell invasion and migration through STAT3 phosphorylation mediating the up-transactivation of downstream gene MMP11 (Figure 8). We have provided the potential possibility of GAST on cell proliferation and metastasis and the epigenetic regulation of elevated GAST through downregulation of miR-30a-3p in GC development and progression.
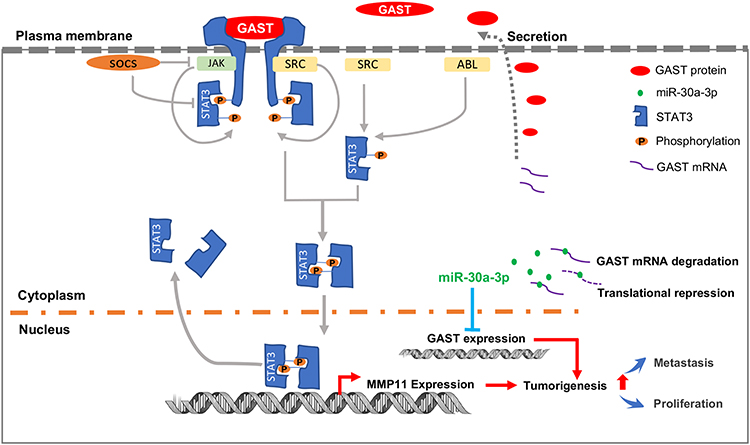 |
Figure 8 The proposed schematic representation for GAST in GC development and progression. The scheme indicated that GAST was the direct target gene of miR-30a-3p in GC cell lines and tissues, suggested that miR-30a-3p was the promising tumor suppressor gene in GC. Furthermore, elevated GAST expression promoted cell proliferation, migration and invasion through STAT3 phosphorylation and up-transactivation of MMP11 expression. |
Abbreviations
DAB, 3, 3ʹ-diaminobenzidine; DMEM, Dulbecco’s Modified Eagle Medium; DNMT3a, DNA (cytosine-5-)-methyltransferase 3 alpha; FBS, Fetal bovine serum; GAST, Gastrin; GC, Gastric cancer; HRP, Horseradish peroxidase; MAD2L1, Mitotic Arrest Deficient 2 Like 1; MMP11, Matrix metalloproteinase 11; MTT, 3-(4,5-dimethylthiazol-2-yl)-2,5-diphenyltetrazolium bromide; PAGE, Polyacrylamide gel electrophoresis; PVDF, Polyvinylidene difluoride; qRT-PCR, Quantitative real-time PCR; SDS, Sodium dodecyl sulfate; STAT3, Signal transducer and activator of transcription 3; TNM, Tumor, Node, Metastasis.
Availability of Data and Materials
All data from our study are available upon request.
Ethics Approval and Consent
The project was assessed and certified by the Faculty of Science Ethics Committee at Beijing Cancer Hospital. All the participants provided informed written consent prior to the study enrollment. All the tissues used in the study were requested following approval by the Institutional Review Board of the Tumor Tissue Bank of Beijing Cancer Hospital. Written informed consent was obtained from all enrolled patients, and all relevant investigations were performed according to the principles of the Declaration of Helsinki. All animal studies were handled according to the guidelines of Peking University Animal Research Committee. The experimental protocol was approved by the Committee on the Ethics of Animal Experiments in Beijing Cancer Hospital.
Author Contributions
All authors made substantial contributions to conception and design, acquisition of data, or analysis and interpretation of data; took part in drafting the article or revising it critically for important intellectual content; agreed to submit to the current journal; gave final approval of the version to be published; and agree to be accountable for all aspects of the work.
Disclosure
Meng Gao and Shengmei Qi are employees of OnkoRx Ltd. Beijing. Li Song and Kejia Liu are employees of Yidu Cloud (Beijing) Technology Co., Ltd. 8F, Health Work. The authors report no other potential conflicts of interest for this work.
References
1. Ferrand A, Wang TC. Gastrin and Cancer: A Review. Cancer Lett. 2006;238(1):15–29. doi:10.1016/j.canlet.2005.06.025
2. Maddalo G, Spolverato Y, Rugge M, Farinati F. Gastrin: from Pathophysiology to Cancer Prevention and Treatment. Eur J Cancer Prev. 2014;23(4):258–263. doi:10.1097/CEJ.0000000000000008
3. Wang J, Xin B, Wang H, et al. Gastrin Regulates ABCG2 to promote the migration, invasion and side populations in pancreatic cancer cells via activation of NF-κB Signaling. Exp Cell Res. 2016;346(1):74–84. doi:10.1016/j.yexcr.2016.06.001
4. Hayakawa Y, Chang W, Jin G, Wang TC. Gastrin and Upper GI Cancers. Curr Opin Pharmacol. 2016;31:31–37. doi:10.1016/j.coph.2016.08.013
5. Tucker TP, Gray BM, Eaton KA, Juanita L. Merchant. Helicobacter pylori Induction of the Gastrin Promoter Through GC-Rich DNA Elements. Helicobacter. 2010;15(5):438–448. doi:10.1111/j.1523-5378.2010.00787.x
6. Valenzuela MA, Canales J, Corvalán AH, Quest AFG. Helicobacter pylori-induced inflammation and epigenetic changes during gastric carcinogenesis. World J Gastroenterol. 2015;21(45):12742–12756. doi:10.3748/wjg.v21.i45.12742
7. Lin-Hong J, He-da Z, Jin-Hai T. MiR-30a: A novel biomarker and potential therapeutic target for cancer. J Oncol. 2018;2018:5167829.
8. Wang T, Chen G, Ma X, et al. MiR-30a regulates cancer cell response to chemotherapy through SNAI1/IRS1/AKT Pathway. Cell Death Dis. 2019;10(3):153. doi:10.1038/s41419-019-1326-6
9. Chen Q, Gao Y, Yu Q, et al. miR-30a-3p inhibits the proliferation of liver cancer cells by targeting DNMT3a Through the PI3K/AKT Signaling Pathway. Oncol Lett. 2020;19(1):606–614. doi:10.3892/ol.2019.11179
10. Wei D, Guangmao Y, Zhao Y. MicroRNA-30a-3p Inhibits the Progression of Lung Cancer via the PI3K/AKT by Targeting DNA Methyltransferase. Onco Targets Ther. 2019;12:7015–7024. doi:10.2147/OTT.S213583
11. Wang Y, Wang F, He J. miR-30a-3p Targets MAD2L1 and regulates proliferation of gastric cancer cells. Onco Targets Ther. 2019;12:11313–11324. doi:10.2147/OTT.S222854
12. Liu L, Chen L, Wu T, Qian H, Yang S. MicroRNA-30a-3p functions as a tumor suppressor in renal cell carcinoma by targeting WNT2. Am J Transl Res. 2019;11(8):4976–4983.
13. Bo Q, Wang Y, Chen Z, et al. Down-regulation of miR-30a-3p/5p promotes esophageal squamous cell carcinoma cell proliferation by activating the wnt signaling pathway. World J Gastroenterol. 2017;23(45):7965–7977. doi:10.3748/wjg.v23.i45.7965
14. Liu X, Qing J, Zhang C, et al. miR-30a acts as a tumor suppressor by double-targeting COX-2 and BCL9 in H. pylori gastric cancer models. Sci Rep. 2017;7(1):7113. doi:10.1038/s41598-017-07193-w
15. Motrescu ER, Blaise S, Etique N, et al. Matrix metalloproteinase-11/stromelysin-3 exhibits collagenolytic function against collagen vi under normal and malignant conditions. Oncogene. 2008;27(49):6347–6355. doi:10.1038/onc.2008.218
16. Deng H, Guo RF, Li WM, Zhao M, Lu YY. Matrix metalloproteinase 11 depletion inhibits cell proliferation in gastric cancer cells. Biochem Biophys Res Commun. 2005;326(2):274–281. doi:10.1016/j.bbrc.2004.11.027
17. Kumar JD, Steele I, Moore AR, et al. Gastrin Stimulates MMP-1 expression in gastric epithelial cells: putative role in gastric epithelial cell migration. Am J Physiol Gastrointest Liver Physiol. 2015;309(2):G78–G86. doi:10.1152/ajpgi.00084.2015
18. Wroblewski LE, Pritchard DM, Carter S, Varro A. Gastrin-stimulated Gastric Epithelial Cell Invasion: the Role and Mechanism of Increased Matrix Metalloproteinase 9 Expression. Biochem J. 2002;365(Pt 3):873–879. doi:10.1042/bj20020068
19. Varro A, Kenny S, Hemers E, et al. Increased Gastric Expression of MMP-7 in Hypergastrinemia and Significance for Epithelial-Mesenchymal Signaling. Am J Physiol Gastrointest Liver Physiol. 2007;292(4):G1133–G1140. doi:10.1152/ajpgi.00526.2006
20. Park HJ, Kim MK, Kim Y, et al. Gastrin-releasing Peptide Promotes the Migration of Vascular Smooth Muscle Cells Through Upregulation of Matrix metalloproteinase-2 and −9. BMB Rep. 2017;50(12):628–633. doi:10.5483/BMBRep.2017.50.12.158
21. Wei X, Guo-Sheng C, Shao Y, et al. Gastrin Acting on the cholecystokinin2 receptor induces cyclooxygenase-2 expression Through JAK2/STAT3/PI3K/Akt pathway in human gastric cancer. Cells Cancer Lett. 2013;332(1):11–18. doi:10.1016/j.canlet.2012.12.030
22. Ferrand A, Bertrand C, Portolan G, et al. Signaling pathways associated with colonic mucosa hyperproliferation in mice overexpressing gastrin precursors. Cancer Res. 2005;65(7):2770–2777. doi:10.1158/0008-5472.CAN-04-0978
23. Zan-Hui J, Jia Y, Feng-Jun G, Chen J, Zhang X. Phosphorylation of STAT3 at Tyr705 Regulates MMP-9 production in epithelial ovarian cancer. PLoS One. 2017;12(8):e0183622. doi:10.1371/journal.pone.0183622
24. Shi M, Liu D, Duan H, et al. Catecholamine Up-Regulates MMP-7 Expression by Activating AP-1 and STAT3 in Gastric Cancer. Mol Cancer. 2010;9(1):269. doi:10.1186/1476-4598-9-269
25. Su C, Wang W, Wang C. IGF-1-induced MMP-11 expression promotes the proliferation and invasion of gastric cancer cells through the JAK1/STAT3 signaling pathway. Oncol Lett. 2018;15(5):7000–7006. doi:10.3892/ol.2018.8234
 © 2020 The Author(s). This work is published and licensed by Dove Medical Press Limited. The full terms of this license are available at https://www.dovepress.com/terms.php and incorporate the Creative Commons Attribution - Non Commercial (unported, v3.0) License.
By accessing the work you hereby accept the Terms. Non-commercial uses of the work are permitted without any further permission from Dove Medical Press Limited, provided the work is properly attributed. For permission for commercial use of this work, please see paragraphs 4.2 and 5 of our Terms.
© 2020 The Author(s). This work is published and licensed by Dove Medical Press Limited. The full terms of this license are available at https://www.dovepress.com/terms.php and incorporate the Creative Commons Attribution - Non Commercial (unported, v3.0) License.
By accessing the work you hereby accept the Terms. Non-commercial uses of the work are permitted without any further permission from Dove Medical Press Limited, provided the work is properly attributed. For permission for commercial use of this work, please see paragraphs 4.2 and 5 of our Terms.