")
Back to Journals » Diabetes, Metabolic Syndrome and Obesity » Volume 14
Dysbiosis of the Salivary Microbiome is Associated with Hypertension and Correlated with Metabolic Syndrome Biomarkers
Authors Sohail MU, Hedin L, Al-Asmakh M
Received 16 June 2021
Accepted for publication 4 September 2021
Published 25 November 2021 Volume 2021:14 Pages 4641—4653
DOI https://doi.org/10.2147/DMSO.S325073
Checked for plagiarism Yes
Review by Single anonymous peer review
Peer reviewer comments 2
Editor who approved publication: Prof. Dr. Antonio Brunetti
Muhammad U Sohail,1 Lars Hedin,2 Maha Al-Asmakh3– 5
1Proteomics Core, Weill Cornell Medicine-Qatar, Doha, Qatar; 2The Royal Norwegian Ministry of Health and Care Services, Molde Kommune, 6413, Norway; 3Department of Biomedical Science, College of Health Sciences, QU Health, Qatar University, Doha, 2713, Qatar; 4Biomedical Research Center, Qatar University, Doha, 2713, Qatar; 5Biomedical and Pharmaceutical Research Unit, QU Health, Qatar University, Doha, Qatar
Correspondence: Maha Al-Asmakh Tel +974 4403 4789
Fax +974-4403-1351
Email [email protected]
Background: Hypertension (HT) is an idiopathic disease with severe complications and a high incidence of global mortality. Although the disease shares characteristic features with diabetes and obesity, the complex interplay of endogenous and environmental factors is not well characterized. The oral microbiome has recently been studied to better understand the role of commensal microorganisms in metabolic disorders, including HT, although its role in disease etiology is unclear.
Methods: To bridge this gap, we compared the oral microbiome and clinical chemistry of adult subjects enrolled at Qatar Biobank. Clinical chemistry was performed using Roche Cobas-6000 analyzer. Saliva samples were subjected to 16S rRNA sequencing using Illumina MiSeq platform. Cross-gender comparisons were made between control (males/females) (C-M and C-F) and HT (HT-M and HT-F) groups.
Results: The HT groups had higher (p ≤ 0.05) BMI, plasma glucose, insulin, C-peptide, and alkaline phosphatase (ALP) concentrations. Triglycerides, cholesterol, LDL-cholesterol, and sodium ions were similar among the groups. The microbiome was predominantly occupied by Firmicutes, Bacteroidetes, Proteobacteria, and Actinobacteria. Firmicutes were higher (p ≤ 0.05) in the HT groups, whereas Proteobacteria was only higher in the C-F group. Prevotella and Veillonella were significantly higher in the HT groups and exhibited a positive correlation with blood pressure and hyperglycemia. In contrast to other studies, the mathematical summation of priori-select microbes reveals that nitrate-reducing microbes were higher in the HT groups compared with the controls.
Conclusion: In conclusion, these observations suggest a strong association of HT with microbial dysbiosis, where microbial species other than nitrate-reducing microbes contribute to blood pressure regulation. The findings affirm plausible microbial signatures of hypertension and suggest manipulating these microbes as a novel treatment modality. Future experiments are warranted for the mechanistic investigation of hypertension metagenomics and microbial activity.
Keywords: hypertension, salivary microbiome, Qatar Biobank, lipid profile, Prevotella, Veillonella
Introduction
Hypertension (HT) is one of the leading causes of global morbidity and mortality. The disease contributes to several metabolic and cardiovascular complications and bears the greatest disease burden in terms of lost years of life with disability.1 Hypertension is a major risk factor for stroke, heart failure, retinopathy, nephropathy, and peripheral vascular diseases.2 About 34% of deaths in the United States were associated with HT during the past decade.3 The Qatar STEPwise survey4 reports a 32.9% prevalence rate of HT among the Qatari population. The disease has several fixed (age, sex, and ethnicity) and modifiable (smoking, inactive lifestyle, obesity, and diet) risk factors. Although significant lifestyle modifications and intensive therapeutic interventions are applied, only two-thirds of the patients manage to control their blood pressure (BP) when prescribed three or more medications, while the rest develop a treatment-resistant HT stage.1 In particular, HT is associated with diabetes and obesity, which may lead to a treatment-resistant state due to associated vascular and renal damage. Precise control and treatment interventions are immediately required, especially for the resistance stage, but so far, the exact etiology and pathogenesis of HT are not fully understood.
The emerging evidence highlights the significance of commensal microbial communities that densely inhabit our mucosal surfaces and affect several physiological traits.5,6 These microbes virtually out-number our body cells and carry more genetic material. In brief, literature depicts how these microbes contribute to the host metabolic, immunologic, neurologic, and endocrine homeostasis.7,8 Furthermore, these microbial taxa, such as Streptococcus salivarius produce bacteriocins to prevent the growth of Gram-negative bacteria, responsible for halitosis and periodontitis.9 Notably, certain microbes are involved in reducing nitrate to nitrite and subsequently contributing to nitric oxide synthesis, which is a powerful vasodilator.10–13 A recent microbiome research-call by National Heart, Lung, and Blood Institute (NHLBI, 2017) highlights the role of the oral microbiome in HT development and BP management.6 Impaired production of nitric oxide due to the absence of nitrate reductase microbial enzymes is suggested to be an important factor in the pathogenesis of HT.14 Oral infections, glucose intolerance, and insulin resistance study (ORIGINS) developed a list of nitrate‐reducing taxa that actively participate in the entero-salivary nitrate-nitrite-NO pathway.15 Contrary to this, suppression of oral microbiota by extensive antiseptic mouth-wash or antibiotics may cause high BP (HBP).16 The oral microbiome is a dynamic microbial community that changes significantly with the host lifestyle and dietary habits. Therefore, the therapeutic approaches to recolonize specific bacterial clades, associated with nitrate reduction, are suggested for the management of HT.17
Few studies have recently explored the oral microbiome of hypertensive subjects and suggested a wide range of possible microbes that may contribute to the pathogenesis of hypertension.18–22 To further expand this knowledge, we examined the salivary microbiome, clinical chemistry, and BP in Qatari adults enrolled at Qatar Biobank (QBB). While corroborating previous evidence on the microbial dysbiosis in HT, our findings are targeted to unveil characteristic microbial signature that potentially links HBP with hyperglycemia and dyslipidemia.
Materials and Methods
Study Cohort
Qatar Biobank (QBB) is a large-scale health initiative to provide biological samples and population data to scientists for research support to guide healthcare strategies for effective prevention of diseases and the development of new treatments (https://www.qatarbiobank.org.qa/).23 At QBB, out of 13,800 registered participants, 2277 (16.5%) subjects have self-reported high blood pressure (HBP), clinically diagnosed diabetes (15.5%), and obesity (44%). In the current study, ninety-six subjects (53 females and 43 males), aged 30–60 years (mean 47.5), were divided into HT (N = 56) and healthy control (Con; N = 40) groups. The HT subjects self-reported clinical history of HBP (systolic BP ≥ 140 mmHg and diastolic ≥ 90 mmHg) and the regular use of antihypertensive medication. Three measurements for pulse rates, systolic and diastolic BP were taken at random intervals from each participant during their visit. Their height and weight were also measured. Information on general health, disease history, medication, feeding habits, and smoking was collected on a designed questionnaire. Out of 96 subjects, only 35 (HT = 20, Con = 15) mentioned mouth ulcers, toothache, loose teeth, gums pain, or bleeding during the past twelve months. Data for these oral conditions were summed up and referred to as oral health. Furthermore, for microbiome analysis, the Con and HT groups were divided into Males (C-M, HT-M) and Females (C-F, HT-F). Smoking, antibiotic use, fast food consumption, and dairy product use were all recorded and scaled from 1 to 5, with the lowest or no consumption of a product being rated as 1 and the greatest consumption being measured as 5.8 Data for clinical chemistry measurements of enzymes, metabolites, hormones, and minerals were obtained (Figures 1 and 2) from QBB. Saliva samples (50 μL) were collected from the participants by spitting directly into sterile tubes and immediately frozen at −80°C. These saliva samples were used for microbiome analysis. All the participants enrolled in this study signed an informed consent form to use their data and biological samples as anonymous volunteers. The study was approved by the QBB institutional review board (IRB) (E-2019-RES-ACC-0134-0079) and Qatar University IRB (QU IRB 1127-EA/19). During the laboratory and data analysis, the research team followed research ethics, moral and biosafety guidelines according to the regulation by Qatar University, and maintained participants’ anonymity.
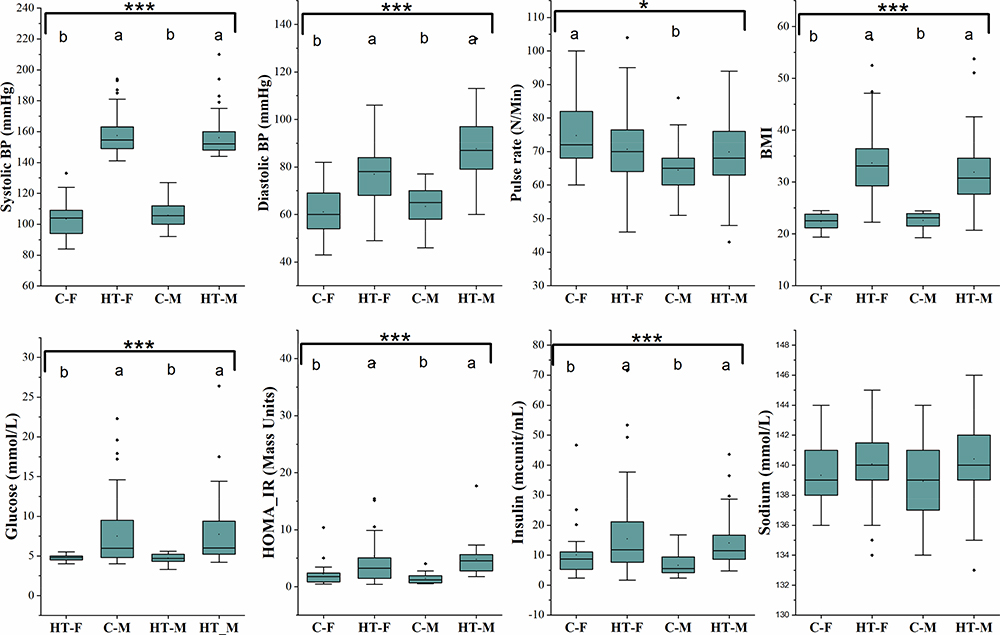 |
Figure 1 Blood pressure, pulse rate, BMI and clinical chemistry profile of the study cohort. Box and whisker plots show mean, median, and standard error for each group. Small black dots above the boxes show outlier samples in each group. Statistical comparisons between the groups were made using Kruskal Wallis ANOVA. Asterisks in each box indicate the corrected P-value; ***≤ 0.001 and *≤ 0.05. Dissimilar superscripts (a and b) above each bar show statistical differences among the groups. |
Clinical Chemistry
All the participants provided blood samples in EDTA-coated tubes (Cat# 362788; BD, ON, Canada). Blood was subjected to plasma extraction by centrifuging blood at 1300 g for 10 minutes at room temperature. Plasma samples were transported on ice to Hamad Medical Corporation (HMC) diagnostic laboratory for clinical analysis measurements. Cobas 6000 analyzer (Roche Diagnostics) was used for measuring enzymes, hormones, and metabolites, as described previously.23,24 HOMA-IR (Homeostatic Model Assessment for Insulin Resistance) was calculated using following equation:
HOMA-IR (= (FPI × FPG)/22.5
FPI is fasting plasma insulin concentration (mU/L), and FPG is fasting plasma glucose (mmol/L).
Saliva Microbiome Analysis
Saliva samples were transported on ice from QBB to Qatar University. Saliva samples were subjected to DNA extraction using a commercially available DNA extraction kit (QIAamp DNA Mini Kit, 51306, MD, USA). The concentration and quality of the DNA were measured using Qubit-4 (Life Technologies, Carlsbad, California, US) and NanoDrop-2000 (Thermo Fisher Scientific, Waltham Massachusetts, US). Purified DNA samples were subjected to PCR amplification using 16S rRNA V3, V4 primer pair (337F/805R).25 Fragment length of PCR products was measured using Agilent 2100 bioanalyzer (Agilent Technologies, Palo Alto, CA, US). PCR products were washed using magnetic beads (Agencourt Ampure XP beads, A63881, Beckman) and subjected to another PCR reaction to add of indexes in the amplicons using Illumina Nextera XT index kit V2 (FC-131-2001). Finally, all libraries were pooled and denatured before loading them in the Illumina MiSeq Cartridge. Sequencing was performed on Illumina MiSeq instrument using MiSeq reagent kit V3 (600 cycles, MS-102-3003).
Bioinformatics Analysis
The MiSeq run’s output was printed in MiSeq reporter software in the form of FASTA and FASTQ files. FASTQ raw data files were used for subsequent bioinformatics analysis using the QIIME2 pipeline.26 Different plugins available in QIIME2 were used for quality-control, annotation, assembly, alignment, and statistical analysis. In brief, FASTX-toolkit was used to remove chimeras and low-quality reads from the data. Thereafter, FeatureTable [Frequency] and FeatureData [Sequence] were generated using DADA2 plugin.27 Taxonomy classification of bacterial 16S rRNA marker-gene was performed using VSEARCH and BLAST+ tools.28 Taxonomic classification was performed using Silva 132 (99% OTUs full-length sequences) as a reference database.
Microbiome Hypertension Index
An extensive literature review was conducted to identify microbes that are known for their nitrate-reducing capacities.15,21,29 Population proportions of the priori–selected taxa with nitrate‐reducing capacity were summed to predict hypertension (nitrate reducer) index.15
Statistical Analysis
The clinical chemistry data were presented as mean ± standard deviation. Kruskal–Wallis (KW) one-way ANOVA was used to compare differences among the study groups. Microbiome diversity analysis was performed at 7234 sequencing depth. Alpha diversity analysis was performed using the faith_PD index, and the KW test was used to compare differences in alpha diversity between the groups. Beta diversity analysis was performed using a weighted_unifrac distance metric, and the relative differences between the samples were projected in the 3D PCoA plot. PERMANOVA test was used to observe beta diversity significance between the groups. Phylogenetic analysis of the microbiome was performed at phylum, family, and genus levels. Only those taxa with a mean relative abundance of at least 0.5% and who were expressed in more than 50% of the samples were included in the statistical analysis. The remaining data were discarded. Mean ± standard deviation was calculated for the relative percentage of each taxon, and statistical comparisons were made using the KW test. The Benjamini–Hochberg false discovery rate was applied for p-values correction. Finally, Spearman correlation and stepwise linear regression analysis were performed between clinical measurements and microbial taxa count.
Results
Clinical Measurements
The means for pulse rate and BP were calculated per group and presented in Figure 1. The HT groups had a higher systolic/diastolic BP and BMI compared with the C groups. The HT groups also had higher (p ≤ 0.01) plasma glucose, insulin/C-peptide, and HOMA-IR, reflecting that HT subjects were also hyperglycemic and had lower insulin sensitivity. Plasma sodium ion concentration, cholesterol, LDL-cholesterol, and triglyceride concentrations were similar (Figure 2). However, HDL-cholesterol, which is considered the “good cholesterol”, was highest (p ≤ 0.001) in the C-F and lowest in the HT-M. Alkaline phosphatase and C-peptide concentrations were higher (p ≤ 0.001) in the HT groups compared with the C groups.
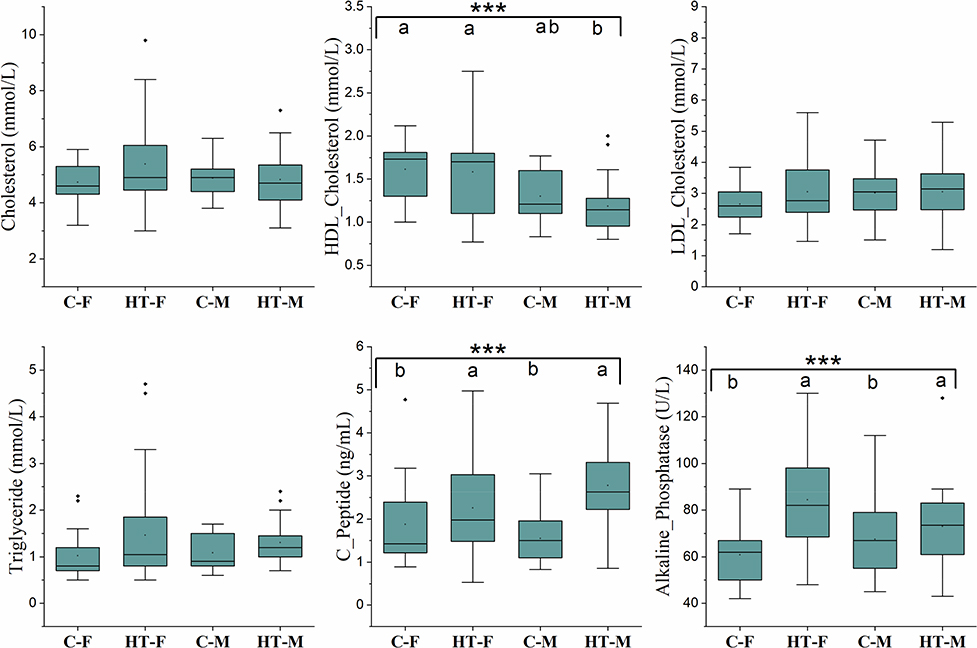 |
Figure 2 Plasma concentrations of different metabolites and enzymes of the study cohort. Box and whisker plots show mean, median, and standard error for each group. Small black dots above the boxes show outlier samples in each group. Statistical comparisons between the groups were made using Kruskal Wallis ANOVA. Asterisks in each box indicate the corrected P-value; ***≤ 0.001. Dissimilar superscripts (a and b) above each bar show statistical differences among the groups. |
Microbiome
Paired-end 16S rRNA amplicon sequencing of 96 samples yielded 8,656,948 reads (mean = 90176.54). After quality filtration, denoising, and chimera removal, only 2,359,969 sequences of good quality were left for further analysis. These good quality reads belonged to 443 bacterial taxa (Figure 3). The Venn diagram showed that out of 443 bacterial taxa, 153 microbial taxa were present in all the four groups and referred to as the core microbiome of the oral cavity. The oral microbiome was classified in twenty phyla, thirty-five classes, seventy-six orders, one hundred thirty-one families, two hundred forty-five genera, and four hundred forty-three species. The core oral microbiome was predominantly occupied by Firmicutes (45.2%), Bacteroidetes (22.8%), Proteobacteria (11.2%), and Actinobacteria (8.4%). Firmicutes were the most diverse bacterial phyla constituting 125 bacterial species. However, more than 30% of the species belonged to the genus Streptococcus and Veillonella. Bacteroidetes, the second most abundant phylum, contained 104 bacterial species, out of which more than 10% species belong to the genus Prevotella.
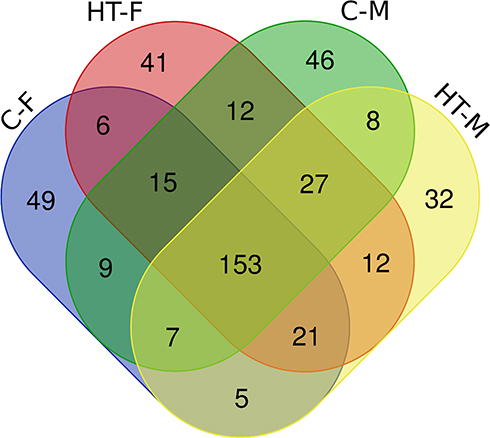 |
Figure 3 Venn diagram of microbiome. Venn diagram shows unique and core microbiome of the study cohort. |
First, the microbiome of the controls (C) and hypertensive (HT) subjects was compared (Figure 4). Statistical analysis revealed that Firmicutes (p ≤ 0.002), Atopobiacea (p ≤ 0.002), Prevotellaceae (p ≤ 0.04); Veillionellaceae (p ≤ 0.004), Atopobium (p ≤ 0.002), Prevotella (p ≤ 0.001), and Veillonella (p ≤ 0.005) were all higher in the HT groups. In contrast, Fusobacteria (p ≤ 0.035), Proteobacteria (p ≤ 0.043), Fusobacteriaceae (p ≤ 0.004) and Fusobacterium (p ≤ 0.004) were higher in the C groups. When the C and HT subjects were separated into males (M) and females (F) (Figure 5), Proteobacteria were higher in the C-F group compared with the other groups (Figure 5). Genus Fusobacterium and family Fusobacteriaceae of phylum Fusobacteria were significantly higher in the C groups compared with the HT groups. In contrast, the family Veillonellaceae, and genera Veillonella and Prevotella were higher (p ≤ 0.05) in the HT groups. Family Atopobiaceae and genus Atopobium of Actinobacteria were significantly lower in C-F groups compared with the other study groups. The mathematical summation of nitrate reducing microbes was highest in the HT group (42.2%) and the lowest in the C group (32.3%) (Figure 6).
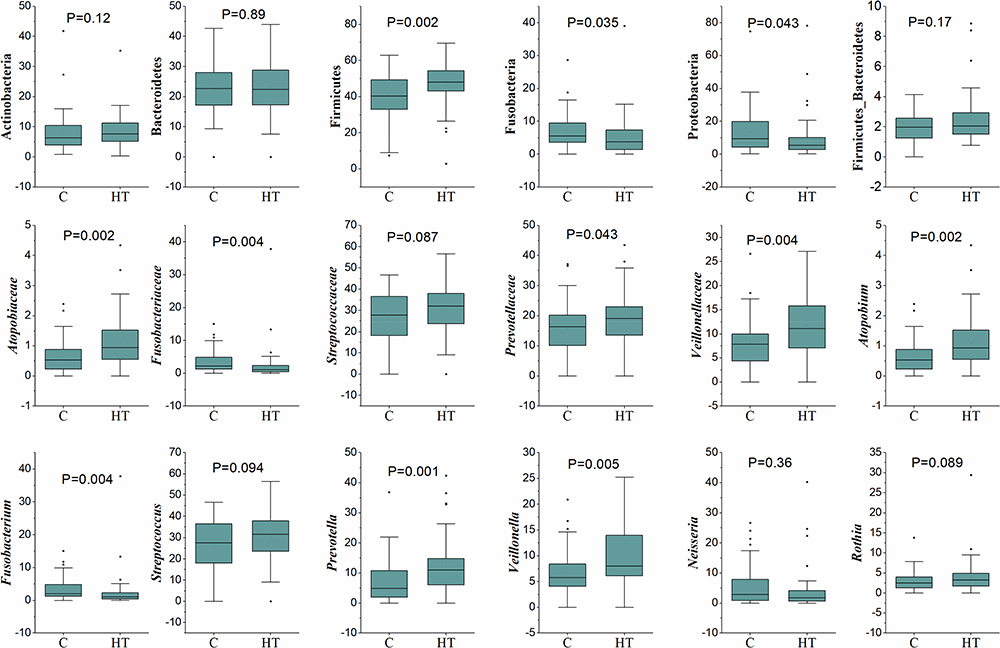 |
Figure 4 Comparison between the Control and Hypertension groups for the relative percentage of selected microbial taxa at phylum, family, and genus levels. Box and whisker plots show mean, median, and standard error for each group. Small black dots above the boxes show outlier samples in each group. Statistical comparisons between the groups were made using Mann–Whitney U-test. P-values present statistical differences between the groups. |
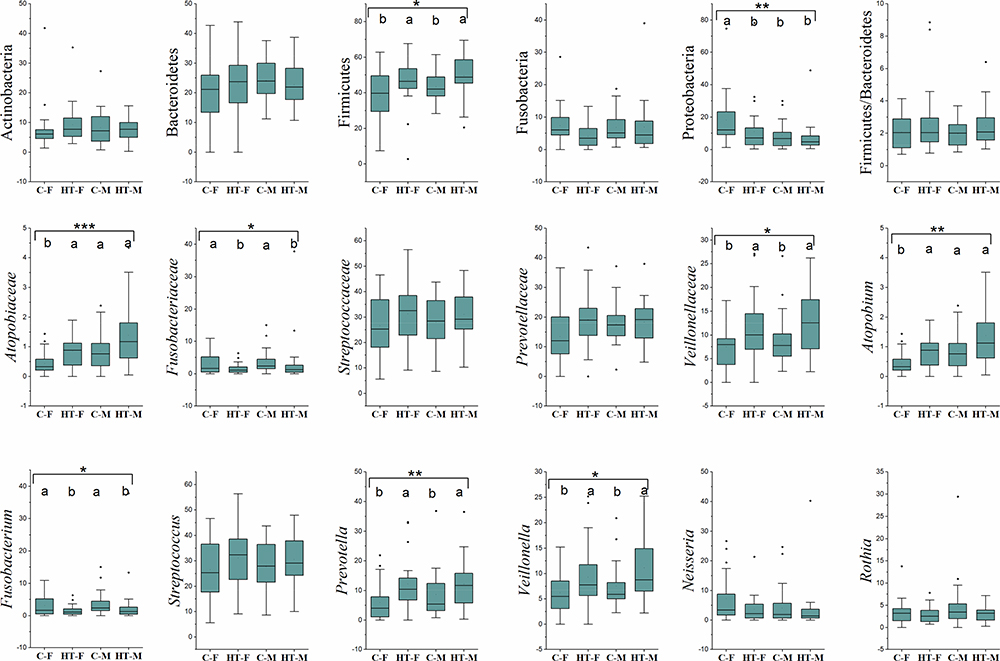 |
Figure 5 Relative abundance of the major bacterial taxa. Box and whisker plots show mean, median, and standard error for each group. Small black dots above the boxes show outlier samples in each group. Statistical comparisons between the groups were made using Kruskal Wallis ANOVA. Asterisks in each box indicate the corrected P-value; **s*≤ 0.001, **≤ 0.01 and *≤ 0.05. Dissimilar superscripts (a and b) above each bar show statistical differences among the groups. |
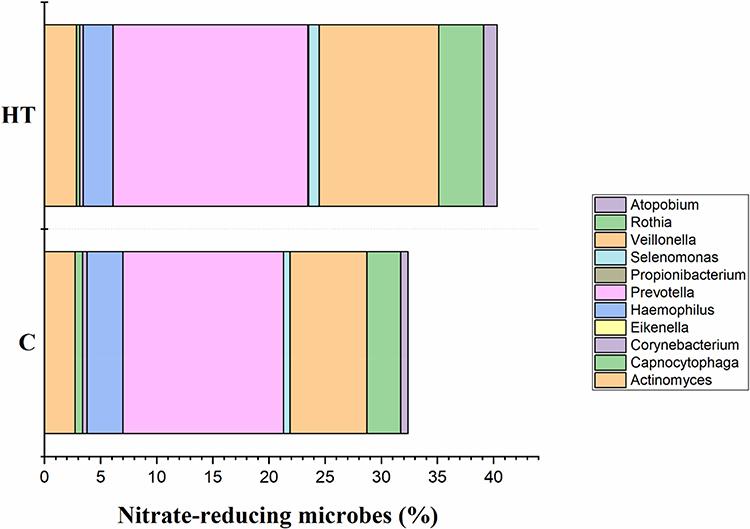 |
Figure 6 Mathematical summation of relative percentages of priori-select nitrate-reducing microbes to develop hypertension index. |
Figure 7 presents alpha rarefaction curves and pairwise KW analysis of the faith_PD alpha diversity. No significant difference in alpha species richness was observed between the study groups. Weighted_unifrac beta diversity showed that microbiome in C-F group was different (p ≤ 0.05) than HT-M and HT-F groups (Figure 8).
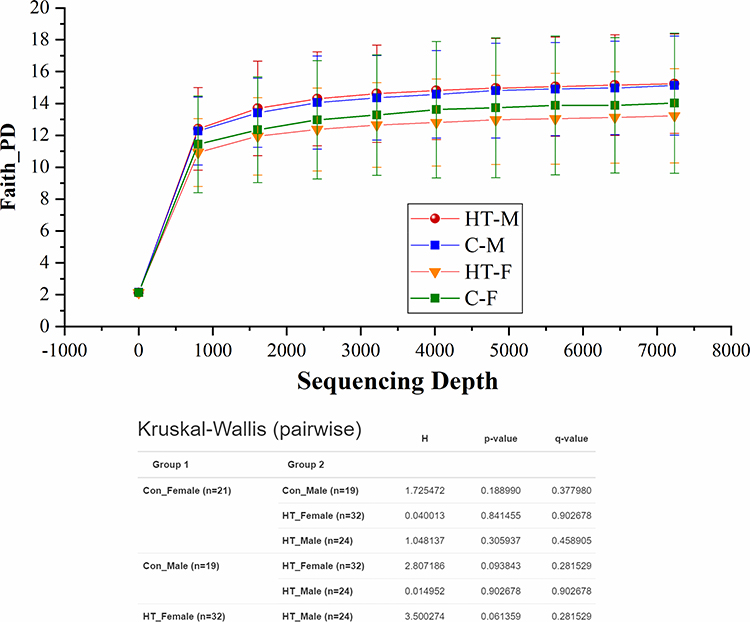 |
Figure 7 Alpha rarefaction curves and Kruskal Wallis ANOVA table for Faith_PD index of alpha diversity analysis. |
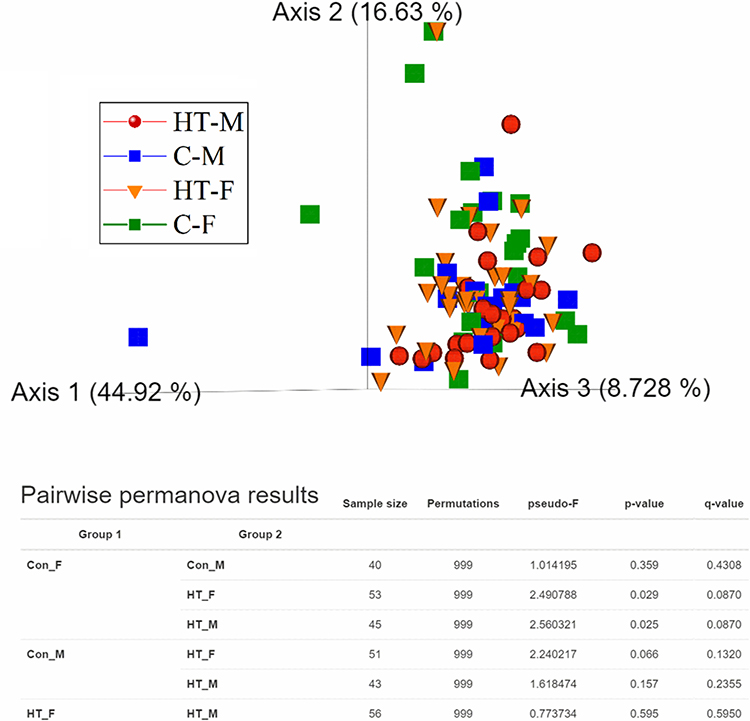 |
Figure 8 Beta diversity analysis on a 3D principal coordinates (PCoA) plot and PERMANOVA for weighted_unifrac index. |
Correlation Analysis
Spearman correlation analysis between clinical measurements and microbiome taxa is presented as a heatmap in Figure 9. The color intensity (red or green) and the size of the circle indicate r-value, and asterisks on these circles indicate p values. Microbial genera belonging to Actinobacteria (Atopobium) and Firmicutes (Prevotella and Veillonella) were positively associated (p ≤ 0.05; r ≤ +0.5) with BP values. However, a negative correlation existed between members of Fusobacteria (Fusobacteriaceae and Fusobacterium) and host BP. Similarly, these members of the Fusobacteria phylum were also negatively correlated with antibiotic usage. Firmicutes and the genus Streptococcus were positively associated (p ≤ 0.01) with BMI and reduced oral health. Atopobium, Prevotella, and Veillonella were also positively correlated with glucose and HOMA-IR. Poor oral health, which includes mouth ulcers, painful gums, gums bleeding, and toothache, was positively associated (p ≤ 0.01) with phylum Firmicutes, family Streptococcaceae, and genus Streptococcus. Antibiotic use during the past twelve months was positively associated with Actinobacteria and negatively with Fusobacteria.
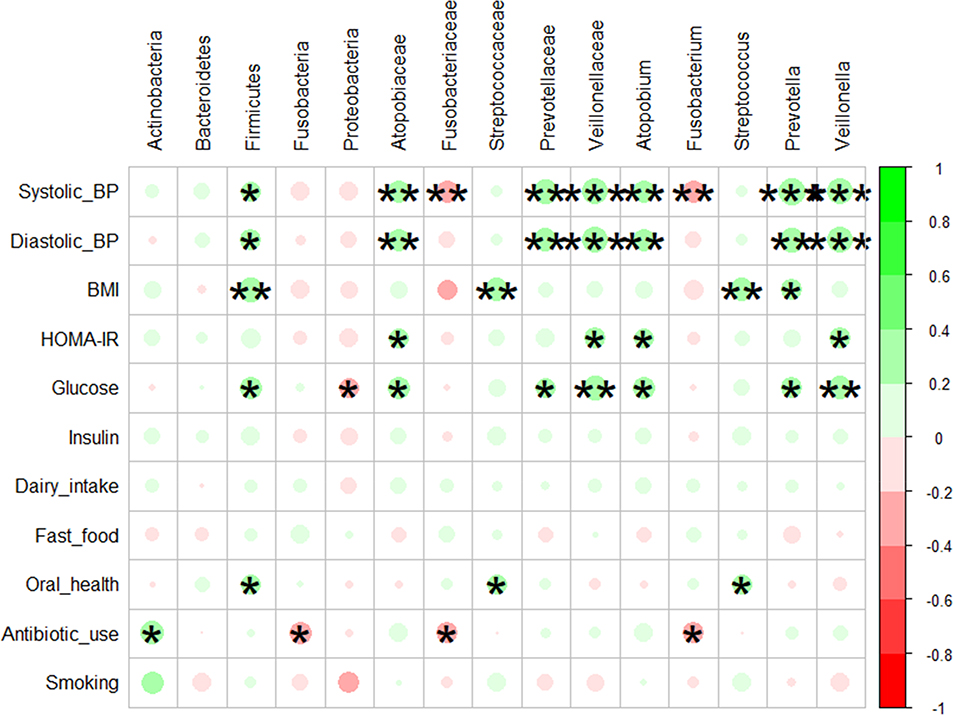 |
Figure 9 Spearman correlation analysis for association analysis between microbiome and plasma biochemical and demographic characteristics. The color intensity (red and green) and size of the circle indicate the strength of the correlation depicted as r-value. Asterisks on each circle indicate the P-value; ***≤ 0.001, **≤ 0.01 and *≤ 0.05. The analysis was performed using the corrplot package in RStudio version 3.5.0. |
Discussion
Hypertension is a major risk factor for stroke and cardiovascular diseases, which are leading causes of death worldwide.30,31 Although the disease incidence rate is increasing at an alarming pace, the etiology and pathogenesis of HT are still poorly explained. In particular, there are still limited studies that investigate the role of host-microbiome in HT pathogenesis. To address these gaps, we analyzed the oral microbiome of the Qatari nationals who volunteered their biological samples at QBB and compared their oral microbiome with clinical chemistry.
Hypertensive subjects had higher plasma glucose and insulin/C-peptide concentrations. In general, elevated LDL-cholesterol or a decrease in LDL-cholesterol is linked with HT.32 Our observations suggested that HT subjects had hyperglycemic and dyslipidemic phenotype and were exposed to a more complex metabolic disorder. Bozkurt et al31 suggest that these comorbidities share common etiological factors and management guidelines. Moreover, epidemiological studies show that HT, diabetes, and dyslipidemia frequently coexist, and their combined effect worsens cardiovascular health.31
Previous studies have shown that alkaline phosphatase and C-peptide are associated with hypertension and diabetes pathogenesis.33,34 Alkaline phosphatase promotes protein catabolism and inhibits vascular calcification.33 Here, we observed that both proteins were elevated in HT subjects compared with the C groups. Although the exact cause for the rise of ALP in HT subjects is unknown, Orita et al35 suggest a protective role of ALP in calcified vascular tissue lesions. Similarly, C-peptide, used as a marker for insulin secretion, is also reported as a hypertensive factor in diabetic patients.36 The mechanisms for the positive association of higher C-peptide levels with the risk of hypertension have not yet been elucidated. However, it is known that elevated levels are associated with insulin resistance and hyperglycemia,37 as observed in the current study.
In recent years, there has been growing interest in exploring the potential role of the microbiome in the etiology and pathogenesis of metabolic and cardiovascular diseases, including HT.38,39 Studies from America, China, and Brazil have reported the role of gut microbial dysbiosis in BP regulation and the development of HT.40–43 However, fewer studies have explored the role of the oral microbiome in HT subjects. To bridge this gap, we performed 16S rRNA amplicon sequencing on saliva samples from ninety-six adults and correlated microbiome composition with clinical chemistry and demographic data.
Our data showed a microbial dysbiosis of the oral microbiome in HT subjects, characterized by a distinct presentation of eighty-five bacterial taxa (Figure 3). Phylum Firmicutes, Bacteroidetes, and Proteobacteria were the most heterogeneous bacterial phyla, constituting more than 75% of the total bacterial community. However, only Prevotella, Veillonella, Veillonellaceae, and Atopobium genera were significantly increased in the HT compared to the C group. These observations partially comply with previously reported studies.44 Gordon et al20 reported a strong association of oral microbes Prevotella and Streptococcus with the BP in older women. Another study observed an increase in the count of subgingival bacteria (F. nucleatum, T. denticola, T. forsythia, and P. gingivalis) in HBP subjects.45 Contrary to these observations, except for Fusobacterium and Prevotella, none of the above-reported microbes showed significant differences among our groups. In particular, Streptococcus, which accounted for more than 25% of the microbial community in all the groups and presented a highly diverse genus of opportunistic pathogens, was not significantly different in our study groups. However, Streptococcus showed a positive association with BMI and poor oral health.
The primary focus of many oral microbiome studies was to elucidate the relative abundance of nitrate-reducing bacteria, which are proposed to contribute to nitrous oxide production and BP regulation.18,46 The oral microbiome contains nitrate reductase enzymes that catalyze nitrate into nitrite.14,16 The nitrite is then transported to a systemic circulation where it is converted into nitric oxide, a powerful cardiovascular vasodilator.47 Increase in insulin resistance, plasma glucose, and mean systolic BP were associated with lower population abundance of nitrate‐reducing bacteria.15 Previous studies demonstrated that excessive tongue cleaning and oral antiseptics disrupted the entero-salivary circulation of nitrate and resulted in a modest increase in BP.48,49 Tribble et al49 reported that the use of antiseptic chlorhexidine resulted in overgrowth of Leptotrichia and Prevotella with increased systolic BP. In contrast to these studies, mathematical summation of priori–selected taxa with nitrate‐reducing capacity revealed that the relative abundance of these microbes was higher in the HT group. A meaningful proportion (32–42%) of the oral microbiome constituted potential nitrate‐reducing taxa in both HT and C groups.
It is plausible that different products of bacterial metabolism, in addition to nitrate, have a direct effect on BP through venous anastomoses via the pterygoid plexus to the CNS, thus activating BP regulating areas. Furthermore, metabolites of the oral microbiome, in contrast to products of the gut microbiome, will have more direct access to vasoregulatory domains (eg, the carotid sinuses and aortic bodies) in the vascular system, since their transport will not include the entero-hepatic circulation.50 An additional mechanism of action might involve an effect on the autonomic nervous system that will have an impact on the vascular system and the salivary glands.50
In comparison with other studies,15,46 we reported fewer microbial taxa associated with hypertension. Furthermore, no significant difference in alpha diversity among the study groups was observed, and the microbiome was not affected by the participants’ dietary preferences or smoking habits. However, we have identified some other bacterial taxa that deserve further investigation for their possible role in metabolic disorder management, especially Atopobium, which is previously reported as vaginal microflora in diabetic women with HT and hyperlipidemia.51 Although Prevotella and Veillonella have been consistently reported as significant microbes for cardiovascular diseases, the former is mostly associated with HBP46,51–53 and the latter with hyperglycemia and obesity.54 Furthermore, Prevotella are also considered opportunistic pathogens associated with dysbiosis in subgingival biofilm formation in periodontal diseases.55 However, in our study, only phylum Firmicutes and Streptococcus were correlated with poor oral health, while Fusobacteria was negatively associated with HBP and antibiotic usage.
Conclusion
Our observations and previous reports endorse diverse roles for these microbes in hypertension and metabolic syndrome. The main limitation of this study is the lack of measurement of nitrate-nitrite-NO pathway in saliva and plasma. Furthermore, while this work used 16S rRNA gene sequencing to examine the abundance and composition of bacteria in saliva, this method does not allow for the analysis of bacterial activity. Perhaps, a higher abundance of nitrate-reducing bacteria does not imply a higher rate of nitrate reduction to nitrite. These are preliminary observations that require subsequent experimentation to assess nitrate-reducing action of oral microbiome. Therefore, future experiments are warranted for the mechanistic investigation of hypertension metagenomics.
Data Sharing Statement
All raw FASTQ files obtained from MiSeq were deposited to the NCBI Sequence Read Archive (SRA) for future reference under the study accession number PRJNA643969.
Acknowledgments
Open access funding is provided by the Qatar National Library. This work was sponsored by Qatar National Research Fund (UREP24-103-3-038) and Qatar University (QUCP‐CHS‐2019‐1).
Disclosure
The authors report no conflicts of interest in this work.
References
1. Lim S, Vos T, Flaxman A, Danaei G, Shibuya K, Adair-Rohani H. A comparative risk assessment of burden of disease and injury attributable to 67 risk factors and risk factor clusters in 21 regions, 1990–2010: a systematic analysis for the Global Burden of Disease Study 2010. Lancet. 2016;2012:380.
2. Yamazaki D, Hitomi H, Nishiyama A. Hypertension with diabetes mellitus complications. Hypertens Res. 2018;41(3):147–156. doi:10.1038/s41440-017-0008-y
3. Benjamin EJ, Blaha MJ, Chiuve SE, et al. Heart disease and stroke statistics—2017 update. Circulation. 2017;135(10):e146–e603.
4. Al-Thani M, Al-Thani -A-A, Al-Chetachi W, et al. Situation of diabetes and related factors among Qatari adults: findings from a community-based survey. J Med Internet Res Diabetes. 2017;2(1):e7. doi:10.2196/diabetes.7535
5. Gasmi Benahmed A, Gasmi A, Doşa A, et al. Association between the gut and oral microbiome with obesity. Anaerobe. 2021;70:102248. doi:10.1016/j.anaerobe.2020.102248
6. Raizada MK, Joe B, Bryan NS, et al. Report of the National Heart, Lung, and Blood Institute Working Group on the role of microbiota in blood pressure regulation. Hypertension. 2017;70(3):479–485. doi:10.1161/HYPERTENSIONAHA.117.09699
7. Murugesan S, Al Ahmad SF, Singh P, Saadaoui M, Kumar M, Al Khodor S. Profiling the salivary microbiome of the Qatari population. J Transl Med. 2020;18(1):127. doi:10.1186/s12967-020-02291-2
8. Sohail MU, Elrayess MA, Al Thani AA, Al-Asmakh M, Yassine HM. Profiling the oral microbiome and plasma biochemistry of obese hyperglycemic subjects in Qatar. Microorganisms. 2019;7(12):645. doi:10.3390/microorganisms7120645
9. Barbour A, Philip KJ, Cotter PD. Variable characteristics of bacteriocin-producing Streptococcus salivarius strains isolated from Malaysian subjects. PLoS One. 2014;9(6):e100541. doi:10.1371/journal.pone.0100541
10. Bryan NS, Tribble G, Angelov N. Oral microbiome and nitric oxide: the missing link in the management of blood pressure. Curr Hypertens Rep. 2017;19(4):33. doi:10.1007/s11906-017-0725-2
11. Burleigh MC, Liddle L, Monaghan C, et al. Salivary nitrite production is elevated in individuals with a higher abundance of oral nitrate-reducing bacteria. Free Radic Biol Med. 2018;120:80–88. doi:10.1016/j.freeradbiomed.2018.03.023
12. Kilian M, Chapple ILC, Hannig M, et al. The oral microbiome – an update for oral healthcare professionals. Br Dent J. 2016;221(10):657–666. doi:10.1038/sj.bdj.2016.865
13. Rosier BT, Marsh PD, Mira A. Resilience of the oral microbiota in health: mechanisms that prevent dysbiosis. J Dent Res. 2018;97(4):371–380. doi:10.1177/0022034517742139
14. Koch CD, Gladwin MT, Freeman BA, Lundberg JO, Weitzberg E, Morris A. Enterosalivary nitrate metabolism and the microbiome: intersection of microbial metabolism, nitric oxide and diet in cardiac and pulmonary vascular health. Free Radic Biol Med. 2017;105:48–67.
15. Goh CE, Trinh P, Colombo PC, et al. Association between nitrate‐reducing oral bacteria and cardiometabolic outcomes: results from ORIGINS. J Am Heart Assoc. 2019;8(23):e013324. doi:10.1161/JAHA.119.013324
16. Kapil V, Haydar SM, Pearl V, Lundberg JO, Weitzberg E, Ahluwalia A. Physiological role for nitrate-reducing oral bacteria in blood pressure control. Free Radic Biol Med. 2013;55:93–100. doi:10.1016/j.freeradbiomed.2012.11.013
17. Fåk F, Tremaroli V, Bergström G, Bäckhed F. Oral microbiota in patients with atherosclerosis. Atherosclerosis. 2015;243(2):573–578. doi:10.1016/j.atherosclerosis.2015.10.097
18. Barbadoro P, Ponzio E, Coccia E, et al. Association between hypertension, oral microbiome and salivary nitric oxide: a case-control study. Nitric Oxide. 2021;106:66–71. doi:10.1016/j.niox.2020.11.002
19. Blekkenhorst LC, Bondonno NP, Liu AH, et al. Nitrate, the oral microbiome, and cardiovascular health: a systematic literature review of human and animal studies. Am J Clin Nutr. 2018;107(4):504–522. doi:10.1093/ajcn/nqx046
20. Gordon JH, LaMonte MJ, Genco RJ, et al. Is the oral microbiome associated with blood pressure in older women? High Blood Press Cardiovasc Prev. 2019;26(3):217–225. doi:10.1007/s40292-019-00322-8
21. Hyde ER, Andrade F, Vaksman Z, et al. Metagenomic analysis of nitrate-reducing bacteria in the oral cavity: implications for nitric oxide homeostasis. PLoS One. 2014;9(3):e88645. doi:10.1371/journal.pone.0088645
22. Ko C-Y, Hu A-K, Chou D, et al. Analysis of oral microbiota in patients with obstructive sleep apnea-associated hypertension. Hypertens Res. 2019;42(11):1692–1700. doi:10.1038/s41440-019-0260-4
23. Al Thani A, Fthenou E, Paparrodopoulos S, et al. Qatar Biobank cohort study: study design and first results. Am J Epidemiol. 2019;188(8):1420–1433. doi:10.1093/aje/kwz084
24. Anwar H, Suchodolski JS, Ullah MI, et al. Shiitake culinary-medicinal mushroom, Lentinus edodes (Agaricomycetes), supplementation alters gut microbiome and corrects dyslipidemia in rats. Int J Med Mushrooms. 2019;21(1):79–88. doi:10.1615/IntJMedMushrooms.2018029348
25. Sohail MU, Hume ME. Evaluation of antimicrobial action of chitosan and acetic acid on broiler cecal bacterial profiles in anaerobic cultures inoculated with Salmonella Typhimurium. J Appl Poult Res. 2019;28(1):176–183. doi:10.3382/japr/pfy061
26. Bolyen E, Rideout JR, Dillon MR, et al. Reproducible, interactive, scalable and extensible microbiome data science using QIIME 2. Nat Biotechnol. 2019;37(8):852–857. doi:10.1038/s41587-019-0209-9
27. Callahan BJ, McMurdie PJ, Rosen MJ, Han AW, Johnson AJA, Holmes SP. DADA2: high-resolution sample inference from Illumina amplicon data. Nat Methods. 2016;13(7):581. doi:10.1038/nmeth.3869
28. Bokulich NA, Kaehler BD, Rideout JR, et al. Optimizing taxonomic classification of marker-gene amplicon sequences with QIIME 2’s q2-feature-classifier plugin. Microbiome. 2018;6(1):90. doi:10.1186/s40168-018-0470-z
29. Doel JJ, Benjamin N, Hector MP, Rogers M, Allaker RP. Evaluation of bacterial nitrate reduction in the human oral cavity. Eur J Oral Sci. 2005;113(1):14–19. doi:10.1111/j.1600-0722.2004.00184.x
30. Mills KT, Bundy JD, Kelly TN, et al. Global disparities of hypertension prevalence and control: a systematic analysis of population-based studies from 90 countries. Circulation. 2016;134(6):441–450. doi:10.1161/CIRCULATIONAHA.115.018912
31. Bozkurt B, Aguilar D, Deswal A, et al. Contributory risk and management of comorbidities of hypertension, obesity, diabetes mellitus, hyperlipidemia, and metabolic syndrome in chronic heart failure: a scientific statement from the American Heart Association. Circulation. 2016;134(23):e535–e578. doi:10.1161/CIR.0000000000000450
32. Egan BM, Li J, Qanungo S, Wolfman TE. Blood pressure and cholesterol control in hypertensive hypercholesterolemic patients. Circulation. 2013;128(1):29–41. doi:10.1161/CIRCULATIONAHA.112.000500
33. Matsubara H, Yamanashi H, Nagaura Y, et al. Associations between alkaline phosphatase and hypertension in relation to circulating CD34-positive cell levels pertaining to elderly Japanese men. Acta Med Nagasaki. 2019;62(3):87–93.
34. Smith JD, Wijeratne N, McNeil A. The need to feed? Is a blood glucose above 8 mmol/L needed for the correct interpretation of C-peptide in patients with diabetes? Pathology. 2019;51:S114. doi:10.1016/j.pathol.2018.12.321
35. Orita Y, Yamamoto H, Kohno N, et al. Role of osteoprotegerin in arterial calcification: development of new animal model. Arterioscler Thromb Vasc Biol. 2007;27(9):2058–2064. doi:10.1161/ATVBAHA.107.147868
36. Fernandez E, Bernal E, Sanchez O, et al. -475: c-peptide as a new hypertensive factor in patients with type 2 diabetes mellitus. Am J Hypertens. 2005;18(S4):179A. doi:10.1016/j.amjhyper.2005.03.492
37. Duan D, Gu C, Jun JC. Altered metabolism in pulmonary hypertension: fuelling the fire or just smoke? Eur Respir Soc. 2020;55(4):2000447. doi:10.1183/13993003.00447-2020
38. Sanna S, van Zuydam NR, Mahajan A, et al. Causal relationships among the gut microbiome, short-chain fatty acids and metabolic diseases. Nat Genet. 2019;51(4):600–605. doi:10.1038/s41588-019-0350-x
39. Sohail MU, Yassine HM, Sohail A, Al Thani AA. Impact of physical exercise on gut microbiome, inflammation, and the pathobiology of metabolic disorders. Rev Diabet Stud. 2019;15(1):35–48. doi:10.1900/RDS.2019.15.35
40. Dan X, Mushi Z, Baili W, et al. Differential analysis of hypertension-associated intestinal microbiota. Int J Med Sci. 2019;16(6):872. doi:10.7150/ijms.29322
41. Li H, Liu B, Song J, et al. Characteristics of gut microbiota in patients with hypertension and/or hyperlipidemia: a cross-sectional study on rural residents in Xinxiang County, Henan Province. Microorganisms. 2019;7(10):399. doi:10.3390/microorganisms7100399
42. Silveira-Nunes G, Durso DF, Cunha EHM, et al. Hypertension is associated with intestinal microbiota dysbiosis and inflammation in a Brazilian population. Front Pharmacol. 2020;11:258. doi:10.3389/fphar.2020.00258
43. Yan Q, Gu Y, Li X, et al. Alterations of the gut microbiome in hypertension. Front Cell Infect Microbiol. 2017;7:381. doi:10.3389/fcimb.2017.00381
44. Lira-Junior R, Åkerman S, Klinge B, Boström EA, Gustafsson AJP. Salivary microbial profiles in relation to age, periodontal, and systemic diseases. PLoS One. 2018;13(3):e0189374. doi:10.1371/journal.pone.0189374
45. Desvarieux M, Demmer RT, Jacobs JDR, et al. Periodontal bacteria and hypertension: the oral infections and vascular disease epidemiology study (INVEST). J Hypertens. 2010;28(7):1413. doi:10.1097/HJH.0b013e328338cd36
46. Vanhatalo A, Blackwell JR, L’Heureux JE, et al. Nitrate-responsive oral microbiome modulates nitric oxide homeostasis and blood pressure in humans. Free Radic Biol Med. 2018;124:21–30. doi:10.1016/j.freeradbiomed.2018.05.078
47. Grant MM, Jönsson D. Next generation sequencing discoveries of the nitrate-responsive oral microbiome and its effect on vascular responses. J Clin Med. 2019;8(8):1110. doi:10.3390/jcm8081110
48. Bescos R, Ashworth A, Cutler C, et al. Effects of Chlorhexidine mouthwash on the oral microbiome. Sci Rep. 2020;10(1):1–8. doi:10.1038/s41598-020-61912-4
49. Tribble GD, Angelov N, Weltman R, et al. Frequency of tongue cleaning impacts the human tongue microbiome composition and enterosalivary circulation of nitrate. Front Cell Infect Microbiol. 2019;9:39. doi:10.3389/fcimb.2019.00039
50. Grabowski SR, Tortora Gerard J. Tortora’s Principles of Anatomy and Physiology.
51. Liu F, Ling Z, Xiao Y, et al. Alterations of urinary microbiota in type 2 diabetes mellitus with hypertension and/or hyperlipidemia. Front Physiol. 2017;8:126. doi:10.3389/fphys.2017.00126
52. Aoyama N, Suzuki JI, Kumagai H, et al. Specific periodontopathic bacterial infection affects hypertension in male cardiovascular disease patients. Heart Vessels. 2018;33(2):198–204. doi:10.1007/s00380-017-1042-z
53. Swati P, Thomas B, Vahab SA, Kapaettu S, Kushtagi P. Simultaneous detection of periodontal pathogens in subgingival plaque and placenta of women with hypertension in pregnancy. Arch Gynecol Obstet. 2012;285(3):613–619. doi:10.1007/s00404-011-2012-9
54. Liu Y, Song X, Zhou H, et al. Gut microbiome associates with lipid-lowering effect of rosuvastatin in vivo. Front Microbiol. 2018;9:530. doi:10.3389/fmicb.2018.00530
55. Socransky SS, Haffajee AD. Periodontal microbial ecology. Periodontol 2000. 2005;38(1):135–187. doi:10.1111/j.1600-0757.2005.00107.x
 © 2021 The Author(s). This work is published by Dove Medical Press Limited, and licensed under a Creative Commons Attribution License.
The full terms of the License are available at http://creativecommons.org/licenses/by/4.0/.
The license permits unrestricted use, distribution, and reproduction in any medium, provided the original author and source are credited.
© 2021 The Author(s). This work is published by Dove Medical Press Limited, and licensed under a Creative Commons Attribution License.
The full terms of the License are available at http://creativecommons.org/licenses/by/4.0/.
The license permits unrestricted use, distribution, and reproduction in any medium, provided the original author and source are credited.