")
Back to Journals » Breast Cancer: Targets and Therapy » Volume 15
Dual Target of EGFR and mTOR Suppresses Triple-Negative Breast Cancer Cell Growth by Regulating the Phosphorylation of mTOR Downstream Proteins
Authors Ma J, Dong C, Cao YZ, Ma BL
Received 15 September 2022
Accepted for publication 20 December 2022
Published 17 January 2023 Volume 2023:15 Pages 11—24
DOI https://doi.org/10.2147/BCTT.S390017
Checked for plagiarism Yes
Review by Single anonymous peer review
Peer reviewer comments 2
Editor who approved publication: Professor Pranela Rameshwar
Jing Ma,1 Chao Dong,1 Yan-Zhen Cao,2 Bin-Lin Ma1
1Department of Breast and Thyroid Surgery, Affiliated Cancer Hospital of Xinjiang Medical University, Urumqi, 830000, People’s Republic of China; 2Pathology Center, Affiliated Cancer Hospital of Xinjiang Medical University, Urumqi, 830000, People’s Republic of China
Correspondence: Bin-Lin Ma, Department of Breast and Thyroid Surgery, Affiliated Cancer Hospital of Xinjiang Medical University, No. 789, Suzhou East Street, Xinshi District, Urumqi, 830000, People’s Republic of China, Tel/Fax +86 991 7819082, Email [email protected]
Objective: To detect the activation of the EGFR and mTOR signaling pathways in the triple negative breast cancer cell line MDA-MB-468 and investigate the inhibitory effect of gefitinib, an epidermal growth factor receptor inhibitor, and everolimus, a target protein inhibitor of rapamycin, on triple negative breast cancer cells.
Methods: Triple negative human breast cancer MDA-MB-468 cells were cultured and blank control group, single EGFR inhibitor gefitinib group, single mTOR inhibitor everolimus group, and two drug combination group were set up respectively to detect the effects of single and combined drugs on cell proliferation activity, cell cycle and apoptosis, and the expression of EGFR and mTOR signal pathway proteins in cell lines after single and combined drug intervention was detected again by Western blot.
Results: The level of EGFR and p-mTOR protein in triple negative breast cancer was higher than in non triple negative breast cancer (P< 0.05). The level of mTOR, S6K1, p-EGFR, p-S6K1 was significantly increased when treated with EGF (0ng/mL, 10ng/mL, 100ng/mL) for 1h, compared to without EGF stimulation (P< 0.05). The level of p-EGFR, p-mTOR, p-S6K1 protein increased significantly when the cells were exposed to EGF for 2h, respectively (P< 0.05). EGFR inhibitor gefitinib alone and the mTOR inhibitor everolimus alone could significantly inhibit the proliferation of human triple negative breast cancer MDA-MB-468 cells in a dose-dependent manner (P< 0.05). The level of p-4EBP1 protein in EGFR and mTOR signal pathway was significantly increased after the intervention of gefitinib alone, everolimus alone, and the combination of two drugs (P< 0.05).
Conclusion: EGFR and mTOR signaling pathways can be activated in triple negative breast cancer; Both the EGFR inhibitor gefitinib alone and the mTOR inhibitor everolimus alone can significantly inhibit the proliferation of human triple negative breast cancer MDA-MB-468 cells. The combination of the EGFR inhibitor gefitinib and the mTOR inhibitor everolimus may achieve anti-tumor effect similar to that of single drug by reducing the drug dose.
Keywords: triple-negative breast cancer, epidermal growth factor receptor, EGFR, mammalian target of rapamycin, mTOR, anti-tumor efficacy, ribosomal protein S6 kinase, RPS6K, 4E binding protein 1, 4EBP1
Introduction
Breast cancer is one of the most common malignant tumors in women. It is the most frequently diagnosed cancer in the vast majority of the countries (154 of 185) and is also the leading cause of cancer death in over 100 countries.1 Although the total mortality rate has been declining due to improvements in diagnostic techniques and refinements in treatment modalities in many developed nations in the past decades, mortality from advanced types of breast cancers has remained at a high level. Most patients present with an unresectable disease, and the current treatment options of chemotherapy and radiotherapy are unsatisfactory. New strategies are needed for the treatment of this disease to improve patient survival rates.
Breast cancer is highly heterogeneous, with different types of breast cancers demonstrating considerable heterogeneity despite a common tissue of origin. In clinical practice, breast cancers are usually divided into the following subtypes according to the status of different molecular biomarkers:2 estrogen receptor- (ER) or progesterone receptor- (PR) positive (also known as luminal types), human epidermal growth factor receptor 2- (HER2) positive with or without ER and PR positivity (also known as the HER2 overexpressed type), and triple-negative breast cancer (TNBC), which is defined by the absence of ER/PR expression and HER2 amplification. Among them, TNBC is the most aggressive subtype, accounting for 15–20% of breast cancers and encompassing more than one molecular subtype. In contrast to the ER/PR-positive and/or HER2-negative molecular subtypes, TNBC has the clinical characteristics of rapid progression, early onset of metastasis, and unresponsiveness to available hormonal and anti-HER2-targeted therapies.3 Currently, chemotherapy and radiation therapy are the only methods for treating patients with TNBC,4,5 but the prognosis is poor due to drug resistance and recurrence in the first 5 years.6 Thus, the development of new therapeutic targets for patients with TNBC is urgent.
Epidermal growth factor receptor (EGFR) belongs to a large family of cell surface receptors. In normal cells, the expression of EGFR is estimated at between 40,000 and 100,000 receptors per cell;7 however, in cancer cells, the overexpression of more than 106 receptors per cell has been observed.8 The activation of EGFR requires ligand binding. The binding of the EGF ligand to the EGFR extracellular domain (EGFR-ECD) promotes its inactive-to-active conformational transition (activation), and the functional conformational transition of EGFR-ECD is a consequence of the cooperative motion of protein domains driven by EGF ligand binding.9 When the ligand binds to the extracellular region of EGFR, the receptor forms a dimer to activate its kinase activity before autophosphorylating at multiple tyrosine residues in the intracellular region to recruit various substrates. As an important ligand of EGFR, EGF can stimulate cell proliferation, differentiation, growth, and migration and inhibit apoptosis. Previous studies have shown that the addition of EGF to HeLa cells can activate EGFR, resulting in the phosphorylation of all 2244 proteins at 6600 sites.10 In addition, EGF stimulation was shown to cause significant differences in the expression of 3172 genes and 596 proteins in human mammary epithelial cells.11
Receptor activation promotes cell proliferation, motility, and survival by activating various downstream signaling pathways, including the Ras-Raf-MAPK and mTOR-PI3K-AKT pathways.12 Epidermal growth factor receptor plays an important role in the occurrence and development of a variety of malignant tumors and can promote the growth, proliferation, angiogenesis, invasion, metastasis, and apoptosis of tumor cells.
Clinical data have shown that more than half of TNBCs have EGFR overexpression, which is often associated with a poor prognosis.13,14 This indicates that patients with TNBC are likely to benefit from EGFR-targeted therapies, and several EGFR inhibitors are under evaluation in clinical. Unfortunately, the commonly used inhibitors cetuximab and gefitinib, which are effective in non small cell lung cancer, failed to demonstrate significant efficacy in TNBC when used alone.15,16 The possible reason for this inefficiency might be the activation of EGFR-dependent signaling pathways, especially the PI3K/AKT/mTOR pathway in EGFR-overexpressed TNBC.
The mammalian target of rapamycin (mTOR) is a serine/threonine kinase that is directly phosphorylated and activated by protein kinase B (AKT). The activation of mTOR phosphorylates of eukaryotic translational initiation factor 4E-binding protein (4E-BP1) and ribosomal protein S6 kinase (P70S6K) leads to protein translation and tumor growth.17,18 Preclinical studies have suggested that targeting mTOR could improve the efficacy of EGFR inhibitors in various human cancers, including TNBC. The mTOR inhibitor rapamycin in combination with paclitaxel can affect the PI3K/AKT/mTOR signaling pathway and improve the therapeutic effect in TNBC.19
A wide variety of EGFRi combinations have been successfully applied in TNBC cells preclinically, both in vitro and in vivo; however, most of them have not yet been clinically evaluated.20 TNBC has been shown to have intrinsic resistance to anti-EGFR therapies, including both anti-EGFR antibodies and EGFR TKIs.21 Given the connection between EGFR and the mTOR pathway in TNBC, we hypothesized that the dual targeting of mTOR and EGFR could be a therapeutic strategy for treating TNBC. In the current study, we examined the expression of EGFR and mTOR downstream proteins in TNCB tissue samples and investigated the combined effect of everolimus and gefitinib in the TNBC cell line.
Materials and Methods
Patients and Tissue Samples
A total of 111 female patients in the Affiliated Cancer Hospital of Xinjiang Medical University of China were recruited for this study between January and June 2013, and the clinical and pathological data of these patients were collected. The authors were granted access to information that could identify individual participants during and after data collection. The median age of the patients was 47.5 years (range: 29–72 years).
A total of 81 patients had 0–3 lymph node metastases, and 30 patients had ≥4 lymph node metastases. All patients underwent surgery for breast cancer at the department of breast and thyroid surgery. After surgery, tissue samples were fixed in 7.5% buffered formalin and embedded in paraffin for routine diagnostics. According to the International Union Against Cancer’s 2004 issue of the Tumor Node Metastasis system, there were 43 patients with clinical stage-I cancer, 46 patients with clinical stage-II cancer, and 22 patients with clinical stage-III cancer. In terms of the expression of ER, PR, HER2, and Ki-67, the patients were divided into luminal (n = 42), TNBC (n = 48), and HER2 (n = 21) overexpression subtypes. For the 5-year survival records, the 48 patients with TNBC were followed up for 60 months. Table 1 presents details of the patients’ information. All protocols were approved by Xinjiang Medical University, and informed consent was obtained from all participating patients.
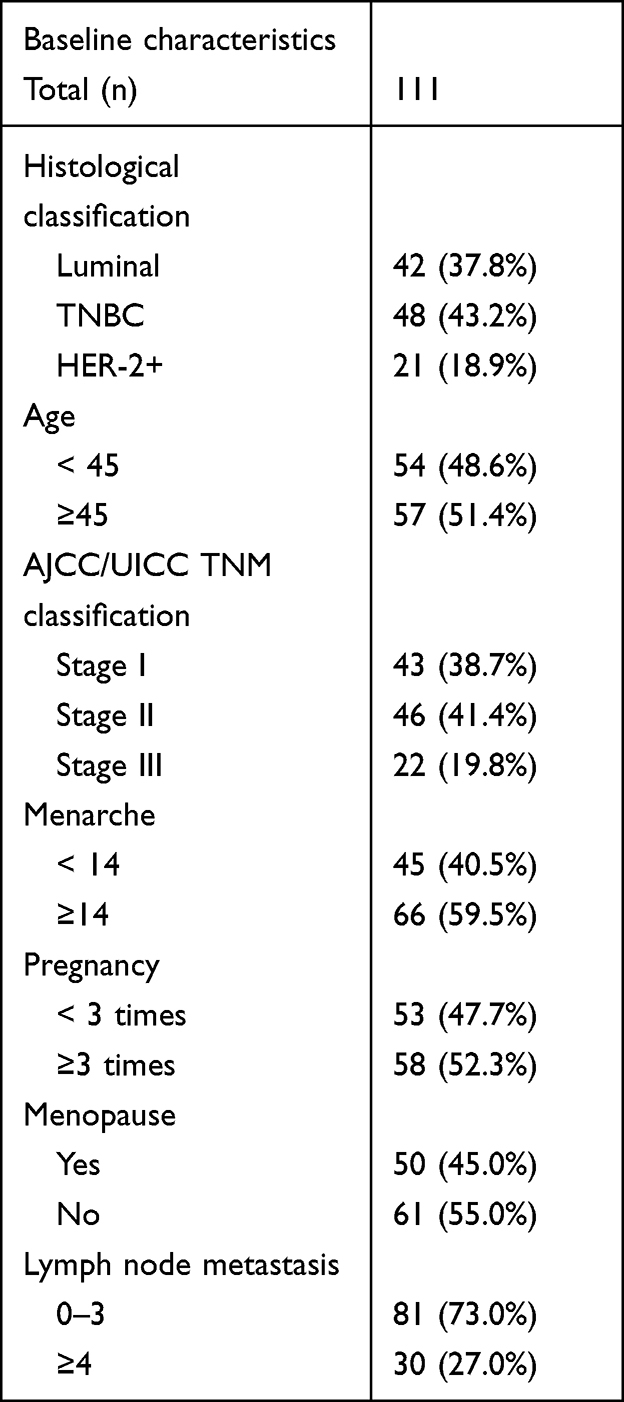 |
Table 1 Clinical and Pathological Features of Breast Cancer Patients. |
Immunohistochemistry (IHC)
Tumor tissue derived from surgical specimens was fixed in 7.5% formalin, and IHC was performed on 4-mm paraffin sections from one representative tissue block per patient following the manufacturer’s instructions. The sections were stained with a monoclonal antibody (mAb) against EGFR, phosphorylated- (p) mTOR, p-4EBPl, and p-S6K1 (1:100 dilution, Cell Signaling [Boston, Massachusetts, USA]) and counterstained with hematoxylin. Protein expression was detected using horseradish peroxidase- (HRP) conjugated rabbit anti-mouse immunoglobulin G (IgG) secondary antibody, followed by colorimetric detection using Diaminobenzidine (DAB). The positive expression was determined under a microscope (×400) by the presence of clear brown granules in the membrane or cytoplasm and/or nucleus. Five fields were selected randomly, and a total of 200 cells were counted. The intensity of staining was scored “−” for colorless, “+” for light yellow, and “++” for yellow and brown–yellow. The positive index scored negative (−) when the number of positive cells was less than 10%, weakly positive (+) when the number of positive cells was 10%–50%, and strongly positive (++) when the number of positive cells was more than 50%.
Cell Lines and Reagents
The MDA-MB-468 cell line was purchased from the American Type Culture Collection (Manassas, VA, USA). Cells were cultured in Dulbecco’s Modified Eagle’s medium supplemented with 10% heat-inactivated fetal bovine serum and 1% PBS at 37°C under a humidified atmosphere of 5% CO2. The EGFR tyrosine kinase inhibitor gefitinib and the mTOR inhibitor everolimus were purchased from APExBIO (Houston, Texas, USA), and EGF was purchased from GIBCO (Gland island, New York, USA). The drugs were dissolved in dimethyl sulfoxide and stored at −20°C. Dilutions were made immediately before use in the growth medium. A TransGen Cell Counting Kit-8 (Beijing, China) was used, and an fluorescein isothiocyanate (FITC) Annexin V Apoptosis Detection Kit was purchased from Becton, Dickinson and Company (Franklin Lake, New Jersey, USA). Primary rabbit mAb to mTOR (2972), p-mTOR (Ser2448) (2971), 4EBP1 (9452), p-4EBP1 (Thr37/46) (2855), p-70S6 Kinase (9202), p-70S6 Kinase (9205), EGFR (2232), and p-EGFR (D7A5) XP® (3777) were purchased from Cell Signaling (USA). Anti-Beta Actin rabbit polyclonal antibody (D110001) was purchased from Sangon Biotech (Shanghai) Co. Inc. Goat anti-rabbit IgG H&L (HRP) (ab205718) was purchased from Abcam (Cambridge, Cambs, UK). All other reagents were purchased from Sigma (St. Louis, MO, USA) unless indicated.
Cells were cultured briefly in 100-mm dishes at a density of 5×10⁵ cells per dish and treated with the indicated drugs for 1 or 2 h. Next, 20 µg of the cell lysate from each protein Cambssample was separated using 7–12% sodium dodecyl sulfate polyacrylamide gel electrophoresis (SDS-PAGE) and transferred to polyvinylidene fluoride membranes. The blots were blocked and incubated overnight at 4°C with the indicated primary antibodies. All primary antibodies were diluted at 1:500 except those against mTOR, S6K1, and p-S6K1, which were diluted at 1:1000. The immunoreactive proteins were detected using the enhanced chemiluminescence method and were quantified using Image J software (v1.48, National Institutes of Health). The intensity of individual bands was expressed relative to the control signal.
CCK-8 Assay
MDA-MB-468 cells (5 × 10⁴ cells per well) in the logarithmic phase were plated in 0.5-mL complete medium in 96-well plates and were left to attach overnight. The next day, gefitinib and everolimus (or a combination of the two) were added at a concentration as indicated. The cells were incubated for 48 h at 37°C in a humidified atmosphere containing 5% CO2. Afterward, the cells were added to a 10% CCK-8 solution and incubated for another hour. Absorbance was recorded using a Bio-Rad xMark™ (Hercules, California, USA) plate reader at 4500 nm. All the experiments were performed in triplicate.
Cell Cycle Analysis, Cell Proliferation, and Apoptosis
The cells were cultured and treated with drugs as described above. After 48 h of incubation with the three treatments, the cells were harvested and fixed with 80% cold ethanol overnight. The next day, after centrifugation at 2500 rpm for 5 min, the cell pellets were resuspended with PI/RNase staining buffer and filtered with a 200-mesh nylon sieve to form a single-cell suspension. A cell cycle analysis was performed using a BD FACS AriaII (Franklin Lake, New Jersey, USA) Fluorescence activated Cell Sorting flow cytometer, and the cell cycle distribution was calculated using ModFit LT (Verity Software House). To further analyze apoptosis, the cells treated with the indicated drugs were harvested, and annexin V-FITC and propidiumIodide staining were performed for 15 min at 4°C in the dark. The cells were analyzed by flow cytometry, and the results were expressed as the percentage of apoptotic cells, including both early (annexin V positive, PI negative) and late (annexin V positive, PI positive) apoptotic cells, relative to the total number of cells.
Statistical Analysis
All experiments were performed at least in triplicate and were repeated three times. Unless otherwise indicated, the results are expressed in the mean ± standard deviation format. The statistical analysis was performed using SPSS 19.0 software (IBM, USA), and the results from the different groups were compared using a one-way analysis of variance. The survival analysis used the Kaplan–Meier method. For all the statistical analyses, a value of P < 0.05 was considered to be a statistically significant difference.
Results
Expression of EGFR, p-mTOR, p-S6K1, and p-4EBP1 in TNBC
The level of EGFR, p-mTOR, p-S6K1, and p-4EBP1 in patients with breast cancer was analyzed by immunohistochemistry on 48 patient tissue samples. Overall, the level of the four proteins was positively correlated with both lymph node metastasis and the clinical stage (P < 0.05). The positive expression rate of EGFR, p-mTOR, p-S6K1, and p-4EBP1 in patients with lymph node metastases ≥4 was 66.7%, 63.3%, 60.0%, and 70%, respectively, which was significantly higher than the rate in patients with lymph node metastases of 0–3 (P < 0.05) (see Supplementary Table S1). Moreover, the expression rates of EGFR, p-mTOR, p-S6K1, and p-4EBP1 at stages I to III were remarkably increased from 0.04%, 20.9%, 14.0%, and 25.5% to 61.5%, 63.6%, 63.6%, and 68.2%, respectively (see Supplementary Table S2).
According to the expression of ER, PR, HER2, and Ki-67, the included 111 patients with breast cancer were divided into three types: luminal (n = 42), TNBC (n = 48), and HER2+ (n = 21). The expression rates of EGFR, p-mTOR, p-S6K1, and p-4EBP1 in the luminal, TNBC, and HER2+ types were 19.0%, 23.8%, 26.2% and 28.6%; 43.8%, 52.1%, 39.6% and 41.7%; 23.8%, 19.0%, 28.6% and 26.2%, respectively. The expression rates of EGFR and p-mTOR in TNBC were significantly higher than in the luminal and HER2+ types (P < 0.05) (see Supplementary Table S3). The representative images for the immunostaining and immunohistochemistry of the TNBC tissues and their adjacent tissues are shown in Figure 1. The EGFR showed a cytoplasmatic and membranous staining pattern, p-mTOR was expressed cytoplasmically, and p-S6K1 and p-4EBP1 were expressed in the cytoplasm and/or nucleus. Four proteins were negatively or weakly expressed in adjacent tissues.
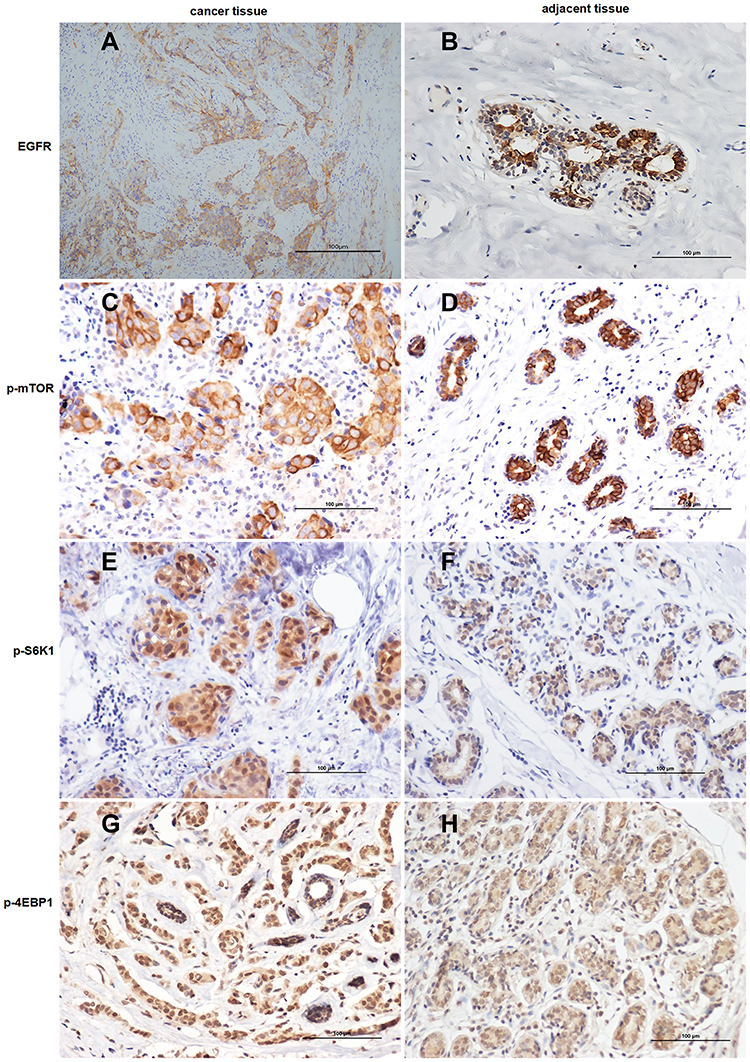 |
Figure 1 Immunohistochemical staining of triple-negative breast cancer (TNBC) cells and their adjacent tissues for the expression of (A and B) epidermal growth factor receptor, (C and D) phosphorylated mammalian target of rapamycin, (E and F) phosphorylated ribosomal protein S6 kinase (p-S6K1), and (G and H) phosphorylated 4E binding protein 1 (all 400 × magnification). This figure is representative of the immunohistochemistry of tumor tissues and their adjacent tissues from 48 patients with TNBC. The positive expression was determined under a microscope (×400) by the presence of clear brown granules in the membrane or cytoplasm and/or nucleus. |
Correlation of EGFR, p-mTOR, p-S6K1, and p-4EBP1 Expression with the Survival of Patients with TNBC
The 48 patients with TNBC were followed up for 60 months to analyze the correlation between survival and the level of EGFR, p-mTOR, p-S6K1, and p-4EBP1. The Kaplan–Meier survival analysis of the patients showed the average 5-year disease-free survival of the EGFR-positive group (43.15 months) and the p-4EBP1-positive group (47.16 months) was significantly shorter than in the negative groups (54.66 and 51.78 months, respectively); otherwise, there was no significant difference between the p-mTOR-positive group (49.4 months) and the p-S6K1-positive group (48.47 months) compared with their negative groups (50.42 and 50.79 months, respectively) (see Figure 2). The results indicated that the overexpression of EGFR and p-4EBP1 in patients with TNBC might predict a poor prognosis.
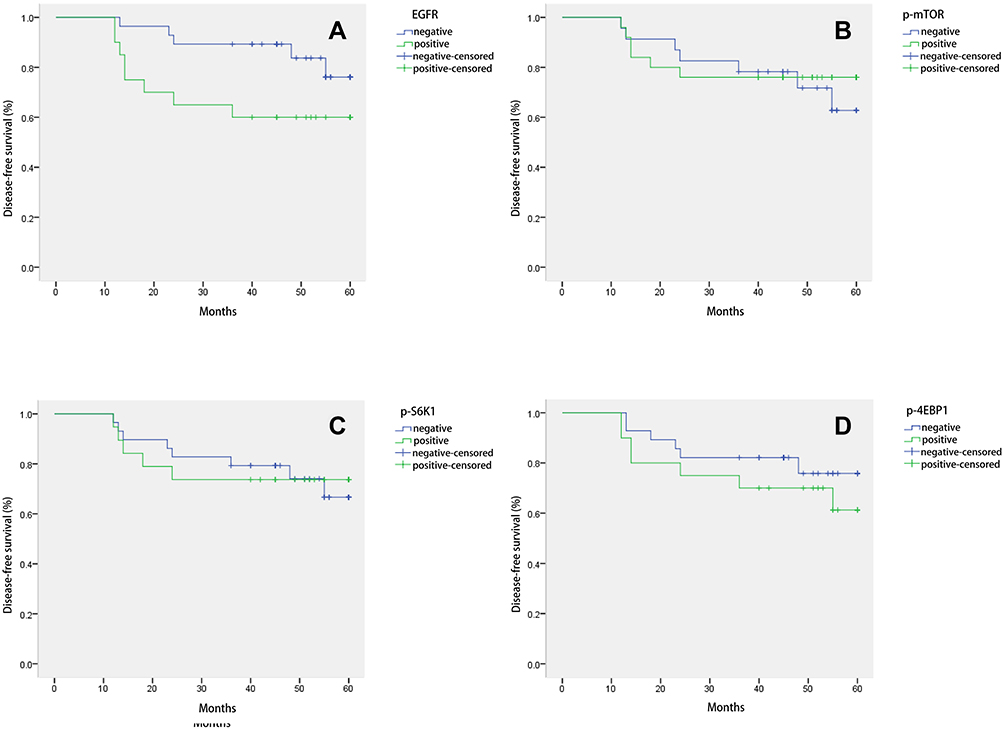 |
Figure 2 Disease-free survival curve of patients with triple-negative breast cancer under different expressions of (A) epidermal growth factor receptor, (B) phosphorylated mammalian target of rapamycin, (C) phosphorylated ribosomal protein S6 kinase (p-S6K1), and (D) phosphorylated 4E binding protein 1. The difference in the 5-year disease-free survival rate between positive and negative groups was tested using log–rank and Breslow statistics. A value of P < 0.05 was considered a statistically significant difference. |
Expression of EGFR, p-mTOR, p-S6K1, and p-4EBP1 in EGFR–mTOR Signaling by EGF Induction
MDA-MB-468 is a TNBC cell line. To evaluate EGFR–mTOR downstream signaling, MDA-MB-468 cells were treated with two concentrations of EGF in two separate tests. The Western blot results showed that the expression of mTOR, p-mTOR, p-S6K1, and p-EGFR after 10 ng/mL and 100 ng/mL of EGF treatment was significantly increased compared with those without EGF treatment (P < 0.05). Conversely, the expression of p-4EBP1 with EGF treatment was significantly decreased than in the samples without EGF treatment (P < 0.05) (see Figure 3). There was no significant difference between the two concentrations and the two different tests (P > 0.05). This result confirmed the activation of EGFR–mTOR signaling in MDA-MB-468 cells. We conducted five biological repeats in this part of the experiment.
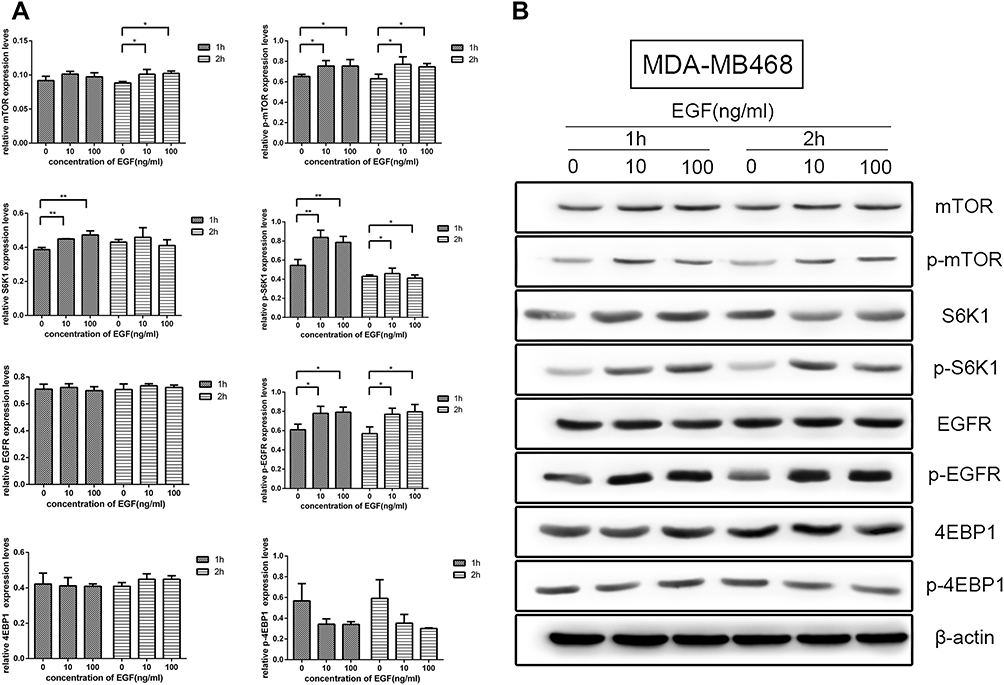 |
Figure 3 Effects of epidermal growth factor receptor (EGFR) and mammalian target of rapamycin (mTOR) pathways after EGF treatment on MDA-MB-468 cells. (A) The expression level of mTOR, phosphorylated mTOR, phosphorylated ribosomal protein S6 kinase (p-S6K1), and phosphorylated EGFR in 10 and 100 ng/mL of EGF treatment were significantly changed compared with those without EGF treatment (P < 0.05). (B) Western blotting of the expression patterns of EGFR and mTOR pathway proteins. Asterisks (*) denote significant differences compared with those without EGF treatment, P < 0.05; Asterisks (**) denote significant differences compared with those without EGF treatment, P < 0.01. |
Synergy of EGFR and mTOR Inhibitors in TNBC Cells
To evaluate the effects of EGFR and mTOR inhibitors on the growth of the MDA-MB-468 TNBC cell line, gefitinib and everolimus, respectively, were used to test cell proliferation individually and collaboratively via a CCK-8 assay. The results showed that the EGFR inhibitor gefitinib and the mTOR inhibitor everolimus significantly inhibited the proliferation of MDA-MB-468 cells in a dose-dependent manner when used separately or in combination (P < 0.05). The growth inhibitory values at 50% (IC50) for gefitinib and everolimus were 20.470 ± 5.23 and 20.192 ± 6.10 µm, respectively.
To evaluate the synergy of the dual-drug combination, different concentrations of combinations were used to test the inhibitory effects on MDA-MB-468 cells. The result showed that each combination significantly inhibited cells compared with the untreated control (P < 0.01) (see Figure 4). According to this formula: combined effect Q = inhibitory rate of combination / [inhibitory rate of drug A + (1 − inhibitory rate of drug A) × inhibitory rate of drug B], Q<0.85 indicates that the two drugs are antagonistic, Q=0.85–1.15 indicates that the two drugs are additive, Q>1.15 indicates that the combination of the two drugs has synergistic effect, and the greater the Q value, the stronger the synergistic effect; the Q value of 10 µm gefitinib combined with 10 µm everolimus was 1.097, suggesting additive effects.
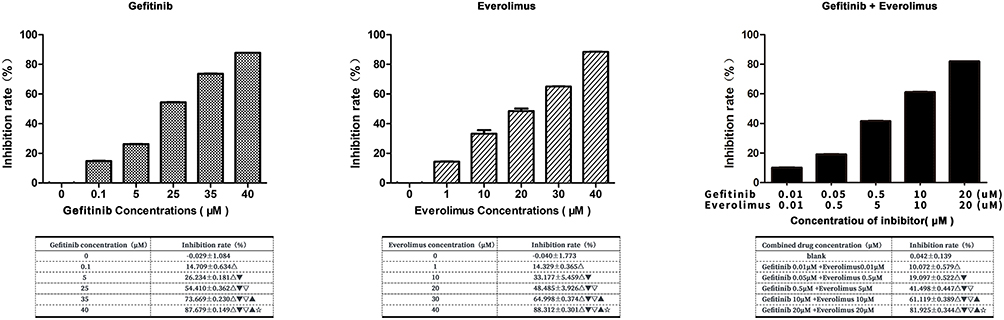 |
Figure 4 Cell Counting Kit-8 assay to determine the effect of gefitinib and everolimus on MDA-MB-468 cell growth individually and collaboratively. The statistical analysis is presented in the insert table. Δ compared with the control group, P < 0.01. ▼compared with 0.01-μm gefitinib + 0.01-μm everolimus, P < 0.01. ▽ compared with 0.05-μm gefitinib + 0.5-μm everolimus, P < 0.01. ▲ compared with 0.5-μm gefitinib + 5-μm everolimus, P < 0.01. ☆ compared with 10-μm gefitinib + 10-μm everolimus, P < 0.01. |
Effects of EGFR and mTOR Inhibitors on the Cell Cycle
The inhibition of cancer cells generally resulted in cell growth arrest. Subsequently, we used flow cytometry to examine the cell cycle of MDA-MB-468 cells treated with gefitinib and everolimus. The results showed that 71.19% ± 1.48% of gefitinib-treated cells, 73.34% ± 0.55% of everolimus-treated cells, and 78.27% ± 0.34% of cells treated in combination were in the G0/G1 phase, which was significantly higher than the proportion in untreated cells (52.49% ± 0.42%) (P < 0.01), and the proportion of cells in the G0/G1 phase treated in combination was significantly higher than that in cells treated individually (P < 0.05). The results indicated that gefitinib, everolimus, and the two in combination arrested MDA-MB-468 cells in the G0/G1 phase (see Figure 5).
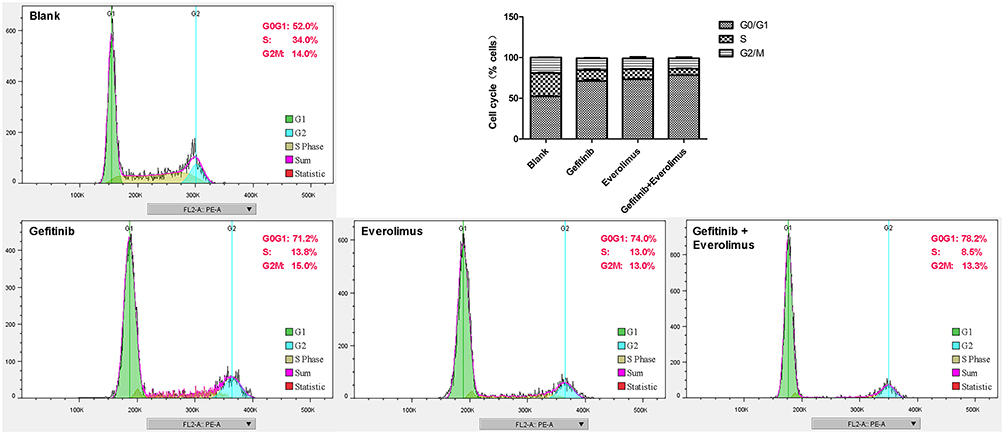 |
Figure 5 MDA-MB-468 cell cycle arrested induced by gefitinib and everolimus. MDA-MB-468 cells were treated with gefitinib, everolimus, and a combination of both for 48 h; subsequently, they were detected by flow cytometry. |
To evaluate the effects of EGFR and mTOR inhibitors on cell death, we analyzed the apoptosis of MDA-MB-468 cells using an annexin V/PI assay after treatment with gefitinib and everolimus individually and in combination. The results showed that gefitinib and everolimus alone and in combination significantly induced the apoptosis of MDA-MB-468 cells (P < 0.01); the apoptosis rates induced by gefitinib, everolimus, and the two in combination were 12.2%, 11.3%, and 10.6%, respectively (see Figure 6). However, there was no significant difference between the combined treatment and individual treatments (P > 0.05). This indicates there is no synergistic effect between the two drugs in apoptosis induction. We conducted five biological repeats in this part of the experiment.
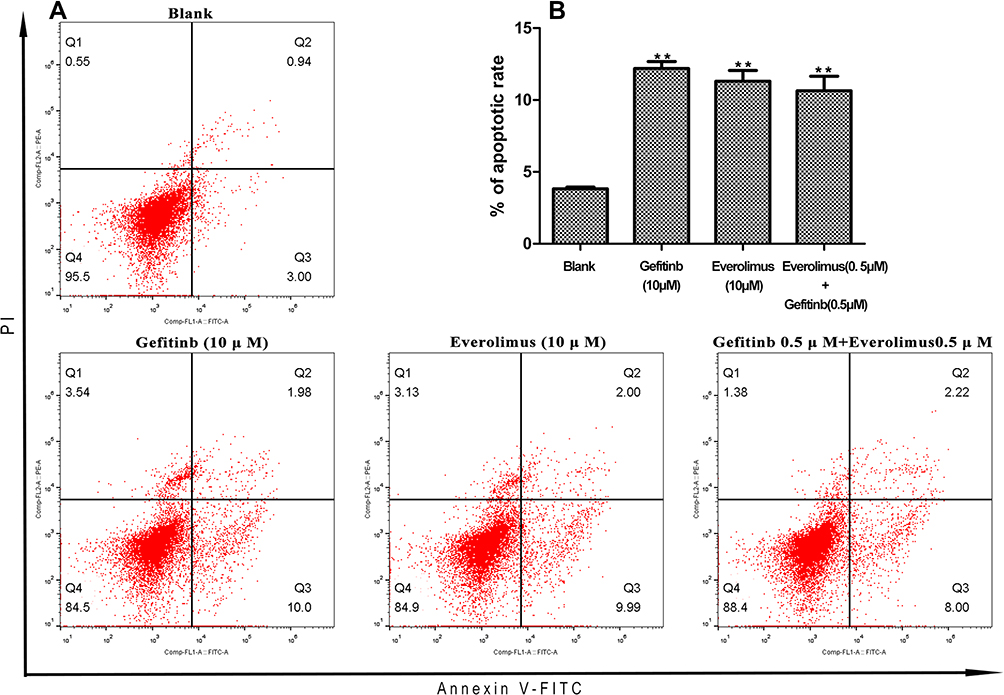 |
Figure 6 Fluorescence activated Cell Sorting (FACS) analysis of annexin V-FITC labeling of apoptosis in MDA-MB-468 cells after treatment with gefitinib and everolimus individually and in combination. (A) FACS spectra for apoptosis after treatment with the indicated drugs. (B) Quantitative data for the apoptosis analysis. Mean ± SD, n = 3. Asterisks (**) denote significant differences compared with the control (0 µm), P < 0.05. |
Effects on the EGFR and mTOR Pathways After Treatment of MDA-MB-468 Cells with EGFR and mTOR Inhibitors
To assess the effects of gefitinib and everolimus on the EGFR/mTOR signaling pathways, we analyzed the protein level of total and phosphorylated forms of EGFR, mTOR, S6K1, and 4EBP1 using Western blotting. MDA-MB-468 cell lines were treated with gefitinib and everolimus as single agents and in combination. There was no significant difference in EGFR expression for each treatment. Compared with untreated cells, gefitinib alone and in combination with everolimus significantly decreased the protein expression of mTOR, p-mTOR, and SK61 (P < 0.05). However, everolimus did not affect mTOR or p-mTOR, but it markedly decreased the expression of SK61. Compared with single agents, the combination treatment significantly decreased the level of p-mTOR. In contrast to the predictions, the level of p-4EBP1 was significantly increased by both the single agents and in combination (P < 0.05) (see Figure 7 and Supplementary Table S4).
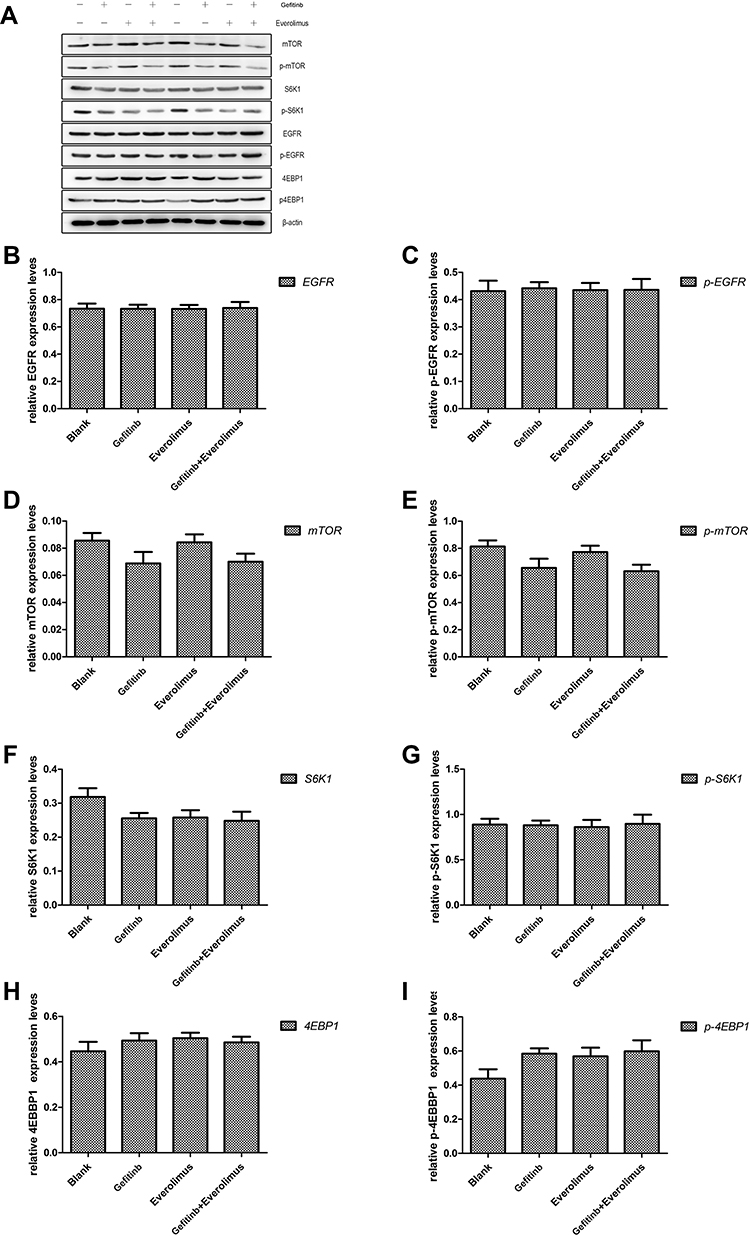 |
Figure 7 Western blot analysis of epidermal growth factor receptor (EGFR) and mammalian target of rapamycin (mTOR) pathways in the MDA-MB-468 cell line treated with gefitinib and everolimus and their relative expression. (A) Western blotting of the expression patterns of the EGFR and mTOR pathway proteins after treatment with gefitinib and everolimus alone and in combination (P < 0.05). (B–I) Expression of EGFR, phosphorylated EGFR, mTOR, phosphorylated mTOR, ribosomal protein S6 kinase (S6K1), phosphorylated S6K1, 4E binding protein 1 (4EBP1), and phosphorylated 4EBP1 proteins after intervention with gefitinib and everolimus alone and in combination (P < 0.05). |
Discussion
One of the remarkable characteristics of TNBC is the overexpression of EGFR and the dysregulation of the PI3K/AKT/mTOR signaling pathway. Researchers are now seeing encouraging clinical activity from molecularly targeted approaches to TNBC. With the failure of single agents for targeted therapy, a combined therapeutic strategy, such as the combination of EGFR and mTOR inhibitors, is a reasonable choice for the treatment of TNBC.
In the present study, we first confirmed the expression of EGFR, p-mTOR, p-S6K1, and p-4EBP1 in clinical samples obtained from patients with TNBC with the activation of EGFR–mTOR signaling in the MDA-MB-468 cell line. In 43.8% of the patients with TNBC, EGFR was overexpressed, which is significantly higher than that in the luminal and HER2+ types and is consistent with previous reports.21,22 From the survival analysis, we deduced that the overexpression of EGFR and p-4EBP1 is related to the poor prognosis of TNBC. The results indicated that both EGFR and mTOR play important roles in the development of TNBC and have the potential to be exploited as targets. Similar to other studies,23–25 our work found that combined treatment with gefitinib and everolimus had an additive effect on inhibiting TNBC cell growth, inducing MDA-MB-468 cell apoptosis, and causing cell cycle arrest in the G0/G1 phase. In the combined drug experiment, it must be noted that after exploring the intervention concentration of the single-drug and combined-drug groups, the cell experiment concentration of the EGFR inhibitor gefitinib and the mTOR inhibitor everolimus in the single-drug group reached 10 μM. However, the drug concentration in the combination group was 0.5-μM gefitinib + 0.5-μM everolimus. The drug concentration difference of 20 times between the single-drug group and the combination group revealed similar inhibitory effects on TNBC cells, which indicated that the combination of the two drugs could achieve a similar therapeutic effect with a high-dose single drug in the case of a very low-dose combination. However, the side effects caused by the high and low doses of drugs and the tolerance of patients to those drugs were very different, Therefore, if it can be confirmed in clinical trials, patients can receive the same therapeutic effect as high-dose monotherapy in the case of a low-dose combination, which can greatly reduce the side effects of the drugs. We detected the level of various proteins in the signal pathway of triple negative breast cancer cell lines after the combination of the EGFR inhibitor gefitinib and the mTOR inhibitor everolimus. From the results, we can see that when the EGFR inhibitor gefitinib alone acts on the triple negative breast cancer cell line, compared with the blank control group, the level of EGFR protein has no obvious change. Although there are no statistical differences, the expression of the p-EGFR protein shows a downward trend; The expression of mTOR, p-mTOR and S6K1 decreased significantly compared to the control group. When the mTOR inhibitor everolimus alone acted on the triple negative breast cancer cell line, compared to the blank control group, only the expression of S6K1 decreased statistically, and other proteins did not show a significant decline. The expression of mTOR protein in the single drug everolimus group was significantly higher than that in the single drug gefitinib group, while the p-mTOR protein expression in the single drug everolimus group was significantly higher than that in the gefitinib group after intervention. Although the expression of the p-mTOR protein in the two single drug groups was lower than that in the blank control group, it was the single drug group of gefitinib that had statistical significance, rather than the everolimus group that directly inhibited the mTOR signal pathway, The reason why this indirect inhibitor reduces protein expression while its upstream inhibitor reaches the goal of reducing protein expression may be that the mTOR inhibitor everolimus may not completely inhibit the expression of its downstream protein in triple negative breast cancer cell lines, but its upstream EGFR inhibitor gefitinib can play a positive role in regulation. The results of the detection of the above proteins after the combined action of gefitinib and everolimus showed that the of expression of protein of mTOR, p-mTOR, and S6K1 in the combination group decreased significantly compared to the blank control group, while other proteins did not show a significant decline, which seemed to be complementary to the results of intervention in the single drug group. The expression of these proteins is not completely consistent with our expected results. On the one hand, it may be necessary to increase the number of experimental repetitions or include more cell lines. On the other hand, the abnormal level of these proteins may be precisely the reason why we need to further study the effect of these targeted drugs is not significant.
Although the overexpression of EGFR is widespread in TNBC, monotherapy with EGFR inhibitors barely gives a positive response. It has been proposed that anti-EGFR agents alone inhibit the RAS/MAPK signaling pathway more effectively than the PI3K/AKT/mTOR pathway in TNBC.23–25 At present, there are few cases of targeted drugs used in clinical practice alone except for gefitinib (for non-small cell lung cancer), imatinib (for stromal tumors), and sorafenib (for renal cancer). Based on current domestic and foreign studies on the clinical application of targeted drugs, the effective rate of a single targeted drug on tumors is very limited, at about 10%.26 Targeted therapy has its advantages, such as high selectivity and specificity, but it also has the limitation that its anti-tumor effect is generally mild. It is difficult to achieve a satisfactory therapeutic effect with a single drug in clinical practice. Therefore, the combination of various targeted cell pathway inhibitors may open up new therapeutic means for the treatment of refractory tumors.27,28
Epidermal growth factor receptor is overexpressed in a variety of malignant tumors, and the mTOR signaling pathway is a central link for multiple signaling pathways. As its upstream protein, EGFR plays a regulatory role in the mTOR signaling pathway. Several preclinical studies have been conducted abroad on the combined use of EGFR and mTOR pathway inhibitors, such as in non-small cell lung cancer, brain glioma, pancreatic cancer, biliary tract cancer, and breast cancer. However, to date, the combined application of EGFR and mTOR inhibitors remains at the preclinical study stage, and there is no clinical combination. Therefore, future researchers must find the mechanism of and evidence for improving the efficacy of combined EGFR and mTOR inhibitors. Our study confirmed that mTOR downstream signaling proteins are highly activated in TNBC, indicating that combined mTOR inhibitors can sensitize TNBC to EGFR inhibitors.
In mTOR, there are two structurally and functionally distinct multiprotein complexes: TORC1 and TORC2. Its phosphorylation-activated downstream proteins are involved in cancer development. In our study, the mTOR signaling proteins were phosphorylated by EGF stimulation, and nearly all signaling proteins were de-phosphorylated after treatment with EGFR and mTOR inhibitors. This could be one of the mechanisms for inhibiting TNBC cell growth using two inhibitors.
Relevant studies on EGFR and mTOR inhibitors, such as You KS,29 El Guerrab A,22 etc., have adopted the combined effect of EGFR and mTOR inhibitors on different triple negative breast TNBC adenocarcinoma cell lines, and have drawn some positive conclusions. For example, the former study suggests that targeting the mTOR complex 1 (mTORC1) path may be a potential strategy for the treatment of EGFR resistant, The latter concluded that the dual inhibition of mTOR and EGFR may be an effective treatment for activating PI3K-mutated TNBC. These studies included different cell lines, which is worth learning. Our research is relatively simple, but basically similar to the conclusions of the above research. But there are also differences.
In contrast to the downregulation of p-4EBP1 expression, which was reported in previous studies,23 the expression of p-4EBP1 was significantly increased after individual and combined treatment with gefitinib and everolimus. You KS29 demonstrated that the level of p-4E-BP1 was synergistically decreased by the combination treatment with gefitinib/MK-2206. This raises the question: What is the role of 4EBP1 in mTOR signaling? 4EBP1 is a tumor suppressor. Its inactivation (phosphorylation) may be involved in the development of some tumors and may induce epithelial–mesenchymal transition and the migration and invasion of cancer cells.24,25,30 Therefore, the expression of p-4EBP1 in tumor cells may indicate its carcinogenic potential. Phosphorylated 4EBP1 is generally considered a marker of activated mTOR signaling. Recently, several kinases were found to phosphorylate 4EBP1 in an mTOR-dependent or independent manner, indicating that mTOR may not be the only kinase that phosphorylates 4EBP1.31 The resistance of mTOR inhibitors is related to their inability to block 4EBP1 phosphorylation in some cancers.32–40 Together with the findings and related research, we deduced the 4EBP1 might be phosphorylated by alternative kinases and not influenced by p-mTOR. The possible existence of a novel activation mechanism for 4EBP1 deserves further study.
Conclusions
In conclusion, we found that the EGFR and mTOR pathways are both active and co-expressed in a significant proportion of patients with TNBC. Treatment with a combination of EGFR and mTOR inhibitors showed an additive tumor inhibitory effect, which might be mediated by the regulation of mTOR downstream protein phosphorylation. Our study indicated that the dual inhibition of mTOR and EGFR could be a promising approach for treating TNBC.
Funding
This study was supported by Natural Science Foundation of Xinjiang Uygur Autonomous Region (NO.2018D01C252).
Disclosure
The authors declare no conflict of interest.
References
1. Bray F, Ferlay J, Soerjomataram I, Siegel RL, Torre LA, Jemal A. Global cancer statistics 2018: GLOBOCAN estimates of incidence and mortality worldwide for 36 cancers in 185 countries. CA Cancer J Clin. 2018;68(6):394–424. doi:10.3322/caac.21492
2. Turashvili G, Brogi E. Tumor heterogeneity in breast cancer. Front Med. 2017;4:227. doi:10.3389/fmed.2017.00227
3. Dent R, Trudeau M, Pritchard KI, Hanna WM, Kahn HK, Sawka CA. Triple-negative breast cancer: clinical features and patterns of recurrence. Clin Cancer Res. 2007;13(15 Pt 1):4429–4434. doi:10.1158/1078-0432.CCR-06-3045
4. Collignon J, Lousberg L, Schroeder H, Jerusalem G. Triple negative breast cancer: treatment challenges and solutions. Breast Cancer. 2016;8:93–107. doi:10.2147/BCTT.S69488
5. Mirzania M. Approach to the triple negative breast cancer in new drugs area. Int J Hematol Oncol Stem Cell Res. 2016;10:115–119.
6. Liedtke C, Mazouni C, Hess KR, et al. Response to neoadjuvant therapy and long-term survival in patients with triple-negative breast cancer. J Clin Oncol. 2008;26:1275–1281. doi:10.1200/JCO.2007.14.4147
7. Carpenter G, Cohen S. Epidermal growth factor. Annu Rev Biochem. 1979;48:193–216. doi:10.1146/annurev.bi.48.070179.001205
8. Gullick WJ, Marsden JJ, Whittle N, Ward B, Bobrow L, Waterfield MD. Expression of epidermal growth factor receptors on human cervical, ovarian, and vulval carcinomas. Cancer Res. 1986;46(1):285–292.
9. Shao Q, Zhu W. Ligand binding effects on the activation of the EGFR extracellular domain. Phys Chem Chem Phys. 2019;21(15):8141–8151. doi:10.1039/C8CP07496H
10. Shukuya T, Takahashi T, Kaira R, et al. Efficacy of gefitinib for non-adenocarcinoma non-small-cell lung cancer patients harboring epidermal growth factor receptor mutations: a pooled analysis of published reports. Cancer Sci. 2011;102:1032–1037. doi:10.1111/j.1349-7006.2011.01887.x
11. Harandi A, Zaidi AS, Stocker AM, et al. Clinical efficacy and toxicity of anti-EGFR therapy in common cancers. J Oncol. 2009;2009:567486. doi:10.1155/2009/567486
12. Lynch TJ, Bell DW, Sordella R, et al. Activating mutations in the epidermal growth factor receptor underlying responsiveness of non-small-cell lung cancer to gefitinib. N Engl J Med. 2004;350:2129–2139. doi:10.1056/NEJMoa040938
13. Costa RLB, Han HS, Gradishar WJ. Targeting the PI3K/AKT/mTOR pathway in triple-negative breast cancer: a review. Breast Cancer Res Treat. 2018;169(3):397–406. doi:10.1007/s10549-018-4697-y
14. Gonzalez-Conchas GA, Rodriguez-Romo L, Hernandez-Barajas D, et al. Epidermal growth factor receptor overexpression and outcomes in early breast cancer: a systematic review and a meta-analysis. Cancer Treat Rev. 2018;62:1–8. doi:10.1016/j.ctrv.2017.10.008
15. Al-Mahmood S, Sapiezynski J, Garbuzenko OB, Minko T. Metastatic and triple-negative breast cancer: challenges and treatment options. Drug Deliv Transl Res. 2018;8:1483–1507. doi:10.1007/s13346-018-0551-3
16. Baselga J, Albanell J, Ruiz A, et al. Phase II and tumor pharmacodynamic study of gefitinib in patients with advanced breast cancer. J Clin Oncol. 2005;23:5323–5333. doi:10.1200/JCO.2005.08.326
17. Laplante M, Sabatini DM. mTOR signaling in growth control and disease. Cell. 2012;149:274–293. doi:10.1016/j.cell.2012.03.017
18. O’Regan R, Hawk NN. mTOR inhibition in breast cancer: unraveling the complex mechanisms of mTOR signal transduction and its clinical implications in therapy. Expert Opin Ther Targets. 2011;15(7):859–872. doi:10.1517/14728222.2011.575362
19. Liu T, Yacoub R, Taliaferro-Smith LD, et al. Combinatorial effects of lapatinib and rapamycin in triple-negative breast cancer cells. Mol Cancer Ther. 2011;10:1460–1469. doi:10.1158/1535-7163.MCT-10-0925
20. You KS, Yi YW, Cho J, Park JS, Seong YS. Potentiating therapeutic effects of epidermal growth factor receptor inhibition in triple-negative breast cancer. Pharmaceuticals. 2021;14(6):589. doi:10.3390/ph14060589
21. Costa R, Shah AN, Santa-Maria CA, et al. Targeting epidermal growth factor receptor in triple negative breast cancer: new discoveries and practical insights for drug development. Cancer Treat Rev. 2017;53:111–119. doi:10.1016/j.ctrv.2016.12.010
22. El Guerrab A, Bamdad M, Bignon YJ, Penault-Llorca F, Aubel C. Co-targeting EGFR and mTOR with gefitinib and everolimus in triple-negative breast cancer cells. Sci Rep. 2020;10(1):6367. doi:10.1038/s41598-020-63310-2
23. Madden JM, Mueller KL, Bollig-Fischer A, Stemmer P, Mattingly RR, Boerner JL. Abrogating phosphorylation of eIF4B is required for EGFR and mTOR inhibitor synergy in triple-negative breast cancer. Breast Cancer Res Treat. 2014;147(2):283–293. doi:10.1007/s10549-014-3102-8
24. El Guerrab A, Bamdad M, Bignon YJ, Penault-Llorca F, Aubel C. Anti-EGFR monoclonal antibodies enhance sensitivity to DNA-damaging agents in BRCA1-mutated and PTEN-wild-type triple-negative breast cancer cells. Mol Carcinog. 2017;56:1383–1394. doi:10.1002/mc.22596
25. El Guerrab A, Bamdad M, Kwiatkowski F, Bignon YJ, Penault-Llorca F, Aubel C. Anti-EGFR monoclonal antibodies and EGFR tyrosine kinase inhibitors as combination therapy for triple negative breast cancer. Oncotarget. 2016;7(45):73618–73637. doi:10.18632/oncotarget.12037
26. Zhang W, Gordon M, Press OA, et al. Cyclin D1 and epidermal growth factor polymorphisms associated with survival in patients with advanced colorectal cancer treated with cetuximab. Pharmacogenet Genomics. 2006;16:475–483. doi:10.1097/01.fpc.0000220562.67595.a5
27. Bianco R, Garofalo S, Rosa R, et al. Inhibition of mTOR pathway by everolimus cooperates with IGFR inhibitors in human tumours sensitive and resistant to anti-EGFR drugs. Br J Cancer. 2008;98(5):923–930. doi:10.1038/sj.bjc.6604269
28. Herberger B, Berger W, Puhalla H, et al. Simultaneous blockade of the epidermal growth factor receptor/mammalian target of rapamycin pathway by epidermal growth factor receptor inhibitors and rapamycin results in reduced cell growth and survival in biliary tract cancer: cells. Mol Cancer Ther. 2009;8:1547–1556. doi:10.1158/1535-7163.MCT-09-0003
29. You KS, Yi YW, Kwak SJ, Seong YS. Inhibition of RPTOR overcomes resistance to EGFR inhibition in triple-negative breast cancer cells. Int J Oncol. 2018;52(3):828–840. doi:10.3892/ijo.2018.4244
30. Wang Z, Feng X, Molinolo AA, et al. 4E-BP1 is a tumor suppressor protein reactivated by mTOR inhibition in head and neck cancer. Cancer Res. 2019;79(7):1438–1450. doi:10.1158/0008-5472.CAN-18-1220
31. Musa J, Orth MF, Dallmayer M, et al. Eukaryotic initiation factor 4E-binding protein 1 (4E-BP1): a master regulator of mRNA translation involved in tumorigenesis. Oncogene. 2016;35(36):4675–4688. doi:10.1038/onc.2015.515
32. Sekiyama N, Arthanari H, Papadopoulos E, Rodriguez-Mias RA, Wagner G, Léger-Abraham M. Molecular mechanism of the dual activity of 4EGI-1: dissociating eIF4G from eIF4E but stabilizing the binding of unphosphorylated 4E-BP1. Proc Natl Acad Sci U S A. 2015;112(30):E4036–E4045. doi:10.1073/pnas.1512118112
33. Sikalidis AK, Mazor KM, Kang M, Liu H, Stipanuk MH. Total 4EBP1 is elevated in liver of rats in response to low sulfur amino acid intake. J Amino Acids. 2013;2013:864757. doi:10.1155/2013/864757
34. Zhang Y, Zheng XF. mTOR-independent 4E-BP1 phosphorylation is associated with cancer resistance to mTOR kinase inhibitors. Cell Cycle. 2012;11(3):594–603. doi:10.4161/cc.11.3.19096
35. Choo AY, Yoon S-O, Kim SG, Roux PP, Blenis J. Rapamycin differentially inhibits S6Ks and 4E-BP1 to mediate cell-type-specific repression of mRNA translation. Proc Natl Acad Sci USA. 2008;105(45):17414–17419. doi:10.1073/pnas.0809136105
36. Ducker GS, Atreya CE, Simko JP. Incomplete inhibition of phosphorylation of 4E-BP1 as a mechanism of primary resistance to ATP-competitive mTOR inhibitors. Oncogene. 2014;33(12):1590–1600. doi:10.1038/onc.2013.92
37. Mi W, Ye Q, Liu S, She Q-B. AKT inhibition overcomes rapamycin resistance by enhancing the repressive function of PRAS40 on mTORC1/4E-BP1 axis. Oncotarget. 2015;6(16):13962–13977. doi:10.18632/oncotarget.3920
38. Xu XH, Chen YC, Xu YL, et al. Garcinone E blocks autophagy through lysosomal functional destruction in ovarian cancer cells. World J Tradit Chin Med. 2021;7:209–216.
39. Wei MM, Wang SS, Zheng JL, et al. Herbal medicine Teng-Long-bu-zhong-tang inhibits the growth of human RKO colorectal cancer by regulating apoptosis, senescence, and angiogenesis. World J Tradit Chin Med. 2022;8:110–114. doi:10.4103/wjtcm.wjtcm_42_21
40. Rabbani F, Yazdiniapour Z, Ghanadian M, Zolfaghari B, Maleki M, Shafiee F. Cytotoxicity and apoptosis assay of novel cyclomyrsinol diterpenes against breast cancer cell lines. World J Tradit Chin Med. 2022;8:273–277. doi:10.4103/wjtcm.wjtcm_6_21
 © 2023 The Author(s). This work is published and licensed by Dove Medical Press Limited. The full terms of this license are available at https://www.dovepress.com/terms.php and incorporate the Creative Commons Attribution - Non Commercial (unported, v3.0) License.
By accessing the work you hereby accept the Terms. Non-commercial uses of the work are permitted without any further permission from Dove Medical Press Limited, provided the work is properly attributed. For permission for commercial use of this work, please see paragraphs 4.2 and 5 of our Terms.
© 2023 The Author(s). This work is published and licensed by Dove Medical Press Limited. The full terms of this license are available at https://www.dovepress.com/terms.php and incorporate the Creative Commons Attribution - Non Commercial (unported, v3.0) License.
By accessing the work you hereby accept the Terms. Non-commercial uses of the work are permitted without any further permission from Dove Medical Press Limited, provided the work is properly attributed. For permission for commercial use of this work, please see paragraphs 4.2 and 5 of our Terms.