")
Back to Journals » Diabetes, Metabolic Syndrome and Obesity » Volume 13
Dual SGLT1/SGLT2 Inhibitor Phlorizin Ameliorates Non-Alcoholic Fatty Liver Disease and Hepatic Glucose Production in Type 2 Diabetic Mice
Authors David-Silva A, Esteves JV , Morais MRPT , Freitas HS , Zorn TM, Correa-Giannella ML, Machado UF
Received 16 December 2019
Accepted for publication 29 February 2020
Published 17 March 2020 Volume 2020:13 Pages 739—751
DOI https://doi.org/10.2147/DMSO.S242282
Checked for plagiarism Yes
Review by Single anonymous peer review
Peer reviewer comments 4
Editor who approved publication: Prof. Dr. Antonio Brunetti
Aline David-Silva,1 João Victor Esteves,1 Mychel Raony PT Morais,2 Helayne Soares Freitas,1 Telma Maria Zorn,2 Maria Lucia Correa-Giannella,3 Ubiratan Fabres Machado1
1Department of Physiology and Biophysics, Institute of Biomedical Sciences, University of São Paulo, São Paulo, Brazil; 2Department of Cell and Developmental Biology, Institute of Biomedical Sciences, University of São Paulo, São Paulo, Brazil; 3Laboratório de Carboidratos e Radioimunoensaio, LIM-18, Hospital das Clinicas HCFMUSP, Faculdade de Medicina da Universidade de Sao Paulo, Sao Paulo, Brazil
Correspondence: Ubiratan Fabres Machado
Department of Physiology and Biophysics, Institute of Biomedical Sciences, University of São Paulo, Av. Prof. Lineu Prestes 1524, São Paulo, SP 05508-900, Brazil
Tel +55 11 30917494
Email [email protected]
Purpose: NAFLD is a hepatic component of type 2 diabetes mellitus (T2D), in which impaired hepatic glucose production plays an important role. Inhibitors of sodium glucose transporter 2 (SGLT2) reduce glycemia and exert beneficial effects on diabetic complications. Recently, dual SGLT1/2 inhibition has been proposed to be more effective in reducing glycemia. We hypothesized that improving hepatic glucose metabolism induced by SGLT1/2 inhibition could be accompanied by beneficial effects on NAFLD progression.
Methods: Glycemic homeostasis, hepatic glucose production and NAFLD features were investigated in obese T2D mice, treated with SGLT1/2 inhibitor phlorizin for 1 week.
Results: T2D increased glycemia; insulinemia; hepatic expression of phosphoenolpyruvate carboxykinase (PEPCK), glucose-6-phosphatase (G6Pase) and glucose transporter 2 (Slc2a2 gene); hepatocyte nuclear factors 1A/4A/3B-binding activity in Slc2a2; endogenous glucose production; liver weight, plasma transaminase concentration as well as hepatic inflammation markers, and induced histological signals of non-alcoholic steatohepatitis (NASH, according to NASH-CRN Pathology Committee System). Phlorizin treatment restored all these parameters (mean NASH score reduced from 5.25 to 2.75 P< 0.001); however, plasma transaminase concentration was partially reverted and some hepatic inflammation markers remained unaltered.
Conclusion: NAFLD accompanies altered hepatic glucose metabolism in T2D mice and that greatly ameliorated through short-term treatment with the dual SGLT1/2 inhibitor. This suggests that altered hepatic glucose metabolism participates in T2D-related NAFLD and highlights the pharmacological inhibition of SGLTs as a useful approach not only for controlling glycemia but also for mitigating development and/or progression of NAFLD.
Keywords: GLUT2, PEPCK, G6Pase, phlorizin, NASH
Introduction
Non-alcoholic fatty liver disease (NAFLD) is the most prevalent chronic liver disease in Western countries.1–3 NAFLD exhibits a spread pathophysiological spectrum, and the onset of inflammation characterizes the non-alcoholic steatohepatitis (NASH), which may progress to cirrhosis and hepatocellular carcinoma.2,4-6
NAFLD is the result of a multi-factorial process, and insulin resistance has been proposed to play a major role in hepatocyte fat accumulation.3 NAFLD is still underdiagnosed, since liver biopsy and histopathological analysis are required.7 However, improvements in image analysis systems are facilitating non-invasive diagnostic methods.8 Besides, metabolomics is a new tool that can contribute to diagnosing the disease and understanding its pathophysiology.5 Although disorders in lipid metabolism play an important role in NAFLD development, alterations in the metabolism of amino acids and carbohydrates have also been related to the disease; however, the only glucose metabolism marker that has been related to NAFLD is blood glucose concentration.5 Thus, insulin resistance and altered glycemic homeostasis have been associated to NAFLD, which is considered as the hepatic component of obesity-related metabolic syndrome and type 2 diabetes mellitus (T2D),8,9 conditions characterized by impaired glucose metabolism.
Hepatocytes play a fundamental role in glycemic homeostasis by promoting glucose influxes to and effluxes from these cells, depending on the fed state and hormonal regulation.10 For that, glucose transporter 2 (GLUT2, codified by Slc2a2 gene) and enzymes gluconeogenic phosphoenolpyruvate carboxykinase (PEPCK, codified by Pck1 gene) and glucose-6-phosphatase (G6Pase, codified by G6pc gene) exert a key role.10 Under insulin-resistant conditions, increased hepatic glucose output is expected, compromising hepatocyte homeostasis and glycemic control.11 However, associations of these disorders with NAFLD have not been clearly demonstrated yet.
In the kidney, glucose reabsorption is mainly performed by a sodium-glucose cotransporter 2 (SGLT2, codified by Slc5a2 gene), and a residual tubular glucose amount is removed by SGLT1 (codified by Slc5a1 gene).12 When glucose filtration rate increases, there is an increase in SGLT2/SGLT1-mediated reabsorption, but these cotransporters saturate, and glycosuria becomes evident.11 For decades, the capacity of phlorizin to inhibit SGLT1/SGLT2 activity inspired researchers to develop a drug that could be administered orally, thus contributing to the diabetes mellitus pharmacopeia.13 Firstly, these inhibitors were selectively designed to inhibit only SGLT2, but the limited benefits of these drugs stimulated the development of the dual SGLT1/2 inhibitors.13 Nowadays, these inhibitors are considered capable of not only reducing glycemia, but also exerting beneficial effects on the cardiovascular and renal damages induced by T2D.13 Additionally, several SGLT2 inhibitors have been proposed to exert beneficial effects upon NAFLD, in both animal models14–19 and humans20 with T2D. However, the mechanisms involved in these effects and their possible association with hepatocyte glucose homeostasis are unclear. Besides, effects of the dual SGLT1/2 inhibition in NAFLD have never been investigated.
Once insulin resistance and T2D contribute to the development and/or progression of NAFLD, we hypothesized that an improvement in glycemic homeostasis and in hepatocyte glucose metabolism induced by SGLT1/2 inhibition could determine beneficial effects on NAFLD progression.
Methods
Animals and Treatments
Obese T2D animals were obtained by neonatal subcutaneous injection of monosodium glutamate (MSG) in male offspring of CD1 mice, during the first 5 days of life (2 mg/g body weight/day), as previously described.21 Animals were weaned at 3 weeks and studied at 16 or 17 weeks of life, according to the protocol.
Protocol one: Four-week-old MSG mice were allowed to take standard-diet (T2D) or a high-fat diet (HF-T2D), containing 7% or 35.2% of fat (in terms of g), respectively (Pragsoluções Biociências, Jaú, SP, Brazil). Analyses were performed 12 weeks later (16-week-old mice) when the animals were obese and had developed T2D.
Protocol two: Standard-diet-fed 16-week-old MSG mice (T2D) were treated or untreated with subcutaneous injections of 0.4 g/kg body weight of phlorizin (CDS000104, Sigma Chemical Co, USA, solution at 0.4 g/mL of propylene glycol) twice a day for 6 days (Phl-T2D).22
For both protocols, control mice were age-matched, not injected with MSG and fed with standard diet. Experimental procedures were performed in anaesthetized animals (60 mg/kg body weight of sodium pentobarbital, intraperitoneally) from 8:00 to 10:00 a.m., preceded by 4 hrs of food deprivation. Lee´s index was used to estimate the obesity degree [body weight (g)1/3/naso-anal length (cm) × 100]. Liver was sampled and stored at −70°C for molecular analysis or immediately processed for histological analysis. Blood was collected by cardiac puncture and plasma was stored for further analyses. All experimental procedures were approved by the Ethical Committee for Animal Research of the Institute of Biomedical Sciences, University of São Paulo (#082/sheet 105 of book 2), in accordance with the Brazilian College for Animal Experimentation and the ARRIVE (Animal Research: Reporting of In Vivo Experiments) guidelines.
Insulin Tolerance Test (ITT)
ITT was performed in 4 hr food-deprived mice at 10:00 a.m., under non-anesthetized conditions. Tail blood was collected at 0 (basal), 5, 10, 20, 30 and 50 min after intraperitoneal injection of regular insulin (0.75 U/kg body weight, Humulin R, Eli Lilly and Co. Indianapolis, USA). Insulin sensitivity was determined by the glucose disappearance constant (kITT), based on the linear regression of the Napierian logarithm of blood glucose concentration during the test.21
Piruvate Tolerance Test (PTT)
PTT was performed in 12 hr food-deprived mice at 8:00 a.m.21 Anesthetized animals were injected with pyruvate solution (0.25 g/mL), at a dose of 2 g/kg body weight, intraperitoneally. Glycemia was measured in tail blood at 0 (basal), 10, 20, 30, 40, 60, 90 and 120 min after pyruvate injection. The area under the curve of glycemia was calculated by using GraphPad Prism version 5.01 (GraphPad Software, San Diego, CA, USA), and represents the hepatic glucose production.21
Liver Glycogen Content
The glycogen content was measured as previously described.23
Blood Analyses
Blood glucose was measured by a glucometer (ACCU-CHEK®, Roche, Basel). Plasma concentrations of glucose, triglycerides, aspartate aminotransferase (AST), and alanine aminotransferase (ALT) were determined by colorimetric assay (Labtest Diagnóstica SA, Lagoa Santa, MG, Brasil, and Laborlab, Guarulhos SP, Brasil). Plasma insulin concentration was assessed by ELISA (EMD Millipore Co, MO, USA).
Western Blotting Analyses
Target proteins were analyzed in liver samples by Western blotting as previously described21,22,24 and using anti-GLUT2 (#07-1402, EMD Millipore), anti-G6Pase (ab-83690, Santa Cruz Biotechnology), anti-PEPCK (ab-28455, Santa Cruz Biotechnology) and anti-ACTB (A2228, Sigma Aldrich) antibodies. The blots intensity was quantified by densitometry, and results were normalized by the respective ACTB values, considering the mean of control values as one.
Reverse Transcription and Quantitative Polymerase Chain Reaction (RT-qPCR)
RT-qPCR was performed in liver samples as previously described.21,23 After checking gene stability, glyceraldehyde-3-phosphate dehydrogenase (Gapdh) was chosen as the reference gene. Following the RT, the quantitative (q) PCR amplification was performed using the TaqMan® PCR master mix kit (Applied Biosystems, ThermoFisher Scientific, USA), and carried out in a StepOne Plus Instrument (Applied Biosystems Inc., CA, USA). The method of 2–ΔΔCt was adopted for analysis. Identification of the TaqMan® assays is presented in Supplementary Table 1.
Electrophoretic Mobility Shift Assay (EMSA)
EMSA was performed in liver samples as previously described.24,25 Briefly, double-stranded oligonucleotides containing the binding site of the investigated transcription factors in the Slc2a2 promoter gene were end-labeled with T4 polynucleotide kinase (Invitrogen, Carlsbad, CA, USA) and γ−32P ATP (PerkinElmer Life, Waltham, MA, USA). Nuclear proteins were incubated with the labeled oligonucleotide probe in a buffer, for 20 min at room temperature. DNA/protein complexes were electrophoresed on 4% non-denaturing polyacrylamide gel at 4°C. The gel was dried and exposed to a hyperfilm (Amersham Hyperfilm ECL, GE Healthcare Life Sciences) for 2 to 3 days at −80°C. The blots were analyzed by scanner densitometry (ImageScanner III, GE Healthcare, Sweden). Results were expressed as arbitrary units, relative to the mean value of the controls which was set as one. Competition binding experiments were performed by adding 10- to 100-fold molar excess of unlabeled oligonucleotides. Specificity of the transcription factors was checked by incubation with the specific antibodies. Oligonucleotides and antibodies are described in the Supplementary Table 2.
Histological Analysis of Liver
Liver samples were fixed in paraformaldehyde and 5 μm slices were stained with hematoxylin and eosin for analysis in light microscopy. The analyses were performed on 10 random fields, captured at 20x magnification, using an optical microscope equipped with a digital camera Olympus DP72 (Olympus, Rungis, France). Evaluation of NAFLD was performed based on the NASH-CRN Pathology Committee System,26 as detailed in Supplementary Table 3. The range of total scores varies from zero to 8 and indicates 0–2, absence of NAFLD; 3 and 4, probable presence of NAFLD, ≥5 clear presence of NAFLD.
Names of Genes and Proteins
Names and acronyms of genes and proteins used throughout the manuscript are according to the HGNC and Uniprot databases, respectively.
Statistical Analyses
Data were expressed as mean ± standard error mean (SEM). Comparison of the means, according to the normality of the data distribution (Kolmogorov–Smirnov test), was performed by one-way analysis of variance (ANOVA), followed by Newman-Keuls post-test, or by Kruskal–Wallis test, followed by Dunn post-test. Comparisons were considered statistically significant at p<0.05. Analyses were performed using GraphPad Prism version 7.04 (GraphPad Software Inc., San Diego, USA).
Results
MSG Induces T2D in Mice Regardless of High-Fat Diet
With protocol one, we analyzed the effects of the neonatal MSG treatment (T2D) and the effects of 12-week-treatment of MSG mice with high-fat-diet (HF-T2D) (Table 1). The T2D-mice became obese as observed by the high body weight mass, peri epididymal adipose tissue and Lee’s index value; high-fat-diet exacerbated the degree of obesity. As expected for MSG-mice, food intake was decreased, both in g per day and in kcal per day, while high-fat-diet decreased food intake in g per day, but increased it in terms of kcal per day, because of the high energy density of the diet.
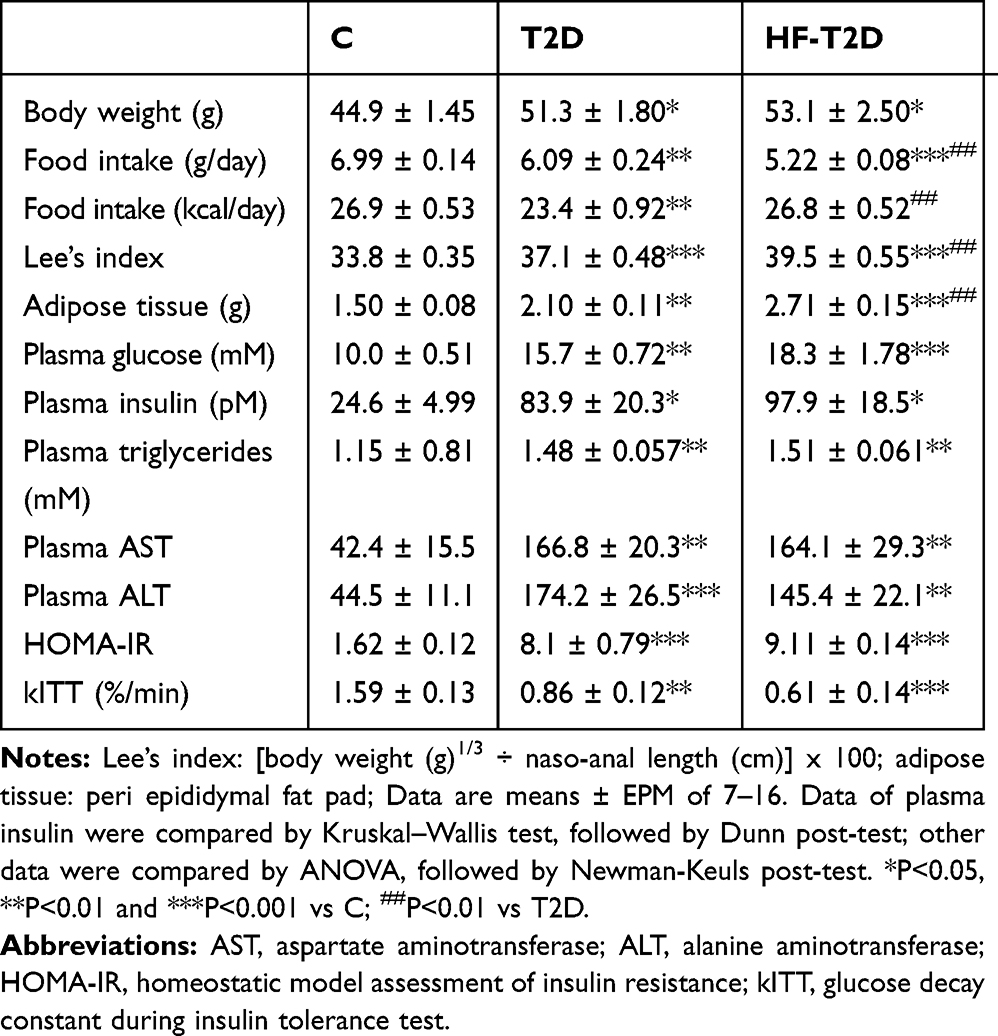 |
Table 1 General Characteristics of Control (C), Obese Type 2 Diabetes Mellitus (T2D) and Obese High-Fat-Fed T2D (HF-T2D) Mice |
Despite the different obesity degrees, both T2D and HF-T2D mice showed similar metabolic-hormonal alterations (Table 1), such as significant increases in plasma glucose, insulin and triglycerides. Furthermore, T2D and HF-T2D presented very high indexes of HOMA-IR and decreased indexes of glucose decay during insulin tolerance test (kITT), clearly revealing their insulin-resistant state. Increased plasma concentrations of the hepatic enzymes AST and ALT were also observed in both T2D mice, indicating some grade of liver injury.
T2D Increases Expression of Hepatic Glucose Production Markers
Figure 1A shows that, regardless of the diet, T2D mice presented higher Slc2a2 (70% and 80%), Pck1 (170%) and G6pc (112% and 140%) mRNA contents (P<0.01 to P<0.001). Similarly, the respective proteins (Figure 1B and C) also increased (P<0.05 to 0.01), although the magnitude of the increase is slightly smaller, suggesting some posttranscriptional regulation. Additionally, disturbed glucose metabolism was revealed by the 240% and 270% increase (P<0.001) in hepatic glycogen content observed in T2D and HF-T2D mice, respectively (Figure 1D).
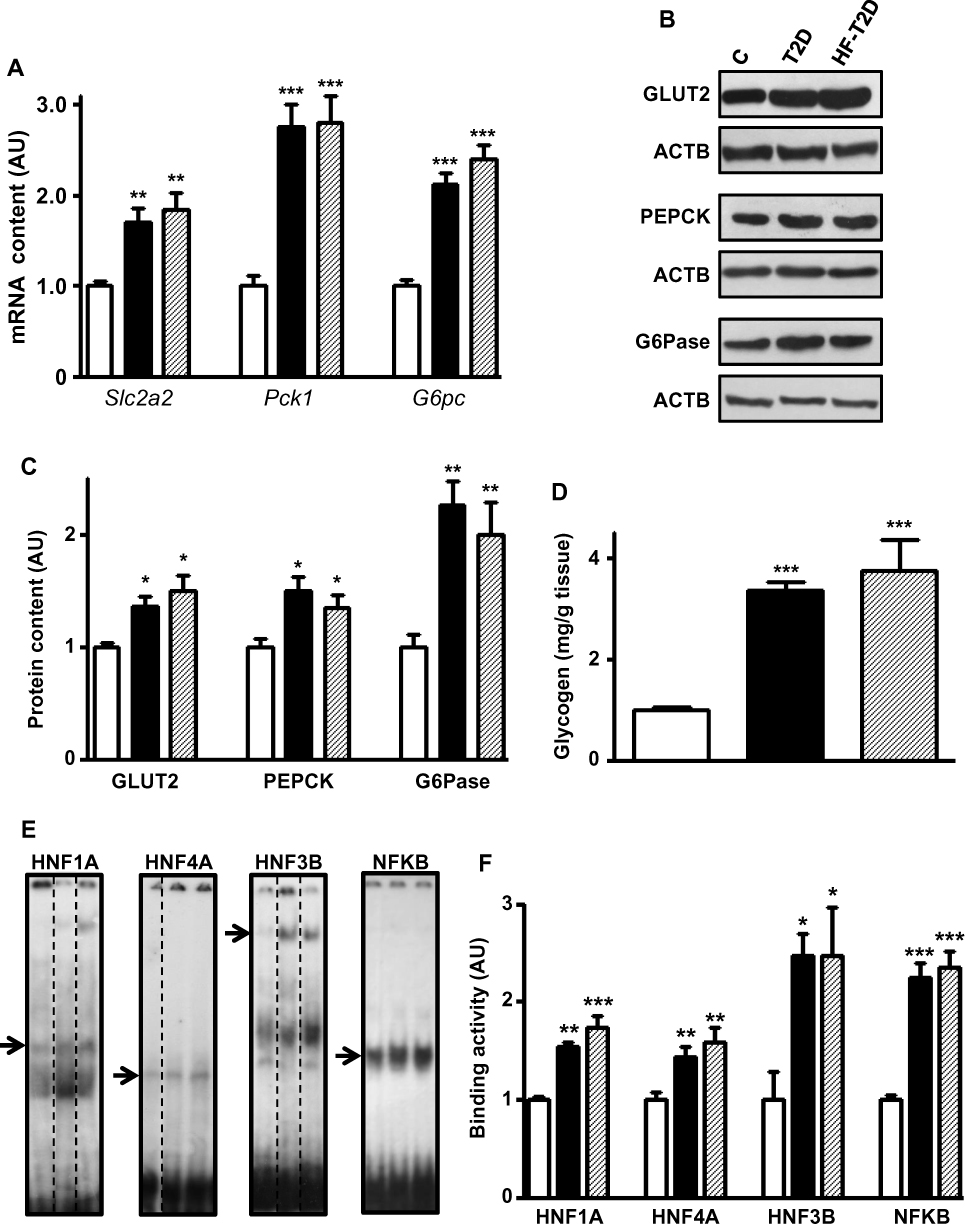 |
Figure 1 Type 2 diabetes (T2D) effects upon hepatic glucose production markers. Liver samples from control (C, white bars), type 2 diabetic (T2D, black bars) and high-fat-fed T2D (HF-T2D, dashed bars) mice were analyzed. (A), Slc2a2, Pck1 and G6pc mRNA; (B and C) GLUT2, PEPCK and G6Pase protein; (D) glycogen content; (E and F) HNF1A, HNF4A, HNF3B and NFKB binding activity in the Slc2a2 gene promoter. DNA/protein biding activity was evaluated by electrophoretic mobility shift assay (EMSA). In (E), dashed lines indicate that the lanes were not contiguously placed in the gel; for each transcription factor, the sequence of the lanes corresponds to the sequence of the results shown in the graphs; the arrows indicate the target protein/DNA complex. Data are expressed as mean ± SEM of 14 (GLUT2), 4 (EMSA for NFKB) or 5 to 10 animals (other results), and were analyzed by Kruskal–Wallis followed by the Dun post-test (Slc2a2 mRNA and GLUT2) or one-way ANOVA followed by the Newman-Keuls post-test (other results). *P<0.05, **P<0.01 and ***P<0.001 vs C. |
T2D Increases Transcriptional Activity of HNF1A, HNF3B, HNF4A and NFKB Upon Slc2a2 Gene
To investigate transcriptional mechanisms potentially involved in the regulation of the expression of genes related to glucose hepatic metabolism in T2D, we have chosen Slc2a2 gene, related to the final and limiting step of glucose influx/efflux. Analysis of the transcription factors of Slc2a2 gene revealed that expression of Hnf1a, Hnf4a and Foxa2 mRNAs (Supplementary Figure 1A) as well as Rela mRNA (Figure 2B) increased (P<0.05 to P<0.001) by 70% to 170% in both T2D and HF-T2D mice.
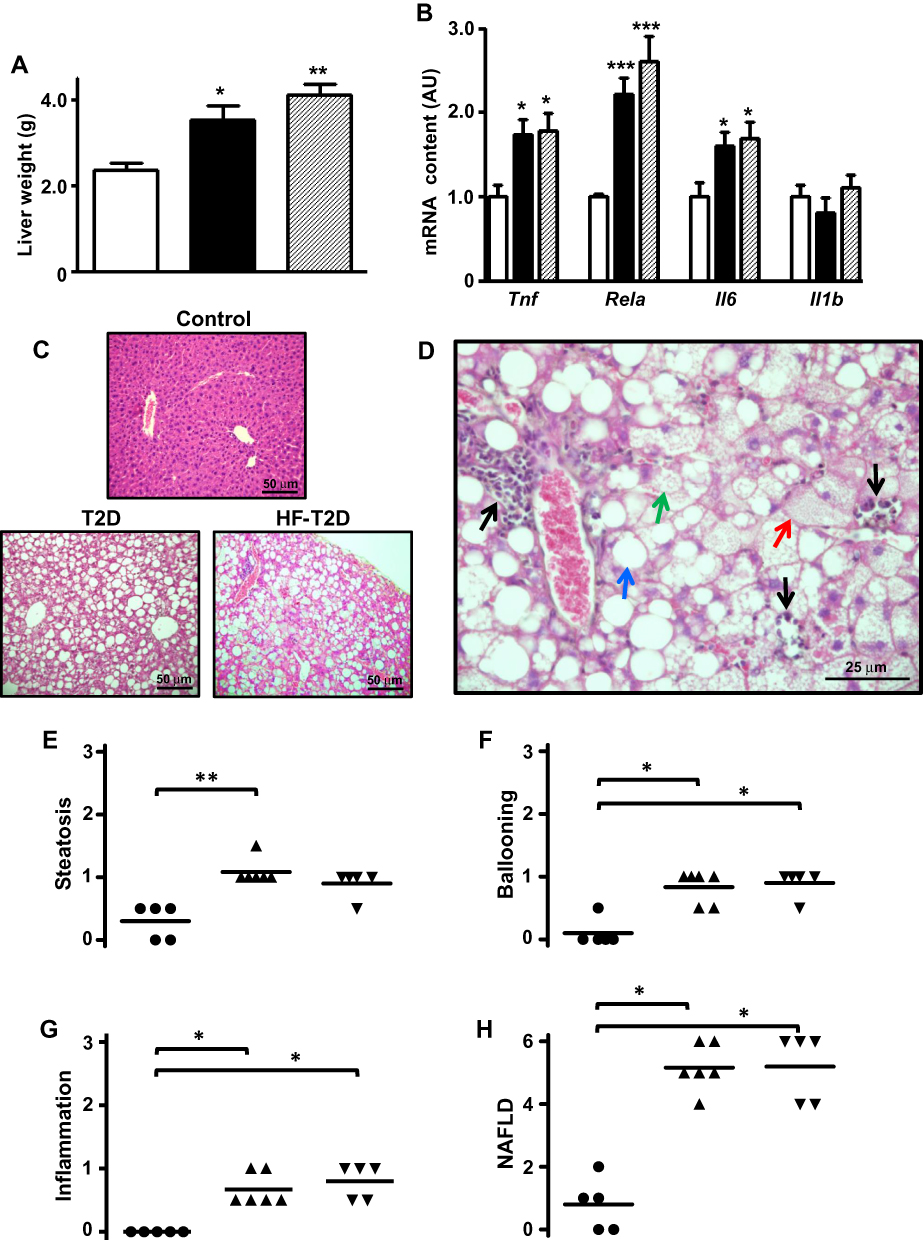 |
Figure 2 Type 2 diabetes (T2D) induces severe NAFLD. Liver from control (C, white bars, circles), type 2 diabetic (T2D, black bars, up triangles) and high-fat-fed T2D (HF-T2D, dashed bars, down triangles) mice were analyzed. (A), liver weight; (B) mRNA expression of inflammatory markers Tnf, Rela, Il6 and Il1b; (C) hematoxylin-eosin stained liver tissue revealing evident steatosis in T2 mice (20X magnification); (D) increased magnification (40X) of hematoxylin-eosin stained liver tissue from T2D mice revealing the presence of micro-steatosis (green arrow), macro-steatosis (red arrow), ballooning (blue arrow) and inflammatory foci (black arrows); (E-G) steatosis, ballooning and inflammation grade; (H) NAFLD score. Data are expressed as mean ± SEM of 10 to 16 (A) or 6 to 8 animals (B). In (E–H), data are the means and the individual values of 5 animals. The means were analyzed by one-way ANOVA followed by the Newman-Keuls post-test (A, B) or Kruskal–Wallis followed by the Dun post-test (E–H). *P<0.05, **P<0.01 and ***P<0.001 vs (C). |
Thus, the binding activity of these transcriptional factors to their specific binding site in the Slc2a2 promoter region was analyzed by EMSA, after confirming the specificity of the nuclear protein binding (Supplementary Figure 2). Figure 1E shows representative images of the specific binding, and Figure 1F shows that the binding activity in the Slc2a2 promoter region increased (P<0.05 to P<0.001) by ~60% (HNF1A and HNF4A) to ~150% (HNF3B and NFKB) in both T2D and HF-T2D mice.
T2D Induces Severe NAFLD in Mice
Increased liver mass was observed in both T2D (50%, P<0.05) and HF-T2D (74%, P<0.01) mice (Figure 2A). Hepatic proinflammatory activity (Figure 2B) is suggested by increased expression of Tnf, Il6 and Rela mRNAs in both T2D and HF-T2D mice (by 70% to 120%, P<0.05 to P<0.001). Histological examination (Figure 2C) revealed extensive hepatic alterations in T2D mice; Figure 2D shows in detail the main features of NAFLD such as micro- and macro-steatosis, hepatocyte ballooning and several extensive inflammatory foci. No signals of fibrosis were observed in liver from T2D mice. Quantification of the NAFLD components is shown in Figure 2E–G. The final mean scores (Figure 2H) for NAFLD in T2D (5.17 ± 0.31) and in HF-T2D (5.2 ± 0.49) were significantly higher (P<0.05) than the mean value of controls (1.0 ± 0.45) and indicated the development of NASH in T2D mice.
Phlorizin Treatment Reverses the Metabolic Derangements of T2D Mice
With protocol two, we analyzed the effects of 6-day phlorizin treatment in standard-fed T2D mice (Table 2). Phlorizin treatment did not alter the obesity degree; however, it reversed hyperglycemia, hyperinsulinemia, hypertriglyceridemia and decreased the HOMA-IR value. Besides, increased plasmatic AST and ALT concentrations were partially reversed (47% and 51% reduction, respectively), though remaining higher than the values observed in control mice (Table 2).
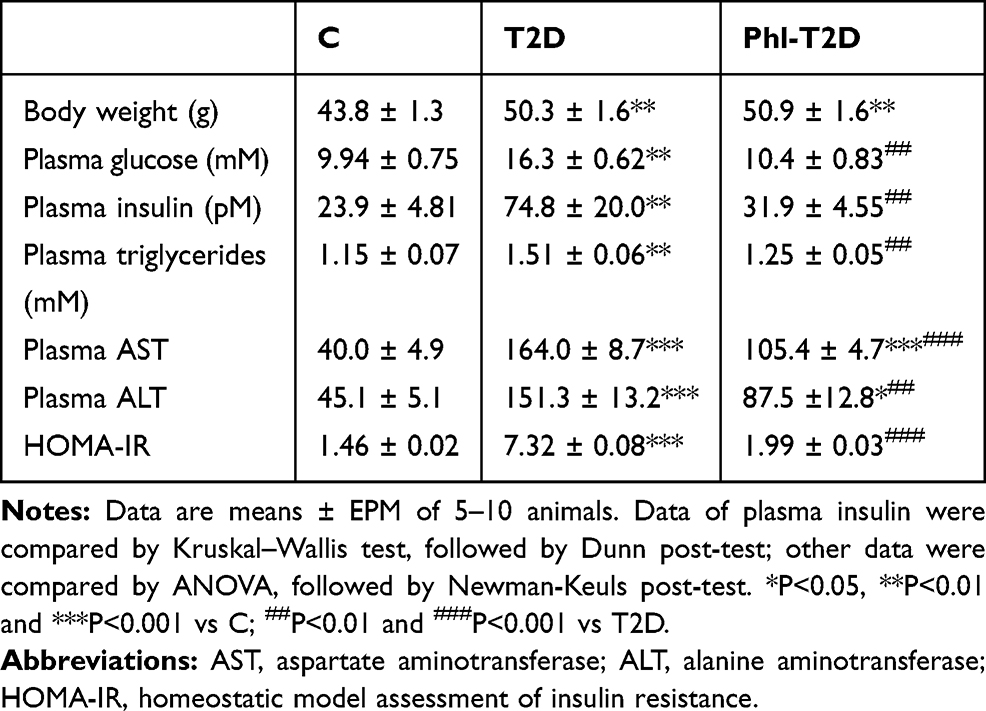 |
Table 2 General Characteristics of Control (C), Obese Type 2 Diabetes Mellitus (T2D) and Phlorizin-Treated T2D (Phl-T2D) Mice |
Phlorizin Treatment Restores Alterations in Hepatic Glucose Production Markers Observed in T2D Mice
Phlorizin treatment of T2D mice reversed the increased hepatic expression of Slc2a2, Pck1 and G6pc mRNA contents (Figure 3B) and their respective proteins GLUT2, PEPCK and G6Pase (Figure 3C and D) (P<0.05 to P<0.001 vs T2D), suggesting a reduction in hepatic glucose production and efflux. The increased hepatic glycogen content observed in T2D was partially restored by phlorizin (Figure 3A).
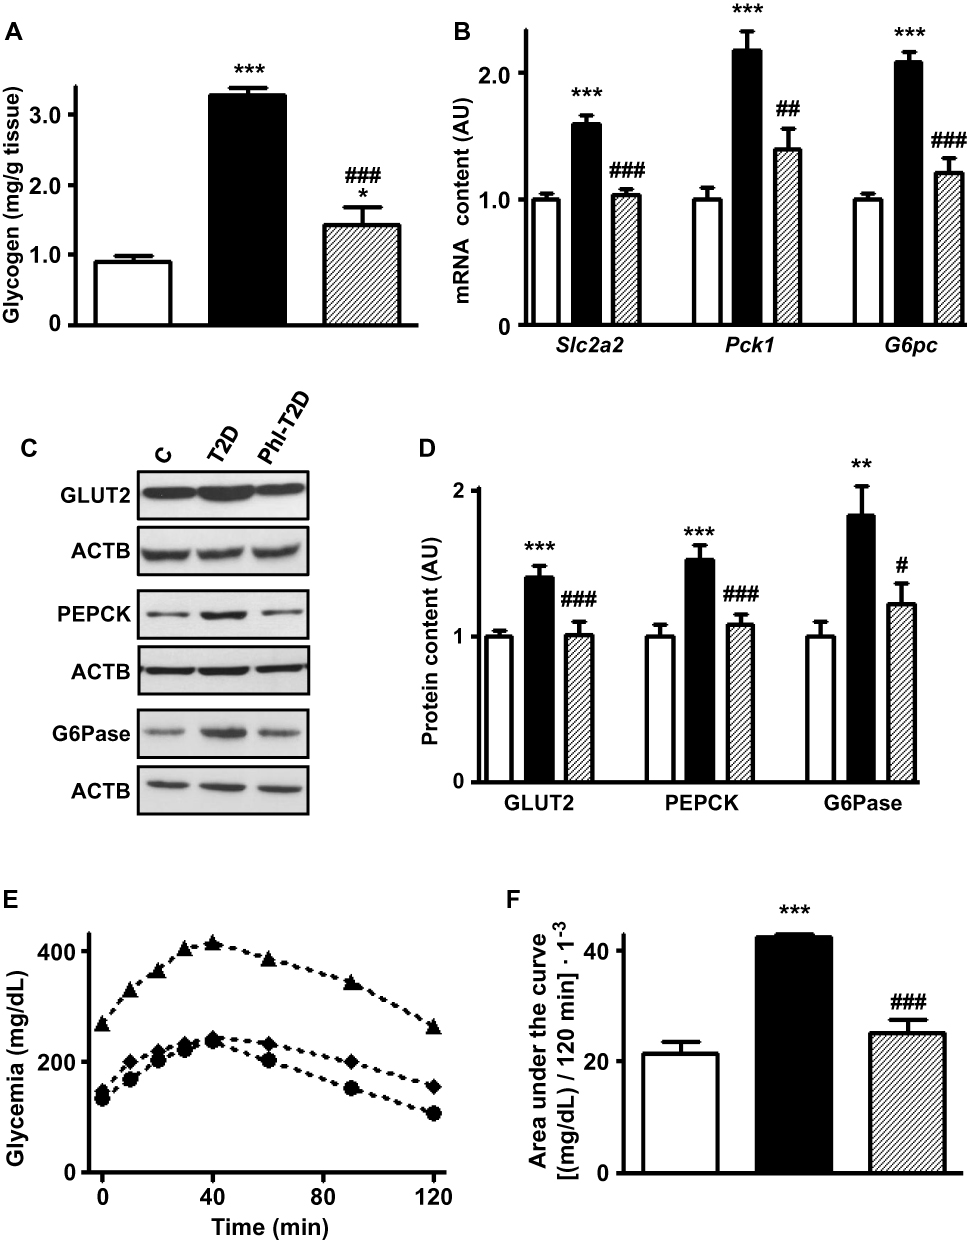 |
Figure 3 Phlorizin treatment restores type 2 diabetes-induced alterations in hepatic glucose production markers. Liver samples from control (C, white bars, circles), type 2 diabetes (T2D, black bars, up triangles) and phlorizin-treated T2D (Phl-T2D, dashed bars, diamonds) mice were analyzed: (A), glycogen content; (B) Slc2a2, Pck1 and G6pc mRNA; (C and D) GLUT2, PEPCK and G6Pase protein; (D) glycogen content; (E and F) hepatic glucose production during the pyruvate tolerance test: (E) zero to 120 min blood glucose concentration; (F) area under the curve of the blood glucose variation during the test. Data are expressed as mean ± SEM of 5 (A), 6 to 7 (B), 6 to 10 (D) or 4 to 5 (E and F) animals. The means were compared by one-way ANOVA followed by the Newman-Keuls post-test. *P<0.05 and ***P<0.001 vs C; ##P<0.01 and ###P<0.001 vs T2D. |
A pyruvate tolerance test (PTT) was performed to confirm the functional role of these markers in hepatic glucose production. In response to the pyruvate injection (Figure 3E), the increase in blood glucose was clearly higher in T2D mice, and that was reversed by phlorizin treatment. The area under the curve of glycemia during the 0 to 120 min of the PTT (Figure 3F) was ~2-fold-increased in T2D mice (P<0.001 vs C), and that was completely restored by phlorizin treatment (P<0.001 vs T2D).
Finally, the analysis of Slc2a2 gene transcription factors revealed that expression of Hnf1a, Hnf4a and Foxa2 mRNAs (Supplementary Figure 1B) as well as Rela mRNA (Figure 4D) decreased (P<0.05 to P<0.001) in Phl-T2D mice as compared to T2D mice. Additionally, the binding activity of transcriptional factors HNF1A, HNF4A, HNF3B and NFKB into the promoter region of Slc2a2 gene (Figure 4A and B), which was increased in T2D, was reversed by phlorizin treatment, explaining the mechanism through which Slc2a2 mRNA was reversed.
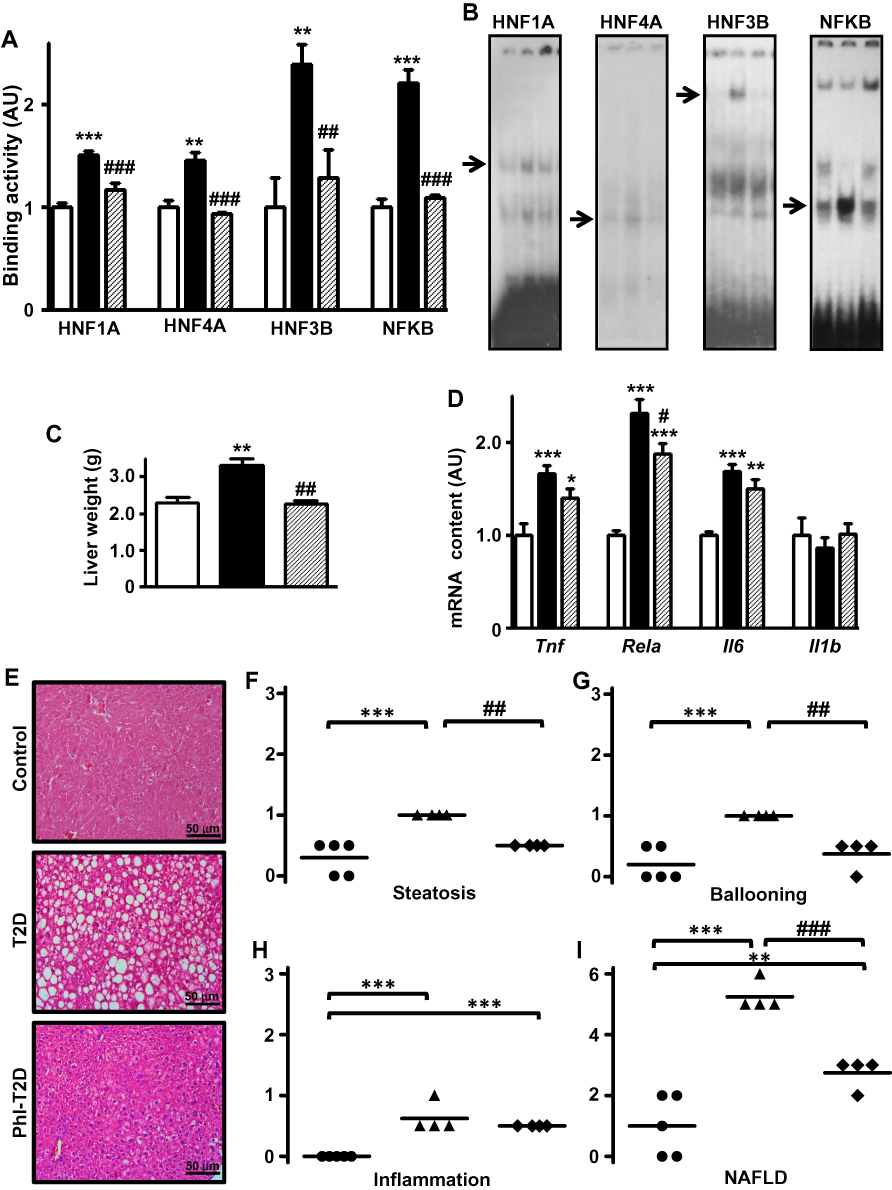 |
Figure 4 Phlorizin treatment ameliorates type 2 diabetes-induced NAFLD. Liver samples from control (C, white bars, circles), type 2 diabetes (T2D, black bars, up triangles) and phlorizin-treated T2D (Phl-T2D, dashed bars, diamonds) mice were analyzed: (A and B) HNF1A, HNF4A, HNF3B and NFKB binding activity in the Slc2a2 gene promoter measured by electrophoretic mobility shift assay (EMSA). In (B), for each transcription factor, the sequence of the lanes corresponds to the sequence of the results shown in the graphs; the arrows indicate the target protein/DNA complex. (C), liver weight; (D) mRNA expression of inflammatory markers (Tnf, Rela, Il6 and Il1b); (E) hematoxylin-eosin stained liver tissue (20X magnification); (F–H) steatosis, ballooning and inflammation grade; (I) NAFLD score. Data are expressed as mean ± SEM of 4 to 7 (A and D) or 5 to 9 (C) animals. In (F–I), data are the means and the individual values of 4 or 5 animals. The means were compared by Kruskal–Wallis, followed by the Dun post-test (HNF4A EMSA and Tnf mRNA) or one-way ANOVA, followed by the Newman-Keuls post-test (other results). *P<0.05, **P<0.01 and ***P<0.001 vs C; #P<0.05, ##P<0.01 and ###P<0.001 vs T2D. |
Phlorizin Treatment Ameliorates NAFLD in T2D Mice
Hepatic mRNA expression (Figure 4D) of inflammatory genes Tnf and Il6 remained unaltered, while Rela mRNA expression decreased in response to phlorizin treatment (P<0.05 vs T2D); however, it remained significantly higher as compared to control mice (87%, P<0.001 vs C).
The increased liver mass presented in T2D mice was reversed by phlorizin treatment (Figure 4C). Histological analysis (Figure 4E) revealed a noticeable amelioration of T2D-induced NAFLD. Hepatic steatosis (Figure 4F) and hepatocyte ballooning (Figure 4G) presented in T2D mice were reversed by phlorizin treatment (P<0.01 vs T2D), but tissue inflammation was not (Figure 4H). The mean NAFLD score (Figure 4I) decreased after phlorizin treatment (from 5.25 to 2.75, P<0.001), indicating an amelioration of NASH, although it remained suggestive of NASH: 3 animals showed score=3 (suggestive of NASH) and one animal showed score=2 (not NASH).
Discussion
The present study investigated the effect of the dual SGLT1/2 inhibitor phlorizin in diabetes-related NAFLD, as well as the possible participation of glucose hepatic metabolism in this process, using the MSG-induced T2D mice model. Half a century ago, the neonatal administration of MSG to mice was described as capable of inducing obesity in adult life.27 Later on, it was demonstrated that adult MSG mice develop insulin resistance with severe hyperglycemia, thus characterizing an obese T2D experimental model.21,28-34 Interestingly, the glycemic impairment occurs concurrently with hyperinsulinemia in T2D MSG-mice,21,29,31,34 a profile not observed in T2D humans, in whom loss of glycemic control appears when plasma insulin concentrations begin to decrease. This difference is a consequence of the high replication capacity of beta cells in young mice in response to increased insulin requirements.35 Furthermore, liver glycogenosis was observed in T2D, indicating that, despite the insulin resistance, hyperglycemia and hyperinsulinemia, together, guarantee increased glycogen storage.36
More recently, it has been reported that MSG-mice might develop NAFLD30,32,33,37 and these animals have been proposed as an useful model for the study of NAFLD.38 However, in these studies, NAFLD has been related to aging32,37 or to a high-fat (HF) diet,30 highlighting that HF-diet is capable of inducing NAFLD per se in C67BL/6J mice, without impairment of glycemic control.39 Because of that, we initially investigated T2D-mice receiving or not a HF-diet, and the results revealed that the HF-diet did not alter the metabolic/hormonal impairment and the liver injury, indicating that the MSG treatment was sufficient to induce T2D and NAFLD/NASH.
The involvement of impaired hepatic lipid metabolism in the development of NAFLD is well known5 and a clear association between NAFLD and insulin resistance in T2D is also well demonstrated, suggesting that altered hepatic glucose metabolism may also be related to NAFLD physiopathology.8,40,41 However, whether insulin resistance is a cause3 or a consequence41 of NAFLD is a great scientific challenge, and probably both hypotheses are true, comprising a vicious circle. Importantly, high intracellular glucose concentration is a powerful inducer of de novo lipogenesis in isolated hepatocytes,42 and that highlights impaired glucose metabolism as an important mechanism in NAFLD pathogenesis. We observed NAFLD/NASH in obese T2D-mice with severely impaired glycemic homeostasis and hepatic glucose metabolism, reinforcing the role of altered hepatic glucose metabolism in the NAFLD pathogenesis of T2D subjects.
In the present study, we reported, for the first time, the impairment of hepatic glucose metabolism in T2D-mice with NAFLD. Altogether, the data demonstrated augmented hepatic glucose production in T2D-mice, a phenomenon in which the increased hepatocyte glucose efflux depends on upregulated GLUT2 expression. Considering that, we investigated molecular mechanisms involved in the transcription of Slc2a2 gene, and we detected increased activity of the Slc2a2 enhancers HNF1A, HNF3B, HNF4A and NFKB. Importantly, these transcriptional factors have also been related to gluconeogenic Pck1 gene, which can be activated by high intracellular glucose concentration.43 Thus, the activation of the transcriptional factors reported here in T2D-mice must be playing a fundamental role not only in the upregulation of GLUT2, guaranteeing increased hepatic outflow, but also in the production of hepatocyte glucose.
The development of SGLT2 inhibitors, as well as dual SGLT1/2 inhibitors, has expanded the pharmacopeia for T2D, not only regarding glycemic control, but also focusing on the prevention and/or treatment of diabetic complications.13 Concerning diabetes-associated liver disease, SGLT2 inhibitors such as ipragliflozin,14,15,18,20 remogliflozin etabonate,17 empagliflozin16 and luseogliflozin19 have been reported to be able to prevent and/or to alleviate the development of NAFLD in several experimental models of NAFLD. Besides, ipragliflozin20 and dapagliflozin44 were also reported to ameliorate steatosis-associated hepatic enzymatic markers in T2D subjects with NAFLD. However, these studies investigated neither the effects of a dual SGLT1/2 inhibitor nor the NAFLD relationship with hepatic glucose metabolism.
We chose to investigate phlorizin due to its dual SGLT1/2-inhibitor effect, and we conducted a 6-day-treatment since this period of time has already been reported as sufficient to reduce the expression of Slc2a2/GLUT2 in liver and kidney of T1D rats.22,24 In the present study, phlorizin treatment reversed the metabolic hormonal characteristics of T2D, as well as the markers of increased hepatic glucose production.
The reduction observed in hepatic glucose production following phlorizin treatment is in contrast with that reported in T2D subjects, in whom empagliflozin45 and dapagliflozin46 increased hepatic glucose production. Such increase has been supposed to be the result of 1) the increased glucagon secretion induced by the SGLT2 inhibition, and 2) the fact that alpha cells could express SGLT1/2 transporters.47 However, experimental conditions cannot be compared: 1) a dual SGLT1/2 inhibitor was used in the present study while selective SGLT2 inhibitors were used in the studies in T2D subjects; 2) the pyruvate tolerance test used here reflects gluconeogenesis activity only, while the radioactive glucose used in the studies with T2D subjects also reflects the glycogenolysis processes, and 3) in those studies, endogenous glucose production was evaluated during an euglycemic hyperinsulinemic clamp46 and after mixed meal ingestion,45 conditions not appropriate for analysis of hepatic glucose production. Besides, an elegant and well conducted study demonstrates, undeniably, that alpha cells neither express SGLTs nor change glucagon secretion in response to SGLTs inhibition, including the dual inhibitor phlorizin used in our study.48
The improvement in glucose metabolism was accompanied by amelioration of NAFLD, as shown by the reversion of steatosis and ballooning, which has been related to the reduction in the expression of hepatic lipogenic enzymes.49 However, the phlorizin-induced recovery of NAFLD was not complete since signals of liver inflammation remained present. However, it is important to highlight that the current treatment was very short (6 days) and we cannot exclude the possibility that a long-term treatment could completely revert liver inflammation.
Interestingly, also in HFD-induced NAFLD, a 4-week treatment with the selective SGLT2 inhibitor remogliflozin did not reverse NAFLD, and a partial reversion was observed only when food intake was restricted.17 These results underline the strong potency of the dual SGLT1/2 inhibitor used in the present study. Furthermore, in rats exposed to a choline-deficient L-amino acid-deficient diet, a model of NAFLD without T2D, ipragliflozin prevented hepatic triglyceride accumulation and fibrosis development, without affecting liver inflammation and plasmatic AST and ALT concentrations.14 These findings suggest that inflammatory activity is the most resistant component of NAFLD.
Conclusions
This study demonstrated, in T2D mice, that increased hepatic glucose production accompanies NASH, suggesting its participation in the T2D-related NAFLD development. Importantly, the study revealed that short-term treatment with the dual SGLT1/2 inhibitor phlorizin restored glycemic control and hepatic glucose metabolism, and greatly ameliorated NASH, reinforcing that altered hepatic glucose metabolism participates in T2D-related NAFLD. The present results highlight that the pharmacological inhibition of SGLTs in subjects with T2D may be a useful approach not only for improving glycemic control but also for mitigating the development and/or progression of NAFLD.
Acknowledgments
The authors are thankful to Dr. Adauri Brezolin for the English revision of the manuscript.
Funding
This research was supported by São Paulo State Foundation for Research (FAPESP) (#2016/15603-0) and by Coordenação de Aperfeiçoamento de Pessoal de Nível Superior – Brasil (CAPES, finance code 001). A.D.-S. was recipient of FAPESP scholarship (#2011/09463-8); J.V.E. was recipient of FAPESP scholarship (#2017/19449-9).
Disclosure
The authors report no conflicts of interest in this work.
References
1. Farrell GC, Larter CZ. Nonalcoholic fatty liver disease: from steatosis to cirrhosis. Hepatology. 2006;43:S99–S112. doi:10.1002/hep.20973
2. Tevar AD, Clarke C, Wang J, et al. Clinical review of nonalcoholic steatohepatitis in liver surgery and transplantation. J Am Coll Surg. 2010;210:515–526. doi:10.1016/j.jamcollsurg.2010.01.020
3. Zafrani ES. Non-alcoholic fatty liver disease: an emerging pathological spectrum. Virchows Arch. 2004;444:3–12. doi:10.1007/s00428-003-0943-7
4. Brunt EM. Pathology of nonalcoholic steatohepatitis. Hepatol Res. 2005;33:68–71. doi:10.1016/j.hepres.2005.09.006
5. Safaei A, Arefi Oskouie A, Mohebbi SR, et al. Metabolomic analysis of human cirrhosis, hepatocellular carcinoma, non-alcoholic fatty liver disease and non-alcoholic steatohepatitis diseases. Gastroenterol Hepatol Bed Bench. 2016;9:158–173.
6. Powell EE, Cooksley WG, Hanson R, Searle J, Halliday JW, Powell LW. The natural history of nonalcoholic steatohepatitis: a follow-up study of forty-two patients for up to 21 years. Hepatology. 1990;11:74–80. doi:10.1002/hep.1840110114
7. Wieckowska A, McCullough AJ, Feldstein AE. Noninvasive diagnosis and monitoring of nonalcoholic steatohepatitis: present and future. Hepatology. 2007;46:582–589. doi:10.1002/hep.21768
8. Firneisz G. Non-alcoholic fatty liver disease and type 2 diabetes mellitus: the liver disease of our age? World J Gastroenterol. 2014;20:9072–9089. doi:10.3748/wjg.v20.i27.9072
9. Chitturi S, Abeygunasekera S, Farrell GC, et al. NASH and insulin resistance: insulin hypersecretion and specific association with the insulin resistance syndrome. Hepatology. 2002;35:373–379. doi:10.1053/jhep.2002.30692
10. Thorens B. GLUT2, glucose sensing and glucose homeostasis. Diabetologia. 2015;58(2):221–232. doi:10.1007/s00125-014-3451-1
11. De Fronzo RA. Pathogenesis of type 2 diabetes mellitus. Med Clin North Am. 2004;88:787–835. doi:10.1016/j.mcna.2004.04.013
12. DeFronzo RA, Davidson JA, Del Prato S. The role of the kidneys in glucose homeostasis: a new path towards normalizing glycaemia. Diabetes Obes Metab. 2012;14:5–14. doi:10.1111/j.1463-1326.2011.01511.x
13. Rieg T, Vallon V. Development of SGLT1 and SGLT2 inhibitors. Diabetologia. 2018;61:2079–2086. doi:10.1007/s00125-018-4654-7
14. Hayashizaki-Someya Y, Kurosaki E, Takasu T, et al. Ipragliflozin, an SGLT2 inhibitor, exhibits a prophylactic effect on hepatic steatosis and fibrosis induced by choline-deficient l-amino acid-defined diet in rats. Eur J Pharmacol. 2015;754:19–24. doi:10.1016/j.ejphar.2015.02.009
15. Honda Y, Imajo K, Kato T, et al. The selective SGLT2 inhibitor ipragliflozin has a therapeutic effect on nonalcoholic steatohepatitis in mice. PLoS One. 2016;11:e0146337. doi:10.1371/journal.pone.0146337
16. Jojima T, Tomotsune T, Iijima T, Akimoto K, Suzuki K, Aso Y. Empagliflozin (an SGLT2 inhibitor), alone or in combination with linagliptin (a DPP-4 inhibitor), prevents steatohepatitis in a novel mouse model of non-alcoholic steatohepatitis and diabetes. Diabetol Metab Syndr. 2016;8:45. doi:10.1186/s13098-016-0169-x
17. Nakano S, Katsuno K, Isaji M, et al. Remogliflozin etabonate improves fatty liver disease in diet-induced obese male mice. J Clin Exp Hepatol. 2015;5:190–198. doi:10.1016/j.jceh.2015.02.005
18. Nishimura N, Kitade M, Noguchi R, et al. Ipragliflozin, a sodium-glucose cotransporter 2 inhibitor, ameliorates the development of liver fibrosis in diabetic Otsuka Long-Evans Tokushima fatty rats. J Gastroenterol. 2016;51:1141–1149. doi:10.1007/s00535-016-1200-6
19. Qiang S, Nakatsu Y, Seno Y, et al. Treatment with the SGLT2 inhibitor luseogliflozin improves nonalcoholic steatohepatitis in a rodent model with diabetes mellitus. Diabetol Metab Syndr. 2015;7:104. doi:10.1186/s13098-015-0102-8
20. Komiya C, Tsuchiya K, Shiba K, et al. Ipragliflozin improves hepatic steatosis in obese mice and liver dysfunction in type 2 diabetic patients irrespective of body weight reduction. PLoS One. 2016;11:e0151511. doi:10.1371/journal.pone.0151511
21. Yonamine CY, Pinheiro-Machado E, Michalani ML, et al. Resveratrol improves glycemic control in type 2 diabetic obese mice by regulating glucose transporter expression in skeletal muscle and liver. Molecules. 2017;22:
22. Freitas HS, D’Agord Schaan B, da Silva RS, Okamoto MM, Oliveira-Souza M, Machado UF. Insulin but not phlorizin treatment induces a transient increase in GLUT2 gene expression in the kidney of diabetic rats. Nephron Physiol. 2007;105:42–51. doi:10.1159/000098442
23. Yonamine CY, Pinheiro-Machado E, Michalani ML, et al. Resveratrol improves glycemic control in insulin-treated diabetic rats: participation of the hepatic territory. Nutr Metab. 2016;13:44. doi:10.1186/s12986-016-0103-0
24. David-Silva A, Freitas HS, Okamoto MM, Sabino-Silva R, Schaan BD, Machado UF. Hepatocyte nuclear factors 1α/4α and forkhead box A2 regulate the solute carrier 2A2 (Slc2a2) gene expression in the liver and kidney of diabetic rats. Life Sci. 2013;93:805–813. doi:10.1016/j.lfs.2013.10.011
25. Freitas HS, Schaan BD, David-Silva A, et al. SLC2A2 gene expression in kidney of diabetic rats is regulated by HNF-1alpha and HNF-3beta. Mol Cell Endocrinol. 2009;305:63–70. doi:10.1016/j.mce.2009.02.014
26. Brunt EM. Nonalcoholic fatty liver disease: pros and cons of histologic systems of evaluation. Int J Mol Sci. 2016;17:
27. Olney JW. Brain lesions, obesity, and other disturbances in mice treated with monosodium glutamate. Science. 1969;164:719–721. doi:10.1126/science.164.3880.719
28. Machado UF, Shimizu I, Saito M. Reduced content and preserved translocation of glucose transporter (GLUT 4) in white adipose tissue of obese mice. Physiol Behav. 1994;55:621–625. doi:10.1016/0031-9384(94)90035-3
29. de Carvalho Papa P, Vargas AM, da Silva JL, Nunes MT, Machado UF. GLUT4 protein is differently modulated during development of obesity in monosodium glutamate-treated mice. Life Sci. 2002;71:1917–1928. doi:10.1016/S0024-3205(02)01948-3
30. Ideta T, Shirakami Y, Miyazaki T, et al. The dipeptidyl peptidase-4 inhibitor teneligliptin attenuates hepatic lipogenesis via AMPK activation in non-alcoholic fatty liver disease model mice. Int J Mol Sci. 2015;16:29207–29218. doi:10.3390/ijms161226156
31. Miyazaki T, Shirakami Y, Kubota M, et al. Sodium alginate prevents progression of non-alcoholic steatohepatitis and liver carcinogenesis in obese and diabetic mice. Oncotarget. 2016;7:10448–10458. doi:10.18632/oncotarget.7249
32. Nakanishi Y, Tsuneyama K, Fujimoto M, et al. Monosodium glutamate (MSG): a villain and promoter of liver inflammation and dysplasia. J Autoimmun. 2008;30:42–50. doi:10.1016/j.jaut.2007.11.016
33. Sasaki Y, Suzuki W, Shimada T, et al. Dose dependent development of diabetes mellitus and non-alcoholic steatohepatitis in monosodium glutamate-induced obese mice. Life Sci. 2009;85:490–498. doi:10.1016/j.lfs.2009.07.017
34. Yonamine CY, Alves-Wagner AB, Esteves JV, et al. Diabetes induces tri-methylation at lysine 9 of histone 3 at Slc2a4 gene in skeletal muscle: a new target to improve glycemic control. Mol Cell Endocrinol. 2019;481:26–34. doi:10.1016/j.mce.2018.11.006
35. Rankin Fujimoto MM, Kushner JA. Adaptive beta-cell proliferation is severely restricted with advanced age. Diabetes. 2009;58:1365–1372. doi:10.2337/db08-1198
36. Agius L. Glucokinase and molecular aspects of liver glycogen metabolism. Biochem J. 2008;414:1–18. doi:10.1042/BJ20080595
37. Fujimoto M, Tsuneyama K, Nakanishi Y, et al. A dietary restriction influences the progression but not the initiation of MSG-induced nonalcoholic steatohepatitis. J Med Food. 2014;17:374–383. doi:10.1089/jmf.2012.0029
38. Tsuneyama K, Nishitsuji K, Matsumoto M, et al. Animal models for analyzing metabolic syndrome-associated liver diseases. Pathol Int. 2017;67:539–546. doi:10.1111/pin.12600
39. van der Heijden RA, Sheedfar F, Morrison MC, et al. High-fat diet induced obesity primes inflammation in adipose tissue prior to liver in C57BL/6j mice. Aging. 2015;7:256–268. doi:10.18632/aging.100738
40. Brunt EM, Neuschwander-Tetri BA, Oliver D, Wehmeier KR, Bacon BR. Nonalcoholic steatohepatitis: histologic features and clinical correlations with 30 blinded biopsy specimens. Hum Pathol. 2004;35:1070–1082. doi:10.1016/j.humpath.2004.04.017
41. Watt MJ, Miotto PM, De Nardo W, Montgomery MK. The liver as an endocrine organ- linking NAFLD and insulin resistance. Endocr Rev. 2019;40:1367–1393. pii:er.2019–00034.
42. Gorgani-Firuzjaee S, Meshkani R. SH2 domain-containing inositol 5-phosphatase (SHIP2) inhibition ameliorates high glucose-induced de-novo lipogenesis and VLDL production through regulating AMPK/mTOR/SREBP1 pathway and ROS production in HepG2 cells. Free Radic Biol Med. 2015;89:679–689. doi:10.1016/j.freeradbiomed.2015.10.036
43. Yanuka-Kashles O, Cohen H, Trus M, Aran A, Benvenisty N, Reshef L. Transcriptional regulation of the phosphoenolpyruvate carboxykinase gene by cooperation between hepatic nuclear factors. Mol Cell Biol. 1994;14:7124–7133. doi:10.1128/MCB.14.11.7124
44. Aso Y, Kato K, Sakurai S, et al. Impact of dapagliflozin, an SGLT2 inhibitor, on serum levels of soluble dipeptidyl peptidase-4 in patients with type 2 diabetes and non-alcoholic fatty liver disease. Int J Clin Pract. 2019;73:e13335. doi:10.1111/ijcp.13335
45. Ferrannini E, Muscelli E, Frascerra S, et al. Metabolic response to sodium-glucose cotransporter 2 inhibition in type 2 diabetic patients. J Clin Invest. 2014;124:499–508. doi:10.1172/JCI72227
46. Merovci A, Solis-Herrera C, Daniele G, et al. Dapagliflozin improves muscle insulin sensitivity but enhances endogenous glucose production. J Clin Invest. 2014;124:509–514. doi:10.1172/JCI70704
47. Bonner C, Kerr-Conte J, Gmyr V, et al. Inhibition of the glucose transporter SGLT2 with dapagliflozin in pancreatic alpha cells triggers glucagon secretion. Nat Med. 2015;21:512–517. doi:10.1038/nm.3828
48. Kuhre RE, Ghiasi SM, Adriaenssens AE, et al. No direct effect of SGLT2 activity on glucagon secretion. Diabetologia. 2019;62:1011–1023. doi:10.1007/s00125-019-4849-6
49. Yamazaki Y, Usui I, Kanatani Y, et al. Treatment with SRT1720, a SIRT1 activator, ameliorates fatty liver with reduced expression of lipogenic enzymes in MSG mice. Am J Physiol Endocrinol Metab. 2009;297:E1179–86. doi:10.1152/ajpendo.90997.2008
 © 2020 The Author(s). This work is published and licensed by Dove Medical Press Limited. The full terms of this license are available at https://www.dovepress.com/terms.php and incorporate the Creative Commons Attribution - Non Commercial (unported, v3.0) License.
By accessing the work you hereby accept the Terms. Non-commercial uses of the work are permitted without any further permission from Dove Medical Press Limited, provided the work is properly attributed. For permission for commercial use of this work, please see paragraphs 4.2 and 5 of our Terms.
© 2020 The Author(s). This work is published and licensed by Dove Medical Press Limited. The full terms of this license are available at https://www.dovepress.com/terms.php and incorporate the Creative Commons Attribution - Non Commercial (unported, v3.0) License.
By accessing the work you hereby accept the Terms. Non-commercial uses of the work are permitted without any further permission from Dove Medical Press Limited, provided the work is properly attributed. For permission for commercial use of this work, please see paragraphs 4.2 and 5 of our Terms.