")
Back to Journals » International Journal of Nanomedicine » Volume 12
Dual functions of silver nanoparticles in F9 teratocarcinoma stem cells, a suitable model for evaluating cytotoxicity- and differentiation-mediated cancer therapy
Authors Han JW, Gurunathan S , Choi YJ, Kim JH
Received 29 June 2017
Accepted for publication 9 September 2017
Published 12 October 2017 Volume 2017:12 Pages 7529—7549
DOI https://doi.org/10.2147/IJN.S145147
Checked for plagiarism Yes
Review by Single anonymous peer review
Peer reviewer comments 3
Editor who approved publication: Dr Thomas Webster
Jae Woong Han, Sangiliyandi Gurunathan, Yun-Jung Choi, Jin-Hoi Kim
Department of Stem Cell and Regenerative Biotechnology, Humanized Pig Research Center (SRC), Konkuk University, Seoul, Republic of Korea
Background: Silver nanoparticles (AgNPs) exhibit strong antibacterial and anticancer activity owing to their large surface-to-volume ratios and crystallographic surface structure. Owing to their various applications, understanding the mechanisms of action, biological interactions, potential toxicity, and beneficial effects of AgNPs is important. Here, we investigated the toxicity and differentiation-inducing effects of AgNPs in teratocarcinoma stem cells.
Materials and methods: AgNPs were synthesized and characterized using various analytical techniques such as UV–visible spectroscopy, X-ray diffraction, energy-dispersive X-ray spectroscopy, and transmission electron microscopy. The cellular responses of AgNPs were analyzed by a series of cellular and biochemical assays. Gene and protein expressions were analyzed by reverse transcription-quantitative polymerase chain reaction and western blotting, respectively.
Results: The AgNPs showed typical crystalline structures and spherical shapes (average size =20 nm). High concentration of AgNPs induced cytotoxicity in a dose-dependent manner by increasing lactate dehydrogenase leakage and reactive oxygen species. Furthermore, AgNPs caused mitochondrial dysfunction, DNA fragmentation, increased expression of apoptotic genes, and decreased expression of antiapoptotic genes. Lower concentrations of AgNPs induced neuronal differentiation by increasing the expression of differentiation markers and decreasing the expression of stem cell markers. Cisplatin reduced the viability of F9 cells that underwent AgNPs-induced differentiation.
Conclusion: The results showed that AgNPs caused differentially regulated cytotoxicity and induced neuronal differentiation of F9 cells in a concentration-dependent manner. Therefore, AgNPs can be used for differentiation therapy, along with chemotherapeutic agents, for improving cancer treatment by targeting specific chemotherapy-resistant cells within a tumor. Furthermore, understanding the molecular mechanisms of apoptosis and differentiation in stem cells could also help in developing new strategies for cancer stem cell (CSC) therapies. The findings of this study could significantly contribute to the nanomedicine because this study is the first of its kind, and our results will lead to new strategies for cancer and CSC therapies.
Keywords: silver nanoparticles, teratocarcinoma stem cells, cell viability, cytotoxicity, differentiation, cancer therapy
Introduction
Nanotechnology is an interdisciplinary science through which nanomaterials are generated for new applications in medicine. Nanotechnology has progressed significantly in various areas of research, including biotechnology, biomedical sciences, electronics, mechanics, cosmetics, and food. Silver nanoparticles (AgNPs), one of the most common commercialized nanomaterials, have gained much interest in both academics and industry owing to their unique physical, chemical, and biological properties. AgNPs have been widely used in a range of biomedical applications, including as antibacterial, antiviral, antifungal, antiangiogenic, and anticancer agents as well as in drug delivery, diagnosis, treatment, medical device coatings, and personal health care products.1–4
An interesting characteristic of AgNPs is that they can be used both as cytotoxic agents and as differentiation-inducing agents. The cytotoxic effects of AgNPs have been reported in different types of cancer and non-cancer cells, including human peripheral blood mononuclear cells,5 human alveolar epithelial cells (A549),6,7 murine and human alveolar macrophage cells,8 rat liver cells,9 male somatic cells and spermatogonial stem cells (SSCs),10,11 neuroendocrine cells,12 human breast cancer cells,13 human ovarian cancer cells,14 human embryonic stem cell (ESC)-derived fibroblasts, and L-929 cells. AgNPs induce toxicity by releasing silver ions into the cells, which activate ion channels and increase the cell membrane’s permeability to both potassium and sodium, by interacting with mitochondria, and by inducing apoptosis via both intrinsic and extrinsic pathways through the generation of reactive oxygen species (ROS).15,16 The toxicity of AgNPs depends on their size, shape, surface charge, concentration, and surface functionalization.17 The size of AgNPs also plays a major role in inflammation and genotoxicity.18 In addition, AgNPs can induce differentiation of several neuronal cells, depending on their concentration and the cell type.
Differentiation is an important phenomenon in cancer cells, and differentiation therapy holds a great promise for cancer treatment.19 The differentiation of cancer cells into normal tissue cells, which contributes to tumor regression, is induced by certain factors, including genetic processes, nutrient conditions, and chemicals.20 Recent advancements in stem cell research show that stem cells used as seed cells have unique properties that are vital to the development of engineered tissue constructs, including high proliferation rates, self-renewal, and specialized differentiation under specific conditions.21 In addition, differentiated stem cells are less resistant to chemotherapy than non-differentiated cells. AgNPs act as either differentiation-inducing or cytotoxic agent, depending on their concentration and the cell type. For instance, AgNPs were shown to promote osteogenic differentiation of urine-derived stem cells by inducing actin polymerization, increasing cytoskeletal tension, and activating RhoA.21 In contrast, AgNPs were found to inhibit differentiation via autophagy blockade and lysosomal impairment in THP-1 monocytes.22 Several studies have reported that AgNPs play an important role in tissue engineering scaffolds, with a reduced incidence of infection and significant cell compatibility.23,24 In one study, the cellular uptake of AgNPs did not influence the osteogenic differentiation of human mesenchymal stem cells (hMSCs).25 AgNPs have been shown to induce neuronal differentiation of SH-SY5Y cells via modulation of ROS, phosphatases, and kinase signaling pathways.26 In another study, substrates coated with AgNPs, which serve as favorable anchoring sites, showed significantly enhanced neurite outgrowth.27 Androgen deprivation and chemical compounds were found to induce differentiation of neuroendocrine cells in prostate cancer.28,29 All these studies suggest that the restoration of normal function or differentiated phenotypes in cancer cells is possible by the tumor-suppressive function of AgNPs.
Cellular signaling is an interconnected network process that is important for the regulation of diverse processes such as protein synthesis, cell growth, cell survival, motility, cell architecture and polarity, differentiation, and programmed cell death. Individual signaling molecules can control different signaling complexes at different intracellular locations.30 Epidermal growth factor (EGF) and its receptor (EGFR) control responses ranging from proliferation and survival to wound healing and migration in different cell types.31 Previous studies have identified that at subtoxic levels, AgNPs interfered in both EGF and nerve growth factor signal transduction in SSCs and human lung carcinoma cells.11,32,33 Comfort et al reported that the nanoparticle-induced interference of EGF signaling took place in four different phases, namely, interaction of nanoparticles with EGF, Akt and Erk phosphorylation, Akt activity, and EGF-dependent gene regulation, in the human epithelial cell line A-431.33 Furthermore, Comfort et al reported that after chronic exposure to AgNPs in the pg/mL range, cells displayed an augmented stress profile and modified EGF signaling efficiency, as well as increased p38 activation, actin disorganization, heightened ki67 expression, and extensive gene modification. EGFR is known to activate the downstream kinases such as the PI3K/Akt and ras/Erk cascades. Akt is a critical player in a multitude of processes, including immune functionality, metabolism, cell survival, and growth.34,35
Erk controls various cellular processes, including proliferation, mitosis, and differentiation.36 Recently, Dayem et al reported that the treatment of SH-SY5Y with biologically synthesized AgNPs led to cell morphological changes, a significant increase in neurite length, enhanced differentiation of neuronal cells by increase in intracellular ROS and activation of several kinases such as Erk and Akt, and the downregulation of DUSP expression.26 Given that embryonal carcinoma (EC) cells mimic the early embryo, they are used as an in vitro model for studying the developmental aspects. These stem cells can be induced to differentiate in vitro into cell types that resemble those found at various stages of early mouse development.37 In addition, EC cells, which are the malignant stem cells of teratocarcinomas, are considered similar to early embryonic cells. Furthermore, EC cells can be easily derived from early embryonic cells or germ cells in vivo and in vitro, and the morphological, biochemical, and immunochemical properties of EC cells are very similar to those of the inner cell mass or the primitive ectoderm cells of the blastocyst-stage embryo. Finally, the mode of differentiation of EC cells is very similar to that of the apparently corresponding cells in the embryo, which can give rise to a variety of cell types, and also to all differentiated types of cells in the embryo. With the growing application of AgNPs in the medical field, it is essential to better understand their mechanisms of action, biological interactions, and potential toxicity/differentiation-inducing effect. Therefore, this study was designed to critically assess the cytotoxicity and differentiation-inducting effect of AgNPs in F9 teratocarcinoma stem cells.
Materials and methods
Materials
DMEM, penicillin–streptomycin solution, and trypsin–EDTA solution were purchased from Thermo Fisher Scientific (Waltham, MA, USA). FBS, in vitro cell proliferation kit, and cell-counting kit-8 (CCK-8) were obtained from Dojindo Laboratories (Kumamoto, Japan). In Vitro Toxicology Assay Kit (TOX7), 2′,7′-dichlorodihydrofluorescein diacetate (DCFH-DA), in situ cell death detection kit (TMR red), and AgNO3 were purchased from Sigma-Aldrich (St Louis, MO, USA). Cationic fluorescent indicator (JC-1) was obtained from Molecular Probes (Eugene, OR, USA). Rabbit anti-p-Akt, total Akt, p-p38, total p38, rabbit anti-p-Erk, and total Erk were purchased from Cell Signaling (Danvers, MA, USA). p-p53, total p53 pro- and cleaved caspase-3, caspase-9, Bax, Bcl-2, and β-actin were purchased from Abcam (Cambridge, UK).
Synthesis and characterization of AgNPs
The synthesis and characterization of AgNPs was carried out according to a previously described method.3,7,11 Briefly, Escherichia coli were grown in Luria-Bertani broth without NaCl. The flasks were incubated for 21 h in a shaker set at 200 rpm and 37°C. After the incubation period, the culture was centrifuged at 10,000 rpm, and the supernatant was used for the synthesis of AgNPs. To produce bio-AgNPs, the culture supernatant was treated with 5 mM AgNO3 and incubated for 5 h at 60°C at pH 8.0.
Cell culture and treatment
F9 mouse embryonic carcinoma cells were purchased from the Korean Cell Line Bank (KCLB) and maintained in DMEM supplemented with 10% FBS and 1% antibiotic–antimycotic solution. Cells were grown to confluence at 37°C in 5% CO2. Experiments were performed in 96-, 24-, and 12-well plates and 100-mm cell culture dishes, as occasion demanded. Cells were treated with various concentrations of AgNPs or two different doses of AgNPs (12.5 and 25 μg/mL), retinoic acid (RA; 1 μM), and cisplatin (1 μM).
Cell viability
Cell viability was measured using CCK-8 (CK04-01; Dojindo Laboratories). Briefly, F9 cells were plated in 96-well flat-bottom culture plates containing various concentrations of AgNPs, AgNO3, or cisplatin. After 24-h culture at 37°C and 5% CO2 in a humidified incubator, CCK-8 solution (10 μL) was added to each well, and the plate was incubated for another 2 h at 37°C. The absorbance was measured at 450 nm using a microplate reader (Multiskan FC; Thermo Fisher Scientific).
Membrane integrity
The membrane integrity of F9 cells was evaluated using an LDH Cytotoxicity Detection Kit. Briefly, cells were exposed to various concentrations of AgNPs for 24 h. Subsequently, 100 μL of cell-free supernatant from each well was transferred in triplicate into the wells of a 96-well plate, and then 100 μL of the lactate dehydrogenase (LDH) reaction mixture was added to each well. After 3 h of incubation under standard conditions, the optical density of the final solution was determined at a wavelength of 490 nm using a microplate reader.
Determination of intracellular ROS
The F9 cells were treated with AgNPs or AgNO3 for 24 h. ROS were measured according to a previous method based on the intracellular peroxide-dependent oxidation of DCFH-DA (Molecular Probes) to form the fluorescent compound 2′,7′-dichlorofluorescein (DCF).7,11 Cells were seeded onto 24-well plates at a density of 5×10⁴ cells per well and cultured for 24 h. After washing twice with PBS, fresh medium containing AgNPs or AgNO3 was added, and the cells were incubated for 3 h. For the control, 20 μM DCFH-DA was added to the cells and incubated for a further 30 min at 37°C. The cells were then rinsed with PBS, and 2 mL of PBS was added to each well and the fluorescence intensity was determined using a spectrofluorometer (Gemini EM) with excitation at 485 nm and emission at 530 nm. DCFH-DA (20 μM) was then added, and the cells were incubated for 30 min at 37°C before measuring the changes in DCF fluorescence as described.
JC-1 assay
The F9 cells were treated with AgNPs or AgNO3 for 24 h. The change in mitochondrial transmembrane potential was determined using the cationic fluorescent dye JC-1 (Molecular Probes). Fluorescence of JC-1 aggregates and JC-1 monomers was measured at an excitation wavelength of 488 nm and emission wavelengths of 583 and 525 nm, respectively, using a Gemini EM fluorescence microplate reader (Molecular Devices, Sunnyvale, CA, USA).
Terminal deoxynucleotidyl transferase dUTP nick end labeling (TUNEL) assay
The F9 cells were treated with AgNPs or AgNO3 for 24 h. Apoptotic DNA fragmentation was detected using a DNA fragmentation imaging kit (Roche, Basel, Switzerland), following the manufacturer’s instructions and as described previously.11 Based on the TUNEL reaction, fluorescence detection of cells with apoptotic DNA strand breaks was performed. To examine total cell numbers, nuclei were labeled simultaneously with DAPI. Merged images of both channels were obtained using a fluorescence microscope (Olympus, Tokyo, Japan) at 100× magnification.
Flow cytometry analysis
A flow cytometry analysis was performed according to a method described previously.11 The F9 cells were treated with AgNPs or AgNO3 for 24 h, after which they were trypsinized and aliquoted. Aliquots containing 2.5×10⁵–5.0×10⁵ cells were stained for 30 min with the fluorescent dyes JC-1 and DCFH-DA. Thereafter, the cells were washed with PBS, centrifuged at 1,200 g, and resuspended in storage buffer (PBS containing 1% FBS). Cells were analyzed using a FACSCalibur flow cytometer and Cell Quest software (BD Biosciences, San Jose, CA, USA). A total of 104 events were collected during each run.
Reverse transcription-quantitative polymerase chain reaction (RT-qPCR)
Total RNA was extracted from the cells treated with required concentrations of AgNPs or AgNPs (12.5 μg/mL), or AgNPs (25 μg/mL), or AgNO3 (12.5 μg/mL) for 24 h using the Arcturus PicoPure RNA isolation kit (Arcturus Bioscience, Mountain View, CA, USA), and then samples were prepared according to the manufacturer’s instructions. Real-time RT-qPCR was conducted using a Vill7 (Applied Biosystems, Foster City, CA, USA) and SYBR Green as the double-stranded DNA-specific fluorescent dye (Applied Biosystems). Target gene expression levels were normalized to GAPDH expression, which was unaffected by treatment. The real-time RT-qPCR primer sets are shown in Table 1. The real-time RT-qPCR was performed independently in triplicate for each of the different samples; the data are presented as the mean values of gene expression measured in treated samples versus the control.
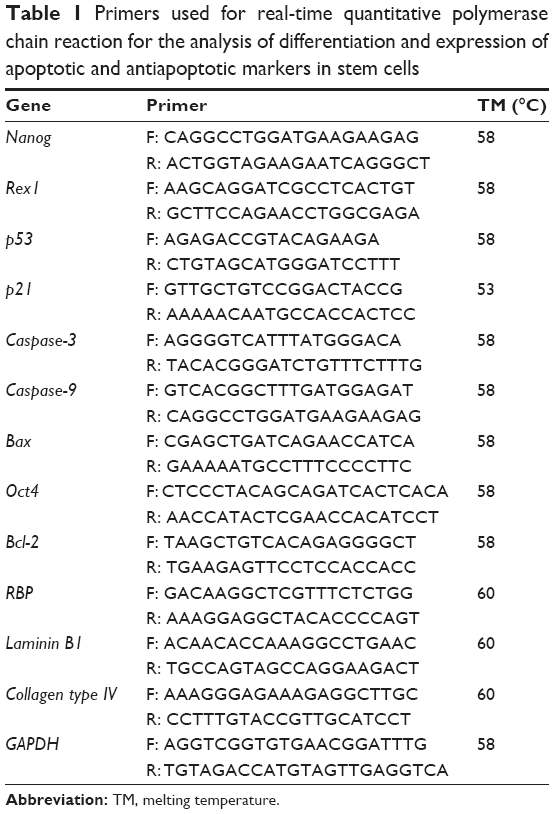 | Table 1 Primers used for real-time quantitative polymerase chain reaction for the analysis of differentiation and expression of apoptotic and antiapoptotic markers in stem cells |
Western blotting
The F9 cells (8×10⁴ cells/dish) were seeded on 100-mm cell culture plates (Sarstedt, Nümbrecht, Germany) and cultured in the presence of AgNPs, or AgNO3, or cisplatin. The protein was then estimated using the Pierce BCA protein assay kit (Thermo Fisher Scientific): 20 μg of the protein per track was separated using SDS-PAGE with 10% (w/v) acrylamide:bis-acrylamide (29:1) resolving gel, transferred onto a PVDF membrane by the semi-dry transfer method, and blocked with TBST (5% [w/v] skim milk in TBST) overnight. Subsequently, the membranes were treated with each primary antibody at 1:1,000 dilution for 2 h. Finally, after washing with TBST thrice, secondary anti-rabbit IgG-HRP (Enzo) antibody was added at a 1:2,000 dilution for 45 min and detected using the X-ray film.
Statistical analysis
Independent experiments were repeated at least three times, and data are presented as mean ± standard deviation for all duplicates within an individual experiment. Data were analyzed by t-test or multivariate analysis or one-way analysis of variance followed by the Tukey test for multiple comparisons to determine the differences between groups denoted by an asterisk using GraphPad Prism analysis software.
Results and discussion
Synthesis and characterization of AgNPs
AgNPs were synthesized according to a previously described method.3,7 The synthesized AgNPs were characterized using various analytical techniques, including UV–visible spectroscopy, X-ray diffraction (XRD), transmission electron microscopy (TEM), and energy-dispersive X-ray spectroscopy (EDX). UV–visible spectroscopy is a valuable tool for the analysis of nanoparticles. The typical characteristic broad and strong peak of AgNPs was observed at 420 nm, indicating successful synthesis (Figure 1A). The characteristic of this peak, assigned to a surface plasmon, has been well documented for various metal nanoparticles with sizes ranging from 2 to 100 nm.38,39
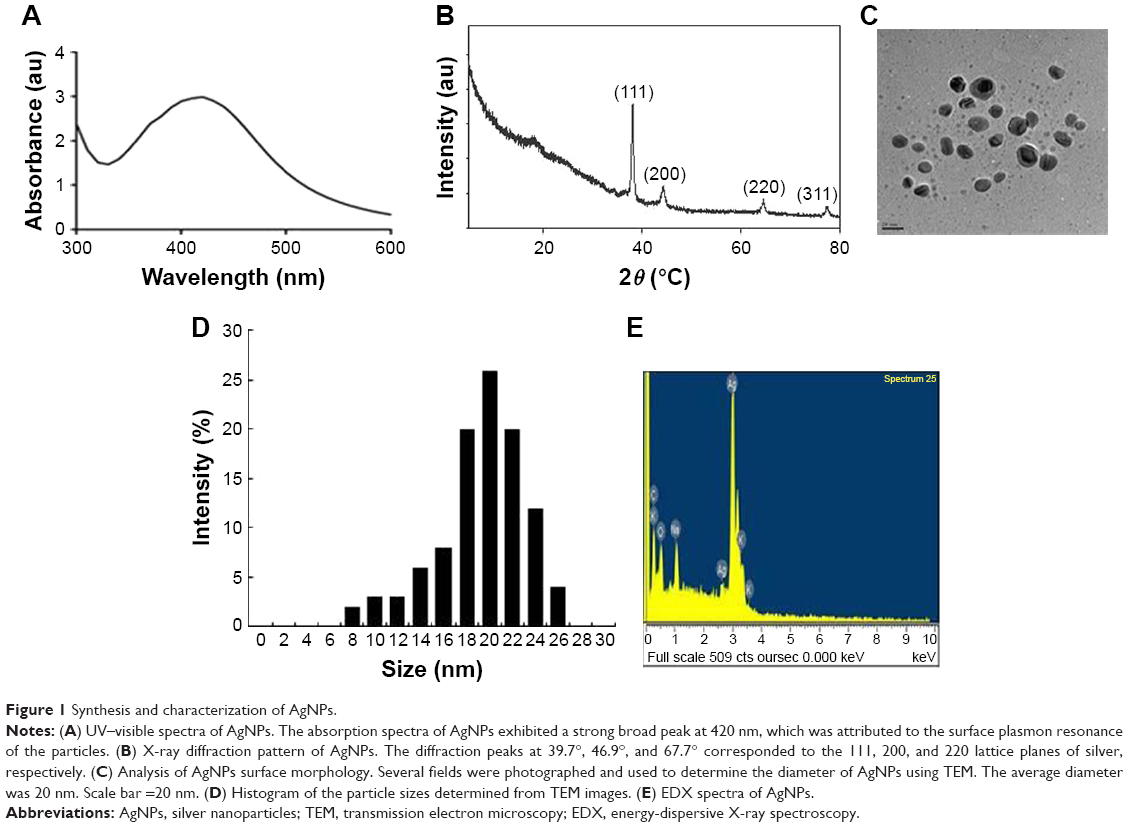 | Figure 1 Synthesis and characterization of AgNPs. |
The crystalline nature of AgNPs was confirmed using XRD. The diffracted intensities were recorded from 20° to 80°. The XRD pattern of AgNPs showed four intensive peaks at 38.7°, 45.9°, 64.7°, and 75.3, corresponding to the 111, 200, and 220, and 311 lattice planes for silver, respectively (Figure 1B). The average size of the particles was 20 nm.7 Similarly, AgNPs synthesized using the leaf extract of Artemisia princeps as a bioreductant and aqueous leaf extract of Urtica dioica showed average sizes of 20 and 25 nm, respectively.40,41
TEM is an indispensable technique to directly analyze the structure, size, and shape of AgNPs. TEM micrographs of the biologically synthesized AgNPs revealed distinct, uniformly distributed, and significantly spherical-shaped particles with sizes ranging between 8 and 26 nm (Figure 1C and D). As we reported earlier, E. coli culture supernatants can produce AgNPs with an average size of 50 nm, depending on the temperature, pH, concentration of AgNO3, and concentration of culture supernatant.3 Han et al reported that E. coli culture supernatants can produce AgNPs with an average size of 20 nm by increasing the concentration of AgNO3 and using high temperature.7 Gram-positive bacteria such as Bacillus licheniformis and Bacillus thuringiensis produced AgNPs with an average size of 50 and 15 nm, respectively.42,43 Altogether, the results obtained from the XRD pattern are in significant agreement with TEM image pattern, which suggests the crystalline nature of AgNPs.
We performed EDX to identify the elemental composition of the biologically prepared AgNPs. As shown in Figure 1E, the EDX profile showed a strong silver signal along with weak oxygen and carbon peaks, which may have originated from the binding of biomolecules from the culture to the AgNPs surfaces, thus confirming the formation of AgNPs and indicating the reduction of silver ions to elemental silver. Metallic silver nanocrystals typically show an optical absorption peak at approximately 3 keV due to surface plasmon resonance.44 Our findings suggest that the synthesis of AgNPs was pure, given the high percentage of silver.
Effect of AgNPs on F9 cell toxicity
To determine the viability of F9 cells, the cells were treated with different concentrations of AgNPs and AgNO3, the latter of which was used as a positive control. The viability of F9 cells was decreased significantly compared to that of the negative control (Figure 2A). Notably, AgNO3 exhibited enhanced toxicological effects on F9 cells, compared to the effects of AgNPs, which is due to the fast release of silver ions from AgNO3.11 We observed similar results when male- and female-derived somatic and germ cells were treated with AgNPs and AgNO3. Several studies have reported that the AgNPs could induce a variety of toxicity mechanisms, including generation of ROS, in an intrinsic and extrinsic manner in different types of cancer cells including human breast cancer cells, A549 human lung carcinoma cells, T24 bladder carcinoma cells, and male somatic cells and SSCs.7,10,13,40,45,46
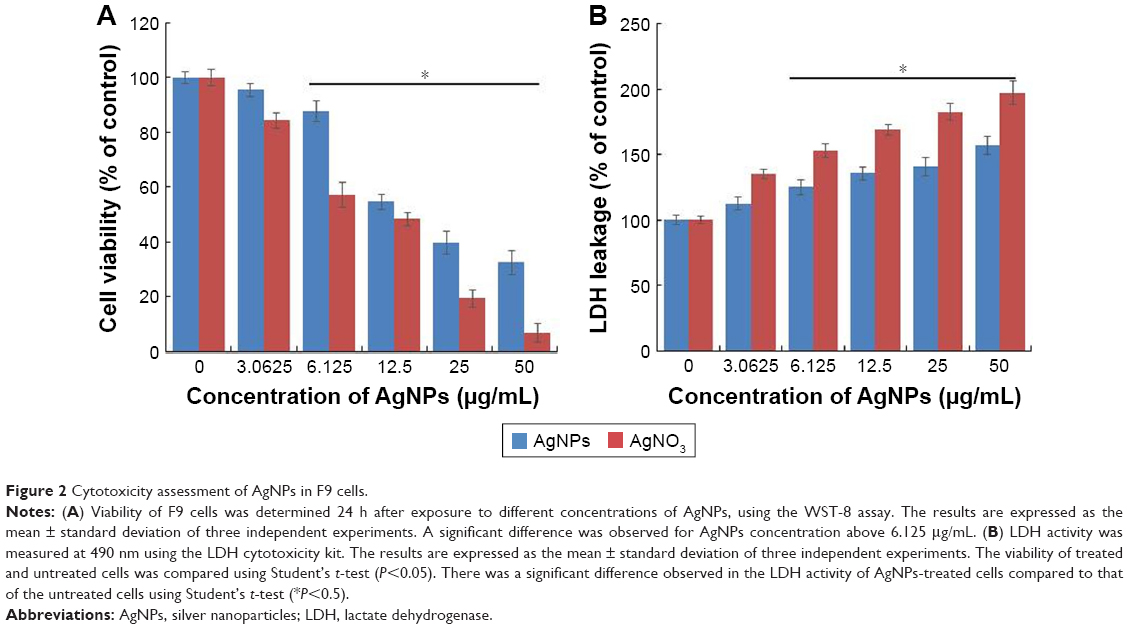 | Figure 2 Cytotoxicity assessment of AgNPs in F9 cells. |
Next, we examined the leakage of LDH in AgNPs- and AgNO3-treated cells. LDH is a well-known indicator of cell death. When the cells were treated with AgNPs and AgNO3, the amount of LDH leaked into the media increased in a dose-dependent manner (Figure 2B). However, the leakage was remarkably higher in AgNO3-treated cells than in AgNPs-treated cells, which indicates that AgNO3 induces more severe toxicity than AgNPs does. The leakage of LDH could be a result of oxidation stress and loss of membrane integrity caused by AgNPs and the release of Ag ions. The cytotoxicity of AgNPs is consistent with previous reports on a variety of cancer cell lines including human breast, lung, and ovarian cancer cells.7,13,40
AgNPs induce ROS generation
Generally, cells treated with exogenous reagents such as chemotherapeutic agents, nanoparticles, and cytotoxic agents are always subjected to the precarious effects of exogenously or endogenously produced highly reactive oxidizing molecules, which eventually leads to cell structure damage, and ROS generation is also involved in a wide variety of physiological and pathological processes in animal cells.47 To determine the intracellular ROS level after exposure of F9 cells to AgNPs and AgNO3, we performed flow cytometry analysis and fluorescence microscopy using DCFH-DA. DCFH-DA is a widely used indicator which is converted into the highly fluorescent substance DCF inside the cells after cleavage of the acetate groups by intracellular esterases and oxidation by ROS.48 We measured the distribution of the fluorescence intensity in the presence or absence of AgNPs or AgNO3. It was found that the treatment of F9 cells with AgNPs (53.37%) or AgNO3 (73.21%) led to a marked shift to greater fluorescence peak intensities compared to the untreated control (Figure 3A) (P<0.05). Moreover, ROS generation induced by AgNPs resulted in high FITC fluorescence intensity, indicating an increased susceptibility to oxidative stress (Figure 3A).
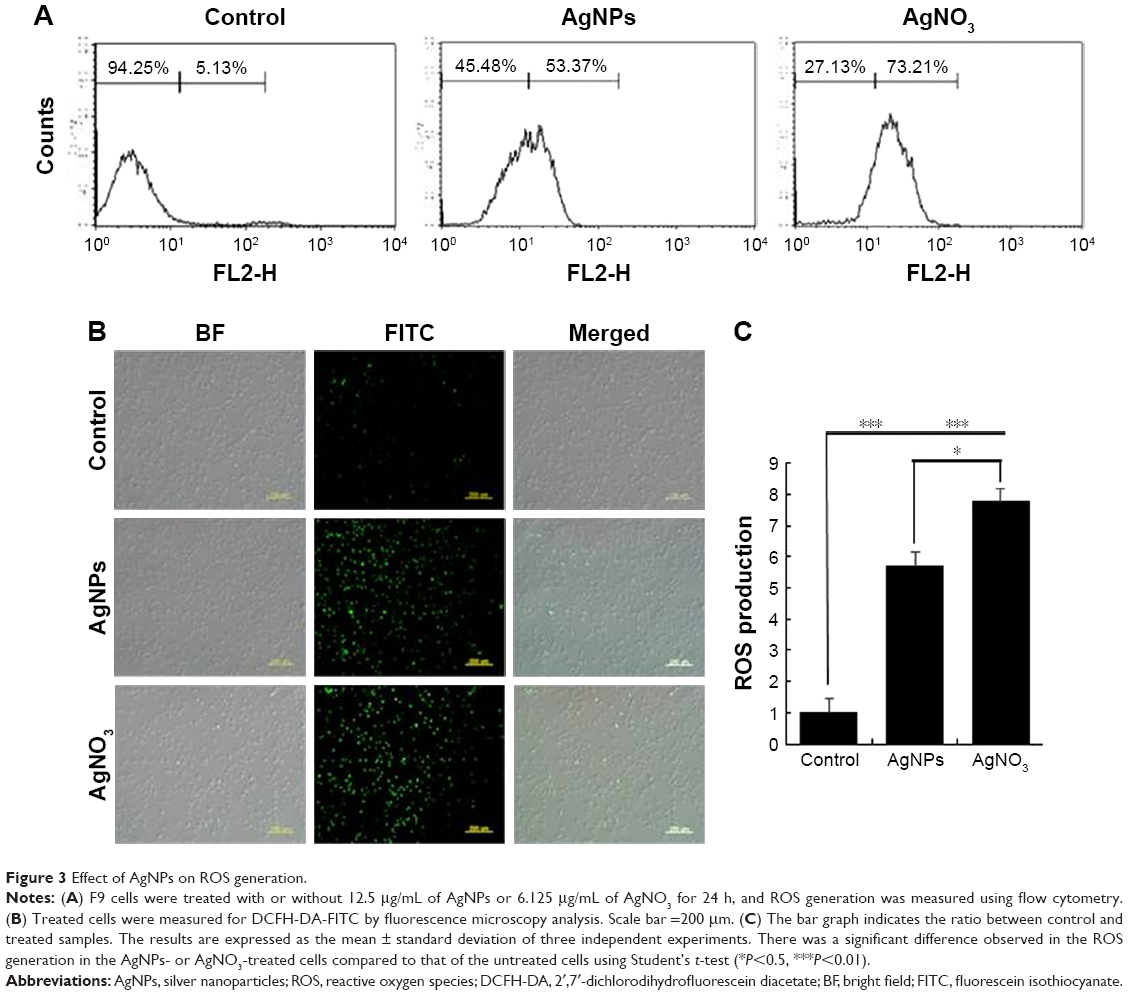 | Figure 3 Effect of AgNPs on ROS generation. |
Next, to determine whether treatment with AgNPs and AgNO3 would generate oxidative stress in F9 cells, the cells were stained with DCFH-DA and examined for the production of ROS by measuring the cell population positive for DCF-derived fluorescence after the treatment. Treatment with AgNPs and AgNO3 stimulated ROS generation in cells (Figure 3B). The amount of ROS generated in cells treated with AgNO3 was higher than that in cells treated with AgNPs, whereas the amount in cells treated with AgNPs was higher than untreated cells. The increased fluorescence intensities are shown in Figure 3C. It is well known that AgNPs can exhibit cytotoxic, antitumor, and antiangiogenic activities through the induction of oxidative stress by generating ROS in various types of cells, including Dalton’s lymphoma ascites cells, human breast, lung, and ovarian cancer cells, and mouse testicular cells.3,7,10,11,13,49 Previous toxicological studies suggest that the intracellularly accumulated nanoparticles release toxic silver ions that induce ROS generation, thereby unbalancing the redox homeostasis of the cells.50,51 Finally, the intracellular ROS target biomolecules such as proteins, DNA, and lipids and disrupt cellular organelles, inducing membrane disorder, cytoskeletal disruption, and genotoxic lesions, all of which together contribute to the initiation of the apoptotic process by both the intrinsic and extrinsic pathways. Consequently, AgNPs-induced ROS and oxidative stress play an important role in cytotoxicity.
AgNPs cause mitochondrial dysfunctions in F9 cells
Mitochondria are important to maintain the energy supply and normal functions of cells, as well as being involved in the induction of apoptosis, programmed cell death, and cellular calcium and redox homeostasis.52 For instance, chemotherapeutic agents, such as doxorubicin, target cancer cells and change the structure and function of mitochondria. Mitochondria are the major producer and source of ROS in cells, and the bulk of mitochondrial ROS is generated at the electron transport chain.53 AgNPs are known to induce ROS in a variety of cancer cells, including human breast, lung, and ovarian cancer cells. The increase in the rate of ROS generation is responsible for the accumulation of ROS-associated damages in DNA, proteins, and lipids and may result in progressive cell dysfunctions including mitochondrial dysfunction. To investigate the impact of AgNPs and AgNO3 on the disruption of active mitochondria, we used JC-1 dye, which is widely used in apoptosis studies to monitor mitochondrial health. In healthy cells that have high mitochondrial membrane potential (ΔΨm), JC-1 spontaneously forms complexes known as J-aggregates that show intense red fluorescence. In contrast, in apoptotic or unhealthy cells with low ΔΨm, JC-1 remains in the monomeric form, showing only green fluorescence in higher level.54 F9 cells incubated with AgNPs and AgNO3 underwent mitochondrial damage, resulting in changes in the ΔΨm. Consequently, the JC-1 monomer level was significantly increased by AgNPs, which resulted in high FITC fluorescence intensity, indicating an increased susceptibility to oxidative stress (Figure 4A). The percentage of JC-1 monomer-positive cells increased with AgNPs and AgNO3 exposure, compared to that of untreated cells, indicating that the ΔΨm decreased. Similarly, fluorescence microscopy analysis also showed that after AgNPs exposure, the number of JC-1 monomer-positive cells increased, indicating that ΔΨm decreased (Figure 4B). The ratios of JC-1 monomers to aggregates are shown in Figure 4C. These results confirm that AgNPs exposure enhances AgNPs-induced, mitochondrion-mediated apoptosis. The findings from this study clearly revealed that the fluorescence intensity of the red JC-1 aggregates decreased whereas the intensity of the green JC-1 monomers increased upon AgNPs treatment in F9 cells, indicating that AgNPs play a significant role in the loss of ΔΨm. Hsin et al reported that AgNPs treatment induced mitochondrial-mediated apoptosis in NIH3T3 cells via an ROS- and JNK-dependent mechanism. Previously, we found that AgNPs induced mitochondrial-mediated apoptosis in A549 cells.40,54,55 AgNPs treatment resulted in an increase in mitochondrial depolarization accompanied with decreased levels of ATP in human lung carcinoma cells.45 A previous study also suggested that nanoparticles can enter mitochondria and induce the generation of ROS, thus potentiating structural damage and eventually leading to apoptosis.16
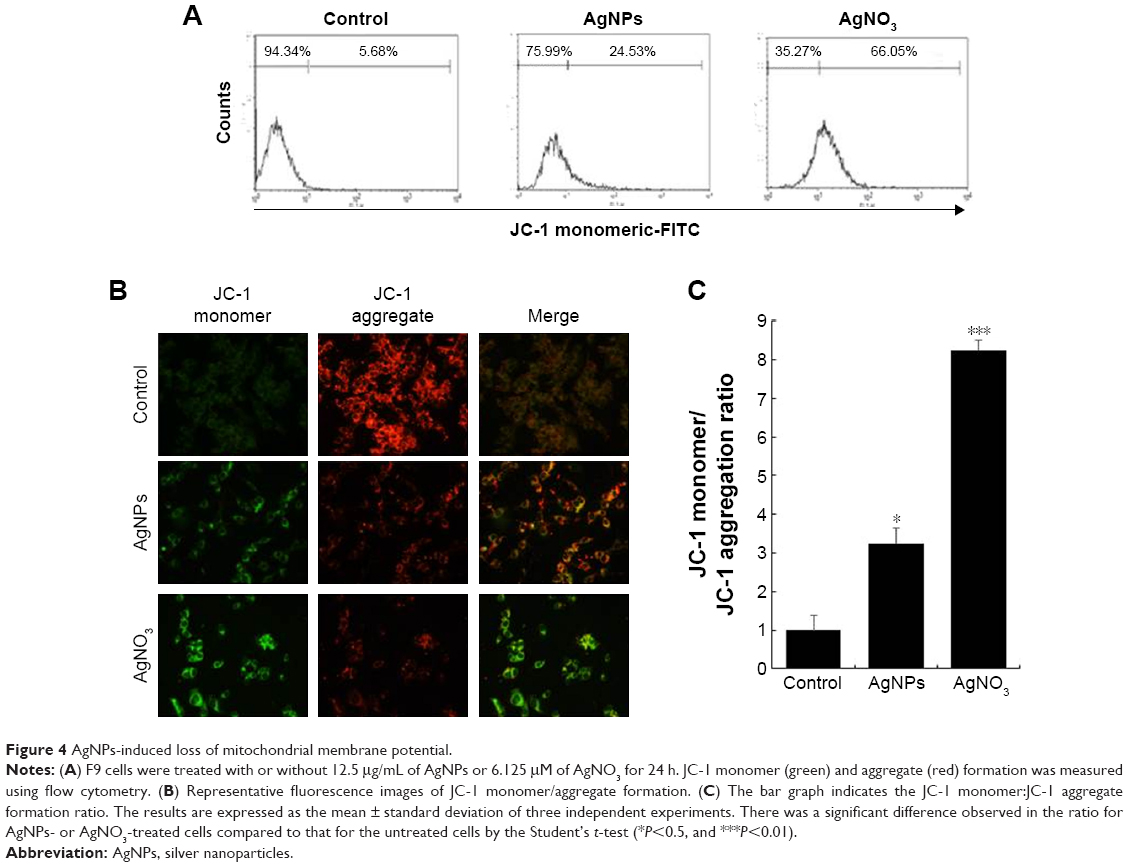 | Figure 4 AgNPs-induced loss of mitochondrial membrane potential. |
AgNPs induce apoptosis in F9 cells
The ROS-mediated mechanism of AgNPs-induced apoptosis is important in various types of cancer cells. Excess production of ROS leads to oxidative stress and is eventually responsible for cellular and DNA damage.56 DNA damage induces extracellular and intracellular signals that activate signaling pathways involved in structural, biochemical, and functional changes such as cell morphology, membrane blebbing, nuclear condensation, and DNA fragmentation, resulting in cell death.57 Apoptosis can be confirmed by two factors: irregular reduction in cell size and DNA fragmentation. Therefore, to determine the effect of AgNPs and AgNO3 on apoptosis in F9 cells, a TMR red assay was performed; apoptotic cells were identified using TMR (red) fluorescence staining, and the level of apoptosis was assessed. Treatment with AgNPs and AgNO3 revealed a significant number of positively stained cells, representing apoptotic DNA fragmentation. In contrast, control groups showed fewer or no apoptotic cells (Figure 5A). As expected, ROS acted as signal molecules promoting oxidative DNA damage.13 Several studies have supported that AgNPs can induce biochemical and molecular changes in a variety of cultured cells including THP-1 monocytes, Dalton’s lymphoma ascites cells, MDA-MB-231 human breast cancer cells, and human ovarian cancer cells.13,14,49,58 To gain further evidence for apoptosis, we determined the efficiency of AgNPs in causing apoptosis using flow cytometry. The results were consistent with those of the fluorescence microscopy; apoptosis was significantly higher in AgNPs-treated cells than in untreated cells (Figure 5B).
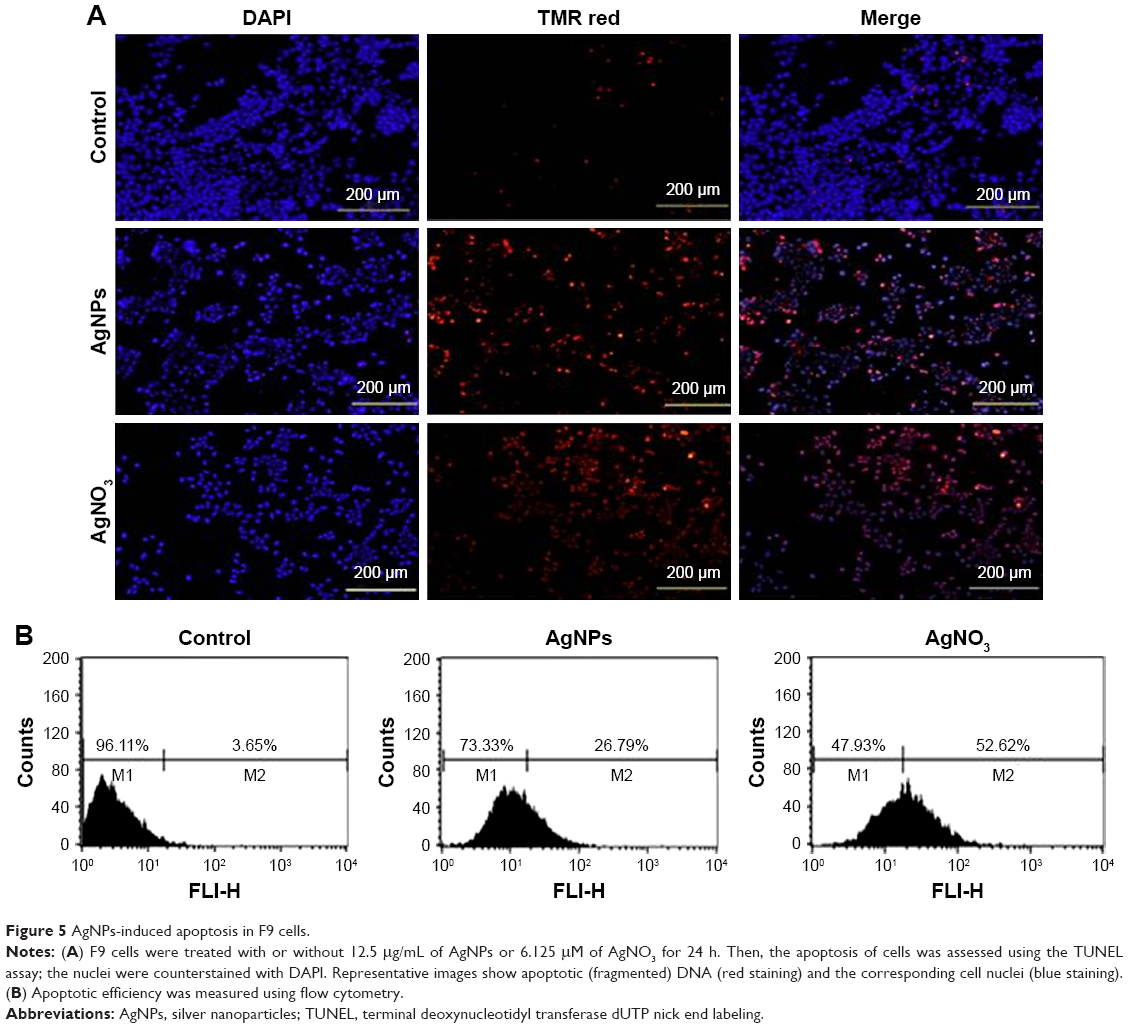 | Figure 5 AgNPs-induced apoptosis in F9 cells. |
AgNPs upregulate the expression of apoptotic genes and downregulate the expression of antiapoptotic genes in F9 cells
Programmed cell death/apoptosis is governed by the upregulation of proapoptotic genes (p53, p21, Bax, and caspases) and downregulation of antiapoptotic genes (Bcl-2), which are activated/deactivated by various intracellular and extracellular signals induced by AgNPs as well as by the activation of death receptors, mitochondrial responses, and caspases.4,59 Based on this, the mRNA expression level of certain apoptotic markers, such as p53, p21, Bax, and caspase-9 and caspase-3, and that of Bcl-2 were investigated in F9 cells by real-time qPCR analysis (Figure 6A). The cells were exposed to AgNPs and AgNO3 for 24 h. The relative mRNA expression levels of the assayed apoptotic markers were found to vary significantly. The levels of p53, p21, Bax, caspase-9, and caspase-3 were upregulated in the AgNPs- and AgNO3-treated cells. AgNPs are known to induce p53 expression, causing p53-dependent cell death in various types of cancer cells, including human breast and ovarian cancer cells.4,60 p53, a major transcription factor for the initiation of apoptosis, regulates p21, Bax, and Bcl-2 in a concentration-dependent manner.60 The levels of p53, p21, Bax, caspase-9, and caspase-3 in the treated group were significantly higher than those in the control group, whereas the expression of Bcl-2 was significantly lower in the treated group than in the control. The severity of apoptosis was merely increased by interbalance of Bax and Bcl-2 expression. The mitochondrial-mediated intrinsic apoptotic pathway is activated owing to the disruption of mitochondrial membranes and eventually leads to the formation of mitochondrial pores, which is essential for the translocation of proapoptotic proteins such as Bax from the cytosol into the outer membrane of the mitochondria. The expression of Bcl-2 was modulated by AgNPs; however, significant downregulation was observed in cells treated with AgNO3 rather than AgNPs. Caspases are important factors of apoptosis, which are tightly linked to their structural makeup, and their induction plays a major role in the apoptotic pathway.13,60–62 Higher levels of ROS in mitochondria cause impairment of outer mitochondrial membrane permeability, followed by the release of cytochrome c and procaspase-2, procaspase-3, and procaspase-9. Our findings suggest that the correlation between the upregulation of the proapoptotic genes p53, p21, Bax, and caspase-9 and caspase-3 and the downregulation of the antiapoptotic gene Bcl-2 is critical to AgNPs-induced apoptosis in F9 cells. Therefore, processes such as the induction of oxidative stress, mitochondrial damage, DNA fragmentation, and apoptosis are major regulatory mechanisms in AgNPs-induced cell death in F9 cells.
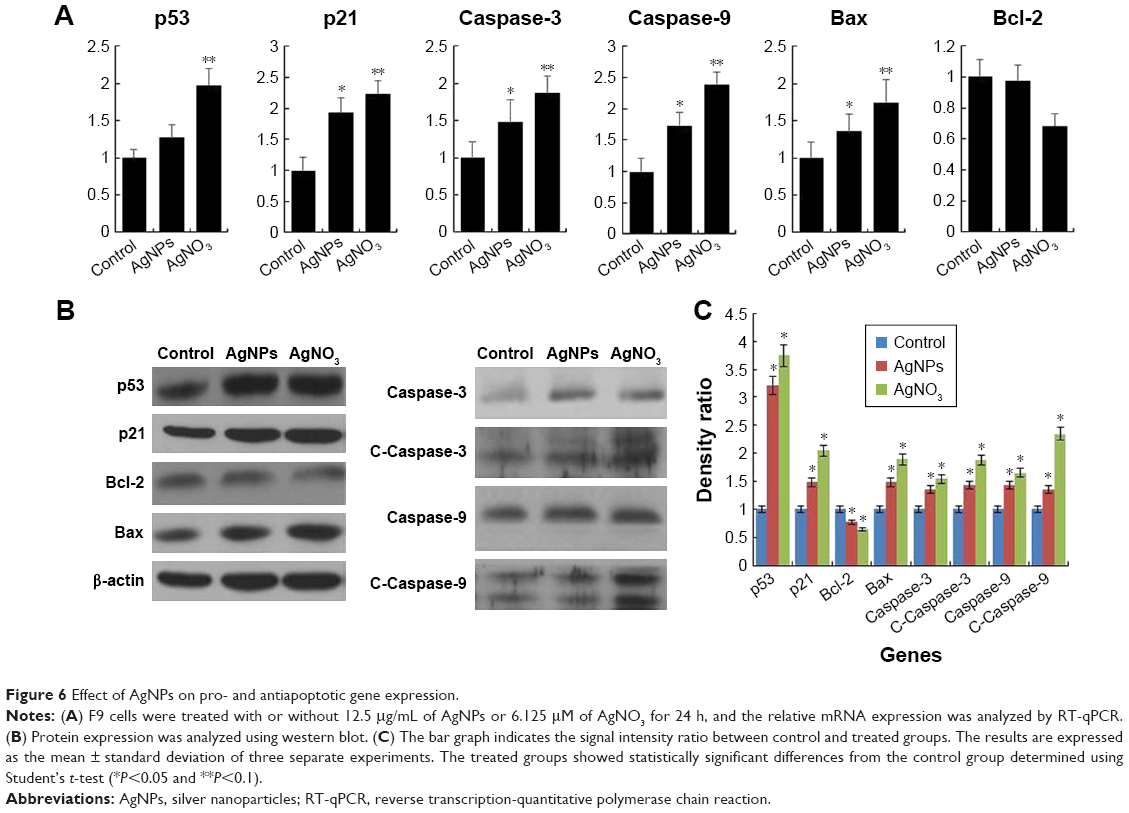 | Figure 6 Effect of AgNPs on pro- and antiapoptotic gene expression. |
The protein expression levels of p53, p21, Bax, caspase-9 and caspase-3, and Bcl-2 in F9 cells were investigated by western blot analysis (Figure 6B). As expected, the expressions of p53, p21, Bax, and caspase-9 and caspase-3 were significantly higher in AgNPs- and AgNO3-treated groups than in the untreated control group, whereas the expression of Bcl-2 was significantly lower in AgNPs-treated cells. The cleavage products of caspase-9 and caspase-3 were also significantly higher in AgNPs- and AgNO3-treated cells than in untreated cells, which clearly indicate that cell death occurred in a caspase-dependent manner. Previously, we have shown that biologically synthesized AgNPs from Bacillus tequilensis and Calocybe indica induce death in human breast cancer cells in a p53-mediated caspase-3-dependent manner.60 The results suggest that the increased level of caspase-9/caspase-3 in AgNPs-treated cells could contribute to cell death through apoptosis.60 The expression of Bcl-2 and Bax proteins and the relative levels of the available dimerization partners shift the balance of cell fate toward either viability or death.63 We demonstrated a relatively inverse relationship between Bcl-2 and Bax gene expression. A remarkable effect of both AgNPs and AgNO3 on the regulation of Bax/Bcl-2 gene expression was observed, with approximately 50% reduction of the Bax/Bcl-2 index (Figure 6C). Altogether, our findings suggest that a balance in the expression of these genes might be responsible for the control of apoptosis.
AgNPs induce the expression of differentiation markers and extracellular matrix (ECM) proteins
The toxicity of AgNPs is dependent on their size, shape, surface chemistry, and concentration as well as on the type of cells.4 AgNPs are known to induce differentiation based on their concentration in a time-dependent manner in various types of stem cells including human adipose-derived stem cells, hMSCs, and osteoblasts.64,65 Previous studies have shown that internalized silica nanoparticles have no apparent deleterious effects on the morphology, proliferation, viability, and differentiation efficiency of mesenchymal stem cells.66,67 The findings from our study suggest that biologically prepared AgNPs seem to be less toxic than AgNO3 at tested concentrations in F9 cells. Therefore, we selected AgNPs for further analysis to demonstrate the effect of AgNPs on differentiation of F9 cells. Because differentiation therapy seems to be a positive approach for various types of cancers, to determine the effect of AgNPs on differentiation, F9 cells were treated with two different concentrations of AgNPs (3.0625 and 12.5 μg/mL). The primary indicator for the assessment of differentiation is changes in the morphological appearance of cancer cells. When F9 cells are treated with AgNPs, they differentiate into neuron-like cells; the neuronal differentiation process is accompanied by remarkable morphological changes such as neurite growth. After 24 h of exposure to AgNPs, F9 cells exhibited elongated neurite-like morphology (Figure 7A). Our results are in agreement with those of previous reports in which SH-SY5Y cells treated with AgNPs showed neuronal differentiation.26,27
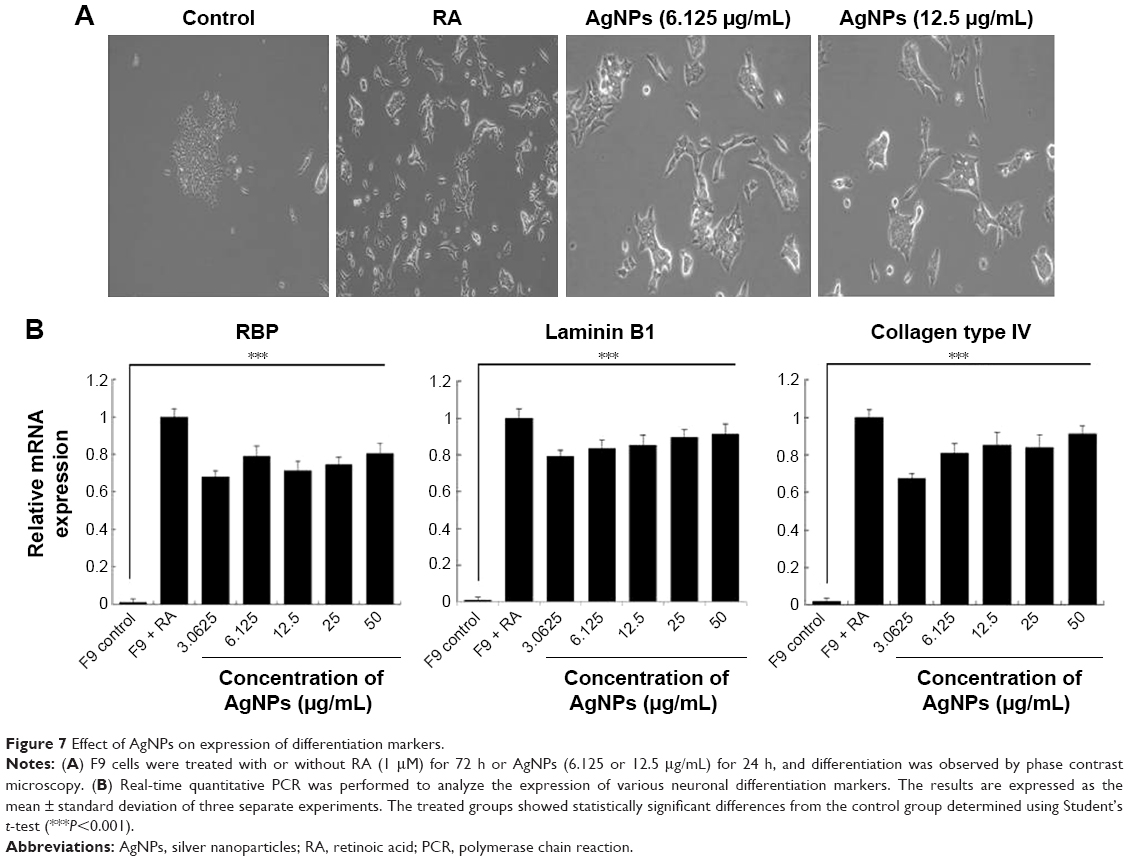 | Figure 7 Effect of AgNPs on expression of differentiation markers. |
Next, we examined the expression of ECM proteins during the differentiation of F9 EC cells induced by AgNPs; we analyzed the expression of ECM components during the differentiation of F9 cells induced by RA as a positive control. We measured the expression level of three different genes involved in differentiation, that is, those encoding RBP, laminin B1, and collagen type IV. The cellular retinoic acid-binding proteins play a role in the interaction between RA and RA receptors to regulate the accessibility of RA to affect the prognosis of cancer.68 ECM proteins such as collagen type IV and laminin are components of connective tissue. AgNPs-treated F9 cells showed significantly higher expression levels of RBP, collagen type IV, and laminin than the untreated group did. However, the cells treated with RA showed slightly higher expression levels of these proteins than those treated with AgNPs did (Figure 7B). Interestingly, AgNPs induced the expression of these differentiation markers within 24 h, whereas RA only induced similar expression level pattern after 72 h of exposure. These results suggest that ECM molecules play an important role in the morphological changes of F9 cells.
Effect of AgNPs on expression of pluripotency markers
To assess the effect of AgNPs on the proliferation of F9 cells, the cells were cultured with or without AgNPs for 24 h; once again, we used RA as the positive control. We performed qPCR to measure the levels of the pluripotency-associated genes Nanog, Oct4, and Rex1. All the tested genes were suppressed by both AgNPs and RA (Figure 8A). In this study, we revealed that AgNPs regulate mRNA levels through changes in mRNA expression in F9 cells. Moreover, AgNPs are able to reduce the pluripotency of F9 cells by repressing pluripotency genes, thus inducing their differentiation into ectodermal cells. AgNPs could play an important role in inducing differentiation by epigenetic modifications through alteration of the expression of genes associated with DNA methylation, histone acetylation, and histone methylation, similar to RA.69 RA is known to be involved in a variety of processes during early embryonic development, including cell proliferation and differentiation and organogenesis.70
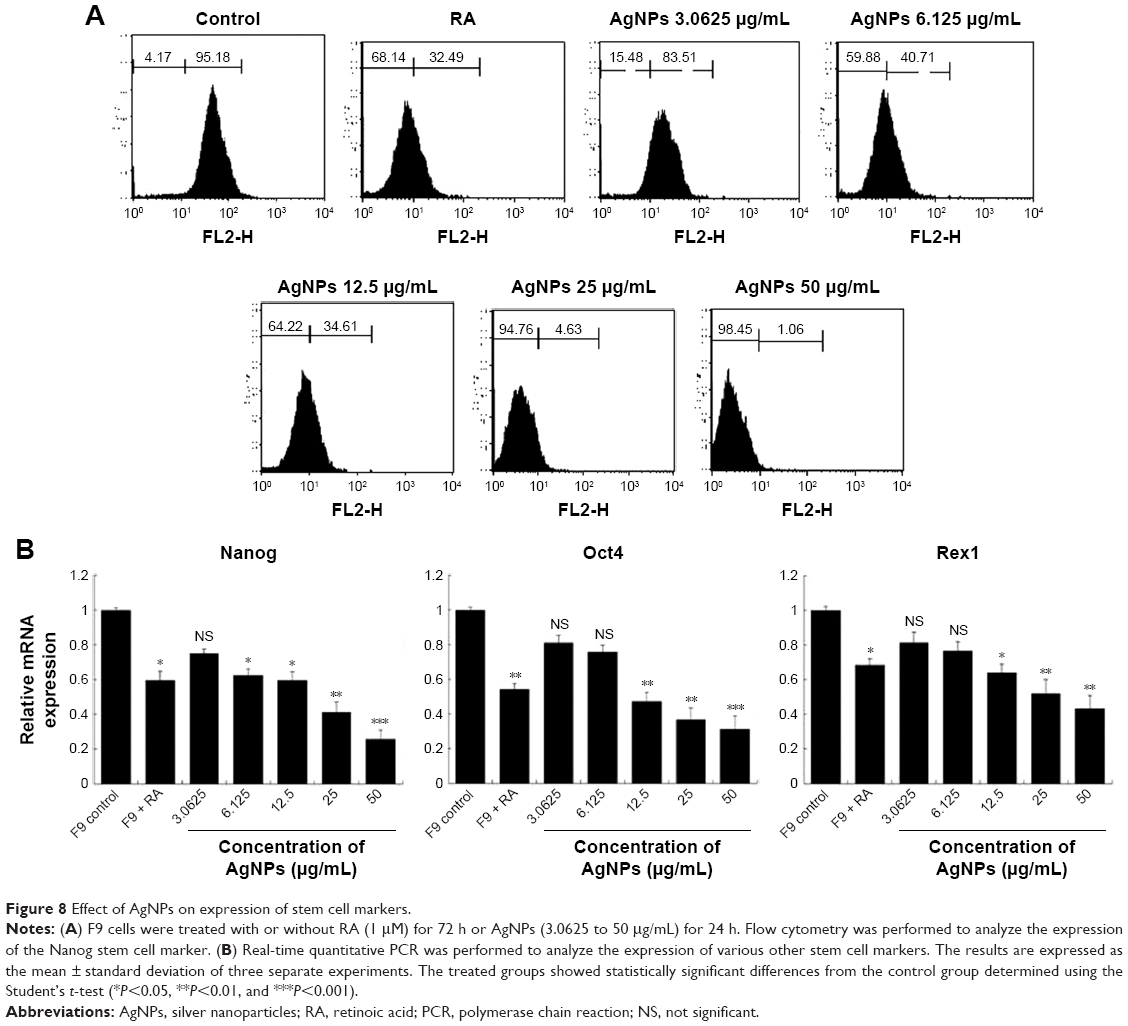 | Figure 8 Effect of AgNPs on expression of stem cell markers. |
Nanog, expressed in pluripotent cells, is required for the self-renewal of mouse embryonic stem cells (mESCs) and is essential for early embryonic development.71,72 Nanog is a highly divergent homeodomain-containing protein commonly accorded a central position in the transcriptional network of pluripotency.73–76 Nanog, Sox2, and Oct3/4 are critical transcription factors involved in ESC self-renewal and differentiation and play a significant role in tumorigenesis.77 Several clinical studies have shown the elevated expression of Nanog in a variety of cancers, including retinoblastoma,78 prostate cancer,79 and ovarian cancer, supporting our hypothesis,80 Piestun et al reported that Nanog overexpression promotes the proliferation and transformation of NIH3T3 cells.81 Collectively, previous studies demonstrated that the abnormal expression of Nanog in stem cells and tumor tissues plays a critical role in transformation, tumorigenicity, and metastasis. Therefore, we investigated whether the expression of Nanog changed during cell differentiation, by flow cytometry in F9 cells exposed to various concentrations of AgNPs. The results revealed that the expression of Nanog decreased significantly based on the concentration of AgNPs, compared to that in the control (Figure 8B), indicating that changes took place on the cell surface markers. The downregulation of Nanog upon treatment with AgNPs could facilitate the differentiation process. Nanog is expressed in pluripotent embryo cells, derivative ESCs, and the developing germline cells of mammals and birds.72,82–84 Forced expression of Nanog is sufficient to drive the cytokine-independent self-renewal of undifferentiated ESCs.82 Altogether, the results suggest that pluripotency markers such as Nanog, Oct4, and Rex1 are sensitive to AgNPs.
Cisplatin reduces the viability of F9 cells that underwent AgNPs-induced differentiation
Most cancers originate from a subset of self-renewing cells, which are responsible for establishing a tumor through continuous self-renewal and differentiation. The successful elimination of differentiated cells is an important goal for the development of effective strategies to reduce the level of cancer. Chemoresistance is a critical factor in cancer treatment. Therefore, developing new approaches is essential; differentiation therapy is one such attractive new approach. To determine the effect of cisplatin on differentiated F9 cells, the cells were first treated with two different concentrations of AgNPs (12.5 and 25 μg/mL); RA (1 μM) was used as the positive control. Interestingly, both concentrations of AgNPs induced differentiation within 24 h, whereas RA-treated cells showed differentiation only after 72 h. Cisplatin (1 μM) significantly inhibited the proliferation of the differentiated F9 cells after 24-h treatment with AgNPs (Figure 9). Moreover, the effect of cisplatin on the cells that underwent AgNPs- and RA-induced differentiation increased with the time of exposure, indicating that the killing effect of cisplatin is time- and dose-dependent. The severity of cancer depends on subset of self-renewing cells, primarily cancer stem cells (CSCs), which is the primary reason for chemoresistance in advanced stage of tumor through continuous self-renewal and differentiation. Therefore, elimination of CSCs is a primary factor in the development of effective strategies to achieve complete remission of cancers. Our findings suggest that AgNPs potentiated the effect of cisplatin on the cell viability of F9 cells, revealing that AgNPs have the capacity to resensitize cells to cisplatin cytotoxicity by directly/indirectly targeting CSCs. Hence, the data revealed that the combination of AgNPs and cisplatin could increase the anticancer efficacy against cancer stem-like cells.
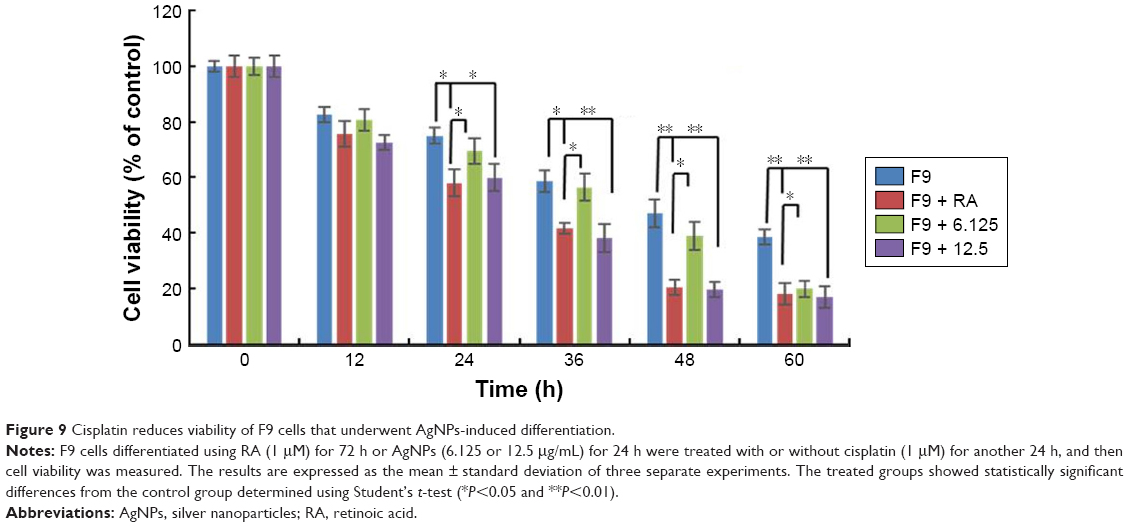 | Figure 9 Cisplatin reduces viability of F9 cells that underwent AgNPs-induced differentiation. |
Cisplatin reduces AgNPs-induced expression of various differentiation markers in F9 cells
The effect of cisplatin on several AgNPs-induced differentiation markers, including Gata6, Wnt-5, β-catenin, GSK-3, Rho, JNK, and p-p38, was investigated. Several intrinsic factors such as Gata4, Gata6, and Brachyury are a subset of transcription factors capable of inducing cellular reprograming and are critical for the early stages of differentiation to primitive endoderm and mesendoderm lineages.85 The F9 cells were treated with RA plus AgNPs at low (6.125 μg/mL) and high concentrations (12.5 μg/mL). Cells treated with AgNPs showed significantly higher expression of Gata6 compared to RA-treated cells, whereas F9 cells treated with RA and AgNPs at low and high concentrations plus cisplatin showed reduced expression of Gata6, which clearly indicates that cisplatin inhibits differentiation process by modulating Gata6 expression (Figure 10). The intensity of expression of various markers is shown in Figure 10B. Recently, Wamaitha et al reported that Gata6 is a multipurpose and potent reprograming factor, and Gata4 expression is uniquely sufficient to induce rapid reprograming of mESCs to induced embryonic endoderm stem cells.86 Several members of the Wnt gene family are expressed in very specific patterns in the embryonic mesoderm and have been involved in the regulation of hematopoiesis.87,88 Wnt5 signaling is critical for regulating normal developmental processes, including stem cell self-renewal, proliferation, differentiation, migration, adhesion, and polarity.89,90 Wnt factors are a group of these signaling molecules that act on stem cells within the stem cell niche to help maintain their capacity for self-renewal, and they can activate the β-catenin-dependent pathway.91,92 Similar to those of previous studies, our findings suggest that F9 cells treated with RA or AgNPs showed upregulation of Wnt5 expression, whereas F9 cells treated with RA or AgNPs in the presence of cisplatin showed reduced expression levels of Wnt5 and Gata6, which confirms that cisplatin inhibits the AgNPs-induced differentiation process via Wnt5 signaling. Yang et al reported that Wnt5a is involved in the endothelial differentiation of ESCs via both Wnt/β-catenin and PKC signaling pathways and regulates embryonic vascular development.93 Rho GTPases are involved in the self-renewal, multipotential differentiation ability, migration, and adhesion of stem cells.94 In this study, F9 cells treated with RA or AgNPs showed upregulation of Rho expression, whereas the cells treated with RA or AgNPs plus cisplatin exhibited reduced expression of Rho, which confirms that cisplatin inhibits the AgNPs-induced Rho activation of differentiation in F9 cells. Rho kinase is known to be involved in RhoA-induced cellular responses, including cytoskeletal rearrangement and smooth muscle cell differentiation.95,96 The JNK is a member of the MAPK group of signaling proteins.97 JNK is not required for the proliferation or self-renewal of ESCs, but it is required for their differentiation.97 Genome-wide location analysis revealed that JNK could bind to a large set of active promoters during the differentiation of stem cells into neurons.98 Binétruy et al reported that the MAPK pathways, such as the Erk, JNK, and p38 MAPK pathways, are involved in the regulation of differentiation of ESCs into mature cells.99 p38 MAPK is activated in established megakaryocytic cell lines and is involved in erythroid differentiation.100 Here, the tested MAPKs, namely JNK and p38, were upregulated in the F9 cells treated with RA, as well as in cells treated with low and high concentration of AgNPs, whereas the cells treated in the presence of cisplatin showed diminished expression levels of both JNK and p38. Altogether, these findings suggest that cisplatin inhibits AgNPs-induced expression of Gata6, Wnt-5, β-catenin, GSK-3, Rho, JNK, and p-p38 and eventually induces differentiation process. However, cisplatin is able to reduce the expression of differentiation markers induced by AgNPs.
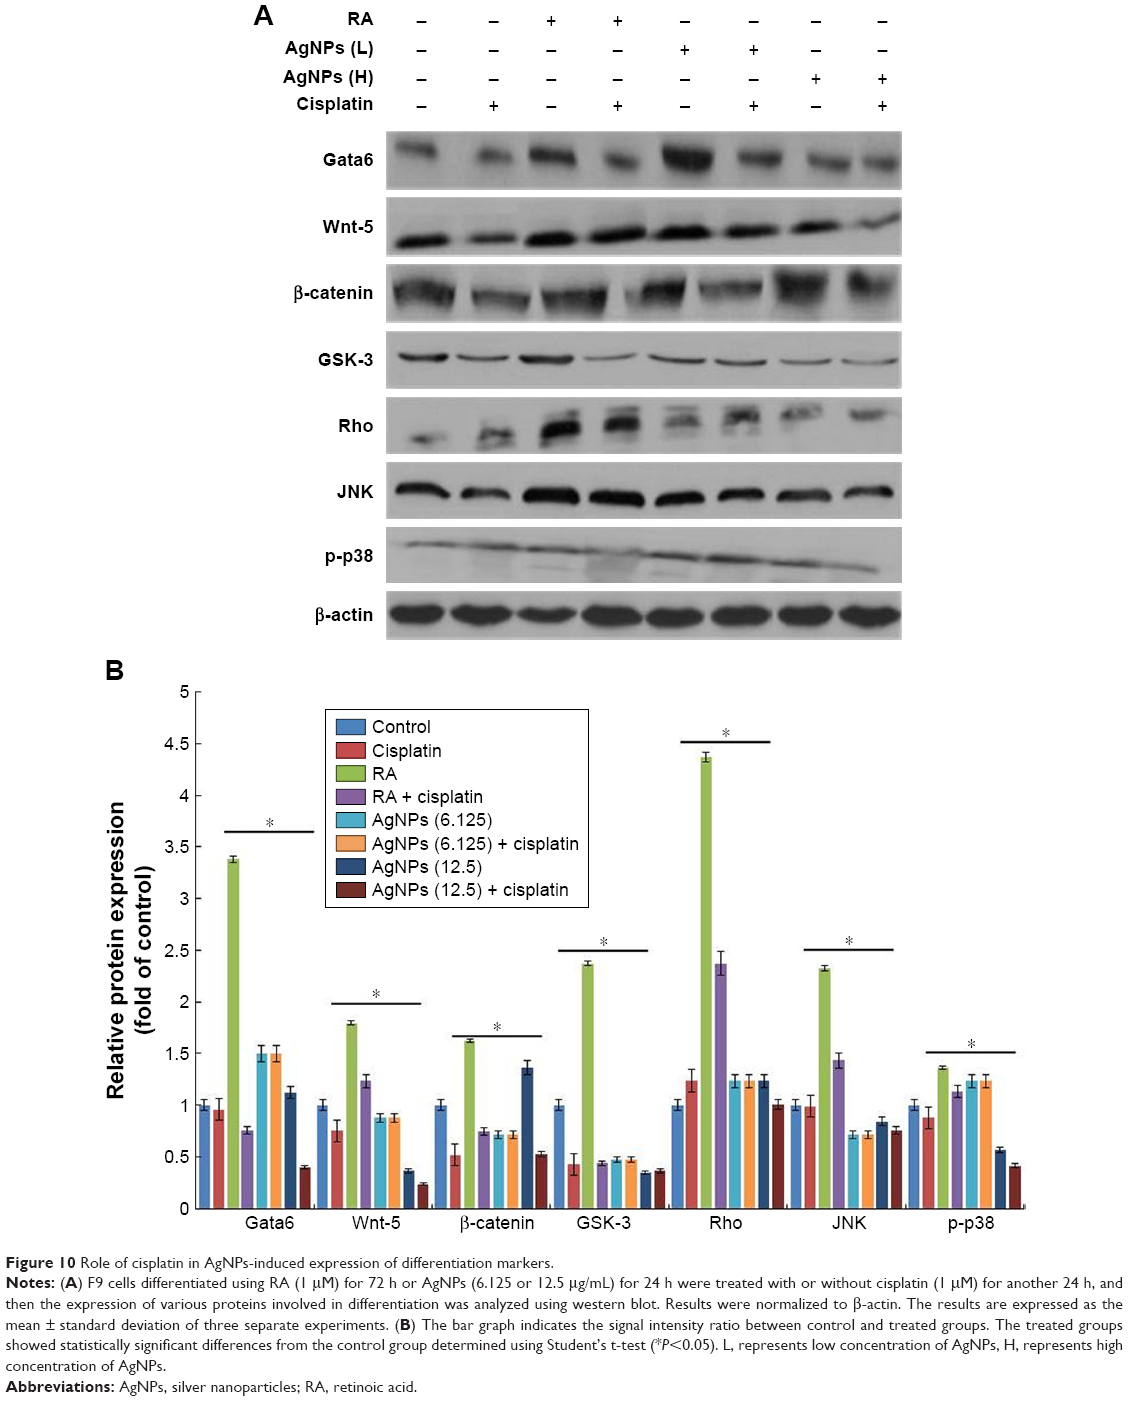 | Figure 10 Role of cisplatin in AgNPs-induced expression of differentiation markers. |
Inhibitory effect of cisplatin on AgNPs-modulated cell proliferation markers in F9 cells
Cell proliferation and differentiation show a remarkable inverse relationship, and differentiation usually coincides with proliferation arrest and permanent exit from the division cycle.101 The loss of differentiation can lead to a variety of diseases and is a hallmark of cancer cells. Therefore, we examined the expression of various markers involved in proliferation in the presence and absence of cisplatin, because cisplatin is known to inhibit proliferation in a variety of cancer cells. We examined the status of EGFR activation or deactivation in the presence of low and high concentrations of AgNPs, with cisplatin and without cisplatin. Signal transduction is the primary mechanism through which cells recognize and respond to an external stimulus. EGF and its corresponding receptor family have well-documented responses ranging from proliferation and survival to wound healing and migration.31,33 This is accomplished by activation of the EGFR signal transduction network through phosphorylation or dephosphorylation of downstream signaling targets such as PI3K/Akt and the Ras/Erk cascades.102 Similarly, Erk activation has been shown to control proliferation, regulation of mitosis, and cell differentiation.36 The F9 cells treated with RA or low and high concentrations of AgNPs showed increased total EGFR levels, whereas in the presence of cisplatin, the total EGFR was reduced. The phosphorylation status of EGFR significantly reduced in all tested samples, except with the high-concentration AgNPs. The status of Erk in F9 cells treated with RA showed increased basal levels of Erk, and no difference was observed between RA- and RA-plus-cisplatin-treated samples. The expression levels of total Erk and p-Erk were significantly reduced in both the cells treated with low and high concentration of AgNPs in the presence and absence of cisplatin, indicating that AgNPs play a critical role in the maintenance of the expression of Erk in cellular biological functions (Figure 11). However, no significant changes were observed in the level of Erk in AgNPs-treated cells. The intensity of expression of various proliferation markers is shown in Figure 11B. Interestingly, in the presence of cisplatin, the expression levels of all tested proliferation markers were significantly reduced. Human keratinocyte HaCaT cells exposed to AgNPs produced higher levels of ROS and disrupted EGF signaling, ultimately resulting in attenuated levels of Akt and Erk phosphorylation;34 therefore, disruption of signaling pathways depends on the size and metallic composition of the nanoparticles.
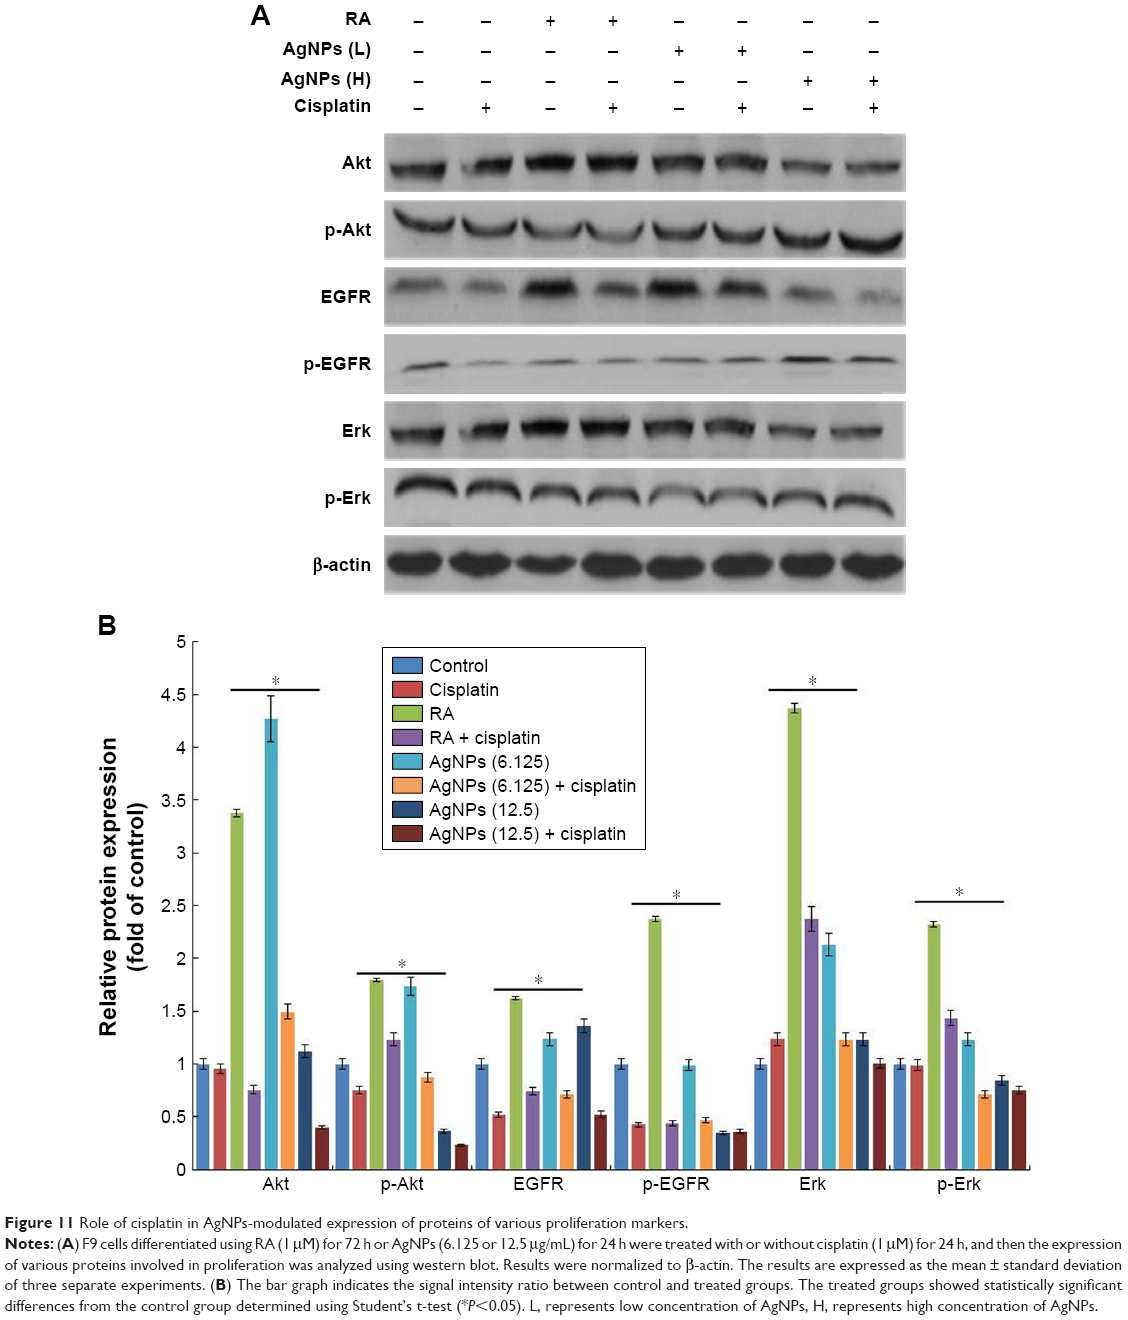 | Figure 11 Role of cisplatin in AgNPs-modulated expression of proteins of various proliferation markers. |
The primary aim of this experiment was to explore the effect of two different concentrations of AgNPs on various signaling molecules, and their interference in cellular perturbation was assessed through phosphorylation. The F9 cells were treated with RA or low and high concentrations of AgNPs in the presence of cisplatin, which is known to inhibit the proliferation of a variety of cancer cells. Akt kinases are involved in a variety of cellular processes including cell proliferation, survival, change in size, response to nutrient availability, tissue invasion, and angiogenesis.103 The F9 cells treated with RA showed upregulation of both Akt and p-Akt, whereas cells treated with low and high concentrations of AgNPs exhibited no significant difference in the expression of total Akt. Interestingly, in the cells treated with cisplatin, the expression level of Akt was unaffected; however, the level of p-Akt was slightly higher in RA-treated cells than in untreated cells. When the F9 cells were treated with low and high concentrations of AgNPs, the expression of total Akt was not significantly affected; however, when the cells were treated with low and high concentrations of AgNPs plus cisplatin, the total Akt expression was significantly reduced. The data suggest that AgNPs at concentrations of 12.5 and 25 μg/mL increase the phosphorylation of Akt, compared to that in untreated cells; however, in the presence of cisplatin, the phosphorylation of Akt is significantly reduced (Figure 11). The results clearly confirm that AgNPs play a critical role in the phosphorylation of Akt, which ultimately modulates the differentiation versus proliferation process. Glial cell line-derived neurotrophic factor promotes SSC proliferation in vitro via the SFK/PI3K/Akt pathway, which leads to the upregulation of N-myc.104 Bovine retinal endothelial cells treated with AgNPs with an average size of 50 nm showed reduced level of Akt phosphorylation, leading to inhibition of cell viability.105,106 Braydich-Stolle et al32 reported that at concentrations of 10 μg/mL and above, AgNPs induced a significant decline in SSC proliferation, which was also dependent on their size and coating. Comfort et al33 reported that AgNPs inhibited both p-Akt and p-Erk by approximately 20% via EGFR-dependent phosphorylation in human epithelial A-431 cells. In contrast, chronic exposure of HaCaT cells to AgNPs revealed higher levels of phosphorylation states for both Akt and Erk.34 The increase or decrease of cell proliferation via Akt phosphorylation depends on the size, shape, and surface coating of AgNPs. Collectively, these findings suggest that AgNPs play an important role in the differentiation process by modulating cell survival kinases by decreasing/increasing the expression of Akt, EGFR, and Erk. Furthermore, in the presence of cisplatin, the expression of survival proteins including total Akt, EGFR, and Erk is significantly reduced, which could favor the differentiation process by decreasing the proliferation process in F9 cells. Therefore, AgNPs could be suitable agents for both differentiation and inhibition of cell viability; however, all these events occur in a concentration-dependent manner.
Conclusion
AgNPs can be used in various biomedical applications, including antibacterial, anticancer, antiangiogenic, and anti-inflammatory agents, owing to their unique physical and chemical properties. In this study, we investigated the mechanism by which AgNPs exhibit cytotoxicity and regulate stem cell differentiation for therapeutic purposes. We prepared AgNPs, using a biological system as a template, and then characterized them using various analytical techniques. The synthesized AgNPs were spherical in shape with an average size of 20 nm. The AgNPs potentially induced apoptosis by regulating various cellular mechanisms, including the reduction of cell viability by increasing LDH and ROS levels, loss of ΔΨm, upregulation of the proapoptotic genes p53, p21, Bax, and caspase-9 and caspase-3, and downregulation of the antiapoptotic gene Bcl-2. Interestingly, the AgNPs induced neuronal differentiation by upregulating various biomarkers involved in differentiation, such as RBP, laminin B1, and collagen type IV, and downregulating various pluripotency markers, including Nanog, Sox2, and Oct3/4, which are critical transcription factors involved in self-renewal and differentiation. AgNPs could regulate both apoptosis and differentiation by modulating various signaling molecules in a concentration-dependent manner. Furthermore, the viability of cells that underwent AgNPs-induced differentiation was remarkably inhibited by cisplatin. Altogether, these results suggest that in cancer chemotherapeutic regimens, AgNPs can promote apoptosis and tumor cell differentiation in a concentration-dependent manner. These mechanistic studies of AgNPs signaling continue to suggest novel drug targets and will improve the therapeutic strategies for cancer and other neurodegenerative diseases. Our emerging knowledge of these molecular mechanisms could provide a rational basis for understanding the role of AgNPs in cancer therapy both as cytotoxic and neuronal differentiation-inducing agents for developing cytotoxicity- or differentiation-based cancer chemotherapies that could further support the potential therapeutic value of AgNPs for cancer.
Acknowledgments
This work was supported by WTU Joint Research Grants of Konkuk University.
Disclosure
The authors report no conflicts of interest in this work.
References
Chen X, Schluesener HJ. Nanosilver: a nanoproduct in medical application. Toxicol Lett. 2008;176(1):1–12. | ||
Ge L, Li Q, Wang M, Ouyang J, Li X, Xing MM. Nanosilver particles in medical applications: synthesis, performance, and toxicity. Int J Nanomedicine. 2014;9:2399–2407. | ||
Gurunathan S, Kalishwaralal K, Vaidyanathan R, et al. Biosynthesis, purification and characterization of silver nanoparticles using Escherichia coli. Colloids Surf B Biointerfaces. 2009;74(1):328–335. | ||
Zhang XF, Gurunathan S. Combination of salinomycin and silver nanoparticles enhances apoptosis and autophagy in human ovarian cancer cells: an effective anticancer therapy. Int J Nanomedicine. 2016;11:3655–3675. | ||
Shin SH, Ye MK, Kim HS, Kang HS. The effects of nano-silver on the proliferation and cytokine expression by peripheral blood mononuclear cells. Int Immunopharmacol. 2007;7(13):1813–1818. | ||
Park S, Lee YK, Jung M, et al. Cellular toxicity of various inhalable metal nanoparticles on human alveolar epithelial cells. Inhal Toxicol. 2007;19 Suppl 1:59–65. | ||
Han JW, Gurunathan S, Jeong JK, et al. Oxidative stress mediated cytotoxicity of biologically synthesized silver nanoparticles in human lung epithelial adenocarcinoma cell line. Nanoscale Res Lett. 2014;9(1):459. | ||
Soto K, Garza KM, Murr LE. Cytotoxic effects of aggregated nanomaterials. Acta Biomater. 2007;3(3):351–358. | ||
Hussain SM, Hess KL, Gearhart JM, Geiss KT, Schlager JJ. In vitro toxicity of nanoparticles in BRL 3A rat liver cells. Toxicol In Vitro. 2005;19(7):975–983. | ||
Zhang XF, Choi YJ, Han JW, et al. Differential nanoreprotoxicity of silver nanoparticles in male somatic cells and spermatogonial stem cells. Int J Nanomedicine. 2015;10:1335–1357. | ||
Han JW, Jeong JK, Gurunathan S, et al. Male- and female-derived somatic and germ cell-specific toxicity of silver nanoparticles in mouse. Nanotoxicology. 2016;10(3):361–373. | ||
Hussain SM, Javorina AK, Schrand AM, Duhart HM, Ali SF, Schlager JJ. The interaction of manganese nanoparticles with PC-12 cells induces dopamine depletion. Toxicol Sci. 2006;92(2):456–463. | ||
Gurunathan S, Han JW, Eppakayala V, Jeyaraj M, Kim JH. Cytotoxicity of biologically synthesized silver nanoparticles in MDA-MB-231 human breast cancer cells. Biomed Res Int. 2013;2013:535796. | ||
Gurunathan S, Han JW, Park JH, et al. Reduced graphene oxide-silver nanoparticle nanocomposite: a potential anticancer nanotherapy. Int J Nanomedicine. 2015;10:6257–6276. | ||
Kone BC, Kaleta M, Gullans SR. Silver ion (Ag+)-induced increases in cell membrane K+ and Na+ permeability in the renal proximal tubule: reversal by thiol reagents. J Membr Biol. 1988;102(1):11–19. | ||
Carlson C, Hussain SM, Schrand AM, et al. Unique cellular interaction of silver nanoparticles: size-dependent generation of reactive oxygen species. J Phys Chem B. 2008;112(43):13608–13619. | ||
Greulich C, Diendorf J, Simon T, Eggeler G, Epple M, Köller M. Uptake and intracellular distribution of silver nanoparticles in human mesenchymal stem cells. Acta Biomater. 2011;7(1):347–354. | ||
Park MV, Neigh AM, Vermeulen JP, et al. The effect of particle size on the cytotoxicity, inflammation, developmental toxicity and genotoxicity of silver nanoparticles. Biomaterials. 2011;32(36):9810–9817. | ||
Yan M, Liu Q. Differentiation therapy: a promising strategy for cancer treatment. Chin J Cancer. 2016;35:3. | ||
Murakami S, Tashiro F. Prospects of differentiation therapy for cancer stem cells. Adv Tech Biol Med. 2015;3:144. | ||
Qin H, Zhu C, An Z, et al. Silver nanoparticles promote osteogenic differentiation of human urine-derived stem cells at noncytotoxic concentrations. Int J Nanomedicine. 2014;9:2469–2478. | ||
Xu Y, Wang L, Bai R, Zhang T, Chen C. Silver nanoparticles impede phorbol myristate acetate-induced monocyte-macrophage differentiation and autophagy. Nanoscale. 2015;7(38):16100–16109. | ||
Zheng Z, Yin W, Zara JN, et al. The use of BMP-2 coupled – nanosilver-PLGA composite grafts to induce bone repair in grossly infected segmental defects. Biomaterials. 2010;31(35):9293–9300. | ||
Liu Y, Zheng Z, Zara JN, et al. The antimicrobial and osteoinductive properties of silver nanoparticle/poly(DL-lactic-co-glycolic acid)-coated stainless steel. Biomaterials. 2012;33(34):8745–8756. | ||
Liu X, He W, Fang Z, Kienzle A, Feng Q. Influence of silver nanoparticles on osteogenic differentiation of human mesenchymal stem cells. J Biomed Nanotechnol. 2014;10(7):1277–1285. | ||
Dayem AA, Kim B, Gurunathan S, et al. Biologically synthesized silver nanoparticles induce neuronal differentiation of SH-SY5Y cells via modulation of reactive oxygen species, phosphatases, and kinase signaling pathways. Biotechnol J. 2014;9(7):934–943. | ||
Alon N, Miroshnikov Y, Perkas N, Nissan I, Gedanken A, Shefi O. Substrates coated with silver nanoparticles as a neuronal regenerative material. Int J Nanomedicine. 2014;9 Suppl 1:23–31. | ||
Yuan TC, Veeramani S, Lin FF, et al. Androgen deprivation induces human prostate epithelial neuroendocrine differentiation of androgen-sensitive LNCaP cells. Endocr Relat Cancer. 2006;13(1):151–167. | ||
Valentini A, Biancolella M, Amati F, et al. Valproic acid induces neuroendocrine differentiation and UGT2B7 up-regulation in human prostate carcinoma cell line. Drug Metab Dispos. 2007;35(6):968–972. | ||
Martin GS. Cell signaling and cancer. Cancer Cell. 2003;4(3):167–174. | ||
Warren CM, Landgraf R. Signaling through ERBB receptors: multiple layers of diversity and control. Cell Signal. 2006;18(7):923–933. | ||
Braydich-Stolle LK, Lucas B, Schrand A, et al. Silver nanoparticles disrupt GDNF/Fyn kinase signaling in spermatogonial stem cells. Toxicol Sci. 2010;116(2):577–589. | ||
Comfort KK, Maurer EI, Braydich-Stolle LK, Hussain SM. Interference of silver, gold, and iron oxide nanoparticles on epidermal growth factor signal transduction in epithelial cells. ACS Nano. 2011;5(12):10000–10008. | ||
Comfort KK, Maurer EI, Hussain SM. Slow release of ions from internalized silver nanoparticles modifies the epidermal growth factor signaling response. Colloids Surf B Biointerfaces. 2014;123:136–142. | ||
Nicholson KM, Anderson NG. The protein kinase B/Akt signalling pathway in human malignancy. Cell Signal. 2002;14(5):381–395. | ||
Wortzel I, Seger R. The ERK cascade: distinct functions within various subcellular organelles. Genes Cancer. 2011;2(3):195–209. | ||
Gao P, Malbon CC. Differentiation of F9 teratocarcinoma stem cells to primitive endoderm is regulated by the Gialpha2/Gsalpha axis via phospholipase C and not adenylylcyclase. J Biol Chem. 1996;271(48):30692–30698. | ||
Sastry M, Mayya KS, Bandyopadhyay K. pH dependent changes in the optical properties of carboxylic acid derivatized silver colloidal particles. Colloids Surf A Physicochem Eng Asp. 1997;127(1–3):221–228. | ||
Sastry M, Patil V, Sainkar SR. Electrostatically controlled diffusion of carboxylic acid derivatized silver colloidal particles in thermally evaporated fatty amine films. J Phys Chem B. 1998;102(8):1404–1410. | ||
Gurunathan S, Jeong JK, Han JW, Zhang XF, Park JH, Kim JH. Multidimensional effects of biologically synthesized silver nanoparticles in Helicobacter pylori, Helicobacter felis, and human lung (L132) and lung carcinoma A549 cells. Nanoscale Res Lett. 2015;10:35. | ||
Jyoti K, Baunthiyal M, Singh A. Characterization of silver nanoparticles synthesized using Urtica dioica Linn. leaves and their synergistic effects with antibiotics. J Radiat Res Appl Sci. 2016;9(3):217–227. | ||
Kalimuthu K, Suresh Babu R, Venkataraman D, Bilal M, Gurunathan S. Biosynthesis of silver nanocrystals by Bacillus licheniformis. Colloids Surf B Biointerfaces. 2008;65(1):150–153. | ||
Jain D, Kachhwaha S, Jain R, Srivastava G, Kothari SL. Novel microbial route to synthesize silver nanoparticles using spore crystal mixture of Bacillus thuringiensis. Indian J Exp Biol. 2010;48(11):1152–1156. | ||
Kaviya S, Santhanalakshmi J, Viswanathan B, Muthumary J, Srinivasan K. Biosynthesis of silver nanoparticles using citrus sinensis peel extract and its antibacterial activity. Spectrochim Acta A Mol Biomol Spectrosc. 2011;79(3):594–598. | ||
Govender R, Phulukdaree A, Gengan RM, Anand K, Chuturgoon AA. Silver nanoparticles of Albizia adianthifolia: the induction of apoptosis in human lung carcinoma cell line. J Nanobiotechnology. 2013;11:5. | ||
Castiglioni S, Cazzaniga A, Perrotta C, Maier JA. Silver nanoparticles-induced cytotoxicity requires ERK activation in human bladder carcinoma cells. Toxicol Lett. 2015;237(3):237–243. | ||
Filomeni G, De Zio D, Cecconi F. Oxidative stress and autophagy: the clash between damage and metabolic needs. Cell Death Differ. 2015;22(3):377–388. | ||
Chen X, Zhong Z, Xu Z, Chen L, Wang Y. 2′,7′-Dichlorodihydrofluorescein as a fluorescent probe for reactive oxygen species measurement: forty years of application and controversy. Free Radic Res. 2010;44(6):587–604. | ||
Sriram MI, Kanth SB, Kalishwaralal K, Gurunathan S. Antitumor activity of silver nanoparticles in Dalton’s lymphoma ascites tumor model. Int J Nanomedicine. 2010;5:753–762. | ||
Park EJ, Yi J, Kim Y, Choi K, Park K. Silver nanoparticles induce cytotoxicity by a Trojan-horse type mechanism. Toxicol In Vitro. 2010;24(3):872–878. | ||
Avalos A, Haza AI, Mateo D, Morales P. Cytotoxicity and ROS production of manufactured silver nanoparticles of different sizes in hepatoma and leukemia cells. J Appl Toxicol. 2014;34(4):413–423. | ||
Kroemer G, Reed JC. Mitochondrial control of cell death. Nat Med. 2000;6(5):513–519. | ||
Suzuki N, Koussevitzky S, Mittler R, Miller G. ROS and redox signalling in the response of plants to abiotic stress. Plant Cell Environ. 2012;35(2):259–270. | ||
Jeong JK, Gurunathan S, Kang MH, et al. Hypoxia-mediated autophagic flux inhibits silver nanoparticle-triggered apoptosis in human lung cancer cells. Sci Rep. 2016;6:21688. | ||
Hsin YH, Chen CF, Huang S, Shih TS, Lai PS, Chueh PJ. The apoptotic effect of nanosilver is mediated by a ROS- and JNK-dependent mechanism involving the mitochondrial pathway in NIH3T3 cells. Toxicol Lett. 2008;179(3):130–139. | ||
Risom L, Møller P, Loft S. Oxidative stress-induced DNA damage by particulate air pollution. Mutat Res. 2005;592(1–2):119–137. | ||
Johnson NL, Gardner AM, Diener KM, et al. Signal transduction pathways regulated by mitogen-activated/extracellular response kinase kinase kinase induce cell death. J Biol Chem. 1996;271(6):3229–3237. | ||
Foldbjerg R, Olesen P, Hougaard M, Dang DA, Hoffmann HJ, Autrup H. PVP-coated silver nanoparticles and silver ions induce reactive oxygen species, apoptosis and necrosis in THP-1 monocytes. Toxicol Lett. 2009;190(2):156–162. | ||
Shiny PJ, Mukherjee A, Chandrasekaran N. DNA damage and mitochondria-mediated apoptosis of A549 lung carcinoma cells induced by biosynthesised silver and platinum nanoparticles. RSC Adv. 2016;6(33):27775–27787. | ||
Gurunathan S, Park JH, Han JW, Kim JH. Comparative assessment of the apoptotic potential of silver nanoparticles synthesized by Bacillus tequilensis and Calocybe indica in MDA-MB-231 human breast cancer cells: targeting p53 for anticancer therapy. Int J Nanomedicine. 2015;10:4203–4222. | ||
Jänicke RU, Sprengart ML, Wati MR, Porter AG. Caspase-3 is required for DNA fragmentation and morphological changes associated with apoptosis. J Biol Chem. 1998;273(16):9357–9360. | ||
Gopinath P, Gogoi SK, Sanpui P, Paul A, Chattopadhyay A, Ghosh SS. Signaling gene cascade in silver nanoparticle induced apoptosis. Colloids Surf B Biointerfaces. 2010;77(2):240–245. | ||
Dziedzic A, Kubina R, Bułdak RJ, Skonieczna M, Cholewa K. Silver nanoparticles exhibit the dose-dependent anti-proliferative effect against human squamous carcinoma cells attenuated in the presence of berberine. Molecules. 2016;21(3):365. | ||
Samberg ME, Loboa EG, Oldenburg SJ, Monteiro-Riviere NA. Silver nanoparticles do not influence stem cell differentiation but cause minimal toxicity. Nanomedicine (Lond). 2012;7(8):1197–1209. | ||
Pauksch L, Hartmann S, Szalay G, Alt V, Lips KS. In vitro assessment of nanosilver-functionalized PMMA bone cement on primary human mesenchymal stem cells and osteoblasts. PLoS One. 2014;9(12):e114740. | ||
Huang DM, Chung TH, Hung Y, et al. Internalization of mesoporous silica nanoparticles induces transient but not sufficient osteogenic signals in human mesenchymal stem cells. Toxicol Appl Pharmacol. 2008;231(2):208–215. | ||
Chung TH, Wu SH, Yao M, et al. The effect of surface charge on the uptake and biological function of mesoporous silica nanoparticles in 3T3-L1 cells and human mesenchymal stem cells. Biomaterials. 2007;28(19):2959–2966. | ||
Collins CA, Watt FM. Dynamic regulation of retinoic acid-binding proteins in developing, adult and neoplastic skin reveals roles for beta-catenin and Notch signalling. Dev Biol. 2008;324(1):55–67. | ||
Zhang J, Gao Y, Yu M, et al. Retinoic acid induces embryonic stem cell differentiation by altering both encoding RNA and microRNA expression. PLoS One. 2015;10(7):e132566. | ||
Wendling O, Ghyselinck NB, Chambon P, Mark M. Roles of retinoic acid receptors in early embryonic morphogenesis and hindbrain patterning. Development. 2001;128(11):2031–2038. | ||
Young RA. Control of the embryonic stem cell state. Cell. 2011;144(6):940–954. | ||
Mitsui K, Tokuzawa Y, Itoh H, et al. The homeoprotein Nanog is required for maintenance of pluripotency in mouse epiblast and ES cells. Cell. 2003;113(5):631–642. | ||
Cole MF, Johnstone SE, Newman JJ, Kagey MH, Young RA. Tcf3 is an integral component of the core regulatory circuitry of embryonic stem cells. Gene Dev. 2008;22(6):746–755. | ||
Boyer LA, Lee TI, Cole MF, et al. Core transcriptional regulatory circuitry in human embryonic stem cells. Cell. 2005;122(6):947–956. | ||
Loh YH, Wu Q, Chew JL, et al. The Oct4 and Nanog transcription network regulates pluripotency in mouse embryonic stem cells. Nat Genet. 2006;38(4):431–440. | ||
Wang J, Rao S, Chu J, et al. A protein interaction network for pluripotency of embryonic stem cells. Nature. 2006;444(7117):364–368. | ||
Okumura-Nakanishi S, Saito M, Niwa H, Ishikawa F. Oct-3/4 and Sox2 regulate Oct-3/4 gene in embryonic stem cells. J Biol Chem. 2005;280(7):5307–5317. | ||
Seigel GM, Hackam AS, Ganguly A, Mandell LM, Gonzalez-Fernandez F. Human embryonic and neuronal stem cell markers in retinoblastoma. Mol Vis. 2007;13:823–832. | ||
Bae KM, Su Z, Frye C, et al. Expression of pluripotent stem cell reprogramming factors by prostate tumor initiating cells. J Urol. 2010;183(5):2045–2053. | ||
Bapat SA, Mali AM, Koppikar CB, Kurrey NK. Stem and progenitor-like cells contribute to the aggressive behavior of human epithelial ovarian cancer. Cancer Res. 2005;65(8):3025–3029. | ||
Piestun D, Kochupurakkal BS, Jacob-Hirsch J, et al. Nanog transforms NIH3T3 cells and targets cell-type restricted genes. Biochem Biophys Res Commun. 2006;343(1):279–285. | ||
Chambers I, Colby D, Robertson M, et al. Functional expression cloning of Nanog, a pluripotency sustaining factor in embryonic stem cells. Cell. 2003;113(5):643–655. | ||
Lavial F, Acloque H, Bertocchini F, et al. The Oct4 homologue PouV and Nanog regulate pluripotency in chicken embryonic stem cells. Development. 2007;134(19):3549–3563. | ||
Yamaguchi S, Kimura H, Tada M, Nakatsuji N, Tada T. Nanog expression in mouse germ cell development. Gene Expr Patterns. 2005;5(5):639–646. | ||
Nagy A, Vintersten K. Murine embryonic stem cells. Methods Enzymol. 2006;418:3–21. | ||
Wamaitha SE, del Valle I, Cho LT, et al. Gata6 potently initiates reprograming of pluripotent and differentiated cells to extraembryonic endoderm stem cells. Gene Dev. 2015;29(12):1239–1255. | ||
Austin TW, Solar GP, Ziegler FC, Liem L, Matthews W. A role for the Wnt gene family in hematopoiesis: expansion of multilineage progenitor cells. Blood. 1997;89(10):3624–3635. | ||
Van Den Berg DJ, Sharma AK, Bruno E, Hoffman R. Role of members of the Wnt gene family in human hematopoiesis. Blood. 1998;92(9):3189–3202. | ||
Willert K, Brown JD, Danenberg E, et al. Wnt proteins are lipid-modified and can act as stem cell growth factors. Nature. 2003;423(6938):448–452. | ||
Zhou Y, Kipps TJ, Zhang S. Wnt5a signaling in normal and cancer stem cells. Stem Cells Int. 2017;2017:5295286. | ||
Moon RT, Bowerman B, Boutros M, Perrimon N. The promise and perils of Wnt signaling through beta-catenin. Science. 2002;296(5573):1644–1646. | ||
Zhou H, Mak PY, Mu H, et al. Combined inhibition of β-catenin and Bcr-Abl synergistically targets tyrosine kinase inhibitor-resistant blast crisis chronic myeloid leukemia blasts and progenitors in vitro and in vivo. Leukemia. Epub 2017 Apr 18. | ||
Yang DH, Yoon JY, Lee SH, et al. Wnt5a is required for endothelial differentiation of embryonic stem cells and vascularization via pathways involving both Wnt/beta-catenin and protein kinase Calpha. Circ Res. 2009;104(3):372–379. | ||
Nayak RC, Chang KH, Vaitinadin NS, Cancelas JA. Rho GTPases control specific cytoskeleton-dependent functions of hematopoietic stem cells. Immunol Rev. 2013;256(1):255–268. | ||
Chen CW, Montelatici E, Crisan M, et al. Perivascular multi-lineage progenitor cells in human organs: regenerative units, cytokine sources or both? Cytokine Growth Factor Rev. 2009;20(5–6):429–434. | ||
Miano JM, Long X, Fujiwara K. Serum response factor: master regulator of the actin cytoskeleton and contractile apparatus. Am J Physiol Cell Physiol. 2007;292(1):C70–C81. | ||
Xu P, Davis RJ. c-Jun NH(2)-terminal kinase is required for lineage-specific differentiation but not stem cell self-renewal. Mol Cell Biol. 2010;30(6):1329–1340. | ||
Tiwari VK, Stadler MB, Wirbelauer C, Paro R, Schübeler D, Beisel C. A chromatin-modifying function of JNK during stem cell differentiation. Nat Genet. 2011;44(1):94–100. | ||
Binétruy B, Heasley L, Bost F, Caron L, Aouadi M. Concise review: regulation of embryonic stem cell lineage commitment by mitogen-activated protein kinases. Stem Cells. 2007;25(5):1090–1095. | ||
Miyazaki R, Ogata H, Kobayashi Y. Requirement of thrombopoietin-induced activation of ERK for megakaryocyte differentiation and of p38 for erythroid differentiation. Ann Hematol. 2001;80(5):284–291. | ||
Ruijtenberg S, van den Heuvel S. Coordinating cell proliferation and differentiation: antagonism between cell cycle regulators and cell type-specific gene expression. Cell Cycle. 2016;15(2):196–212. | ||
Henson ES, Gibson SB. Surviving cell death through epidermal growth factor (EGF) signal transduction pathways: implications for cancer therapy. Cell Signal. 2006;18(12):2089–2097. | ||
Altomare DA, Testa JR. Perturbations of the AKT signaling pathway in human cancer. Oncogene. 2005;24(50):7455–7464. | ||
Braydich-Stolle L, Kostereva N, Dym M, Hofmann MC. Role of Src family kinases and N-Myc in spermatogonial stem cell proliferation. Dev Biol. 2007;304(1):34–45. | ||
Gurunathan S, Lee KJ, Kalishwaralal K, Sheikpranbabu S, Vaidyanathan R, Eom SH. Antiangiogenic properties of silver nanoparticles. Biomaterials. 2009;30(31):6341–6350. | ||
Kalishwaralal K, Banumathi E, Ram Kumar Pandian S, et al. Silver nanoparticles inhibit VEGF induced cell proliferation and migration in bovine retinal endothelial cells. Colloids Surf B Biointerfaces. 2009;73(1):51–57. |
 © 2017 The Author(s). This work is published and licensed by Dove Medical Press Limited. The full terms of this license are available at https://www.dovepress.com/terms.php and incorporate the Creative Commons Attribution - Non Commercial (unported, v3.0) License.
By accessing the work you hereby accept the Terms. Non-commercial uses of the work are permitted without any further permission from Dove Medical Press Limited, provided the work is properly attributed. For permission for commercial use of this work, please see paragraphs 4.2 and 5 of our Terms.
© 2017 The Author(s). This work is published and licensed by Dove Medical Press Limited. The full terms of this license are available at https://www.dovepress.com/terms.php and incorporate the Creative Commons Attribution - Non Commercial (unported, v3.0) License.
By accessing the work you hereby accept the Terms. Non-commercial uses of the work are permitted without any further permission from Dove Medical Press Limited, provided the work is properly attributed. For permission for commercial use of this work, please see paragraphs 4.2 and 5 of our Terms.