")
Back to Journals » International Journal of Nanomedicine » Volume 15
Dual-Effect of Magnetic Resonance Imaging Reporter Gene in Diagnosis and Treatment of Hepatocellular Carcinoma
Authors Zhou J, Zhou Q, Shu G, Wang X, Lu Y, Chen H, Hu T, Cai J, Du Y, Yu R
Received 16 April 2020
Accepted for publication 10 August 2020
Published 30 September 2020 Volume 2020:15 Pages 7235—7249
DOI https://doi.org/10.2147/IJN.S257628
Checked for plagiarism Yes
Review by Single anonymous peer review
Peer reviewer comments 2
Editor who approved publication: Dr Mian Wang
Jiaping Zhou,1 Qiaomei Zhou,1 Gaofeng Shu,2 Xiaojie Wang,1 Yuanfei Lu,1 Haiyan Chen,1 Tingting Hu,1 Jinsong Cai,1 Yongzhong Du,2 Risheng Yu1
1Department of Radiology, Second Affiliated Hospital, School of Medicine, Zhejiang University, Hangzhou 310009, People’s Republic of China; 2Institute of Pharmaceutics, College of Pharmaceutical Sciences, Zhejiang University, Hangzhou 310058, People’s Republic of China
Correspondence: Yongzhong Du
Institute of Pharmaceutics, College of Pharmaceutical Sciences, Zhejiang University, 866 Yuhangtang Road, Hangzhou 310058, Zhejiang Province, People’s Republic of China
Tel +86 571 8820 8435
Email [email protected]
Risheng Yu
Department of Radiology, Second Affiliated Hospital, School of Medicine, Zhejiang University, 88 Jiefang Road, Hangzhou 310009, Zhejiang Province, People’s Republic of China
Tel +86 571 8778 3925
Email [email protected]
Propose: The early diagnosis of hepatocellular carcinoma (HCC) with ferritin heavy chain (Fth) modified by alpha-fetoprotein (AFP) promoter has been studied. However, no study has focused on the considerable upregulation and specific targeting effects of transferrin receptors (TfR) caused by the transfection of plasmids encoded with the AFP promoter. Thus, the objective of our study was to investigate whether the transfection of Fth gene modified with AFP promoter (AFP@Fth) could be used for early diagnosis and enhanced treatment of HCC.
Methods: The AFP@Fth plasmid was transfected into AFP positive cells. The expression of intracellular Ferritin was verified by Western blot, and the upregulation of TfR was confirmed by immunofluorescence and flow cytometry analysis. Cellular iron accumulation resulting in decreased imaging signals was examined by magnetic resonance imagining. Doxorubicin liposome modified with transferrin (Tf-LPD) was prepared to investigate the efficiency of the subsequent treatment after transfection. The enhanced drug distribution and effects were investigated both in vitro and in vivo.
Results: Both Ferritin and TfR were overexpressed after transfection. The transfected cells showed higher intracellular iron accumulation and resulted in a lower MR T2-weighted imaging (T2WI) intensity, suggesting that the transfection of AFP@Fth could be a potential strategy for early diagnosis of liver cancer. The following treatment efficacy was revealed by Tf-LPD. As compared with un-transfected cells, transfected cells exhibited higher uptake of transferrin-modified liposomes (Tf-LP), which was due to the specific interaction between Tf and TfR overexpressed on the transfected cells. This is also the reason why Tf-LPD showed better in vitro and in vivo anticancer ability than doxorubicin loaded liposome (LPD). These results suggested that transfection of AFP@Fth could result in enhanced therapy of liver cancer.
Conclusion: Transfection of AFP@Fth could be used for early diagnosis and for enhanced treatment of live cancers.
Keywords: AFP promoter, magnetic resonance imaging, transferrin, targeted drug delivery, hepatocellular carcinoma
Introduction
Hepatocellular carcinoma (HCC) is one of the leading causes of cancer mortality worldwide.1,2 The five-year survival rate of patients with HCC has gradually increased with the development of treatment management; however, its incidence and mortality are still steadily rising.3–6 In contrast, many patients are diagnosed at an advanced stage because of the lack of early diagnostic methods, thereby losing the opportunity to receive radical surgery or transcatheter arterial chemoembolization (TACE).2,7,8 In this situation, chemotherapy is still an important therapeutic approach.9–11 Thus, early diagnosis and effective follow-up treatment are desirable to improve the prognosis of patients with HCC.
Dynamic contrast-enhanced magnetic resonance imaging (MRI) is a reliable method for the diagnosis of HCC. In contrast-enhanced MRI, contrast agents are used to obtain clear observations. Molecular imaging, which is a promising method, makes a significant contribution to the contrast agents for early diagnosis.12,13 Currently, the most studied contrast agents are exogenous contrast agents, including gadopentetate dimeglumine and superparamagnetic iron oxide (SPIO).14 However, the utilization of exogenous contrast agents still faces challenges because they can be highly accumulated in bones and the kidneys, thereby causing unsatisfactory side effects. Furthermore, the exogenous contrast agents can be progressively diluted by cell division, thereby negatively affecting their sensitivity. Moreover, they often provide false positive outcomes due to cell death.15–18 Hence, increasing studies are now turning to endogenous contrast agents for early diagnosis, such as the MR reporter gene.
As one of the MR reporter genes, Ferritin heavy chain (Fth) has been confirmed to be a good candidate because of its excellent ability to image tumors.19–22 Fth shows little cellular toxicity and can persistently produce a reduction of the signal intensity in MRI without fading over time.12,20,23 The intracellular overexpression of Fth could induce iron deficient mechanisms, including expression of transferrin receptor (TfR) and increased iron uptake, which directly reduce the signal intensity in MR T2WI and makes it possible for Fth to be a promising MR endogenous contrast agent.24 However, no studies have reported another important role of Fth as a magnetic resonance contrast agent. That is, enhanced site-specific drug delivery driven by the induced expression of TfR of these above mechanisms during imaging.
To analyze the precise imaging results in tumors, the reporter gene is always modified with a promoter. Promoters are typically tumor-phenotypic related proteins that are responsible for initiating subsequent gene transcription in specific cells, such as HER2 and alpha-fetoprotein (AFP).15,16,25 AFP is positively expressed in 80% of HCC cases.26,27 Thus, AFP was selected as the promoter to regulate Fth expression in AFP-positive hepatoma cells, and an AFP@Fth plasmid was constructed to verify the iron deficiency mechanisms during the imaging process. With the specific expression of the reporter gene, the subsequent therapeutic effect will also be observed in AFP-positive liver cancer cells specifically.
In our previous research, we reported the diagnosis results of AFP@Fth plasmid in HCC. In this study, we investigated enhanced therapeutic efficacy based on the TfR induced expression caused by the transfection of AFP@Fth. As mentioned above, TfR is upregulated to satisfy the iron requirements after overexpression of Fth. TfR is widely distributed on the cell surface and is as an important component of iron homeostasis to regulate the import of holo-transferrin. As reported, TfR is overexpressed on the surface of cancer cells compared to that on the surface of normal cells because of the rapid proliferation and the increased iron demand in malignant tumors.28,29 We explore the subsequence specific delivery based on the overexpression of TfR containing both the abnormal distribution in tumor cells and induced expression via transfection.
Transferrin (Tf) is considered to be the most suitable ligand for targeted drug delivery into cancer cells.29–31 The following therapeutic efficacy was assessed using Tf-modified liposomes; liposomes have numerous advantages such as non-toxicity, stability, easy modification, biodegradability, and economic feasibility.32,33 Liposomes are a widely studied carrier with good affinity with the cell membrane. The hollow structure of liposomes makes it easier to pack anti-tumor drugs. To explore the clinical potential of this enhanced targeting capability, anti-tumor drugs were encapsulated in liposomes for subsequent targeted therapy. Doxorubicin (DOX) is a widely used drug in clinical treatment because of its broad antitumor spectrum.34,35 However, DOX also produces serious adverse reactions, such as cardiotoxicity and bone marrow suppression.36–38 Thus, encapsulating DOX within a carrier to increase the accumulation of drugs at the lesion site and to reduce the distribution to normal tissues is necessary. As mentioned above, Tf-modified DOX loaded liposome (Tf-LPD) was synthesized to explore the enhanced therapeutic efficacy on the basis of overexpressed TfR.
The purpose of this study was to assess the enhanced specific therapeutic effect caused by the upregulated TfR via AFP@Fth transfection (Scheme 1). Many previous studies have focused on Fth as an MR endogenous contrasting agent. The results of using AFP@Fth as an MRI contrast agent were revealed in our previous study. However, the enhanced therapeutic effect induced by AFP@Fth transfected expression has not been revealed in HCC to date. The process of induction of iron deficiency mechanisms was studied, including the specific expression of plasmid, overexpression of Fth, up-regulation of receptor, and higher intracellular iron accumulation. Furthermore, the subsequent targeting ability and anti-tumor effect based on these mechanisms were evaluated both in vitro and in vivo using Tf-modified liposomes.
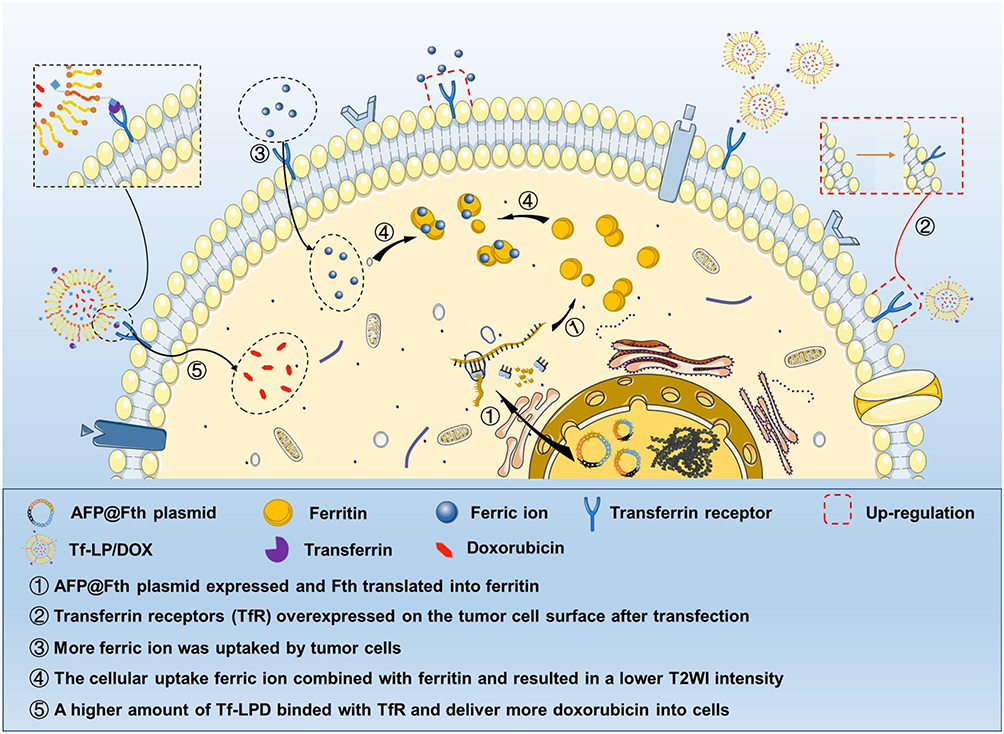 |
Scheme 1 Schematic illustration of molecular imaging diagnosis and subsequent enhanced treatment using the AFP@Fth plasmid. Notes: Schematic illustration of molecular imaging diagnosis and subsequent enhanced treatment achieved in HepG2 cells via AFP@Fth plasmid. The plasmid specifically promoted Fth in HepG2 cells, and overexpressed Fth caused up-regulation of TfR expression, which increased intracellular iron accumulation and resulted in the lower signal intensity on MR T2WI. Tf-LPD was administrated 2 days after AFP@Fth transfection which targeted the overexpressed TfR and delivered doxorubicin into HepG2 cells.Abbreviations: AFP@Fth, alpha-fetoprotein promoter Ferritin heavy chain plasmid; TfR, transferrin receptor; MR T2WI, magnetic resonance T2 weighted imaging; Tf-LPD, transferrin modified doxorubicin liposome. |
Materials and Methods
Reagents
Hydrogenated soybean phospholipid (HSPC) was purchased from Advanced Vehicle Technology L.T.D. Co, Ltd (Shanghai, China), Human holo Transferrin (T4132), Branched PEI (25kD) were obtained from Sigma-Aldrich Inc (St. Louis, MO, USA). Cholesterol, 1.2-distearoyl-sn-glycero-3-phosphoethanolamine PEG Maleimide (DSPE-PEG-Mal), Tris (2-carboxyethyl) phosphine Hydrochloride (TCEP), Doxorubicin hydrochloride (DOX), 3-(4,5Dimethylthiazol- yl)-2,5Dimethylthiazol-2-yl)-2,5diphenyltetrazolium bromide (MTT), fluorescein isothiocyanate (FITC) were purchased from Aladdin Reagent Database Inc (Shanghai, China). 2-Iminothiolane hydrochloride (Traut’s reagent) was purchased from Yuanye Bio-Technology Co, Ltd (Shanghai, China). 4ʹ,6–15 diamidino-2-phenylindole (DAPI) was purchased from Beyotime Biotechnology (Shanghai, China). Indocyanine green (ICG) was obtained from Tokyo Chemical Industry Co, Ltd (Tokyo, Japan). Octadecylamine (ODA, 95%) was purchased from Fluka, USA. The AFP@Fth plasmid, encoding an AFP promoter and Ferritin heavy chain, was synthesized by Shanghai Genechem Co, Ltd (Shanghai, China) according to the Fth gene sequence in GenBank (NM_013233). Anti-AFP antibody and anti-Ferritin heavy chain antibody were purchased from Abcam (Abcam, Cambridge, UK, ab65080). Fluorescein isothiocyanate conjugated anti-human CD71 (anti-TfR) was purchased from eBioscience, Inc. (San Diego, CA, USA). All other chemicals and solvents were of analytical or chromatographic grade. Deionized water (18.4 MΩ cm) used in all experiments was prepared using a Milli-Q system (Millipore, Boston, USA) and was used in all experiments.
Cell Culture
HepG2 cell line and LO2 cell line were obtained from the Chinese Academy of Sciences cell bank (Shanghai, China). HepG2 cell line was AFP positive human hepatocellular carcinoma cell, LO2 cell line was human hepatocytes. Cells were cultured in Dulbecco’s Modified Eagle Medium (Gibco, USA) supplemented with 10% FBS (Gibco, USA) and 1% penicillin-streptomycin (Gibco, USA) in a 37 °C incubator with 5% CO2. Cells were subcultured regularly using trypsin/EDTA (Meilune, China).
Mice
BALB/C nude female mice aged 4–5 weeks had 16 ± 2 g weights and were obtained from Zhejiang Medical Animal Centre (Hangzhou, China), which were housed with free access to water and food. All the animal experiments were in line with the ARRIVE guidelines and were carried out according to the National Institutes of Health (NIH, USA) protocols, approved by the guidelines of the Ethical Committee of Zhejiang University.
Synthesis of Transferrin-Functionalized DSPE-PEG2000-Mal
Transferrin-functionalized DSPE-PEG2000-Mal (DSPE-PEG2000-Tf) was synthesized as reported previously.39 Tf and EDTA boric acid buffer containing Traut’s reagent were mixed and incubated in the dark for 1 h on a rotational shaker at 110 rpm, and then, dialyzed overnight in a 0.1 mM TCEP solution; dialysis of external fluid was performed to separate the excessive Traut’s reagent. Then, thiolated Tf was added into DSPE-PEG-Mal solution drop by drop and allowed to react for 8 h under a water bath at 37 °C with gentle agitation, which allowed the conversion of mercapto and amino groups. Eventually, dialysis was performed to purify DSPE-PEG2000-Tf.
1H NMR Measurement of DSPE-PEG-Tf
The composition and structure of DSPE-PEG-Tf were confirmed by 1H-NMR spectroscopy. The same amounts of DSPE-PEG-Mal, Tf, and DSPE-PEEG-Tf were dissolved in 0.7 mL chloroform-d in NMR tubes. The 1H NMR spectra were recorded using a 400-MHz spectrometer (Inova 400, Varian, USA) at 25 °C.
Preparation of Tf-LPD
Liposomes were prepared using a previously published method with slight modifications.40 Briefly, the liposomes were prepared using HSPC: cholesterol: DSPE-PEG2000-Mal at a molar ratio of 6:3:0.6. The lipids were dissolved in mixed organic solvent of chloroform: methanol (2:1 v/v) and dried to a thin lipid film in a round-bottom flask on a rotary evaporator at 53°C. Then, the formed lipid film was hydrated with ammonium sulfate buffer (250 mM, PH 8.5) at 53 °C. The monolayer liposomes were treated with an ultrasonic cell crusher (JY92-II, Ningbo Scientz Biotechnology Co, Lab). The obtained liposomes were then dialyzed to remove the non-entrapped ammonium sulfate. The liposomes were extruded through a polycarbonate membrane of pore size 0.2 µm once to make the liposomes more homogeneous.
DOX was encapsulated into the liposomes using the ammonium sulfate gradient method. Briefly, the ammonium sulfate liposome suspension was poured in a penicillin bottle in water bath and magnetically stirred at 60 °C. Subsequently, DOX powder was added to the liposome suspension to achieve a drug to PL ratio of 1/10 (w/w). The solution was stirred at 60 °C softly for 1 h and then dialyzed in deionized water to remove free DOX. The encapsulation of ICG was the same as DOX. DSPE-PEG2000-Tf was added into LPD with slight agitation under 37 °C for 1 h in addition to the Tf modified liposome. The preparation of FITC labeled liposomes (LPFITC) was similar to that of the usual blank liposomes. HSPC: cholesterol: DSPE-PEG2000-Mal was used at a molar ratio of 6:3:0.6, including 5% FITC-ODA of the total lipids. The following steps were as mentioned above.
Physical Characterization of the Samples and Morphology
The particle size and size distribution were measured by Dynamic light scattering (DLS, Zetasizer, Malvern Co., UK). The morphology of the microspheres was observed by transmission electron microscopy (JEM-1200EX, JEOL, Japan). The morphologies of LPs, LPD, Tf-LP, and Tf-LPD were also observed by transmission electron microscopy. The samples were prepared as follows: 10 µL of the appropriate diluted solution was dropped on the 200-mesh copper grid coated with carbon, and excess solution was absorbed on a filter paper after 2 min. Then, an appropriate amount of uranium acetate dye was added on the copper grid, which was left for approximately 20 s before wiping and for observation.
Drug Loading and Encapsulation Efficiency
The standard DOX curve was quantified over the concentration range of 0.1–2.0 μg/mL using a fluorescence spectrophotometer (F-2500, Hitachi Co, Japan), and the curve was obtained by linear regression analysis. Encapsulation efficiency (EE) and drug loading (DL) were determined by a centrifugal ultrafiltration method. Briefly, the liposome solution was disrupted by methanol, and the total DOX content was quantified by a fluorescence spectrophotometer at an excitation wavelength of 476 nm and the slit widths were 10 nm (excitation) and 5 nm (emission). Then, the unencapsulated DOX dissolved in water was separated through an ultrafiltration tube (MW: 3.5 kDa), and the content was measured again. These fluorescence absorption values were converted to drug concentrations using the standard curve, and then, the DL and EE were calculated by the following formulas:
DL% = (total mass of drug- the mass of unencapsulated drug)/mass of loaded liposomes × 100%
EE% = (total mass of drug- the mass of unencapsulated drug)/total mass of drug × 100%
Drug Release
The in vitro drug release from the liposomes was evaluated by dialysis using phosphate buffered saline (PBS, pH 7.4) as a dissolution medium. Briefly, 500 μL LPD and Tf-LPD were added to a dialysis bag (MWCO 3.5 kDa, Spectrum Laboratories, Laguna Hills, Canada) and dialyzed against PBS under sinking conditions using an incubator shaker (HZ-8812S, Scientific and Educational Equipment Plant, Taicang, China) at 110 rpm and 37 °C. At predetermined time points, the media were collected and replaced with fresh buffer solution. The drug content in the release medium was detected using a fluorescence spectrophotometer.
Western Blotting for AFP and Ferritin Expression
The Ferritin expression was confirmed by Western blotting assay. HepG2 cells were incubated for 48 h after transfection using 80 µL RIPA buffer containing protease inhibitor (Sigma, USA) to lyse the cells in a 6-well plate on ice for 30 min. After centrifuging and collecting the cells in EP tubes, the protein concentration was evaluated by the bicinchoninic acid assay. The protein solution was added to 5* loading buffer in a ratio of 4:1 and denatured in a boiling water bath for 15 min. Then, the samples were loaded onto 12% gels for sodium dodecyl sulphate polyacrylamide gel electrophoresis (SDS-PAGE). The cut gels including the molecular weight between 21KD (Ferritin heavy chain) and 42KD (β-actin) were transferred onto PVDF membranes for blotting. The membranes were blocked with 5% skim milk powder solution for 2 h at 37 °C and then incubated overnight at 4 °C with rabbit anti-Ferritin monoclonal antibody (1:2000, Abcam). The membranes were incubated with horseradish peroxidase-conjugated goat anti-rabbit IgG (1: 5000, Boster) for 1 h after thoroughly washing with TBST buffer. Eventually, the proteins of interest were visualized using enhanced chemiluminescence (ECL).
The confirmation of AFP expression was similar to that of Ferritin. AFP samples were loaded onto 15% gels for SDS-PAGE and incubated with an anti-AFP monoclonal antibody (1:2000, Abcam) overnight.
Immunofluorescence Assay and Flow Cytometry for TfR Expression
Cells were cultured in 24-well plates containing coverslips for 24 h before transfection. After 48 h post-transfection, the cells were washed with PBS and then fixed by 4% paraformaldehyde (PFA) for 10 min. Immediately after fixation, 5% normal goat serum was used for blocking at 37 °C for 1 h. To verify the upregulation of TfR, the cells were incubated with a rabbit anti-TfR monoclonal antibody (1:100, Abcam, UK) at 4 °C overnight and then incubated with a DyLight 488-conjugated goat anti-rabbit secondary antibody (1:200, Boster, USA) for 1 h. The cell nucleus was counterstained with DAPI (1:1000, Beyotime, China). Then, the coverslips were removed from the plate, fixed on glass slides, and finally, examined using laser confocal microscopy (Olympus, Japan).
To further quantitatively detect the overexpression of TfR, flow cytometric analysis of HepG2 cells were performed. HepG2 cells were washed three times with PBS containing 0.1% bovine serum albumin and blocked with normal mouse serum at 4°C for 60 min prior to staining. A total of 1x10⁶ cells were incubated with fluorescein isothiocyanate conjugated anti human CD71 (anti-TfR) at 4°C for 30 min and were subsequently washed three times with PBS containing 0.1% bovine serum albumin. The cells were subsequently analyzed using a flow cytometer (ACEA NovoCyteTM; ACEA Biosciences, USA). The cells without the administration of fluorescein isothiocyanate conjugated anti-human CD71 (anti-TfR) and transfection were used as a negative control.
MRI Study in vitro
MRI was used to observe the level of intracellular iron loading after Fth gene transfection. Half of the 24h-transfection and 48h-transfection groups were administered FAC. Twelve hours after transfection, 0.5 mM FAC was added to the cultured medium of the FAC (+) group and co-incubated with cells for 12 h and 36 h. After washing with PBS thrice to remove free iron, cells were fixed in 4% PFA for 10 min and dissociated with 0.5 mL trypsin per well. The dissociated cells were centrifugated and transferred to 500 µL EB tubes in suspension. The cells were centrifugated once again and finally suspending in 10 µL PBS in EP tubes and filled with 1% un-solidified agarose solution in each tube.21,41,42 T2*-weighted imaging (T2*WI), T2WI, and T2 values were acquired using T2 fast spin-echo and ESWAN sequences by a 3.0-T MR (GE Discovery MR750, USA). FSE sequence: repetition time (TR) = 3070.0 ms, echo time (TE) = 96.6 ms, and slice thickness = 1.0 mm; ESWAN sequence: TR = 52.3 ms, TE = 6.5–30.2 ms, and slice thickness = 1.0 mm.
Cellular Uptake of Transferrin Modified Particles in vitro
To investigate the targeting ability of Tf-LPD toward the transfected AFP positive cell line, cellular uptake of Tf-LPD and LPD with or without transfection in the HepG2 cell line was observed. Cells cultured in 24-well plates were divided into two equal parts; one-half wells were used for transfection while the other half were not. After 48 h of transfection incubation, the same amount of Tf-LPD and LPD was added to the two group of cells, respectively and further for 0.5 h, 2 h, 4 h, 8 h, and 12 h. Finally, the fluorescence signals inside the cells were examined by inverted fluorescence microscopy and were also semi-quantified by Image J. For quantitative investigation, the cells were resuspended in PBS and fluorescence intensity was determined by flow cytometry (ACEA NovoCyteTM; ACEA Biosciences, USA), with the untreated cells as the negative control group.
Cytotoxicity of Doxorubicin Loaded Liposomes and Blank Liposomes
Cells were planted in 96-well plates and cultured in a 37 °C incubator with 5% CO2 for 24 h. The transfection group was allowed to incubate for 48 h, followed by rinsing with PBS; then, the culture medium was replaced by 200 µL fresh media containing serial dilutions of Tf-LPD and LPD, and the cells were cultured for 24 h. Then, 20 µL of a 5 mg/mL MTT stock solution was added to each well. Four hours later, unreacted dyes were carefully removed by aspiration, and 150 µL DMSO was added to each well to dissolve the formazan crystals. After 10 min of low-speed oscillation, the OD value was measured using a Microplate reader (Bio-Rad, Model 680, USA) at a wavelength of 570 nm. Wells that contained only medium and cells without intervention were set as the control group. The cells from the LP group and Tf-LP group were added to the wells after culturing for 24 h, and then the OD value was measured.
Transfection in vivo
The equal amount of plasmid that has mixed with PEI for 30 minutes was given to the transfected group two days before the drug was administered, and then intratumorally injected for transfection, which was set for 24, 48 h. Finally, the tumors were ground into a slurry for WB detection to observe the expression of Fth; liver tissues were also used as a control.43
Targeting Ability of Transferrin-Modified Particles in vivo
HepG2 cells (1 × 10⁶ cells/0.2 mL) were subcutaneously injected into in the right axillary region of female BALB/C nude mice (Zhejiang University, Hangzhou, China), and 0.2 mL Tf-LP/ICG and LP/ICG was given to the different groups by tail vein injection when the tumor volume reached approximately 100 mm3. The in vivo distribution was observed through a whole-body fluorescent imaging system.
Anti-Tumor Effect in Mice
After successful tumor modeling, mice bearing tumors of approximately 100 mm3 were used in this study; the nude mice were randomly divided into 6 groups of five to six (Figure 5A). Two of the groups were transfected, and Tf-LPD and LPD were administrated separately. Tf-LPD and LPD were also given to another two groups, but no transfection pretreatment was performed. The remaining two groups were the free DOX group and the saline group. Tf-LPD and LPD were administered to each group of mice every 5 days at a single dose of 4 mg/Kg according to the mean weight of each group via tail vein injection (Figure 5B). The tumor volume and mouse bodyweight were monitored on the day of the next administration to observe the anti-tumor effect in the transfection, non-transfection, preparation, and free drug groups.
After several cycles of administration, mice were sacrificed, and the heart, liver, spleen, lung, kidney, and tumor were excised instantaneously. After gently washing away the excess blood, the tissue sections were stained by hematoxylin and eosin. The tumor volume was determined by the two bisecting diameters of each tumor, which represented the largest (a) and smallest (b) diameter (mm) of the tumors, and the volume was calculated using the formula 0.5x (a*b2).
Histological Analysis
The tumor tissues were submerged in 10% formalin for 48 h and then embedded in paraffin. Then, HE staining was performed to analyze the pathological changes of important organs between different groups of nude mice and to observe the pathological differences between the four preparation groups, the free drug group, and the physiological group. The microscopic images were observed under a Leica fluorescence microscope.
Statistical Analysis
All the quantitative data were shown as means ± standard deviation (SD) of three separate experiments. Discrepancies between two groups were conducted by Student’s t-test and one-way analysis of variance (ANOVA) was used for discerning discrepancies between multiple groups. A P-value <0.05 was considered statistically significant. All statistical analyses were done using STATA software.
Results and Discussion
1H NMR Spectroscopy of DSPE-PEG2000-Tf
The synthesis scheme of DSPE-PEG2000-Tf is shown in Scheme S1. To identify the junction between the Tf ligand and DSPE-PEG2000-Mal, 1H NMR spectra with chloroform-d were obtained. The peaks at about 3.57 ppm in the spectrum of DSPE-PEG-Mal were attributed to the proton of -PEG, and the peaks at approximately 6.60–6.70 ppm were attributed to the proton of -maleimide. Peaks at 3.57 ppm attributed to -PEG were also observed in the spectrum of DSPE-PEG-Tf, whereas the proton peak of maleimide (6.60–6.70 ppm) could not be observed, which indicated that maleimide was linked (Figure 1A). These above results demonstrated the successful synthesis of DSPE-PEG2000-Tf.
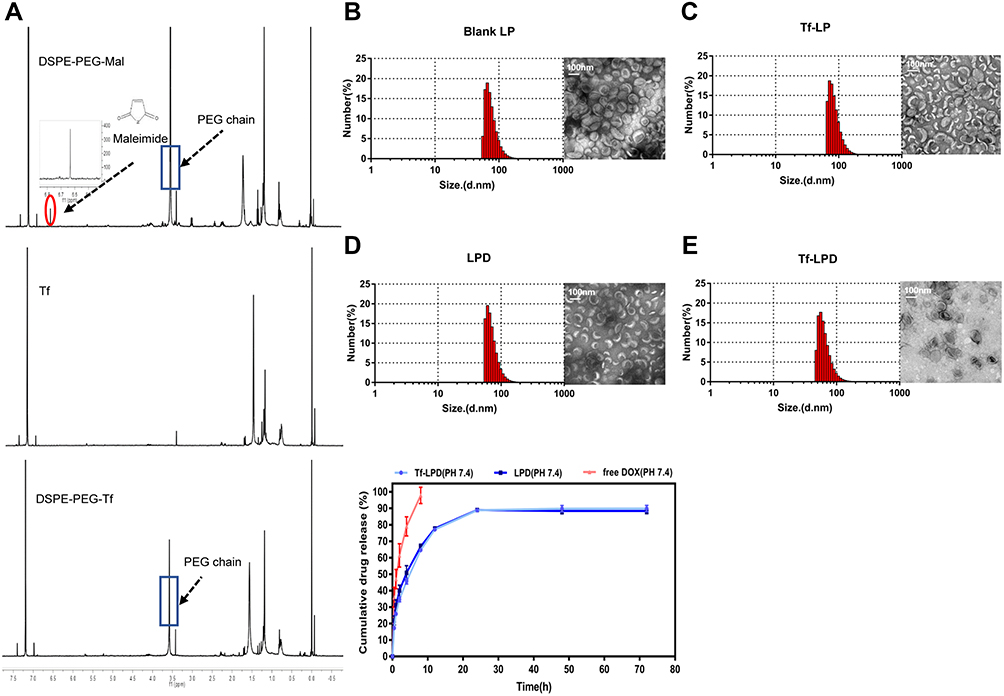 |
Figure 1 Characterization of different liposomes and drug release. Notes: (A) 1H NMR of DSPE-PEG2000-Tf. (B) Size distribution and TEM images of LPs. (C) Size distribution and TEM images of Tf-LP. (D) Size distribution and TEM images of LPD. (E) Size distribution and TEM images of Tf-LPD. (F) Drug release of free DOX, LPD, and Tf-LPD.Abbreviations: DSPE PEG2000-Tf, transferrin modified DSPE-PEG2000-Mal; TEM, transmission electron microscope; LP, liposome; Tf-LP, transferrin modified liposome; LPD, doxorubicin-loaded liposomes; Tf-LPD, transferrin modified doxorubicin liposome. |
Synthesis and Characterization of LPs, Tf-LPs, LPD, and Tf-LPD
Liposomes were prepared by the membrane ultrasound method and DOX encapsulation via the ammonium sulfate gradient method. The particle size and size distribution of liposomes were measured by dynamic light scattering (DLS) (Table 1). The average particle sizes of LP and Tf-LP were 83.97 ± 4.79 nm and 91.25 ± 7.39 nm, respectively. In contrast, those of LPD and Tf-LPD were 62.58 ± 5.69 nm and 48.05 ± 7.76 nm, respectively. TEM examinations showed that each type of liposome had a hollow spherical morphology, and their average particle sizes were similar to those measured by DLS (Figure 1B-E). These results suggested that the average particle sizes of liposomes could be reduced by encapsulating them within the anti-cancer drug DOX, which could be due to intermolecular interactions. Note that liposomes with sizes <80 nm are effective at delivering drugs into lesion sites, which could provide excellent anticancer capability.40
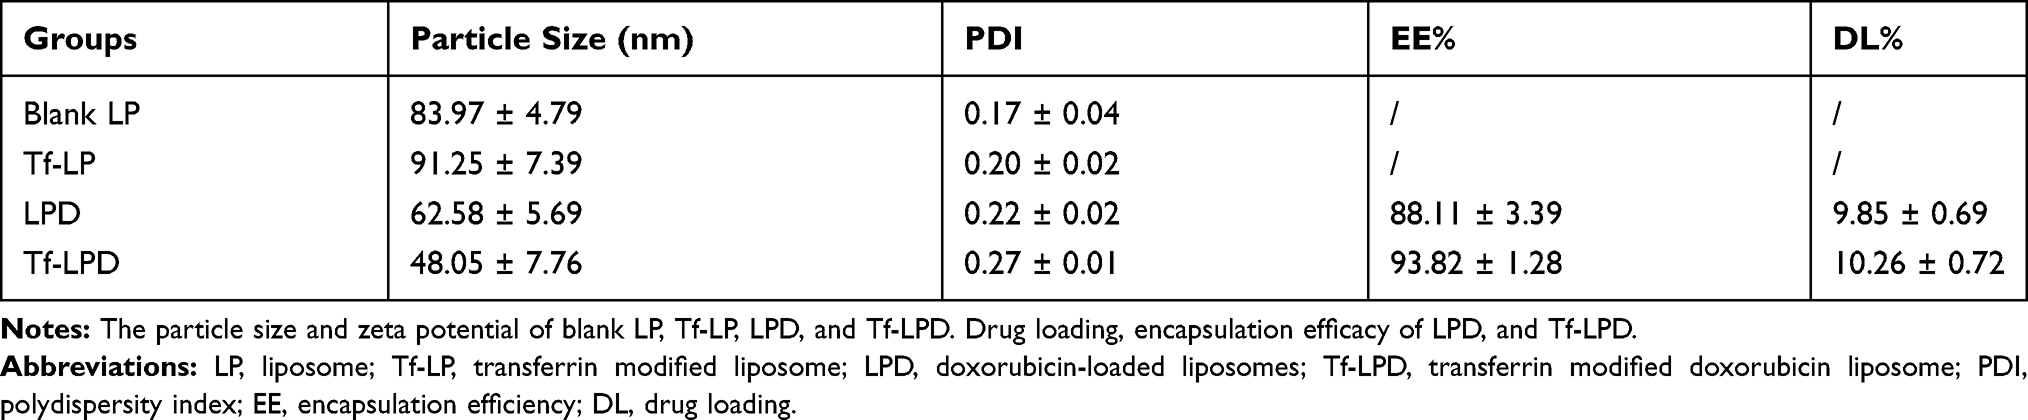 |
Table 1 Diameter and Zeta Potential of Different Liposomes |
Drug Loading, Encapsulation Efficacy, and Drug Release
A standard curve covering the concentrations ranges of 0.1–2.0 μg/mL is shown in Figure S1. The variable regression equation of the curve was y = 414x + 28.541 (r2 = 0.9975), which showed good linearity. Next, the drug loading (DL) and encapsulation efficacy (EE) of liposomes were quantified using a fluorescence spectrophotometer via a centrifugal ultrafiltration method. The fluorescence absorption values were converted to concentrations according to the standard curve for EE and DL. Both LP and Tf-LP had high DOX encapsulation efficiencies, which were 88.11 ± 3.39% and 93.82 ± 1.28%, respectively. The drug loading capacities of LP and Tf-LP were calculated to be 9.85 ± 0.69% and 10.26 ± 0.72%, respectively (Table 1). The drug release profiles suggested that free DOX exhibited a rapid release behavior, with approximately 100% DOX being released within 10 h (Figure 1F). In comparison, Tf-LPD had a proper sustained release profile, with 89.8% of DOX being released within 24 h. We also found that the drug release behavior of Tf-LPD was quite similar to that of LPD, suggesting that the Tf modification slightly influenced the drug release performance of liposomes.
AFP Specific Expression and Ferritin Expression
Western blot analysis was used to examine the expression levels of AFP protein in HepG2 and LO2 cells. As AFP positive hepatoma cells, HepG2 cells showed a much higher expression level of AFP than LO2 cells (Figure 2A and C, p<0.05). Because the expression level of AFP protein is a good indicator of AFP activity,16,26 HepG2 cells were considered AFP positive, while LO2 cells were considered AFP-negative in this study. The above result demonstrated the feasibility of use of AFP as a promoter in the AFP@Fth plasmid and provided basis for the subsequent verification test.
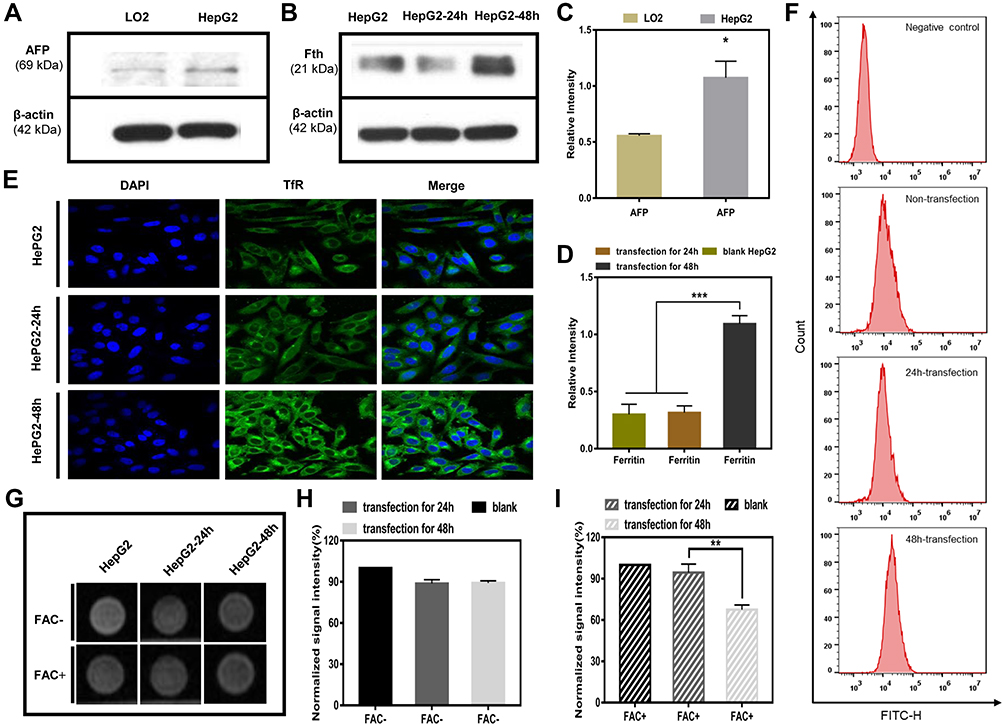 |
Figure 2 (A) Western blotting results for AFP expression in LO2 cells and HepG2 cells. (B) Western blotting results for Ferritin expression. (C) Quantitative values of AFP expression in LO2 cells and HepG2 cell (*p < 0.05, vs LO2 cell group, n = 3). (D) Quantitative values of Ferritin expression in HepG2 cells transfected for 24 h and 48 h, compared with untransfected HepG2 cells (***p<0.001, n = 3). (E) Immunofluorescence results of TfR upregulation in untransfected HepG2 cells and transfected HepG2 cells (24 h and 48 h). (F) Flow cytometry analyses for TfR surface expression. (G) MR images of untransfected HepG2 cells and transfected HepG2 cells (24 h and 48 h); with or without FAC (c = 0.5 mM) provided. (H) Quantitative T2*WI signal intensity analysis of HepG2 cells without FAC. (I) Quantitative T2WI signal intensity analysis of HepG2 cells with FAC (**p<0.01, vs HepG2 cell group and transfection for 24h group, n = 3). Abbreviations: AFP, alpha-fetoprotein; TfR, transferrin; FAC, ferric ammonium citrate; T2*WI, T2* weighted imaging (ESWAN sequence). |
Then, the same method was used to examine whether AFP positive cells (HepG2 cells) transfected by the AFP@Fth plasmid caused Fth overexpression. Different time points were analyzed to demonstrate the proper time for expression. The expression level of Fth in HepG2 cells transfected for 48 h was significantly higher than both cells transfected for 24 h and un-transfected cells (Figure 2B and D, p<0.001). These results support the fact that Fth was overexpressed after the liver cancer cells were transfected with AFP@Fth. The time-dependent expression also illustrated that 48h-transfection was a better condition and was chosen for the following studies.44
Specific Upregulation of TfR
To confirm the expression level of TfR within untransfected and transfected HepG2 cells, an immunofluorescence assay was performed. To investigate the effect of different transfection times on the TfR expression level, HepG2 cells were transfected with AFP@Fth and cultured for 24, 48 h, respectively. Finally, the results were observed through a laser confocal microscope. TfR was specifically up-regulated because the green fluorescence intensity of 48-h transfected HepG2 cells was much stronger than those of 24-h transfected and untransfected cells (Figure 2E), which agreed with the Fth expression level results. The quantitative analysis was consistent with the results of the immunofluorescence (Figure 2F). The non-transfection and 24 h-transfection cells did not demonstrate significant differences. However, in the 48 h-transfection group, cell surface TfR was higher when compared with the non-transfection group. These results indicated that the expression level of TfR could be increased after transfection and also showed that a more satisfactory expression might need a proper prolonged transfection time. Collectively, this evidence demonstrated that the AFP/Fth plasmid induced TfR upregulation on its cell surface after transfection, providing a basis for subsequent targeted therapy.
Signal Changes in vitro MRI
The collected cells were subjected to MR imaging to study the contrast imaging effect caused by changed iron uptake ability via AFP@Fth transfection. The signal intensity of 24, 48 h-transfected HepG2 cells was significantly lower (darkening of the cell layer) than that without transfection, whether FAC or not. The growing results indicated that cells supplemented with an extra FAC concentration showed a significant decrease in the signal intensity, especially in the 48 h-transfection group (Figure 2G). This could be because 48 h transfection led to more receptor overexpression so that more iron could be transported into the cell, compared to 24-h transfection. Based on the regulation of TfR on the cancer cell surface, the extra FAC supplement led to more intracellular iron accumulation, which caused more pronounced T2WI intensity signal decline.45,46
The quantitative analysis of the T2*WI was performed according to the region of interest (ROI=8px) (Figure 2H and I, p<0.01). This analysis confirmed that as shown in previous transfection experiments, Fth overexpression and TfR up-regulation could lead to intracellular iron accumulation in the condition of FAC provided, which then brought about the lower T2WI intensity.
Cellular Uptake of Transferrin Modified Particles in HepG2 Cells
The cellular uptake of liposomes was observed by a fluorescence inverted microscope. A fluorescence dye of FITC was used to label the blank and target-modified liposomes, which were abbreviated as LPFITC and Tf-LPFITC, respectively. As shown by the green fluorescence in Figure 3A, both transfected and untransfected HepG2 cells showed a gradual increase in fluorescence intensity as the incubation time was increased, suggesting that the cellular uptake of liposomes was time-dependent. HepG2 cells treated with Tf-LPFITC had a more obvious fluorescence intensity than those treated with LPFITC, indicating that Tf-modification could remarkably increase the uptake of liposomes. Furthermore, the fluorescence intensity of the transfected cells treated with Tf-LPFITC was much stronger than that untransfected cells treated with Tf-LPFITC, which might explain that Tf-modification could remarkably increase the uptake of liposomes. However, this behavior was not observed in the untransfected HepG2 cells, suggesting that Tf-modification could specifically target the liposomes to the transfected cells, rather than the untransfected ones. Similar results were also revealed by the quantitative analysis (Figure 3B and C). Groups treated with Tf-LPFITC performed better than LPFITC groups. Furthermore, in the two groups treated with Tf-LPFITC, the transfected cells displayed a higher fluorescence intensity than un-transfected cells. As previously mentioned, TfR was largely upregulated on the surface of HepG2 cells after the cells were transfected and led to specific targeting of Tf to the TfR, thereby leading to the observation that a higher number of Tf-LPFITC were uptaken by the transfected HepG2 cells.28,47,48
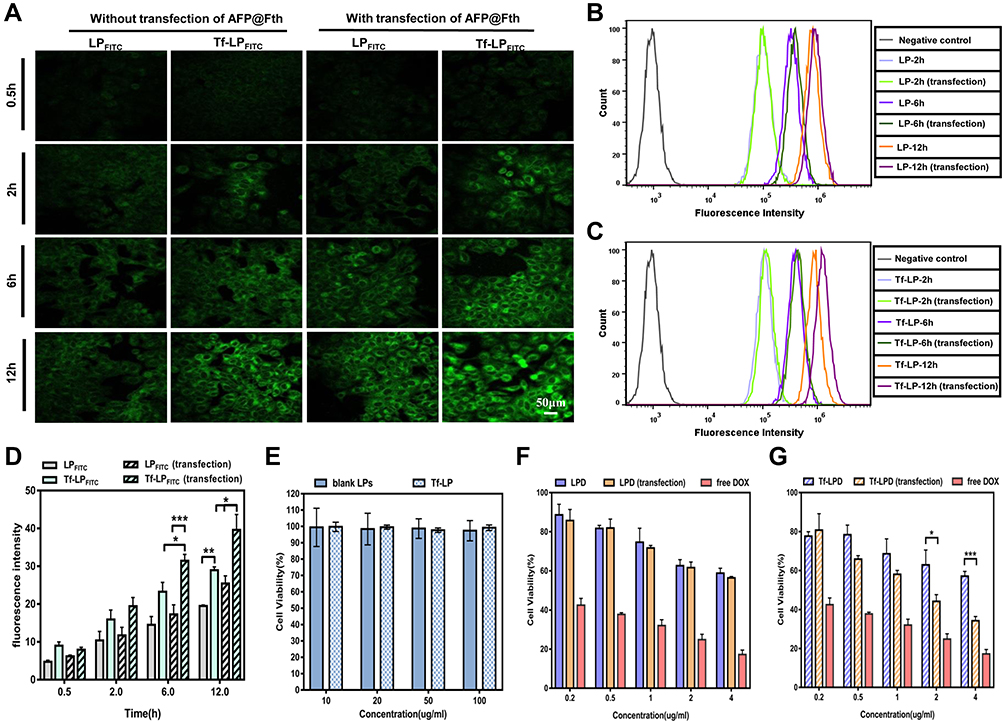 |
Figure 3 (A) Fluorescence images of cellular uptake (scale bar = 50 μm). (B) Flow cytometry analysis of cellular uptake in HepG2 treated with LPFITC. (C) Flow cytometry analysis of cellular uptake in HepG2 treated with Tf-LPFITC. (D) Semi-quantitative analysis of fluorescence signals, (*p < 0.05, **p < 0.01 and ***p < 0.001, n = 3). (E) Cell viability was with LPs and Tf-LP at various doses for 24 h. (F) Cell viability of HepG2 cells with LPD and free DOX. (G) Cell viability of HepG2 cells incubated with Tf-LPD and free DOX; (*p<0.05 and ***p<0.001, vs Tf-LPD group, n = 6). Abbreviations: LP, liposome; Tf-LP, transferrin modified liposome; LPD, doxorubicin loaded liposomes; Tf-LPD, transferrin modified doxorubicin liposome; DOX, doxorubicin. |
The quantitative analysis showed that, in the cells treated with Tf-LPFITC for 12 h, the cellular uptake presented a significant difference between the untransfected cells treated with Tf-LPFITC and the transfected cell treated with LPFITC, as shown in Figure 3D.
Cytotoxicity of Various Liposomes
The toxicity of liposomes and its drug-loaded types (LPD, Tf-LPD) was assessed via an MTT assay. As revealed in Figure 3E, LPs and Tf-LP showed little toxicity to HepG2 cells at the tested concentration of 10–100μg/mL. Subsequently, the enhanced targeting cytotoxicity was verified. In general, free DOX, LPD, and Tf-LPD reduced the cell viability as the DOX concentration increased, and free DOX exhibited the best anti-cancer efficiency. In the case of LPD treatment, there was no significant difference between the two groups (Figure 3F, p>0.05). In contrast, in the case of Tf-LPD treatment, the cell viability of HepG2 cells with AFP@Fth transfection was more effectively inhibited than the untransfected group at concentrations of 2–4 μg/mL, which suggested that Tf modification endows liposomes with a greater anticancer efficiency (Figure 3G). These results were consistent with the assumptions and are validated further in the subsequent experiments in vivo.
Western Blotting for Tumor Transfection
To further verify the targeting expression of Fth in AFP positive HCC, the expression level of Fth in tumor models was studied via Western blotting. As shown in Figure 4A, the transfection induced a higher expression level of Fth observed in tumor as compared to liver tissue. The quantitative data in Figure 4B also show that the expression level of Fth in the 48 h-transfected tumor tissue was much higher than that in 24 h-transfected and non-transfected tumor tissues, which was in accordance with the results obtained from Western blotting analysis of cells.
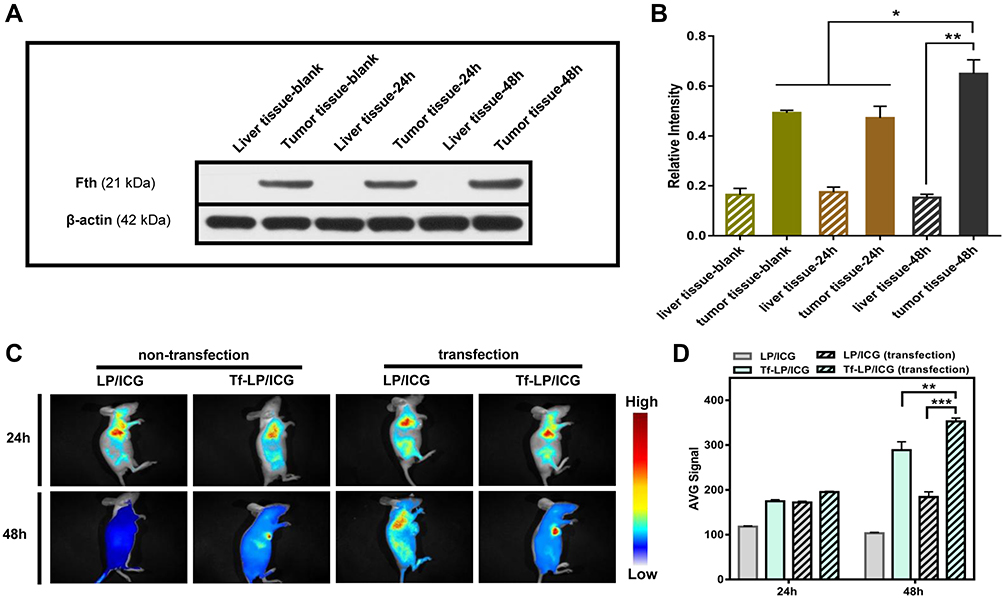 |
Figure 4 (A) Western blotting results of Ferritin expression in liver and tumor tissues. (B) The quantitative analysis of protein bands, (*p < 0.05 and **p < 0.01, vs untransfected group, n = 3). (C) Biodistribution of LP/ICG and Tf-LP/ICG. (D) Semi-quantitative analysis of fluorescence intensity in tumors (**p < 0.01 and ***p < 0.001, vs untransfected group, n = 3). Abbreviations: LP/ICG, ICG loaded liposome; Tf-LP/ICG, transferrin modified ICG loaded liposome; ICG, indocyanine green. |
Targeting Distribution of Transferrin Modified Particles in vivo
In vivo targeting ability of Tf-modified liposomes was investigated by intravenously injecting the mice with ICG-labeled Tf-LP (Tf-LP/ICG) or LP/ICG. After 24 h and 48 h of injection, the fluorescence images of major organs and tumors were captured, followed by quantifying the fluorescence intensity of tumors. It was shown that the liposomes were mainly accumulated in the liver and tumor. The fluorescence signal of Tf-LP/ICG in tumors collected in transfected mice was significantly stronger than that obtained from transfected ones. Nevertheless, the tumors of mice treated with LP/ICG showed no significant differences in fluorescence intensity, further verifying the enhanced targeting ability of Tf-modified liposomes to transfected AFP positive hepatoma carcinoma cells (Figure 4C and D).
Anti-Tumor Effects
To confirm the enhanced therapeutic efficacy of Tf-LPD to the transfected HepG2 cell subcutaneous hepatoma model, the mice were randomly divided into 6 groups (Figure 5A) and were administrated drugs every 5 days (Figure 5B) at a single dose of 4 mg/Kg according to the mean weight of each group via tail vein injection. Note that intratumor injection transfection was performed two days before treatment for the two transfection groups (Figure 5B). As shown in Figure 5C, the saline group showed rapid tumor growth, and the relative tumor volume multiplied 22.37- fold within 25 days, while the administration of DOX-loaded liposomes effectively inhibited tumor growth to a certain extent. The transfected group treated with Tf-LPD showed the highest efficiency in terms of inhibiting tumor growth, which was even similar to that of free DOX and was significantly more effective than Tf-LPD treatment (the untransfected group, p<0.05).
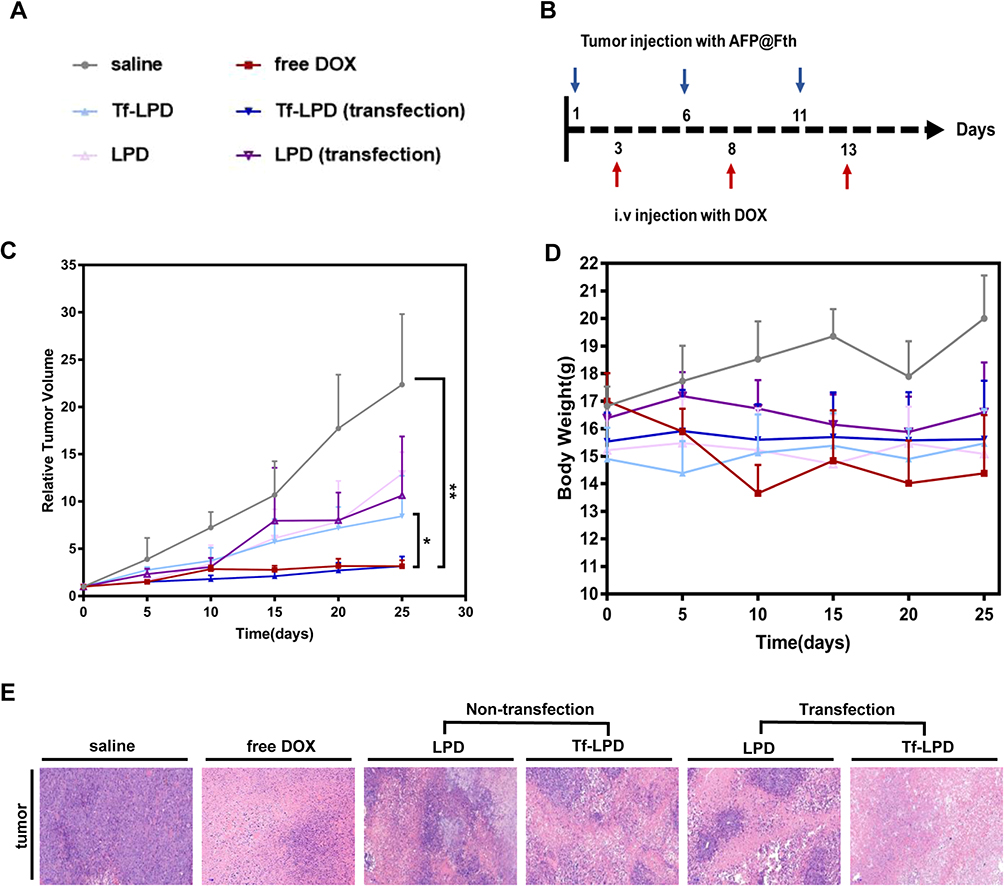 |
Figure 5 (A) Groups during treatment. (B) Plasmid injection and drug administration schedule. (C) Relative tumor volume growth curves after injection with various drugs for 25 days, *p<0.05 and **p<0.01, vs Tf-LPD (transfected group), n = 5. (D) Bodyweight change curves. (E) Representative H&E sections of tumor tissues of mice after treatment with saline, free DOX, LPD, and Tf-LPD. Abbreviations: Tf-LPD, transferrin modified doxorubicin liposome; H&E, hematoxylin-eosin staining. |
The side effects were reflected by body weight fluctuations during the treatment (Figure 5D). The body weights of mice treated with free DOX were sharply decreased during therapy, whereas no obvious body weight loss was reflected in DOX loaded liposome groups, which could be because the mice well-tolerated the LPD and Tf-LPD.
Histological Analysis
The anti-tumor effect and side effects of different drugs on important organs during drug administration were revealed through H&E staining. The anti-tumor extent presented in Figure 5E demonstrated that a multitude of tumor cells were destroyed in the free DOX group and Tf-LPD (transfection group). The H&E images showing the main organs of all treatment groups are shown in Figure S2. No obvious difference was observed in these staining images among groups. Many studies have reported that free DOX damages the myocardium leading to myocardial rupture during in vivo treatment, whereas no serious myocardial damage was observed in all groups including the DOX group in our study, which may be caused by the short administration period.36
Conclusion
In summary, we confirmed the dual effects of early diagnosis of HCC at the molecular level and subsequent intensive treatment via AFP@Fth transfection. AFP/Fth can be specifically promoted in AFP-positive cells, such as HepG2 cells. Consequently, T2WI intensity values are significantly reduced, indicating the potential for early diagnosis of HCC. Meanwhile, the upregulation of TfR was verified and attracted a significantly increased amount of Tf-LPD, which leads to a better targeting ability and anti-tumor efficacy to transfected AFP positive hepatoma carcinoma cells. Hence, the transfection of the AFP@Fth gene allowed early diagnosis of HCC, and another promising role that made Tf-LPD or other Tf functionalized preparations to be a more efficient and safer approach for subsequent treatment. In this study, the early influence of AFP@Fth on subsequent anti-tumor treatments was assessed by molecular imaging, which provides new hints for molecular imaging diagnosis, and the application of nanomedicine in antitumor therapy.
Funding
This study was supported in part by grants from the Natural Science Foundation of Zhejiang province (LY18H180003), and the National Natural Science Foundation of China (General Program: 81571662). And we would like to thank the members of Professor Du ‘s team (Pharmacy School of Zhejiang University) for their guidance and assistance in this study.
Disclosure
The authors declare no conflicts of interest in this work.
References
1. Tang A, Hallouch O, Chernyak V, et al. Epidemiology of hepatocellular carcinoma: target population for surveillance and diagnosis. Abdom Radiol. 2018;43(1):13–25. doi:10.1007/s00261-017-1209-1
2. Villanueva A. Hepatocellular carcinoma. Reply. N Engl J Med. 2019;381(1):e2. doi:10.1056/NEJMc1906565
3. Llovet JM, Montal R, Sia D, et al. Molecular therapies and precision medicine for hepatocellular carcinoma. Nat Rev Clin Oncol. 2018;15(10):599–616. doi:10.1038/s41571-018-0073-4
4. Siegel RL, Miller KD, Jemal A. Cancer statistics, 2019. CA Cancer J Clin. 2019;69(1):7–34. doi:10.3322/caac.21551
5. Zhou M, Wang H, Zeng X, et al. Mortality, morbidity, and risk factors in China and its provinces, 19902017: a systematic analysis for the global burden of disease study 2017. Lancet. 2019;394(10204):1145–1158. doi:10.1016/S0140-6736(19)30427-1
6. Sia D, Villanueva A, Friedman SL, et al. Liver cancer cell of origin, molecular class, and effects on patient prognosis. Gastroenterology. 2017;152(4):745–761. doi:10.1053/j.gastro.2016.11.048
7. Llovet JM, Villanueva A, Lachenmayer A, et al. Advances in targeted therapies for hepatocellular carcinoma in the genomic era. Nat Rev Clin Oncol. 2015;12(8):436. doi:10.1038/nrclinonc.2015.121
8. Galle PR, Tovoli F, Foerster F, et al. The treatment of intermediate stage tumours beyond TACE: from surgery to systemic therapy. J Hepatol. 2017;67(1):173–183. doi:10.1016/j.j.hep.2017.03.007
9. Ikeda M, Morizane C, Ueno M, et al. Chemotherapy for hepatocellular carcinoma: current status and future perspectives. Jpn J Clin Oncol. 2018;48(2):103–114. doi:10.1093/jjco/hyx180
10. Ikeda M, Mitsunaga S, Ohno I, et al. Systemic chemotherapy for advanced hepatocellular carcinoma: past, present, and future. Diseases. 2015;3(4):360–381. doi:10.3390/diseases3040360
11. Forner A, Reig M, Bruix J. Hepatocellular carcinoma. Lancet. 2018;391(10127):1301–1314. doi:10.1016/S0140-6736(18)30010-2
12. Haris M, Yadav SK, Rizwan A, et al. Molecular magnetic resonance imaging in cancer. J Transl Med. 2015. doi:13:313.doi:10.1186/s12967-015-0659-x
13. Hasegawa S, Furukawa T, Saga T. Molecular MR imaging of cancer gene therapy: ferritin transgene reporter takes the stage. Magn Reson Med Sci. 2010;9(2):37–47. doi:10.2463/mrms.9.37
14. Zhang F, Duan X, Lu L, et al. In vivo long-term tracking of neural stem cells transplanted into an acute ischemic stroke model with reporter gene-based bimodal MR and optical imaging. Cell Transplant. 2017;26(10):1648–1662. doi:10.1177/0963689717722560
15. Kim KI, Chung HK, Park JH, et al. Alpha-fetoprotein-targeted reporter gene expression imaging in hepatocellular carcinoma. World J Gastroenterol. 2016;22(27):6127–6134. doi:10.3748/wjg.v22.i27.6127
16. Park JH, Kim KI, Lee KC, et al. Assessment of α-fetoprotein targeted HSV1-tk expression in hepatocellular carcinoma with in vivo imaging. Cancer Biother Radiopharm. 2015;30(1):8–15. doi:10.1089/cbr.2014.1716
17. Ramalho J, Ramalho M. Gadolinium deposition and chronic toxicity. Magn Reson Imaging Clin N Am. 2017;25(4):765–778. doi:10.1016/j.mric.2017.06.007
18. Layne KA, Dargan PI, Archer J, et al. Gadolinium deposition and the potential for toxicological sequelae - A literature review of issues surrounding gadolinium-based contrast agents. Br J Clin Pharmacol. 2018;84(11):2522–2534. doi:10.1111/bcp.13718
19. Cao M, Mao J, Duan X, et al. In vivo tracking of the tropism of mesenchymal stem cells to malignant gliomas using reporter gene-based MR imaging. Int J Cancer. 2018;142(5):1033–1046. doi:10.1002/ijc.31113
20. Yang C, Tian R, Liu T, et al. MRI reporter genes for noninvasive molecular imaging. Molecules. 2016;21(5). doi:10.3390/molecules21050580
21. Yang Y, Gong MF, Yang H, et al. MR molecular imaging of tumours using ferritin heavy chain reporter gene expression mediated by the hTERT promoter. Eur Radiol. 2016;26(11):4089–4097. doi:10.1007/s00330-016-4259-9
22. Ono K, Fuma K, Tabata K, et al. Ferritin reporter used for gene expression imaging by magnetic resonance. Biochem Biophys Res Commun. 2009;388(3):589–594. doi:10.1016/j.bbrc.2009.08.055
23. Sinusas AJ, Thomas JD, Mills G. The future of molecular imaging. JACC Cardiovasc Imaging. 2011;4(7):799–806. doi:10.1016/j.jcmg.2011.05.003
24. Cohen B, Dafni H, Meir G, et al. Ferritin as an endogenous MRI reporter for noninvasive imaging of gene expression in C6 glioma tumors. Neoplasia. 2005;7(2):109–117. doi:10.1593/neo.04436
25. Hongliang H, et al. Low molecular weight polyethylenimine cross-linked by 2-hydroxypropyl-g-cyclodextrin coupled to peptide targeting HER2 as a gene delivery vector[M]. Biomaterials. 2010. doi:10.1016/j.biomaterials.2009.11.012
26. Kim KI, Lee YJ, Lee TS, et al. In vitro radionuclide therapy and in vivo scintigraphic imaging of alpha-fetoprotein-producing hepatocellular carcinoma by targeted sodium iodide symporter gene expression. Nucl Med Mol Imaging. 2013;47(1):1–8. doi:10.1007/s13139-012-0166-4
27. Marrero JA, Feng Z, Wang Y, et al. Alpha-fetoprotein, des-gamma carboxyprothrombin, and lectin-bound alpha-fetoprotein in early hepatocellular carcinoma. Gastroenterology. 2009;137(1):110–118. doi:10.1053/j.gastro.2009.04.005
28. Jhaveri A, Luther E, Torchilin V. The effect of transferrin-targeted, resveratrol-loaded liposomes on neurosphere cultures of glioblastoma: implications for targeting tumour-initiating cells. J Drug Target. 2019;27(56):601–613. doi:10.1080/1061186X.2018.1550647
29. Moghimipour E, Rezaei M, Kouchak M, et al. A mechanistic study of the effect of transferrin conjugation on cytotoxicity of targeted liposomes. J Microencapsul. 2018;35(6):548–558. doi:10.1080/02652048.2018.1547325
30. Bao W, Liu R, Wang Y, et al. PLGA-PLL-PEG-Tf-based targeted nanoparticles drug delivery system enhance antitumor efficacy via intrinsic apoptosis pathway. Int J Nanomed. 2015;10:557–566. doi:10.2147/IJN.S75090
31. Gomme PT, McCann KB, Bertolini J. Transferrin: structure, function and potential therapeutic actions. Drug Discov Today. 2005;10(4):267–273. doi:10.1016/S1359-6446(04)03333-1
32. Bigdeli A, Palchetti S, Pozzi D, et al. Exploring cellular interactions of liposomes using protein corona fingerprints and physicochemical properties. ACS Nano. 2016;10(3):3723–3737. doi:10.1021/acsnano.6b00261
33. Panahi Y, Farshbaf M, Mohammadhosseini M, et al. Recent advances on liposomal nanoparticles: synthesis, characterization and biomedical applications. Artif Cells Nanomed Biotechnol. 2017;45(4):788–799. doi:10.1080/21691401.2017.1282496
34. Carvalho C, Santos RX, Cardoso S, et al. Doxorubicin: the good, the bad and the ugly effect. Curr Med Chem. 2009;16(25):3267–3285. doi:10.2174/092986709788803312
35. Szwed M, Wrona D, Kania KD, et al. Doxorubicin-transferrin conjugate triggers pro-oxidative disorders in solid tumor cells. Toxicol in Vitro. 2016;31:60–71. doi:10.1016/j.tiv.2015.11.009
36. Octavia Y, Tocchetti CG, Gabrielson KL, et al. Doxorubicin-induced cardiomyopathy: from molecular mechanisms to therapeutic strategies. J Mol Cell Cardiol. 2012;52(6):1213–1225. doi:10.1016/j.yjmcc.2012.03.006
37. Carvalho FS, Burgeiro A, Garcia R, et al. Doxorubicin-induced cardiotoxicity: from bioenergetic failure and cell death to cardiomyopathy. Med Res Rev. 2014;34(1):106–135. doi:10.1002/med.21280
38. Tahover E, Patil YP, Gabizon AA. Emerging delivery systems to reduce doxorubicin cardiotoxicity and improve therapeutic index: focus on liposomes. Anticancer Drugs. 2015;26(3):241–258. doi:10.1097/CAD.0000000000000182
39. Anabousi S, Laue M, Lehr CM, et al. Assessing transferrin modification of liposomes by atomic force microscopy and transmission electron microscopy. Eur J Pharm Biopharm. 2005;60(2):295–303. doi:10.1016/j.ejpb.2004.12.009
40. Li X, Ding L, Xu Y, et al. Targeted delivery of doxorubicin using stealth liposomes modified with transferrin. Int J Pharm. 2009;373(12):116–123. doi:10.1016/j.ijpharm.2009.01.023
41. Zhang Q, Lu Y, Xu X, et al. MR molecular imaging of HCC employing a regulated ferritin gene carried by a modified polycation vector. Int J Nanomed. 2019;14:3189–3201. doi:10.2147/IJN.S191270
42. Cheng S, Mi R, Xu Y, et al. Ferritin heavy chain as a molecular imaging reporter gene in glioma xenografts. J Cancer Res Clin Oncol. 2017;143(6):941–951. doi:10.1007/s00432-017-2356-z
43. Aung W, Hasegawa S, Koshikawa-Yano M, et al. Visualization of in vivo electroporation-mediated transgene expression in experimental tumors by optical and magnetic resonance imaging. Gene Ther. 2009;16(7):830–839. doi:10.1038/gt.2009.55
44. Feng Y, Liu Q, Zhu J, et al. Efficiency of ferritin as an MRI reporter gene in NPC cells is enhanced by iron supplementation. J Biomed Biotechnol. 2012. doi:2012:434878.doi:10.1155/2012/434878
45. Pereira SM, Moss D, Williams SR, et al. Overexpression of the MRI reporter genes ferritin and transferrin receptor affect iron homeostasis and produce limited contrast in mesenchymal stem cells. Int J Mol Sci. 2015;16(7):15481–15496. doi:10.3390/ijms160715481
46. Pereira SM, Herrmann A, Moss D, et al. Evaluating the effectiveness of transferrin receptor-1 (TfR1) as a magnetic resonance reporter gene. Contrast Media Mol Imaging. 2016;11(3):236–244. doi:10.1002/cmmi.1686
47. Luo M, Lewik G, Ratcliffe JC, et al. Systematic evaluation of transferrin-modified porous silicon nanoparticles for targeted delivery of doxorubicin to glioblastoma. ACS Appl Mater Interfaces. 2019;11(37):33637–33649. doi:10.1021/acsami.9b10787
48. Jhaveri A, Deshpande P, Pattni B, et al. Transferrin-targeted, resveratrol-loaded liposomes for the treatment of glioblastoma. J Control Release. 2018;277:89–101. doi:10.1016/j.jconrel.2018.03.006
 © 2020 The Author(s). This work is published and licensed by Dove Medical Press Limited. The full terms of this license are available at https://www.dovepress.com/terms.php and incorporate the Creative Commons Attribution - Non Commercial (unported, v3.0) License.
By accessing the work you hereby accept the Terms. Non-commercial uses of the work are permitted without any further permission from Dove Medical Press Limited, provided the work is properly attributed. For permission for commercial use of this work, please see paragraphs 4.2 and 5 of our Terms.
© 2020 The Author(s). This work is published and licensed by Dove Medical Press Limited. The full terms of this license are available at https://www.dovepress.com/terms.php and incorporate the Creative Commons Attribution - Non Commercial (unported, v3.0) License.
By accessing the work you hereby accept the Terms. Non-commercial uses of the work are permitted without any further permission from Dove Medical Press Limited, provided the work is properly attributed. For permission for commercial use of this work, please see paragraphs 4.2 and 5 of our Terms.