")
Back to Journals » Clinical Ophthalmology » Volume 13
Dry eye disease ranking among common reasons for seeking eye care in a large US claims database
Authors Bradley JL, Özer Stillman I, Pivneva I, Guerin A, Evans AM, Dana R
Received 25 September 2018
Accepted for publication 17 December 2018
Published 1 February 2019 Volume 2019:13 Pages 225—232
DOI https://doi.org/10.2147/OPTH.S188314
Checked for plagiarism Yes
Review by Single anonymous peer review
Peer reviewer comments 3
Editor who approved publication: Dr Scott Fraser
John L Bradley,1,2 Ipek Özer Stillman,3 Irina Pivneva,4 Annie Guerin,4 Amber M Evans,5 Reza Dana6
1Naval Medical Research Unit Dayton, Vision Science Lab, Wright Patterson AFB, OH, USA; 2University of Pikeville, Kentucky College of Optometry, Pikeville, KY, USA; 3Takeda, Lexington, MA, USA; 4Analysis Group, Inc, Montreal, QC, Canada; 5Health ResearchTx LLC, Trevose, PA, USA; 6Massachusetts Eye and Ear, Department of Ophthalmology, Harvard Medical School, Boston, MA, USA
Objectives: Dry eye disease (DED) is a complex multifactorial condition of the ocular surface characterized by symptoms of ocular discomfort, irritation, and visual disturbance. Data previously reported from this study showed an increase in prevalence and incidence of DED with age and over time. The objective of this study was to compare the ranking of DED prevalence among other ocular conditions that led patients to seek eye care.
Methods: In this population-based study using the US Department of Defense Military Health System claims database of >9.7 million beneficiaries, indicators of DED and other ocular conditions were analyzed over time. The overall prevalence (2003–2015) and annual incidence (2008–2012) of DED and other ocular conditions were estimated using an algorithm based on two independent indicators derived from selected diagnostic and procedure codes and prescriptions for cyclosporine ophthalmic emulsion for DED and diagnostic codes for the indicators of other common ocular conditions.
Results: In 2003–2015, the most common ocular conditions were disorders of refraction and accommodation (25.84%), cataracts (17.14%), glaucoma (7.27%), disorders of the conjunctiva (6.76%), other retinal disorders (5.94%), and DED (5.28%). DED was the fifth most prevalent ocular condition in women (7.78%) and ninth most prevalent in men (2.96%). In 2012, DED had the third highest annual incidence (0.87%), behind disorders of refraction/accommodation (1.87%) and cataracts (1.50%).
Conclusion: This study provided further epidemiologic evidence for DED as a commonly occurring condition that drives patients to seek treatment.
Keywords: DED, epidemiology, prevalence, incidence
Introduction
Symptoms of dry eye disease (DED; ie, ocular discomfort, irritation, and visual disturbance) are frequently reported during visits to eye care specialists and are often associated with significant psychosocial burden on individuals, including impairment in social and occupational functioning, reduced quality of life (QoL), and considerable health care costs.1–3 To characterize the epidemiology and health care burden of DED, we reviewed a large population of beneficiaries covered by the US Department of Defense (DOD) Military Health System (MHS) from 2003 to 2015. Previously reported data from this study showed an increase in the annual incidence and annual prevalence of DED with age and over time. Overall prevalence of DED from 2003 to 2015 was 5.3%, projecting to ~16 million people in the United States.4 Additional analyses from this database compared common age- and non-age-related comorbidities, prescribed medications, and ocular procedures between beneficiaries with DED to those without DED.5 This study assessed the prevalence of DED and ranked it among other common ocular conditions leading patients to seek eye care.
Methods
Study population
Data from the US DOD MHS between January 1, 2003, and March 31, 2015, were used. The MHS database contains comprehensive health-related data, including inpatient and outpatient health care service records, prescription records, and demographic data for >9.7 million beneficiaries (eg, active and reserve DOD service members, retirees, and their dependents) who obtain medical service through the DOD facilities (direct care) or in selected civilian facilities. This large US database includes >30 billion archived records, 5 billion online records, and decades of prescription, inpatient, and outpatient data.
Statistical analyses
We estimated the overall prevalence (2003–2015) and annual incidence (2008–2012) of DED and other ocular conditions among MHS beneficiaries. The full methodology of the primary prevalence and incidence evaluation is reported elsewhere.4 Beneficiaries with DED were identified using an algorithm constructed from selected International Classification of Diseases, Ninth Revision (ICD-9) and Current Procedural Terminology codes, as well as prescriptions for cyclosporine ophthalmic emulsion (Restasis®; Allergan, Irvine, CA, USA) (Table 1). Since there is a lack of specific coding for DED, this study used a combination of diagnoses, procedures, and prescription fills to identify patients with DED. This requirement helped to minimize any misclassifications and avoid patients being excluded from the study. Driving indicators for DED (eg, keratoconjunctivitis sicca and conjunctival xerosis) were defined as those where two independent records of the same diagnosis, procedure, or prescription fill were sufficient to confirm the diagnosis of DED. Non-driving indicators for DED (eg, superficial keratoconjunctivitis and punctate keratitis) were defined as those that had to be combined with a driving indicator to confirm the diagnosis of DED. A diagnosis of DED was defined as two medical claims, based on driving indicators alone or as a combination of driving and non-driving indicators.
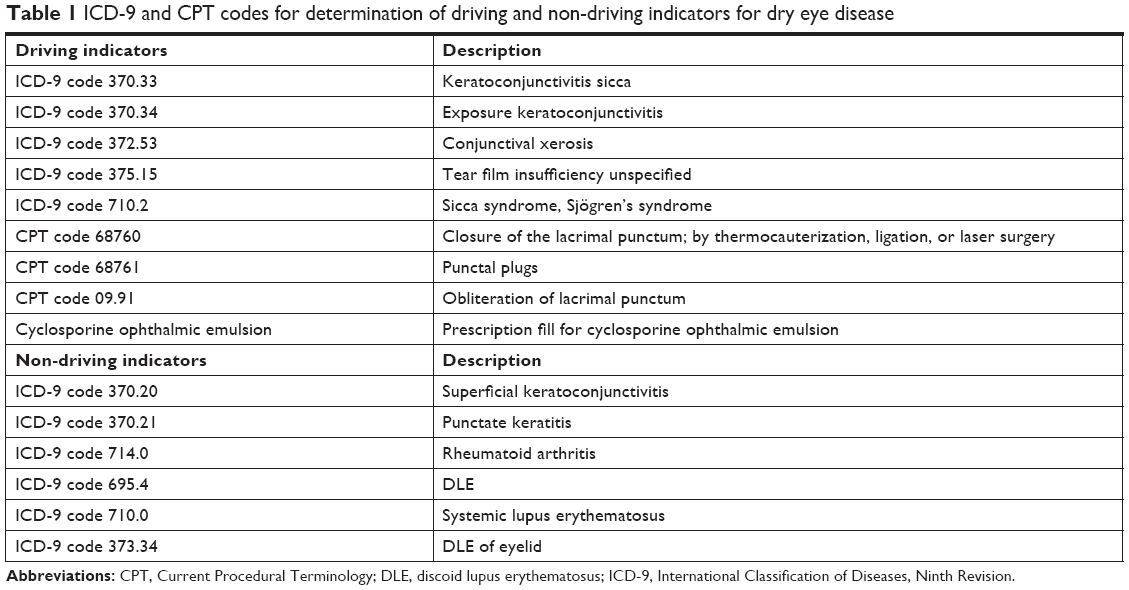 | Table 1 ICD-9 and CPT codes for determination of driving and non-driving indicators for dry eye disease |
Overall prevalence of DED was calculated as follows: the denominator was the number of beneficiaries continuously enrolled over a 5-year period, at any time in the studied period (2003–2015), and the numerator was the number of beneficiaries with a driving indicator and a second indicator for DED at any time during the studied period. Annual incidence of DED was calculated per calendar year, from 2008 to 2012, as follows: the denominator was the number of beneficiaries continuously enrolled in the health care plan (ie, no lapse in coverage) and no driving indicator over the 5-year period before the studied year, and the numerator was the number of beneficiaries from the denominator with a first driving DED indicator in the studied year and a second indicator during/after the studied year.
Specific ICD-9 codes were used to track incidence and prevalence of other commonly reported ocular conditions, such as disorders of refraction and accommodation, cataracts, glaucoma, other disorders of the eye (eg, scleritis and episcleritis), age-related macular degeneration, other retinal disorders (eg, diabetes mellitus-associated retinal changes/retinal diseases), and disorders of conjunctiva (Table 2).
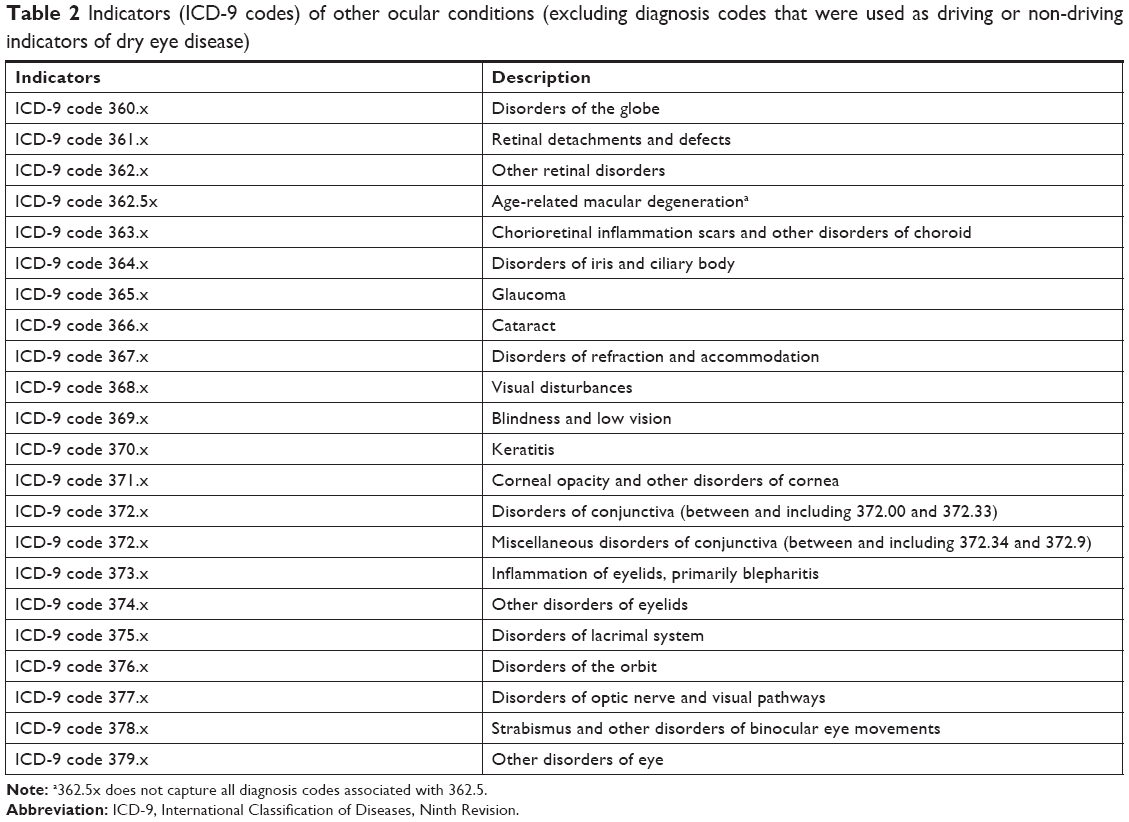 | Table 2 Indicators (ICD-9 codes) of other ocular conditions (excluding diagnosis codes that were used as driving or non-driving indicators of dry eye disease) |
To confirm the diagnosis of each condition other than DED, at least two independent medical claims, based on diagnostic codes for that condition, were required during the study period. The overall prevalence analysis of other ocular conditions (2003–2015) was calculated using a denominator that included beneficiaries with continuous health care plan enrolment for 5 years at any time in the data, and a numerator that included beneficiaries with at least two diagnoses at any time in the data. The annual incidence analysis of other ocular conditions (2008–2012) was calculated as follows: denominator included beneficiaries with continuous enrolment for 5 years preceding January 1 of the studied year and no diagnosis for the given ocular condition during this time; the numerator (population with given condition) included beneficiaries with a first indicator in the studied year and any second indicator during/after the studied year.
Estimates of the incidence and prevalence of DED and other ocular conditions were also stratified by age and sex. The following age groups were included in the analyses: 2–17 years, 18–39 years, 40–49 years, and ≥50 years.
Results
Study population
The total population used for the analyses of the prevalence and incidence of DED was 9,732,272 beneficiaries, and the total population used for the analyses of the prevalence and incidence of all ocular conditions other than DED was 9,733,466 beneficiaries. The difference in the numbers for the total patient population of DED vs other ocular conditions is due to the timing of the second data analysis (~8 months later).
Demographics were similar in the two data groups. Of the 9,733,466 beneficiaries from the MHS database who were included in the analyses of ocular conditions other than DED (48.14% female/51.86% male), 22.33% were aged 2–17 years (46.96% female), 33.06% were aged 18–39 years (43.61% female), 11.14% were aged 40–49 years (51.57% female), and 33.47% were aged ≥50 years (52.27% female). Of the 9,732,272 beneficiaries from the MHS database included in the DED analyses, females made up 48.13% of the overall population; 20.80% were aged 2–17 years (48.86% female), 34.61% were 18–39 years (42.57% female), 11.15% were 40–49 years (51.46% female), and 33.44% were ≥50 years (52.31% female).
Prevalence of common ocular conditions and DED
Between 2003 and 2015, the most common prevalent ocular conditions among beneficiaries of all ages (Figure 1) were disorders of refraction and accommodation (25.84%), cataracts (17.14%), other disorders of the eye (7.34%), glaucoma (7.27%), disorders of conjunctiva (6.76%), other retinal disorders (5.94%), and DED (5.28%).
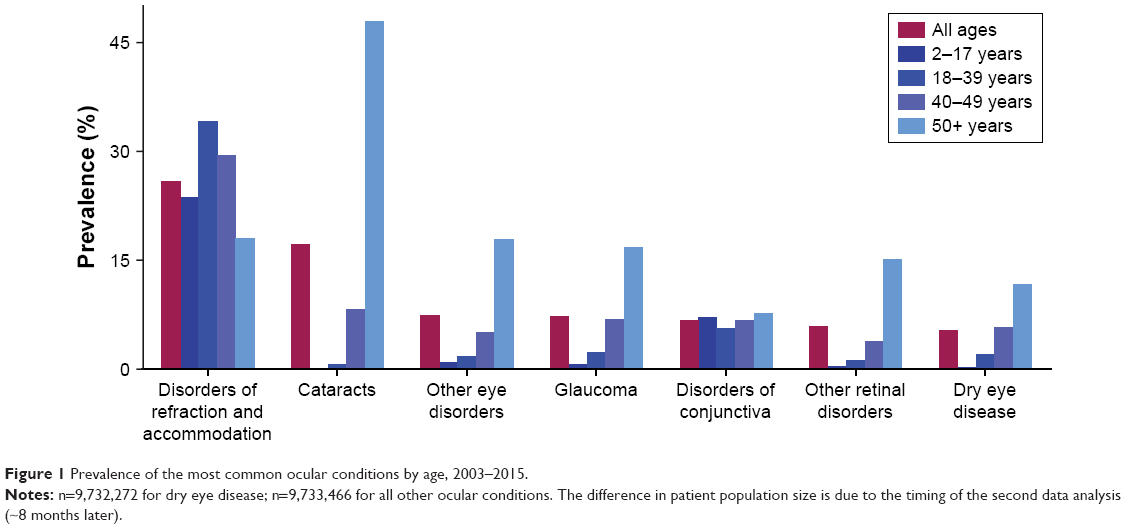 | Figure 1 Prevalence of the most common ocular conditions by age, 2003–2015. |
All other ocular conditions had an overall prevalence of <5%, including visual disturbances, inflammation of eyelids (primarily blepharitis), age-related macular degeneration, other disorders of eyelids, corneal opacity and other disorders of cornea, miscellaneous disorders of conjunctiva, and disorders of the optic nerve and visual pathways. Beneficiaries aged ≥50 years had a higher prevalence of DED (11.66%) than those aged 40–49 years (5.74%), 18–39 years (2.03%), and 2–17 years (0.20%). Beneficiaries in this age group (≥50 years) also had a higher prevalence for most of the other top prevalent ocular conditions. The only exception was disorders of refraction and accommodation, which were most prevalent among those aged 18–39 years (34.08%) relative to those aged ≥50 years (17.96%).
With “other eye disorders” removed from this ranking (because it is made up of a number of miscellaneous ocular conditions), DED was the fifth most prevalent ocular condition (7.78%) for women, and ninth (2.96%) for men (Figure 2).
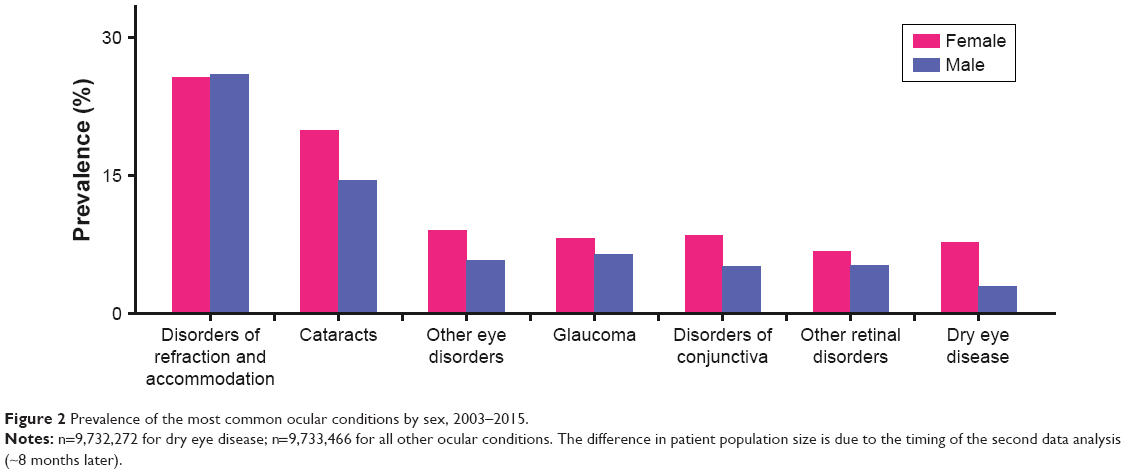 | Figure 2 Prevalence of the most common ocular conditions by sex, 2003–2015. |
Prevalence of all ocular conditions was higher among women than men, except for disorders of refraction and accommodation (25.65% vs 26.01%, respectively).
Incidence of common ocular conditions and DED
Annual incidence rates were calculated for >6.5 million people without DED as of the studied year start for DED, and >5 million people without other ocular conditions as of the studied year start for other ocular conditions. The longer follow-up periods needed for the determination of incidence rates resulted in a smaller patient population relative to prevalence estimates. Among beneficiaries of all ages, annual incidence of DED in 2012 (the most recent year with complete information available) was 0.87% (women 1.21%, men 0.55%), making it third in ranking of ocular conditions with the highest incidence, following disorders of refraction/accommodation (1.87%) and cataracts (1.50%). The annual incidence of all other ocular conditions – including other disorders of the eye, other retinal disorders, disorders of the conjunctiva, and glaucoma – was ≤0.8%.
Annual incidence of DED increased each year, from 0.55% in 2008 to 0.61% in 2009, 0.68% in 2010, 0.74% in 2011, and 0.87% in 2012, while the incidence of the other common ocular conditions either declined or remained relatively unchanged over time (Figure 3). Disorders of refraction/accommodation declined from 2.48% in 2008 to 1.87% in 2012, cataracts declined from 1.76% to 1.50%, and other disorders of the eye declined from 0.83% to 0.80%.
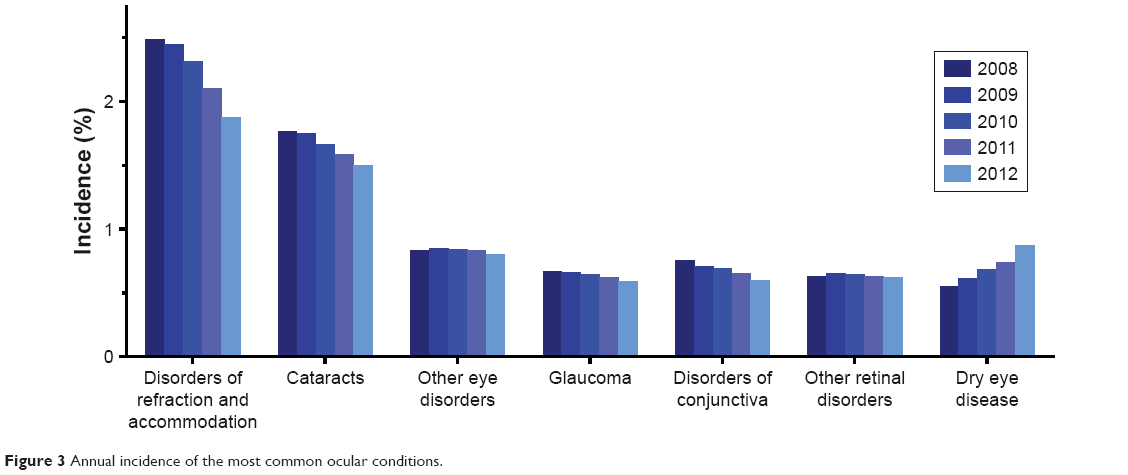 | Figure 3 Annual incidence of the most common ocular conditions. |
Annual incidence of DED was higher among women than men, across all age groups (Figure 4) except for those aged 2–17 years (≤0.01%, 2008–2012, both sexes).
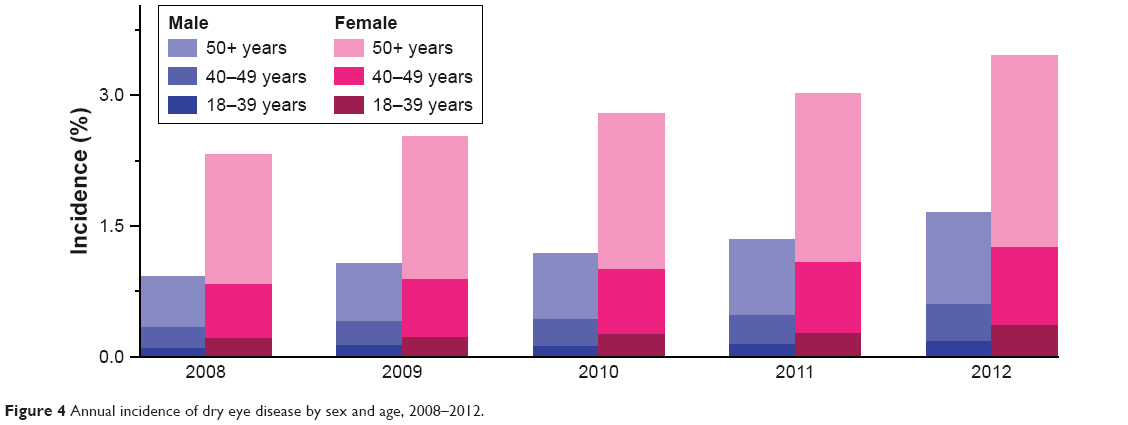 | Figure 4 Annual incidence of dry eye disease by sex and age, 2008–2012. |
Incidence of DED was highest among those aged ≥50 years; for women (≥50 years), the annual incidence increased from 1.49% to 2.20% between 2008 and 2012, while an increase from 0.58% to 1.05% occurred in men of the same age. Generally, all other ocular conditions had a higher incidence in women than in men. Of all the other ocular conditions with the highest incidence in 2012 (disorders of refraction/accommodation, cataracts, other disorders of eye, other retinal disorders, disorders of conjunctiva, glaucoma), women showed a higher incidence relative to men.
Discussion
Results from this retrospective analysis of the comprehensive US DOD MHS claims database provided evidence of DED as a highly prevalent ocular condition relative to other ocular conditions. In fact, between 2003 and 2015, DED was the sixth most prevalent ocular condition (5.28%; n=513,988) – after disorders of refraction/accommodation, cataracts, glaucoma, disorders of conjunctiva, and other retinal disorders – among 9.7 million people covered by the MHS. When projected to the US population using the 2015 US Census data, nearly 16 million people in the United States are affected by DED.4 In addition, the previous study4 found that the annual prevalence rates of DED tripled from 2005 to 2012, with likely increases anticipated in subsequent years. The reasons for the increases in the prevalence of DED over time could not be evaluated in this study; however, improvements in the awareness of DED among patients and health care professionals could also contribute to the increasing prevalence. Thus, in the aggregate, data from the present study provide further support for the significant increase in DED prevalence and emphasize the importance of this condition as a major ocular morbidity in the United States.
With regard to prevalence of other ocular conditions, according to 2010 US statistics from the National Eye Institute, 17.1% of people ≥40 years of age are affected by cataracts and 1.9% with open-angle glaucoma. The prevalence rate of cataracts is similar to that observed in the present study (17.14%); however, the glaucoma rate is lower than the rate observed in the present study (7.27%). The higher prevalence of glaucoma in the present study could be due to the inclusion of beneficiaries with all types of glaucoma (ie, open-angle, closed-angle, and pre-glaucoma) than open-angle glaucoma alone.6
Among ocular conditions with the highest incidence between 2008 and 2012, DED ranked third, with an annual incidence of 0.87% in 2012. Among common ocular conditions, DED had the largest increase in annual incidence, rising by a factor of 1.6 from 2008 to 2012. Furthermore, this study showed an increase in the incidence and prevalence of DED across age groups. These results may be associated with greater awareness and better recognition of DED by health care practitioners in clinical settings in recent years. The annual incidences of other ocular conditions remained relatively stable or decreased over time.
An important strength of this study is the large sample of beneficiaries available in the MHS database that are geographically and demographically representative of the population in the United States. One important limitation of this retrospective study is the difficulty in identifying all beneficiaries with DED in the study population. There is no unique ICD diagnosis code to specifically identify patients with DED when using claims data, and eye care and health care professionals may vary in how they code the signs and symptoms of DED, therefore causing one to question whether all patients are being included. This study used a combination of diagnoses, procedures, and prescription fills to identify patients, hoping to minimize the inclusion of patients with related conditions. However, the combination of codes used to identify patients with DED may overlap with other conditions, possibly allowing for an inconsequential number of patients being included in the study population. A second limitation is that the databases used for this study contained health care claims, which could include inaccuracies or omissions in coded procedures, diagnoses, or pharmacy claims that might lead to misidentification of DED and other ocular conditions.
Nonetheless, our results show that DED is relatively common among the most prevalent ocular conditions, and the incidence and prevalence of this condition have been increasing over recent years. With the increases in incidence and prevalence of DED, a greater number of patients are impacted by DED. Symptoms of DED, including irritation, stinging, dryness, ocular fatigue, and visual disturbances can affect the QoL of patients due to discomfort and the effects on visual function and visual performance.1 In the Beaver Dam Offspring Study,7 symptoms of dry eye were associated with significantly lower scores on health-related QoL instruments (36-Item Short Form Survey; National Eye Institute Visual Functioning Questionnaire-25 [NEI-VFQ-25]) when controlling for age, sex, and comorbid conditions, indicating a poorer QoL. For example, lower scores on all 12 of the NEI-VFQ-25 subscales (eg, driving, general health, and general vision) were observed in participants with dry eye symptoms compared with those without symptoms; results for ocular pain scores showed the largest difference between the two groups. Na et al showed an association between clinically diagnosed DED (or DED symptoms) and severe psychological stress, depressive mood, and anxiety/depression problems in a population-based cross-sectional study of 6,655 Korean women.8
In addition to the effects on a patient’s QoL, there is an economic burden associated with DED.1 Studies have shown increases in direct costs (eg, health care professional visits, pharmacologic therapies, and surgical procedures)3,9–11 and indirect costs (eg, loss of work days and loss of work productivity)3,12,13 associated with DED that can impact a patient and the health care system. From a payer’s perspective, DED in the United States was associated with an average annual direct cost of management of $783/patient with DED and an average overall direct cost of $3.84 billion/year.3,14 Annual loss of productivity was estimated to be $6,160/patient with a definite diagnosis of DED in Japan, and the annual cost of managing DED from a societal perspective was $11,302/patient in the United States.3,15
Conclusion
These findings, based on claims data, provide further epidemiologic evidence for DED as a commonly occurring ocular surface condition that results in patients seeking treatment. With the potential negative impact of DED on patients’ lives, it is important for health care professionals to be aware of the prevalence of DED, and to adequately diagnose and treat patients who present with DED symptoms. Additionally, it is important for payers and health care planners to better appreciate the growing burden of DED; given the trends in incidence and the aging of our population, the social burden of DED will only increase.
Disclaimer
Research data were derived from an approved Naval Medical Research Unit Dayton protocol (NAMRUD.2015.0005). The views expressed in this article are those of the authors and do not necessarily reflect the official policy or position of the Department of the Navy, Department of Defense, or the United States Government. Copyright Notice: Lieutenant Commander Bradley was a military service member at the time of this study. This work was prepared as part of his official duties. Title 17 U.S.C. 105 provides that “Copyright protection under this title is not available for any work of the United States Government.” Title 17 U.S.C. 101 defines United States Government work as a work prepared by a military service member or employee of the United States Government as part of that person’s official duties.
Acknowledgments
This study was funded by Shire, now a part of Takeda. The authors thank Lisa O’Brien, PharmD, of Excel Scientific Solutions, who provided medical writing assistance, funded by Shire, now a part of Takeda. The abstract of this paper was presented at the 2017 Congress of the German Ophthalmological Society/Deutsche Ophthalmologische Gesellschaft (DOG) as a poster presentation. The poster’s abstract was published in “Abstracts zur DOG 2017” in Der Ophthalmologe 2017;114(Suppl2):S124. DOI 10.1007/s00347-017-0551-6. The abstract of this paper was also presented at the 2017 XXXV Congress of the European Society of Cataract & Refractive Surgery as a free paper (oral) presentation (http://www.escrs.org/abstracts/details.asp?confid=24&sessid=104 4&type=free&paperid=28258).
Disclosure
IÖS is an employee of and owns stock/stock options in Takeda. IP and AG are employees of Analysis Group, Inc., which has received consultancy fees from Shire, now a part of Takeda. AME is an employee of Health ResearchTx LLC, which has received consultancy fees from Shire , now a part of Takeda. RD is a consultant for Aldeyra Therapeutics, Dompé, Kala Pharmaceuticals, and Takeda, and reports receiving grant support from Allergan and the National Eye Institute. JLB reports no conflicts of interest in this work.
References
Stapleton F, Alves M, Bunya VY, et al. TFOS DEWS II epidemiology report. Ocul Surf. 2017;15(3):334–365. | ||
Craig JP, Nichols KK, Akpek EK, et al. TFOS DEWS II definition and classification report. Ocul Surf. 2017;15(3):276–283. | ||
Yu J, Asche CV, Fairchild CJ. The economic burden of dry eye disease in the United States: a decision tree analysis. Cornea. 2011;30(4):379–387. | ||
Dana R, Bradley JL, Guerin A, et al. Estimated prevalence and incidence of dry eye disease based on a coding analysis of a large and wide age range health care system in the United States. Am J Ophthalmol. In press. | ||
Dana R, Bradley JL, Guerin A, Pivneva I, Evans AM, Özer Stillman I. Comorbidities and prescribed medications in patients with or without dry eye disease: a population-based study. Am J Ophthalmol. 2019;198:181–192. | ||
National Eye Institute. Statistics and Data. Available from: https://www.nei.nih.gov/eyedata/. Accessed April 16, 2018. | ||
Paulsen AJ, Cruickshanks KJ, Fischer ME, et al. Dry eye in the Beaver Dam Offspring Study: prevalence, risk factors, and health-related quality of life. Am J Ophthalmol. 2014;157(4):799–806. | ||
Na KS, Han K, Park YG, Na C, Joo CK. Depression, stress, quality of life, and dry eye disease in Korean women: a population-based study. Cornea. 2015;34(7):733–738. | ||
Fiscella RG, Lee JT, Walt JG, Killian TD. Utilization characteristics of topical cyclosporine and punctal plugs in a managed care database. Am J Manag Care. 2008;14(3 Suppl):S107–S112. | ||
Galor A, Zheng DD, Arheart KL, et al. Dry eye medication use and expenditures: data from the medical expenditure panel survey 2001 to 2006. Cornea. 2012;31(12):1403–1407. | ||
Mizuno Y, Yamada M, Shigeyasu C. Annual direct cost of dry eye in Japan. Clin Ophthalmol. 2012;6:755–760. | ||
McDonald M, Patel DA, Keith MS, Snedecor SJ. Economic and humanistic burden of dry eye disease in Europe, North America, and Asia: a systematic literature review. Ocul Surf. 2016;14(2):144–167. | ||
Patel VD, Watanabe JH, Strauss JA, Dubey AT. Work productivity loss in patients with dry eye disease: an online survey. Curr Med Res Opin. 2011;27(5):1041–1048. | ||
Uchino M, Schaumberg DA. Dry eye disease: impact on quality of life and vision. Curr Ophthalmol Rep. 2013;1(2):51–57. | ||
Uchino M, Uchino Y, Dogru M, et al. Dry eye disease and work productivity loss in visual display users: the Osaka study. Am J Ophthalmol. 2014;157(2):294–300. |
 © 2019 The Author(s). This work is published and licensed by Dove Medical Press Limited. The full terms of this license are available at https://www.dovepress.com/terms.php and incorporate the Creative Commons Attribution - Non Commercial (unported, v3.0) License.
By accessing the work you hereby accept the Terms. Non-commercial uses of the work are permitted without any further permission from Dove Medical Press Limited, provided the work is properly attributed. For permission for commercial use of this work, please see paragraphs 4.2 and 5 of our Terms.
© 2019 The Author(s). This work is published and licensed by Dove Medical Press Limited. The full terms of this license are available at https://www.dovepress.com/terms.php and incorporate the Creative Commons Attribution - Non Commercial (unported, v3.0) License.
By accessing the work you hereby accept the Terms. Non-commercial uses of the work are permitted without any further permission from Dove Medical Press Limited, provided the work is properly attributed. For permission for commercial use of this work, please see paragraphs 4.2 and 5 of our Terms.