")
Back to Journals » Breast Cancer: Targets and Therapy » Volume 9
Drug-screening and genomic analyses of HER2-positive breast cancer cell lines reveal predictors for treatment response
Authors Jernström S, Hongisto V, Leivonen SK, Due EU, Tadele DS, Edgren H, Kallioniemi O, Perälä M, Mælandsmo GM, Sahlberg KK
Received 22 June 2016
Accepted for publication 17 August 2016
Published 21 March 2017 Volume 2017:9 Pages 185—198
DOI https://doi.org/10.2147/BCTT.S115600
Checked for plagiarism Yes
Review by Single anonymous peer review
Peer reviewer comments 4
Editor who approved publication: Professor Pranela Rameshwar
Sandra Jernström,1,2 Vesa Hongisto,3 Suvi-Katri Leivonen,1,2 Eldri Undlien Due,1 Dagim Shiferaw Tadele,1 Henrik Edgren,4,5 Olli Kallioniemi,4 Merja Perälä,6 Gunhild Mari Mælandsmo,2,7,8 Kristine Kleivi Sahlberg,1,9
1Department of Cancer Genetics, Institute for Cancer Research, Oslo University Hospital, 2KG Jebsen Centre for Breast Cancer Research, Institute for Clinical Medicine, University of Oslo, Oslo, Norway; 3Misvik Biology Oy, Turku, 4Institute for Molecular Medicine Finland (FIMM), University of Helsinki, Helsinki, 5Medisapiens, Helsinki, Finland, 6VTT Technical Research Centre of Finland, Turku, Finland; 7Department of Tumor Biology, Institute for Cancer Research, Oslo University Hospital, Oslo, Norway; 8Institute of Pharmacy, Faculty of Health Sciences, University of Tromsø, Tromsø, 9Department of Research, Vestre Viken Hospital Trust, Drammen, Norway
Background: Approximately 15%–20% of all diagnosed breast cancers are characterized by amplified and overexpressed HER2 (= ErbB2). These breast cancers are aggressive and have a poor prognosis. Although improvements in treatment have been achieved after the introduction of trastuzumab and lapatinib, many patients do not benefit from these drugs. Therefore, in-depth understanding of the mechanisms behind the treatment responses is essential to find alternative therapeutic strategies.
Materials and methods: Thirteen HER2 positive breast cancer cell lines were screened with 22 commercially available compounds, mainly targeting proteins in the ErbB2-signaling pathway, and molecular mechanisms related to treatment sensitivity were sought. Cell viability was measured, and treatment responses between the cell lines were compared. To search for response predictors and genomic and transcriptomic profiling, PIK3CA mutations and PTEN status were explored and molecular features associated with drug sensitivity sought.
Results: The cell lines were divided into three groups according to the growth-retarding effect induced by trastuzumab and lapatinib. Interestingly, two cell lines insensitive to trastuzumab (KPL4 and SUM190PT) showed sensitivity to an Akt1/2 kinase inhibitor. These cell lines had mutation in PIK3CA and loss of PTEN, suggesting an activated and druggable Akt-signaling pathway. Expression levels of five genes (CDC42, MAPK8, PLCG1, PTK6, and PAK6) were suggested as predictors for the Akt1/2 kinase-inhibitor response.
Conclusion: Targeting the Akt-signaling pathway shows promise in cell lines that do not respond to trastuzumab. In addition, our results indicate that several molecular features determine the growth-retarding effects induced by the drugs, suggesting that parameters other than HER2 amplification/expression should be included as markers for therapy decisions.
Keywords: ErbB2, drug screening, gene expression, pharmacogenomics, predictors
Introduction
Although breast cancer therapies have become more personalized, not all patients benefit from the treatment. Approximately 15%–20% of breast cancers have an amplification of the chromosome region 17q12–17q21,1 and are termed HER2/ErbB2-positive cases. ErbB2 is a receptor tyrosine kinase encoded by the ERBB2 gene. These patients are treated with trastuzumab, a monoclonal humanized antibody targeting the extracellular domain of ErbB2, or lapatinib, a small-molecule EGFR–ErbB2 dual tyrosine-kinase inhibitor. Although both drugs have reduced poor survival rates, more than half of patients do not benefit from treatment.2
Phosphorylation of ErbB2 leads to activation of prosurvival mechanisms via the PI3K and MAPK pathways.3 Both trastuzumab and lapatinib inhibit ErbB2 and inactivate its downstream signals. PTEN and INPP4B are negative regulators of the PI3K pathway,4 and loss of PTEN and/or mutation in PIK3CA have been shown to promote resistance to trastuzumab and lapatinib through activation of the PI3K pathway.5–9 Mutations in PIK3CA are associated with increased risk of progression and shorter overall survival in HER2-positive patients.8,10 Also mutations in ERBB2 have been suggested as mechanism of resistance to trastuzumab,11 and nonamplified patients with ERBB2 mutations are reported to benefit from HER2-targeted therapies.12 Due to the lack of response/development of resistance to trastuzumab and lapatinib, it is essential to understand the underlying mechanisms to develop new treatment strategies and to improve patient outcome.
Several studies have suggested drug sensitivity to be dependent on the mutation and expression of specific cancer genes, and Garnett et al showed that most cancer genes were associated with either sensitivity or resistance to one or more drugs.13 In addition, sensitivity was associated with mutation in at least one cancer gene. Another study based on the Cancer Cell Encyclopedia analyzed the response of 24 anticancer drugs across 479 cell lines and reported several gene expression-based predictors of drug sensitivity,14 emphasizing the importance of taking multiple factors into account when searching for response markers.
In this study, 13 HER2-positive breast cancer cell lines were screened with 22 commercially available compounds to search for alternative mechanisms to be used in targeting HER2-positive cancers that do not respond to current therapeutic strategies. Genomic and transcriptomic profiles were explored to search for predictors for drug sensitivity. Alterations of several genes were associated with the sensitivity of certain drugs, and in silico analyses using elastic-net regression analyses identified additional gene–drug associations of 13 compounds, indicating that several molecular features are required for the cells to react to a certain treatment. This emphasizes the importance of not only measuring ErbB2 levels but also including other factors, such as mutations of specific genes and protein levels, to predict the appropriate treatment for HER2-positive breast cancers. We propose these types of in silico analyses in addition for functional experiments, to be able to understand the mechanisms behind drug sensitivity and to find biomarkers for treatment response.
Materials and methods
Cell culturing
Thirteen HER2-positive breast cancer cell lines were used in this study (Table 1). AU565, BT474, HCC1419, HCC1569, HCC1954, HCC202, MDA-MB-453, and SKBR3 were obtained from the American Type Culture Collection (ATCC; Manassas, VA, USA), and EFM-192A and JIMT1 from the German Collection of Microorganisms and Cell Cultures (DSMZ; Braunschweig, Germany). ATCC and DSMZ authenticate human cell lines by DNA typing using short tandem repeats. SUM190PT and SUM225 were provided by S Ethier from Karmanos Cancer Institute in Michigan, USA, and KPL4 by J Kurebayashi from Kawasaki Medical School in Japan. The growth media are described in Table S1. Cells were cultured for a maximum of 30 passages prior to use. ER statuses for the cell lines were obtained from the literature,15–19 and only BT474 and EFM192A were ER-positive.
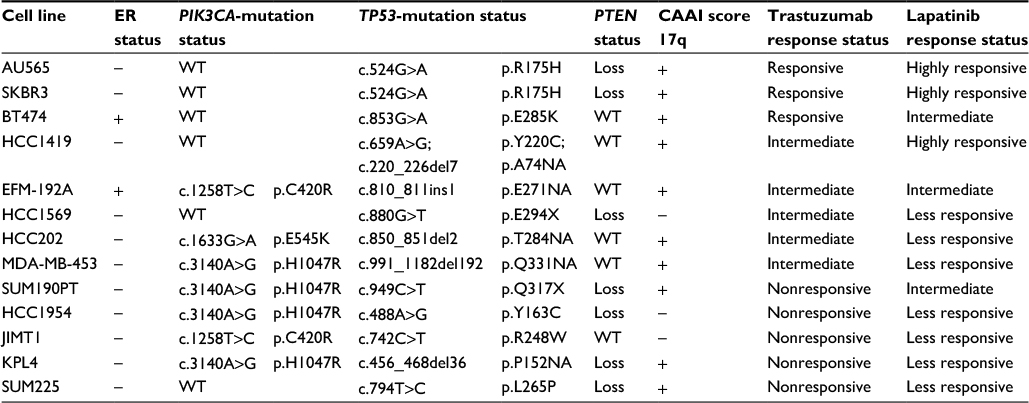 | Table 1 HER2 breast cancer cell-line panel Notes: HER2-positive cell lines with ER status as noted in the literature.38–42 PIK3CA and TP53 mutations with codon position and protein change, PTEN status based on copy number data, CAAI score for 17q, and response to trastuzumab and lapatinib. Abbreviations: WT, wild type; CAAI, complex arm-wise aberration index. |
Mutation analyses of PIK3CA and TP53
All cell lines were sequenced for detection of mutations in PIK3CA (exons 9 and 20) and TP53 (exons 2–11). For PIK3CA, 10 ng DNA was used for polymerase chain reaction (PCR) touchdown with HotStarTaq DNA polymerase (Qiagen NV, Venlo, Netherlands).20 The PCR products were visualized on 1.5% agarose gel, and the products were cleaned with EpMotion 5075 (Eppendorf AG, Hamburg, Germany). For the sequencing reactions, 3 μl of the purified PCR product and BigDye Terminator version 1.1 reaction mix was used. Sequencing reactions were performed on an MJ Research Tetrad DNA Engine (Bio-Rad Laboratories Inc, Hercules, CA, USA), and cleaned on Sephadex minicolumns (GE Healthcare, Little Chalfont, UK). Sequencing was performed on a 3730 DNA analyzer (Thermo Fisher Scientific, Waltham, MA, USA). For TP53, 5 ng DNA was used and BigDye Direct Cycle Sequencing Kit (AB) and BigDye XTerminator Purification Kit (AB) were used. The principle has previously been described.21 All mutation scoring was performed in SeqScape version 2.7 (AB) by two independent investigators.
aCGH analysis
Array-based CGH analysis has previously been described for nine of the cell lines,22 available at the Gene Expression Omnibus (http://www.ncbi.nlm.nih.gov/projects/geo) GSE34236. The four remaining cell lines are available at GSE58886. Piecewise-constant fitting of copy-number data was done in R23 using the CRAN package Copynumber24 with K-min =5, gamma =4, and gamma =150. Estimates obtained with gamma =4 were used for determining PTEN levels. Cell lines with estimate below ~–0.3 were classified with loss in PTEN. The complex arm-wise aberration index (CAAI) was calculated for the cell lines according to the algorithm described in Russnes et al.25 A rough segmentation was preferred for this analysis, and a gamma of 150 was used. CAAI was calculated both chromosome-wise and overall for the cell lines.
Gene-expression analysis
Gene expression was measured using Affymetrix Human Genome U133 plus 2.0 GeneChip oligonucleotide arrays (Affymetrix, Santa Clara, CA, USA). Per sample, 3 μg of total RNA was prepared according to the manufacturer’s protocols, and 15 µg of fragmented complementary RNA was used for hybridization. The arrays were stained with phycoerythrin–streptavidin, and signal intensity was amplified by treatment with a biotin-conjugated antistreptavidin antibody, followed by a second staining using phycoerythrin–streptavidin. The arrays were scanned using the GeneChip Scanner 3000. Data were preprocessed using the R language,23 and the RMA method implementation in Bioconductor package Affy.26 Alternative CDF files (version 14) mapping Affymetrix probes directly to Ensembl gene IDs were used in preprocessing,27 resulting in one expression value per Ensembl gene ID. Ensembl gene positions are based on Ensembl database version 63 (hg19). The data were log2-normalized. The gene-expression profiles for all cell lines are available at GEO at GSE58700.
Drug-screening and cell-viability assays
The cell lines were screened using a library of 22 compounds (Table S2). The compounds were printed in seven dilutions (0.34 pM–20 µM) and two technical replicates with a Hamilton robot (Hamilton Robotics Inc, Reno, NV, USA) in 384-well plates (Corning Inc, Corning, NY, USA). The cell amounts ranged from 500 to 2,250 cells/well depending on cell line. Each cell line was screened in two biological replicates. The screening was conducted for 5 days, and cell viability was measured using a CellTiter-Glo assay (Promega Corporation, Fitchburg, WI, USA), where luminescence signal was read by a MicroBetaTriLux (PerkinElmer, Waltham, MA, USA). Cell viability was converted into relative response using the average of the lowest concentrations of all compounds as control. The relative response was further corrected through compound-wise normalization to the average response of the three lowest concentrations. Drug responses were plotted in GraphPad Prism version 5.0 (GraphPad Software, San Diego, CA, USA), and half-maximal inhibitory concentration (IC50) values were obtained for compounds that showed effect.
Apoptosis assays
Four cell lines (HCC1954, KPL4, MDA-MB-453, and SUM190PT) were treated with Akt1/2 kinase inhibitor with dilutions ranging from 10 pM to 10 µM and apoptosis was measured using Caspase-Glo. Cell lines were treated in three technical replicates for two days. Cells without treatment were used as control. Luminescence was read by MicroBetaTriLux (PerkinElmer). Apoptosis was calculated as percentage of controls.
Western blotting
Four cell lines (HCC1954, KPL4, MDA-MB-453, and SUM190PT) were treated with 2 µM Akt1/2 kinase inhibitor for 5, 10, 15, 30, 60, 90, and 120 minutes, and 24 hours, and protein lysates were collected. The samples were run on 4%–20% Mini-Protean TGX precast gels (Bio-Rad), and transferred to nitrocellulose membranes (Trans-Blot Turbo Mini PVDF transfer packs; Bio-Rad) by using the Trans-Blot Turbo transfer system. p-Akt (Ser473, 9271S; Cell Signaling Technology, Boston, MA, USA), total Akt (9272S; Cell Signaling Technology), MAPK8 (SAPK/JNK, 9258P; Cell Signaling Technology), and pMAPK8 (phospho-SAPK/JNK, #4668P, Cell Signaling Technology Inc.) were used as primary antibodies and peroxidase-conjugated antibodies were used as secondary antibodies. α-Tubulin (T9026; Sigma-Aldrich, St Louis, MO, USA) was used as loading control. The Supersignal West Dura extended-duration substrate (Thermo Fisher Scientific) was used as enhanced-chemiluminescence horseradish-peroxidase substrate. The signals were developed on Amersham Hyperfilm ECL (GE Healthcare).
Statistical and bioinformatic analyses
One-way analysis of variance (ANOVA) was used to distinguish the response groups obtained from the IC50 curves for trastuzumab and lapatinib. Bonferroni correction for multiple testing was used for P-values <0.05. One-way ANOVAs were also calculated to distinguish differences in both trastuzumab and lapatinib response depending on PIK3CA and PTEN status. Mutated PIK3CA, wild-type PTEN, mutated PIK3CA, loss in PTEN, and wild-type PIK3CA (PTEN status indifferent) were analyzed. All ANOVAs were performed in SPSS version 21 (IBM, Armonk, NY, USA).
Spearman’s correlation for gene expression and compound response were calculated using R, and the significant correlations (P<0.05) were plotted with the package Gplots.28 Linear regression was calculated in order to get the intercept for the lines in the plots. For correlation, 189 ErbB2-pathway genes were selected based on KEGG,29,30 Gene Ontology,31 BioCarta,32 and WikiPathways.33 Expressions of these genes were correlated one by one with maximum growth inhibition (cell viability at the lowest – cell viability at the highest).
Elastic-net analysis was performed to identify gene–drug associations. Elastic-net analysis is a regression that takes several features into account simultaneously when calculating for predictors. For the analysis, mutation status for PIK3CA, loss in PTEN, and ER and CAAI status, in addition to the 189 ErbB2-pathway genes, were used as possible predictors. The R package Elasticnet34,35 was used for this purpose. The overlapping genes from correlation and elastic-net analyses were subjected to IPA for complex ‘omics data to explore the networks.
Results
PIK3CA- and TP53-mutation status of the cell-line panel
Thirteen HER2-positive breast cancer cell lines were chosen for this study (Table 1). The cell lines were sequenced for PIK3CA and TP53 mutations, as these have previously been associated with trastuzumab resistance6 and development of HER2-positive breast cancers.36 Six cell lines had wild-type PIK3CA: AU565, BT474, HCC1419, HCC1569, SKBR3, and SUM225. Four cell lines – HCC1954, KPL4, MDA-MB-453, and SUM190PT – shared the same activating PIK3CA mutation in exon 20 (c.3140A>G, p.H1047R), while HCC202 had a mutation in exon 9 (c.1633G>A, p.E545K). The two remaining cell lines, EFM-192A and JIMT1, did not harbor mutations in exon 9 or 20, but have previously been reported mutated in exon 7 (c.1258T>C, p.C420R).36,37 We thus classified them as mutated. TP53-mutation screening showed that all the cell lines harbored inactivating mutations in different codons (Table 1).
PTEN status and complex arm-wise aberration index from copy-number data
Loss of PTEN has been suggested to lead to decreased response of trastuzumab and lapatinib.4,7,37 PTEN status was determined using copy-number data as a surrogate for PTEN-protein level, since copy number has previously been shown to correlate with protein levels.38 Seven cell lines showed loss of PTEN – AU565, HCC1569, HCC1954, KPL4, SKBR3, SUM190PT, and SUM225 – while the remaining were wild type. We also calculated CAAI scores25 where all cell lines were positive, meaning that they had chromosomal rearrangements in at least one chromosome arm. For 17q (where ERBB2 is located), all except three cell lines (HCC1569, HCC1954, and JIMT1) had a positive CAAI score, indicating large chromosomal rearrangements (Table 1).
HER2-positive cell lines are sensitive to the PI3K–Akt–mTOR pathway inhibitors
Thirteen HER2-positive cell lines were screened using a library of 22 compounds (Table S2) to identify compounds that inhibit cell viability. The compounds clustered into four groups based on their effect on cell viability (Figure 1). Group 1 consisted of five compounds – bevacizumab and AAL-993 (VEGFR inhibitors), AG538 (IGFR), PD184352 and UO126 (MEK/Erk) – with no or little effect. Group 4 showed highest effects on cell viability, and included lapatinib and afatinib (dual EGFR/ErbB2 inhibitors), radicicol (HSP90), doxorubicin hydrochloride (DNA replication), and bortezomib (proteasome). Groups 2 and 3 showed varying effects across the cell lines tested.
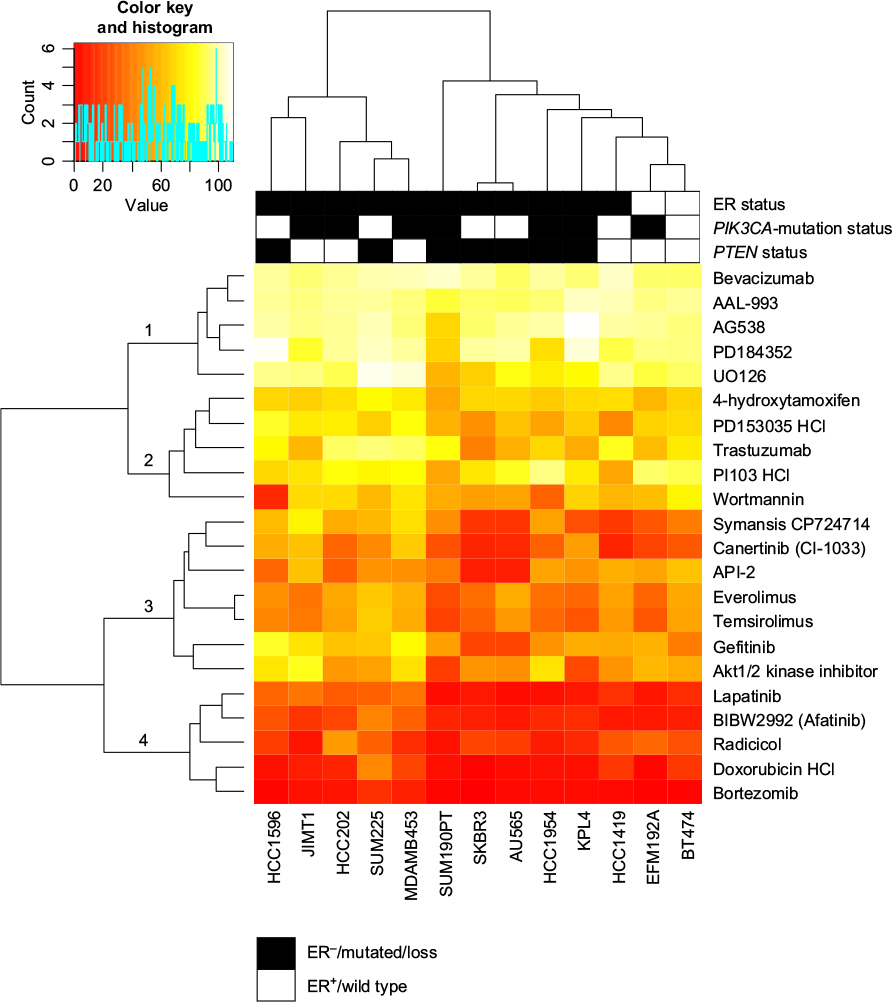 | Figure 1 Heat map of maximum cell-growth inhibition induced by the individual compounds in the various cell lines. Notes: Cell responses were visualized as a heat map by using the R package Gplots, where relative cell viability at the maximum compound concentration is plotted for each compound. Red indicates an effective compound (low cell viability), whereas yellow to white indicates little to no loss in viability (70%–100% viable cells). The compounds clustered into four groups based on the response, with cluster 1 being the least effective and cluster 4 the most effective growth inhibitors. ER status, black negative, white positive; PIK3CA-mutation status, white wild type, black mutated; PTEN status, black loss, white wild type. |
Compounds that affected cell growth at two or more concentrations (2 and 20 µM) in at least two cell lines were used for further analyses. The cutoff for growth inhibition was set to 50% for the highest concentration and to 20% for the second highest. Thirteen compounds met these criteria: trastuzumab and Symansis CP-724714 (ErbB2 inhibitors), gefitinib (EGFR), afatinib and lapatinib (dual EGFR/ErbB2 inhibitors), canertinib (pan-ErbB), Akt1/2 kinase inhibitor and API2 (Akt), radicicol (HSP90), everolimus and temsirolimus (mTOR), doxorubicin HCl (topoisomerase II), and bortezomib (proteasome). This indicates that the PI3K–Akt–mTOR pathway may be an attractive target in HER2-positive breast cancers.
The proteasome inhibitor bortezomib showed the highest growth inhibition of the compounds tested, whereas the two mTOR inhibitors induced >20% growth inhibition over the widest concentration (20 µM–20 nM). AU565, BT474, and SKBR3 were the most responsive cell lines tested showing sensitivity to 12 compounds (excluding Akt1/2 kinase inhibitor). JIMT1 showed the most modest response, as only five compounds (bortezomib, doxorubicin HCl, everolimus, radicicol, and temsirolimus) induced a clear inhibition of cell viability. The two MAPK-pathway inhibitors did not show any effect on cell viability in the cell lines tested (Figure 1 and Table S3).
Three groups of response were identified for both trastuzumab and lapatinib
At the second-highest concentration of trastuzumab (0.52 µM), the cell lines formed three groups (P<0.001, Figure 2A). These groups were named responsive (>20% growth inhibition), intermediately responsive (<20% growth inhibition), and nonresponsive (no growth inhibition). Based on this, AU565, BT474, and SKBR3 were defined as responsive, EFM-192A, HCC202, HCC1569, HCC1419, and MDA-MB-453 as intermediately responsive, and HCC1954, JIMT1, KPL4, SUM190PT, and SUM225 as nonresponsive (Table 1). MDA-MB-453 is known as an apocrine cell-line model, and HER2-positive apocrine breast carcinomas harbor alterations in the PI3K-signaling pathway.39,40 Cell lines with wild-type PIK3CA showed a better response to trastuzumab than cell lines with PIK3CA mutation (P<0.001, Figure 3A). Loss of PTEN together with PIK3CA mutation led to further resistance to trastuzumab (P<0.001, Figure 3A).
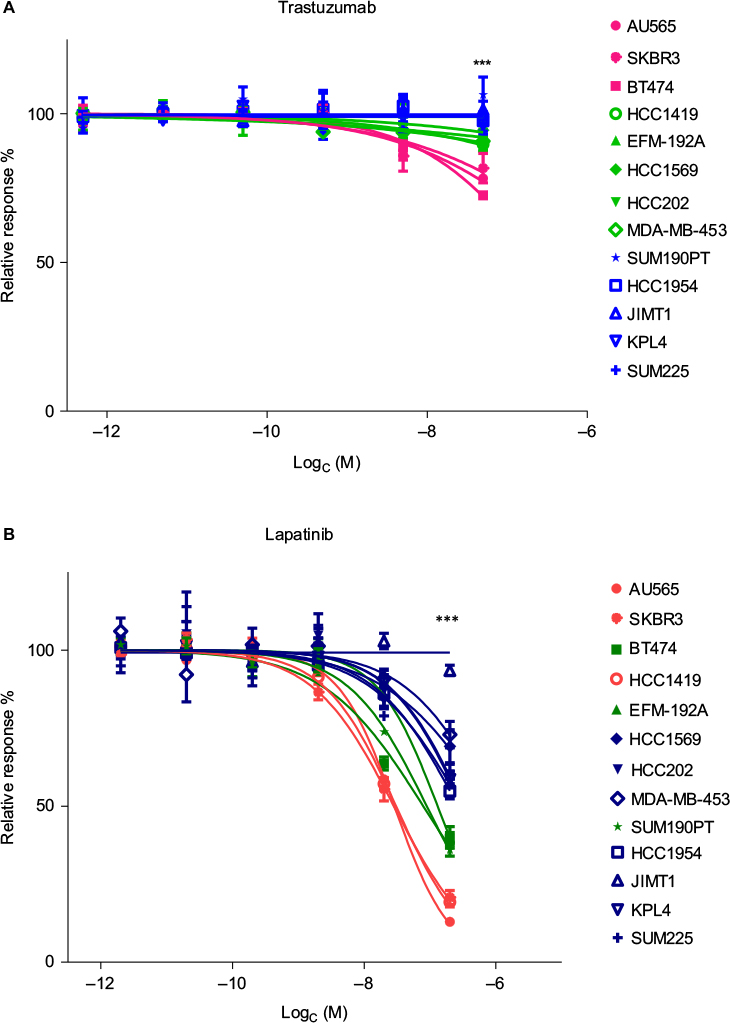 | Figure 2 Cell lines divided into three groups based on response to trastuzumab and lapatinib. Notes: (A) The cell lines were divided into three groups based on trastuzumab response: nonresponsive cell lines (blue), intermediate (<20% growth inhibition [GI], green) and responsive (>20% GI, pink). For this grouping, the most significantly differentiating concentration (0.52 µM, P<0.001) was used (the highest concentration has been left out of the graph). (B) The cell lines were divided into three groups based on the lapatinib response. The most significant differences between the groups were seen at 2 µM concentration (P<0.001). The three groups were less responsive (<50% GI, blue), intermediately responsive (60%–65% GI, green), and highly responsive (>75% GI, red) (highest concentration left out). ***P<0.001. |
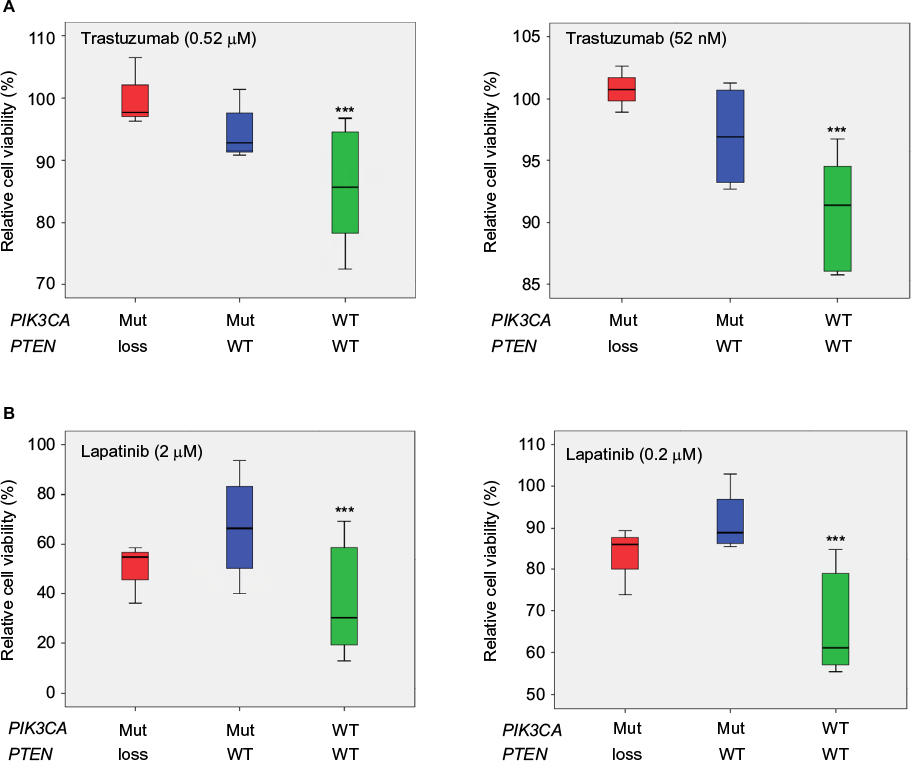 | Figure 3 Box plots showing trastuzumab and lapatinib response in 13 HER2 positive cell lines relative to PIK3CA and PTEN status. Notes: The x-axes show mutation status, where red is PIK3CA-mutated (Mut) and PTEN loss; blue is PIK3CA-Mut and PTEN wild type (WT); green is PIK3CA WT and PTEN WT. (A) The effects on trastuzumab response. The PIK3CA-Mut cell lines were more resistant than the WT to trastuzumab (P<0.001 for the second- and third-highest concentrations [left and right panel, respectively]). PTEN loss in addition to Mut PIK3CA increased resistance to trastuzumab (P<0.001 for the second and third concentrations). (B) Effects on lapatinib response. Cell lines with Mut PIK3CA were significantly more resistant to lapatinib (P<0.001 for second- and third-highest concentrations) than the rest. PTEN loss did not show any additional effect on lapatinib response. ***P<0.001. |
All cell lines responded well to lapatinib in vitro, except JIMT1, which responded only at the highest (20 µM) concentration. However, the cell lines divided into three groups based on the response to lapatinib at the second-highest concentration (2 µM, P<0.001, Figure 2B). The categories were less responsive (<50% growth inhibition), intermediately responsive (60%–65%), and highly responsive (>75%) (Table 1). Mutation in PIK3CA led to less response (P<0.001, Figure 3B), while PTEN status did not influence the response to lapatinib.
Akt1/2 kinase inhibitor significantly inhibited cell growth in two trastuzumab-nonresponsive cell lines
Nonresponsive cell lines mimic HER2 cancers that do not respond to treatment. Therefore, it is of high interest to find drugs that inhibit cell growth in these cases. One such compound was the Akt1/2 kinase inhibitor, where two trastuzumab-nonresponsive cell lines (KPL4 and SUM190PT) responded well (P<0.001 for the two highest concentrations, Figure 4A). To investigate mechanisms for sensitivity, we compared molecular features and found that all nonresponsive cell lines were ER-negative (Table 1). Furthermore, KPL4 and SUM190PT had the same mutation in PIK3CA, loss in PTEN, and both were positive for CAAI 17q. The three remaining trastuzumab-nonresponsive cell lines had either negative CAAI 17q (HCC1954 and JIMT1) or wild-type PIK3CA (SUM225).
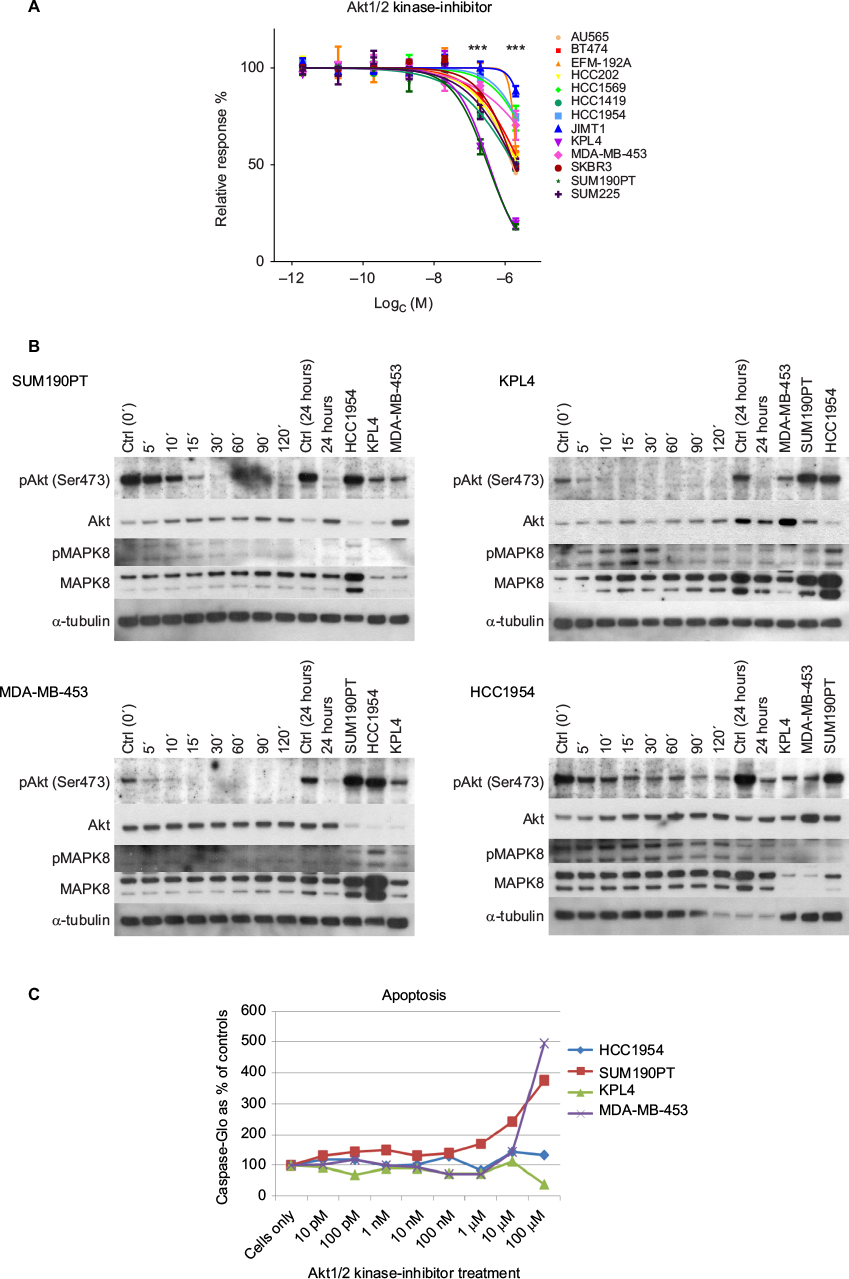 | Figure 4 Akt1/2 kinase-inhibitor response. Notes: (A) Cell viability. Two cell lines KPL4 (trastuzumab nonresponsive, lapatinib less responsive) and SUM190PT (trastuzumab nonresponsive, lapatinib intermediate) showed significant growth inhibition at the two highest concentrations of the Akt1/2 inhibitor (***P<0.001). (B) Western blot analysis. pAkt, total Akt, pMAPK8, total MAPK8, and α-tubulin levels in HCC1954, KPL4, MDA-MB-453, and SUM190PT cells treated with the Akt1/2 kinase inhibitor. All four cell lines showed a decrease in the level of pAkt upon treatment with the inhibitor. However, HCC1954 still had detectable pAkt after 24 hours of treatment, which could explain the resistance. (C) Induction of apoptosis. Cells were incubated with Akt1/2 kinase inhibitor for 2 days and apoptosis was measured. MDA-MB-453 and SUM190PT showed induced apoptosis, whereas KPL4 and HCC1954 did not. |
To verify the effect of the Akt1/2 kinase inhibitor, we analyzed the phospho-Akt (pAkt) and total Akt levels in KPL4 and SUM190PT, together with two cell lines that did not respond to the inhibitor: HCC1954 (nonresponsive) and MDA-MB-453 (intermediately responsive). Akt1/2 kinase inhibitor indeed decreased pAkt in all four cell lines (Figure 4B), while total Akt levels were not affected by the treatment.
To determine whether induction of apoptosis caused the decreased cell viability induced by the Akt1/2 kinase inhibitor, we measured the activity of caspase 3/7 in the treated cells by Caspase-Glo® assay. MDA-MB-453 and SUM190PT showed induced apoptosis at the highest concentration. As expected, HCC1954 did not show increased apoptosis, but neither did KPL4. However, it is possible that the decreased cell viability in KPL4 was mediated through other pathways (Figure 4C).
Correlation of gene expression and cell viability revealed 116 gene–drug associations
To learn more about genes involved in the response to ErbB2-targeted therapy, we correlated the drug responses to gene-expression levels of 189 ErbB2-related genes in the same cell lines. A total of 116 significant gene–drug correlations were identified (Table S4). Expression levels of ten genes (BCAR1, BRAF, CAMK2D, CDKN1A, ERBB3, EREG, HDAC1, SHC3, TGFA, and TP53) were significantly associated with the response to trastuzumab, whereas ten genes (BRAF, CDC42, ERBB3, GAB1, GRB7, NRG3, NRG4, RRAS2, STMN1, and TGFA) were significantly associated with lapatinib response. High expression levels of BRAF (positive correlation), ERBB3 (negative correlation), and TGFA (positive correlation) were found correlated with both trastuzumab and lapatinib response. Interestingly, high BRAF expression correlated with stronger response for five more compounds, of which four (afatinib, canertinib, gefitinib, and Symansis CP724714) were targeting EGFR-family members and one (bortezomib) the proteasome. High ERBB3 expression was negatively correlated with responses to the mTOR inhibitors everolimus and temsirolimus. TGFA expression was positively correlated with afatinib, bortezomib, doxorubicin HCl, gefitinib, and Symansis CP724714 responses. Correlation analysis of gene expression with Akt1/2 kinase-inhibitor response suggested the involvement of seven genes: CDC42, EPN1, GAB1, MAPK8, PAK6, PLCG1, and PTK6.
Elastic-net analysis revealed additional predictors for drug responses
To investigate gene–drug associations as possible predictors for treatment outcome, we performed elastic-net analysis.34,35 In addition to the 189 ErbB2-related genes, ER status, PIK3CA-mutation status, PTEN status, and CAAI score were included in the analysis. A total of 186 predictors were identified (Table S4). When compared to the 116 significant gene–drug associations identified by correlation analysis, an overlap of 52 gene–drug associations was seen (Table S5). The 52 associations consisted of 32 unique genes. These 32 genes formed three main networks under interactive pathway analysis (IPA) and coded for proteins involved in cellular growth, proliferation, cellular movement, and cell death and survival (Figures S1–S3). The top five canonical pathways obtained for these networks were: ErbB signaling, HER2 signaling in breast cancer, molecular mechanism of cancer, renal cell carcinoma signaling and neuregulin signaling. Symansis CP724714 had the most overlapping associations between the two analyses, with eleven genes involved.
The elastic-net analysis identified 12 predictors for trastuzumab, of which five were identified also by correlation analysis: BCAR1, CDKN1A, EREG, SHC3, and TGFA. For lapatinib, 14 predictors were identified by elastic-net analysis, of which seven were also found by correlation: BRAF, CDC42, ERBB3, GAB1, NRG4, RRAS2, and TGFA. Overall, the expression levels of five genes that were predicted for lapatinib response were also predictors for other drugs. These were BRAF, CDC42, GAB1, NRG4, and TGFA. Only TGFA was predicted for both trastuzumab and lapatinib response, and had a positive effect on cell viability (high gene expression led to more resistance to the compound). BRAF was also suggested as a predictor for the same five drugs by correlation analysis, indicating an important role for this protein in treatment response in HER2-positive breast cancer.
The elastic-net analysis for Akt1/2 kinase inhibitor revealed 15 predictors, of which five were also found with the gene–drug correlations: CDC42, MAPK8, PAK6, PLCG1, and PTK6 (Figure 5 and Table S5). When more factors were included in the analysis, CDC42 was no longer predictive (Figure 5). MAPK8 was the strongest predictor for response to Akt1/2 kinase inhibitor. The protein and phosphorylation levels of MAPK8 were thus tested in the cell lines after Akt1/2 kinase-inhibitor treatment. KPL4 showed increased phosphorylation of MAPK8, peaking at 15 minutes’ treatment, a transient increase followed by a gradual decrease in phosphorylation were observed in HCC1954, whereas no phosphorylation was observed in MDA-MB-453 or SUM190PT (Figure 4B).
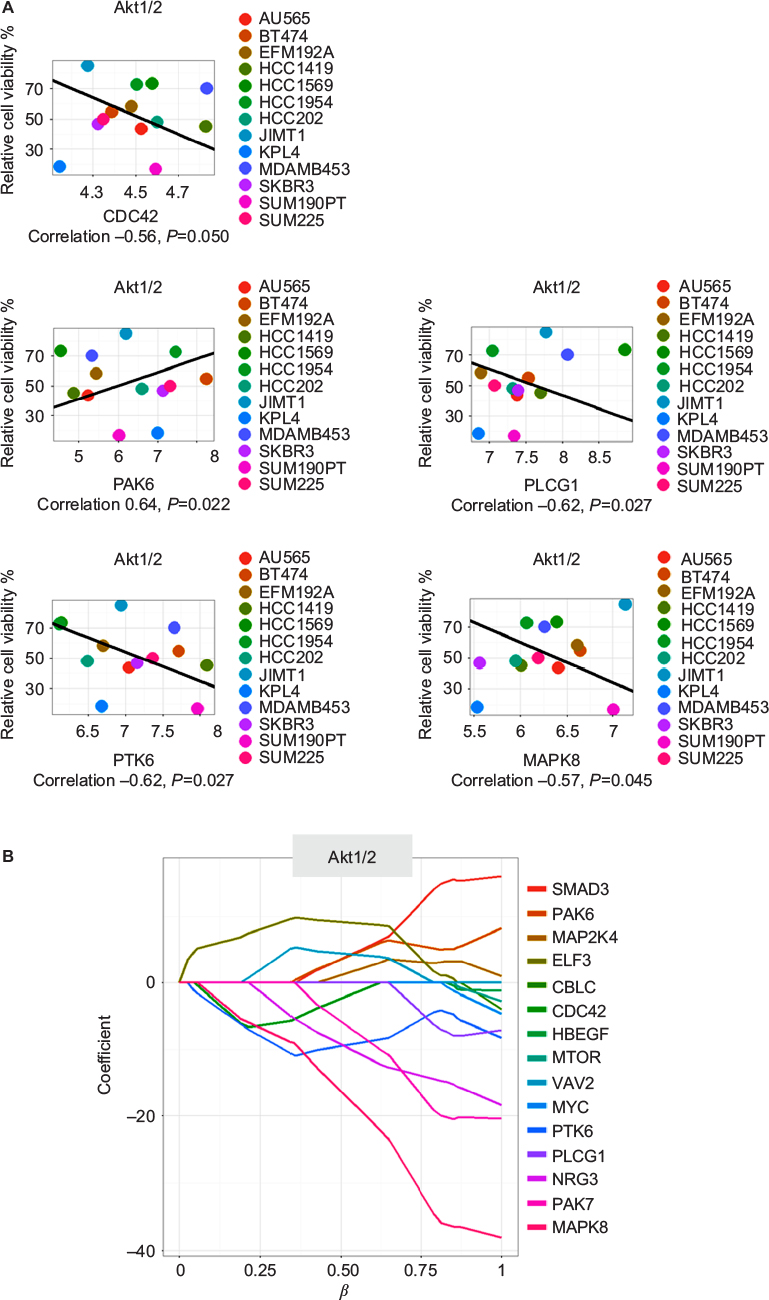 | Figure 5 The five drug–gene associations found by both Spearman’s correlation and through elastic-net analysis for the Akt1/2 kinase inhibitor. Notes: (A) Correlation plots. The x-axes show gene expression in log2 scale. (B) Elastic-net plot. The x-axis shows the effect of the predictor (gene) and the amount of predictors at a certain cutoff. The y-axis shows the effect on cell viability of the predictor (gene), where a positive value indicates more viability and less response, and a negative value indicates less viable cells and better response to the compound. |
Discussion
Treatment resistance is a challenge in cancer management, and for patients diagnosed with HER2-positive breast cancer, less than half will respond to the currently used compounds trastuzumab and lapatinib.2 It has been shown that HER2-positive patients with mutation in PIK3CA and/or loss in PTEN are less responsive,5–8 but it is believed that other mechanisms are also involved.41 Therefore, more studies to unravel the molecular mechanisms in treatment response in HER2-positive cancers are crucial to obtain more precise treatment decisions and identify patients that will not benefit from the current treatment.
In this study, 13 HER2+ breast cancer cell lines, characterized on PIK3CA and TP53 mutation status and PTEN expression, were screened with a library of 22 compounds. Drug responses were compared to the molecular profiles of the cell lines. Thirteen compounds, including inhibitors that targeted either of the EGFR family members, the downstream signaling targets Akt, HSP90, or mTOR, topoisomerase II, or the proteasome, were analyzed. The inhibitors of the MAPK pathway did not show any effect on cell viability, possibly because the cells were grown in two dimensions and not as spheroids.42 However, as only two MAPK-pathway inhibitors were included in the screen, one targeting MEK and the other the downstream molecule Erk, no conclusions could be made.
As trastuzumab and lapatinib are used in the clinic, we classified the cells based on response to these compounds. For both drugs, the cell lines were separated into three groups, showing significant growth-inhibiting differences at the second-highest concentrations (0.52 µM and 2 µM, respectively; P<0.001). The groups did not overlap, which supports the use of both trastuzumab and lapatinib for this patient group. However, we observed that mutated PIK3CA followed by an additional loss in PTEN added resistance to trastuzumab, which could be explained by an activation of the PI3K pathway, as previously suggested.5–8 We observed that mutation in PIK3CA led to increased resistance also to lapatinib, but no additional resistance due to PTEN loss. This is in line with a study by Xia et al,43 where a knockdown of PTEN by small interfering RNA did not interfere with lapatinib response. HER2 patients that do not show response to first-line treatment are less likely to respond to subsequent treatments, due to de novo resistance.44,45 Several clinical studies have shown increased pathological complete response in HER2-positive breast cancer patients when trastuzumab is given in combination with another drug.2,46,47 Combinatorial treatment of HER2-positive breast cancers thus leads to better outcome, indicating the need to consider alternative pathways leading to response, in addition to HER2 status.
We were particularly interested in compounds that showed effect in cells that did not respond well to either trastuzumab or lapatinib. The Akt1/2 kinase inhibitor showed a growth inhibitory effect in two of the trastuzumab non-responsive cell lines (KPL4 and SUM190PT). Two Akt inhibitors were included in the compound library: API2 and Akt1/2 kinase inhibitor (Table S2). API2 inhibits Akt directly, and Akt1/2 kinase inhibitor inhibits the Akt-activating kinase. All cell lines responded to API2, and no clear differences between trastuzumab-responsive groups were observed. This suggests that Akt could be a key target in HER2-positive cancers and inhibition in the PI3K pathway to avoid effects of PIK3CA mutation and PTEN loss may be effective, which has also been suggested by Wang et al.48
The two trastuzumab-nonresponsive cell lines, KPL4 and SUM190PT (both with mutated PIK3CA and loss in PTEN), were significantly more sensitive to the Akt1/2 kinase inhibitor than the rest of the cell-line panel. For SUM190PT, apoptosis was the main cause of decrease in cell viability. KPL4 did not show induced apoptosis, and underwent some other type of cell death or cell arrest. pAkt levels did indeed decrease after treatment with Akt1/2 kinase inhibitor in all four cell lines tested, verifying the inhibition of Akt phosphorylation. Through elastic-net and correlation analyses, several predictors for the Akt1/2 kinase-inhibitor response are suggested. Importantly, MAPK8 was predicted as the main factor, as high expression resulted in a more pronounced growth-inhibiting effect of the Akt1/2 kinase inhibitor. pMAPK8 protein levels in KPL4 increased after Akt1/2 kinase-inhibitor treatment, but remained constant in the other cell lines tested. MAPK8 is involved in regulation of stress-induced apoptosis and cell proliferation, and thus cells with high expression might be more prone to apoptosis. Furthermore, both KPL4 and HCC1954 showed Akt1/2 inhibitor-dependent changes in their MAPK8-phosphorylation patterns indicate an important role for MAPK8 in the trastuzumab- and lapatinib-resistant HER2-positive cells. The four other genes (CDC42, PLCG1, PTK6, and PAK6) are in the same network as MAPK8, implying this network to be highly important for the function of this inhibitor (Figure S1).
The cell lines submitted to elastic-net analysis were too few to determine the optimal amount of predictors; however, the results could still indicate mechanisms behind the drug response. Correlation and elastic-net analysis together identified 32 unique genes in 52 gene–drug associations for 13 compounds. These gene–drug associations could potentially be used as predictors for treatment outcome. However, all genes included in the analyses were chosen based on their involvement in the ErbB2 pathway. Therefore, one of the main cellular pathways obtained from IPA was cellular growth and proliferation. Five genes that predicted lapatinib response were predictors for other drugs. These were BRAF, CDC42, GAB1, NRG4, and TGFA. BRAF, CDC42, and GAB1 are included in the same network (Figure S1). High BRAF expression led to better drug response for six pan-ErbB inhibitors and one proteasome inhibitor. BRAF is downstream from RAS in the MAPK pathway. Garnett et al13 showed that an activating mutation in BRAF (BRAFV600E*) leads to resistance to afatinib (one of the inhibitors found to correlate with BRAF in our data). A reason might be that BRAF does not need the signal from the EGFR family of receptors, but is activated by other mechanisms, as has been suggested for colorectal cancers resistant to EGFR therapies.49 The expression of BRAF in our data was determined from untreated cells. As ERBB2 was amplified in the cell panel, it led to higher activity and thereby higher expression of downstream signals, such as BRAF.
ERBB3 expression was a unique predictor for lapatinib response when analyzed by elastic-net analysis, but when considering the correlations, high ERBB3 expression correlated with higher trastuzumab, everolimus, and temsirolimus response. High expression of ERBB3 has repeatedly been suggested as a mechanism of resistance to trastuzumab,46,50–53 which leads to the development of pertuzumab, which blocks ErbB2–ErbB3 dimerization. However, in the elastic-net analysis, ERBB3 expression lost its predictor status for trastuzumab response in our study. Even though the trastuzumab response groups differed significantly, the actual difference in cell viability might not have been sufficient for the elastic-net analysis to capture, and thus these results should be viewed with caution.
Gene expressions of nine EGFR-family ligands54 were included in the analyses, of which three – EREG, NRG4, and TGFA – were suggested as predictors for the response of three drugs. High expression of NRG4 was associated with poorer drug response to lapatinib and Symansis CP724714, high TGFA expression was associated with poorer response to both trastuzumab and lapatinib, and high EREG expression was associated with poorer trastuzumab response. High expression of the ligands leads to an activation of EGFR receptors,55 and it is likely that EREG, NRG4, and TGFA interfere with and activate one of the other EGFRs, thereby overcoming the inhibitory effects of ErbB2 inhibitors. EREG and NRG4 grouped into the same network, mainly consisting of the EGFR family and their immediate downstream signals. TGFA grouped into a network affected by TP53.
Although the outcome for HER2-positive breast cancer patients has improved with the introduction of trastuzumab and lapatinib, still many patients do not respond to the treatment. At present, the decision on whether to offer ErbB2-targeted therapy is solely based on gene amplification/protein expression of the target. However, to reveal up front whether a patient will benefit from the treatment, it is necessary to base the treatment decision on several selection criteria, as drug responses are not explained by one single factor.11,13 Cells try to overcome inhibitions by rewiring their signaling pathways through cross talk with other signals. A mutation that changes the protein can overcome inhibition of another protein further up in the signaling cascade, as has been exemplified with HER2-positive breast cancer cell lines with activating mutations in PIK3CA.5–8 Therefore, in-depth studies for treatment response in cancer should be encouraged, to gain more knowledge of the genotypic and phenotypic events that play important roles in drug sensitivity or resistance. The emphasis should lie on multiple cellular events occurring at the same time and mutations that change the function, rather than focusing on one single event. This knowledge is of high importance for designing new, improved treatments that would be beneficial for patients.
Conclusion
HER2-positive cell lines showed sensitivity to PI3K/Akt-signaling inhibitors, in particular the Akt1/2 kinase inhibitor were efficient in cell lines that did not respond to trastuzumab. Predictors for drug response were identified, and the results indicated that several molecular features influenced the growth-inhibiting effect, suggesting that several factors, in addition to HER2 status, have to be considered to make optimal treatment decisions.
Acknowledgments
The authors would like to thank Anne-Lise Børresen-Dale for valuable comments and discussions, Daniel Nebdal for his technical support in R, and Nadja Katheder at the Department of Biochemistry (Norwegian University Hospital, Radium Hospital) for her assistance with the Western blots. In addition, we would like to thank Nordic Cancer Union, South-Eastern Norway Regional Health Authority, the Academy of Finland, and KG Jebsen Centre for Breast Cancer Research for financial support.
Author contributions
SJ conducted the experiments, analyzed the data, and wrote the manuscript. EUD and DST assisted with the experiments. VH and SKL participated in design and analysis. HE normalized the gene-expression data. OK and MP provided the materials and participated with the design. GMM and KKS designed the project and participated in analysis and writing the manuscript. All authors contributed toward data analysis, drafting and revising the paper and agree to be accountable for all aspects of the work.
Disclosure
The authors report no conflicts of interest in this work.
References
Saini KS, Azim HA Jr, Metzger-Filho O, et al. Beyond trastuzumab: new treatment options for HER2-positive breast cancer. Breast. 2011;20(Suppl 3):S20–S27. | ||
Baselga J, Bradbury I, Eidtmann H, et al. Lapatinib with trastuzumab for HER2-positive early breast cancer (NeoALTTO): a randomised, open-label, multicentre, phase 3 trial. Lancet. 2012;379(9816):633–640. | ||
Hynes NE, Lane HA. ERBB receptors and cancer: the complexity of targeted inhibitors. Nat Rev Cancer. 2005;5(5):341–354. | ||
Bunney TD, Katan M. Phosphoinositide signalling in cancer: beyond PI3K and PTEN. Nat Rev Cancer. 2010;10(5):342–352. | ||
Nagata Y, Lan KH, Zhou X, et al. PTEN activation contributes to tumor inhibition by trastuzumab, and loss of PTEN predicts trastuzumab resistance in patients. Cancer Cell. 2004;6(2):117–127. | ||
Berns K, Horlings HM, Hennessy BT, et al. A functional genetic approach identifies the PI3K pathway as a major determinant of trastuzumab resistance in breast cancer. Cancer Cell. 2007;12(4):395–402. | ||
Wang L, Zhang Q, Zhang J, et al. PI3K pathway activation results in low efficacy of both trastuzumab and lapatinib. BMC Cancer. 2011;11:248. | ||
Jensen JD, Knoop A, Laenkholm AV, et al. PIK3CA mutations, PTEN, and pHER2 expression and impact on outcome in HER2-positive early-stage breast cancer patients treated with adjuvant chemotherapy and trastuzumab. Ann Oncol. 2012;23(8):2034–2042. | ||
Puglisi F, Minisini AM, De Angelis C, Arpino G. Overcoming treatment resistance in HER2-positive breast cancer: potential strategies. Drugs. 2012;72(9):1175–1193. | ||
Razis E, Bobos M, Kotoula V, et al. Evaluation of the association of PIK3CA mutations and PTEN loss with efficacy of trastuzumab therapy in metastatic breast cancer. Breast Cancer Res Treat. 2011;128(2):447–456. | ||
Arribas J, Baselga J, Pedersen K, Parra-Palau JL. p95HER2 and breast cancer. Cancer Re. 2011;71(5):1515–1519. | ||
Ross JS, Gay LM, Wang K, et al. Nonamplification ERBB2 genomic alterations in 5605 cases of recurrent and metastatic breast cancer: an emerging opportunity for anti-HER2 targeted therapies. Cancer. 2016;122(17):2654–2662. | ||
Garnett MJ, Edelman EJ, Heidorn SJ, et al. Systematic identification of genomic markers of drug sensitivity in cancer cells. Nature. 2012;483(7391):570–575. | ||
Barretina J, Caponigro G, Stransky N, et al. The Cancer Cell Line Encyclopedia enables predictive modelling of anticancer drug sensitivity. Nature. 2012;483(7391):603–307. | ||
Wang YC, Morrison G, Gillihan R, et al. Different mechanisms for resistance to trastuzumab versus lapatinib in HER2-positive breast cancers: role of estrogen receptor and HER2 reactivation. Breast Cancer Res. 2011;13(6):R121. | ||
Kurebayashi J, Otsuki T, Tang CK, et al. Isolation and characterization of a new human breast cancer cell line, KPL-4, expressing the Erb B family receptors and interleukin-6. Br J Cancer. 1999;79(5–6):707–717. | ||
Tanner M, Kapanen A, Junttila T, et al. Characterization of a novel cell line established from a patient with Herceptin-resistant breast cancer. Mol Cancer Ther. 2004;3(12):1585–1592. | ||
Aird KM, Ding X, Baras A, et al. Trastuzumab signaling in ErbB2-overexpressing inflammatory breast cancer correlates with X-linked inhibitor of apoptosis protein expression. Mol Cancer Ther. 2008;7(1):38–47. | ||
Gazdar AF, Kurvari V, Virmani A, et al. Characterization of paired tumor and non-tumor cell lines established from patients with breast cancer. Int J Cancer. 1998;78(6):766–774. | ||
Samuels Y, Velculescu VE. Oncogenic mutations of PIK3CA in human cancers. Cell Cycle. 2004;3(10):1221–1224. | ||
Applied Biosystems. DNA Sequencing by Capillary Electrophoresis Chemistry Guide. 2nd ed. Foster City (CA): Applied Biosystems; 2009. | ||
Sahlberg KK, Hongisto V, Edgren H, et al. The HER2 amplicon includes several genes required for the growth and survival of HER2 positive breast cancer cells. Mol Oncol. 2013;7(3):392–401. | ||
R Core Team. The R project for statistical computing. 2014. Available from: https://www.r-project.org. Accessed September 21, 2016. | ||
Nilsen G, Liestøl K, Van Loo P, et al. Copynumber: efficient algorithms for single- and multi-track copy number segmentation. BMC Genomics. 2012;13:591. | ||
Russnes HG, Vollan HK, Lingjærde OC, et al. Genomic architecture characterizes tumor progression paths and fate in breast cancer patients. Sci Transl Med. 2010;2(38):38ra47. | ||
Irizarry RA, Bolstad BM, Collin F, Cope LM, Hobbs B, Speed TP. Summaries of Affymetrix GeneChip probe level data. Nucleic Acids Res. 2003;31(4):e15. | ||
Dai M, Wang P, Boyd AD, et al. Evolving gene/transcript definitions significantly alter the interpretation of GeneChip data. Nucleic Acids Res. 2005;33(20):e175. | ||
Warnes GR, Bolker B, Bonebakker L, et al. Gplots: various R programming tools for plotting data. 2012. Available from: http://cran.r-project.org/package=gplots. Accessed September 21, 2016. | ||
Kanehisa M, Goto S. KEGG: Kyoto Encyclopedia of Genes and Genomes. Nucleic Acids Res. 2000;28(1):27–30. | ||
Kanehisa M, Goto S, Sato Y, Furumichi M, Tanabe M. KEGG for integration and interpretation of large-scale molecular data sets. Nucleic Acids Res. 2012;40(D1):D109–D114. | ||
Dimmer EC, Huntley RP, Alam-Faruque Y, et al. The UniProt-GO Annotation database in 2011. Nucleic Acids Res. 2012;40(Database issue):D565–570. | ||
Nishimura D. BioCarta. Biotech Softw Internet Rep. 2001;2(3):4. | ||
Kelder T, van Iersel MP, Hanspers K, et al. WikiPathways: building research communities on biological pathways. Nucleic Acids Research. 2011;40(Database issue):D1301–D1307. | ||
Zou H, Hastie T. Regularization and variable selection via the elastic net. J R Stat Soc Series B Stat Methodol. 2005;67(2):301–320. | ||
Zou H, Hastie T, Tibshirani R. Sparse principal component analysis. J Comput Graph Stat. 2006;15(2):265–286. | ||
Wilson JR, Bateman AC, Hanson H, et al. A novel HER2-positive breast cancer phenotype arising from germline TP53 mutations. J Med Genet. 2010;47(11):771–774. | ||
Köninki K, Barok M, Tanner M, et al. Multiple molecular mechanisms underlying trastuzumab and lapatinib resistance in JIMT-1 breast cancer cells. Cancer Lett. 2010;294(2):211–219. | ||
Myhre S, Lingjærde OC, Hennessy BT, et al. Influence of DNA copy number and mRNA levels on the expression of breast cancer related proteins. Mol Oncol. 2013;7(3):704–718. | ||
Vranic S, Gatalica Z, Wang ZY. Update on the molecular profile of the MDA-MB-453 cell line as a model for apocrine breast carcinoma studies. Oncol Lett. 2011;2(6):1131–1137. | ||
Vranic S, Marchio C, Castellano I, et al. Immunohistochemical and molecular profiling of histologically defined apocrine carcinomas of the breast. Hum Pathol. 2015;46(9):1350–1359. | ||
Puglisi F, Fontanella C, Amoroso V, et al. Current challenges in HER2-positive breast cancer. Crit Rev Oncol Hematol. 2016;98:211–221. | ||
Pickl M, Ries CH. Comparison of 3D and 2D tumor models reveals enhanced HER2 activation in 3D associated with an increased response to trastuzumab. Oncogene. 2008;28(3):461–468. | ||
Xia W, Husain I, Liu L, et al. Lapatinib antitumor activity is not dependent upon phosphatase and tensin homologue deleted on chromosome 10 in ErbB2-overexpressing breast cancers. Cancer Res. 2007;67(3):1170–1175. | ||
Bonotto M, Gerratana L, Iacono D, et al. Treatment of metastatic breast cancer in a real-world scenario: is progression-free survival with first line predictive of benefit from second and later lines? Oncologist. 2015;20(7):719–724. | ||
Baselga J, Cortes J, Kim SB, et al. Pertuzumab plus trastuzumab plus docetaxel for metastatic breast cancer. N Engl J Med. 2012;366(2):109–119. | ||
Gianni L, Pienkowski T, Im YH, et al. Efficacy and safety of neoadjuvant pertuzumab and trastuzumab in women with locally advanced, inflammatory, or early HER2-positive breast cancer (NeoSphere): a randomised multicentre, open-label, phase 2 trial. Lancet Oncol. 2012;13(1):25–32. | ||
Arteaga CL, Sliwkowski MX, Osborne CK, Perez EA, Puglisi F, Gianni L. Treatment of HER2-positive breast cancer: current status and future perspectives. Nat Rev Clin Oncol. 2012;9(1):16–32. | ||
Wang Q, Ding H, Liu B, et al. Addition of the Akt inhibitor triciribine overcomes antibody resistance in cells from ErbB2/Neu-positive/PTEN-deficient mammary tumors. Int J Oncol. 2014;44(4):1277–1283. | ||
Tian S, Simon I, Moreno V, et al. A combined oncogenic pathway signature of BRAF, KRAS and PI3KCA mutation improves colorectal cancer classification and cetuximab treatment prediction. Gut. 2013;62(4):540–549. | ||
Huang J, Wang S, Lyu H, et al. The anti-ErbB3 antibody MM-121/SAR256212 in combination with trastuzumab exerts potent antitumor activity against trastuzumab-resistant breast cancer cells. Mol Cancer. 2013;12(1):134. | ||
Kirouac DC, Du JY, Lahdenranta J, et al. Computational modeling of ERBB2-amplified breast cancer identifies combined ErbB2/3 blockade as superior to the combination of MEK and AKT inhibitors. Sci Signal. 2013;6(288):ra68. | ||
Garrett JT, Sutton CR, Kurupi R, et al. Combination of antibody that inhibits ligand-independent HER3 dimerization and a p110α inhibitor potently blocks PI3K signaling and growth of HER2+ breast cancers. Cancer Res. 2013;73(19):6013–6023. | ||
Jia Y, Zhang Y, Qiao C, et al. IGF-1R and ErbB3/HER3 contribute to enhanced proliferation and carcinogenesis in trastuzumab-resistant ovarian cancer model. Biochem Biophys Res Commun. 2013;436(4):740–745. | ||
Schneider MR, Wolf E. The epidermal growth factor receptor ligands at a glance. J Cell Physiol. 2009;218(3):460–466. | ||
Arteaga CL, Engelman JA. ERBB receptors: from oncogene discovery to basic science to mechanism-based cancer therapeutics. Cancer Cell. 2014;25(3):282–303. |
 © 2017 The Author(s). This work is published and licensed by Dove Medical Press Limited. The full terms of this license are available at https://www.dovepress.com/terms.php and incorporate the Creative Commons Attribution - Non Commercial (unported, v3.0) License.
By accessing the work you hereby accept the Terms. Non-commercial uses of the work are permitted without any further permission from Dove Medical Press Limited, provided the work is properly attributed. For permission for commercial use of this work, please see paragraphs 4.2 and 5 of our Terms.
© 2017 The Author(s). This work is published and licensed by Dove Medical Press Limited. The full terms of this license are available at https://www.dovepress.com/terms.php and incorporate the Creative Commons Attribution - Non Commercial (unported, v3.0) License.
By accessing the work you hereby accept the Terms. Non-commercial uses of the work are permitted without any further permission from Dove Medical Press Limited, provided the work is properly attributed. For permission for commercial use of this work, please see paragraphs 4.2 and 5 of our Terms.