")
Back to Journals » Nutrition and Dietary Supplements » Volume 15
Drivers of Food Choice Among College Students in Addis Ababa, Ethiopia: A Structural Equation Model
Authors Berhanu H, Gebremichael B, Roba KT , Moges S , Gebremedhin M
Received 1 July 2022
Accepted for publication 27 January 2023
Published 1 February 2023 Volume 2023:15 Pages 1—11
DOI https://doi.org/10.2147/NDS.S379563
Checked for plagiarism Yes
Review by Single anonymous peer review
Peer reviewer comments 2
Editor who approved publication: Dr Chandrika J Piyathilake
Hiwot Berhanu,1 Berhe Gebremichael,1 Kedir Teji Roba,1 Sisay Moges,2 Merhawi Gebremedhin3
1School of Public Health, College of Health and Medical Sciences, Haramaya University, Harar, Ethiopia; 2Department of Family Health, Hossana College of Health Sciences, Hossana, Ethiopia; 3School of Nursing and Midwifery, College of Health and Medical Sciences, Haramaya University, Harar, Ethiopia
Correspondence: Sisay Moges, Email [email protected]
Background: Ethiopia is one of the developing countries hit by the double burden of malnutrition both under and over nutrition. Inappropriate food choice decisions are among the reasons for the problem, which are poorly investigated in the country, and it is concerned with providing information about the drivers of food choice decision-making process behavior that reflects the behavior of the young population, particularly in college students, which provides a window of opportunity for nutritional interventions. Therefore, this study aims to assess drivers of food choice among college students in Addis Ababa, Ethiopia.
Methods and Materials: An institution-based cross-sectional study was conducted among 330 students who were selected using multistage sampling. For analysis, data were input into Epi Info version 7 and exported to STATA version 16.0. To summarize the data, descriptive measures such as frequencies, percentages, and summary measures were employed. Exploratory and confirmatory factor analyses were performed using a structural equation model to identify the driving factors of food choice.
Results: Mood, health concern, sensory appeal, price, convenience, and familiarity were identified as drivers of food choice with significant factor loadings (p < 0.001) and acceptable internal consistency of items (α=0.91). However, the naturalness of the dietary composition and weight concerns have received the least attention.
Conclusion: The study identified various biological, social, and economic factors that drive food choice decisions. Effective nutrition education and preventive interventions should be implemented to reduce unhealthy food decisions among college students through promoting favorable food choice decisions.
Keywords: food drivers, food choice, confirmatory analysis, SEM, Ethiopia, college students
Introduction
Food decisions are the choices made concerning what, when, and how much to eat and food choice decisions determine energy and nutrient intake.1 Food patterns are described by the amount, proportion, variety, combinations, and frequency with which each food is typically consumed. Understanding a population’s eating patterns is critical for generating nutritional and epidemiological profiles, controlling the food market, and aiding in the management of staple food reserves.2 A nutritious diet consumed throughout one’s life helps to avoid malnutrition in all of its manifestations, as well as a variety of noncommunicable diseases (NCDs) and disorders.3 However, expanding urbanization, more processed food production, and changing lifestyles have resulted in a shift in dietary preferences.4,5
In 2016, more than 1.9 billion individuals worldwide were overweight, with over 650 million obese. Moreover, 39% of adults aged 18 and up were overweight, and 13% were obese. The majority of the world’s population lives in nations where being overweight or obese kills more people than being underweight.6
According to studies on the determinants of food choice conducted in several African nations, communities do not stick to dietary standards due to local food beliefs and practices. According to a study on food choice and meal consumption patterns in Southwestern Nigeria, poor eating habits and insufficient nutritional intake among students are caused by poverty.7 Furthermore, physiological, material and symbolic impediments have been connected to a high fat, sugar, and salt diet, as well as a poor consumption of fruits and vegetables.8
Increasing social and commercial effects on food choice, as well as increased wealth, impact variations in dietary consumption.9 Foods that are made affordable, accessible, and appealing are generally energy-dense, nutrient-poor, and take less work from the user to make changes in food surroundings lead to a shift away from traditional nutrient-dense meals and toward diets heavy in saturated fats, salt, processed carbohydrates, and animal-source foods.10 Since food prices and affordability, availability, and quality and safety may be entry points to promote sustainable healthy diets, the framework contained the breadth and depth of content required to identify common drivers – prices and affordability, availability, and vendor and product properties that studies have been indicated those factors were important to having a better understanding of food choice drivers.3,9,11,12
Changes in the food system do not proceed in a linear pattern across nations, and both industrialized and developing countries have experienced and responded to these changes in diverse ways.12 Complex and unprecedented changes in the food system create unique difficulties for the promotion of sustained healthy diets in low- and middle-income countries (LMIC), necessitating context-specific and flexible policies and other initiatives.9,13
There has not been enough research conducted in Ethiopia to create intervention and a better understanding of the factors of food choice. Methodological and socio-demographic shortcomings were observed in the few research undertaken in Ethiopia. Existing studies on adolescent and young adult nutrition in Ethiopia have concentrated on themes such as prevalence and risk factors for malnutrition.14,15 Furthermore, even though the items of the drivers of food choice were created by Steptoe and Pollard in 1995,16 and were later revisited by Lindeman and Vaananen in 2000,17 these items have not been confirmed and identified in Ethiopia, particularly among the young population. As a result, the current study will aid in understanding crucial dietary choice factors in Ethiopia and highlight the gaps in the determinants of food choice throughout this life stage, making college an opportune time to begin life-long health habits, increase long-term quality of life, and lower society’s mortality, morbidity, and healthcare expenses.
Methods and Materials
Study Design, Setting and Population
An institution-based cross-sectional study was conducted in private colleges of Bole Sub City, Addis Ababa, Ethiopia. Bole is one of the 11 sub-cities of Addis Ababa, Ethiopia’s capital. It is located at 9°0’57.24 “latitude and 38°47’59.28” longitude. In 2011, the sub-city had a total population of 328,900 people (Males: 154,542; Females: 174,358). Bole is one of the 11 sub-cities of Addis Ababa, Ethiopia’s capital. It is located at 9°0’57.24 “latitude and 38°47’59.28” longitude. It has 14 districts and a population density per square meter of 2694.1. The sub-city is located in the city’s southeastern suburbs. It shares borders with Yeka, Kirkos, Nifas Silk, Lafto, and Akaky Kaliti. There were 14 private colleges in Bole Sub City, and all students there were source population. Colleges accept and enroll students in social sciences, as well as natural and computational sciences such as information technology, computer science, engineering, economics, accounting, sociology, and other computational sciences, etc. As a result, students from a variety of disciplines were included in the research.
Sample Size Determination
The sample size was determined using single population mean formulas with their corresponding assumption, considering Zα/2 value at 95% confidence level = 1.96, standard deviation (σ) = 1.4918 (E) = 1.5, and design effect (DEF) = 2, adding 10% for the non-response rate, then the final sample size was fixed at 335. Multistage random sampling technique was employed to select four colleges from a total of 14 private colleges in Bole Sub City. Students’ identification number was used to select study participants proportionally from specified departments considering all year students (second through the fourth year) utilizing a lottery method.
Data Collection Method and Measurement
Data were collected by trained research assistants. After reviewing the available literature, the data gathering questionnaire was constructed.7,14,16,17 The reliability or internal consistency of each scale was assessed using Cronbach ‘s alpha values as the reliability estimates.
Data Quality Control
To assure data quality, each data collector and supervisor received two days of rigorous and lengthy training on the final version of the questionnaires before the pre-test and real data collection. Supervisors reviewed the collected data before it was transmitted to the data entry daily. Questionnaires were pre-tested on a 5% sample size of Yanet College and Addis Ketema Industrial College students who were not involved in the study, and changes were made based on pre-test observations. Supervisors reviewed the correctness of the data obtained as well as the overall process of data collection.
Data Processing and Analysis
Data were double entered using Epi info version 7 software. Data were cleaned, coded, and checked for missing and outliers, and then exported to STATA version 16.0 for analysis. The normality of data was checked for continuous variables with both numerical and visual tests. To identify the drivers of food choice, both exploratory and confirmatory factor analysis (CFA) was performed using a structural equation model based on a 4-point Likert scale of 32 food choice item questions and eight latent factors.
Exploratory Factor Analysis
Exploratory factor analysis was used to identify eligible factors under certain constructs and was therefore suitable for confirmatory analysis. Varimax rotations, the most widely used rotational approach, were used to apply EFA. Varimax seeks to reduce the number of variables with large loadings on a factor. This improves the interpretability of the components. Varimax seeks to reduce the number of variables with large loadings on a factor. This improves the interpretability of the components. Therefore, eight factors (constructs) and 32 items were identified based on EFA. Assumptions of sample adequacy (KMO) and strength of the relationship (Bartlett’s test) were evaluated and met. The KMO measures the sampling adequacy; and the closer it is to 1 indicates sizeable sampling adequacy and reasonably, small KMO values indicate that factor analysis of the variables may not be a good idea. From our data, KMO is 0.876 which indicates great sampling adequacy. Furthermore, Bartlett’s test of sphericity is significant; this means that the correlation matrix is not an identity matrix and at least two of the variables are strongly correlated (df (496) = 4835.885, P < 0.001).
Confirmatory Factor Analysis (CFA)
CFA model was constructed based on an a priori nine-factor structure/model.16 The overall acceptance of the structured hypothesis was decided using the goodness-of-fit-indices measurement, and reliability estimates of the standardized factor loadings. The maximum likelihood estimation method was used to produce the estimates of the CFA. Although there is no strict cutoff for R2, over 0.5 is desirable and higher is better. Items with R2 below 0.25 are candidates for removal from a model.19 Concerning the factor loadings, items with standardized factor loadings cut-off levels from 0.5 to 0.95 are adequate to assess convergent validity.20 In this study, all factor loadings are statistically significant at a p-value <0.001 in the model and the acceptable cut-off levels (>0.5). Results of the CFA are presented using tables that provide descriptive statistics of items and factors, correlations between food choice drivers, model goodness-of-fit measures, estimates of the standardized factor loading coefficients with 95% CIs, standard errors, squared multiple correlations (R2), and Cronbach’s alpha value (α).
Results
Socio-Demographic Characteristics of the Respondents
A total of 330 students participated in the study with a 99.2% response rate. Most (68.2%) of the respondents were in the age group between 20 and 24 years with a median (IQR) age of 23.75 (4.00) years, and 229 (69.4%) of the respondents were females. Almost one-third (33%) were in their third year of study. Their family’s mean (±SD) monthly income was 14,242.47 (±13,192.80) Ethiopian Birr (ETB). The mean (+ SD) monthly income was 5324.88 (± 6760.89) ETB for those who reported their income (Table 1).
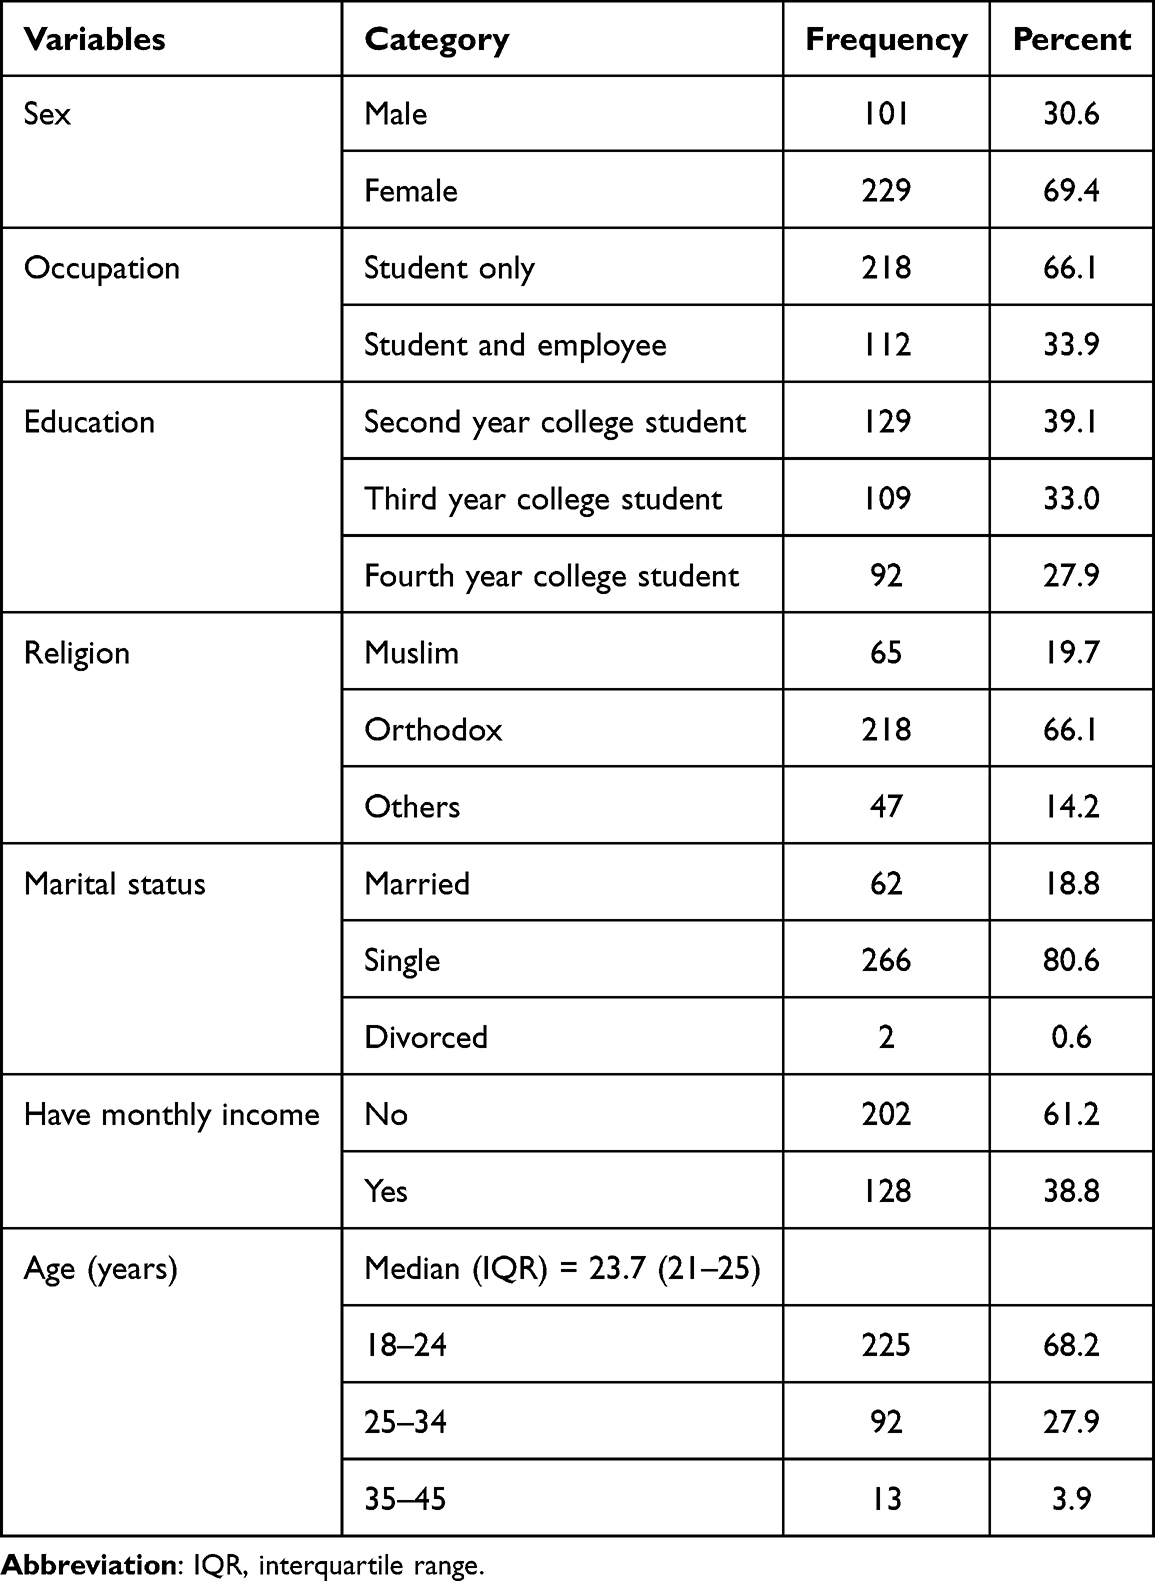 |
Table 1 Socio-Demographic and Economic Characteristics Among Private College Students in Bole Sub City, Addis Ababa, Ethiopia, 2021 (N = 330) |
Exploratory Factor Analysis
We identified factors in exploratory factor analysis that were grouped under certain constructs and were therefore suitable for confirmatory analysis. We identified factors in exploratory factor analysis that were grouped under certain constructs and were therefore suitable for confirmatory analysis. Varimax rotations, the most widely used rotational approach, were used to apply EFA. Therefore, eight factors (constructs) and 32 items were identified based on EFA.
Item Statistics and Scale Reliability
As hypothesized in the original 32-item food choice questionnaire, the eight constructs, i.e. Construct 1 stands for “Mood concern of the diet”; (1a: cheers me up; 1b: helps me relax; 1c: keeps me awake alert; 1c: makes me feel good; 1d: helps me cope with stress; 1e: helps me cope with life). Construct 2 for “Health benefit of the diet”; (2a: is nutritious; 2b: contains a lot of vitamins and minerals; 2c: keeps me healthy: 2d: is high in protein: 2e: is good for my skin teeth hair nails: 2f: is high in fiber and roughage). Construct 3 stands “Sensory role of the diet” (3a: looks nice; 3b: smells nice; 3c: has pleasant texture; 3d: tastes good). Construct 4 stands for “Cost of the food purchased” (4a: is cheap; 4b: is good value for money; 4c: is not expensive). Construct 5 is “suitable/convenience of the food item” (5a: takes no time to prepare; 5b: can be cooked very simply; 5c: is easy to prepare; 5d: is easily available in shops and markets; 5e: close to where I live/work). Construct 6 is “the content being natural” (6a: contains natural ingredients; 6b: contains no artificial ingredients). Construct 7 is for “Familiarity of the food item” (7a: is well-known food; 7b: food I ate when I was a child; 7c: is what I usually eat). Construct 8 stands for “Food role in weight management” (8a: helps me control my weight; 8b: have low in fat content; 8c: is low in calories).
Therefore, most of the items in these constructs show good reliability (Cronbach’s alpha ranging from 0.75 to 0.87) with exceptions for items in “Construct 6” that is about the content of the food being natural (0.55) and “construct 8” that was role of weight controlling (0.67), whereas the overall internal consistency/reliability is very high (α=0.91). Most of the items have an item-to-total correlation above the acceptable level (>0.4). The items 1a “cheer me up” and 1b “helps me relax” from the construct 1 (Mood concern) reveal the highest item-to-total correlation (r = 0.57). This suggests that food that helps students cheer up and relax was a more significant concern in terms of mood. On the other hand, three of the items under the construct 4 “the cost and price concern of the food items” show the lowest item-to-total correlation (r = 0.36). There are also other items having an item-to-total correlation below the acceptable level (<0.4) such as the item 8c under the construct 8 “is low in calories” (0.38), 2b “content of food contains a lot of vitamins and minerals” (0.39), and 6b “contains no artificial ingredients” (0.39). The average (un-weighted) importance assigned by the sample to the 32 items is 2.70 (SD = 0.49) on the 1–4 scale. At the individual level, the item 2c “keeps me healthy” reveals the highest mean score on the scale (mean = 3.03, SD = 0.89), whereas “is high in fiber and roughage” shows the lowest one (mean = 2.44, SD = 0.89) (Table 2).
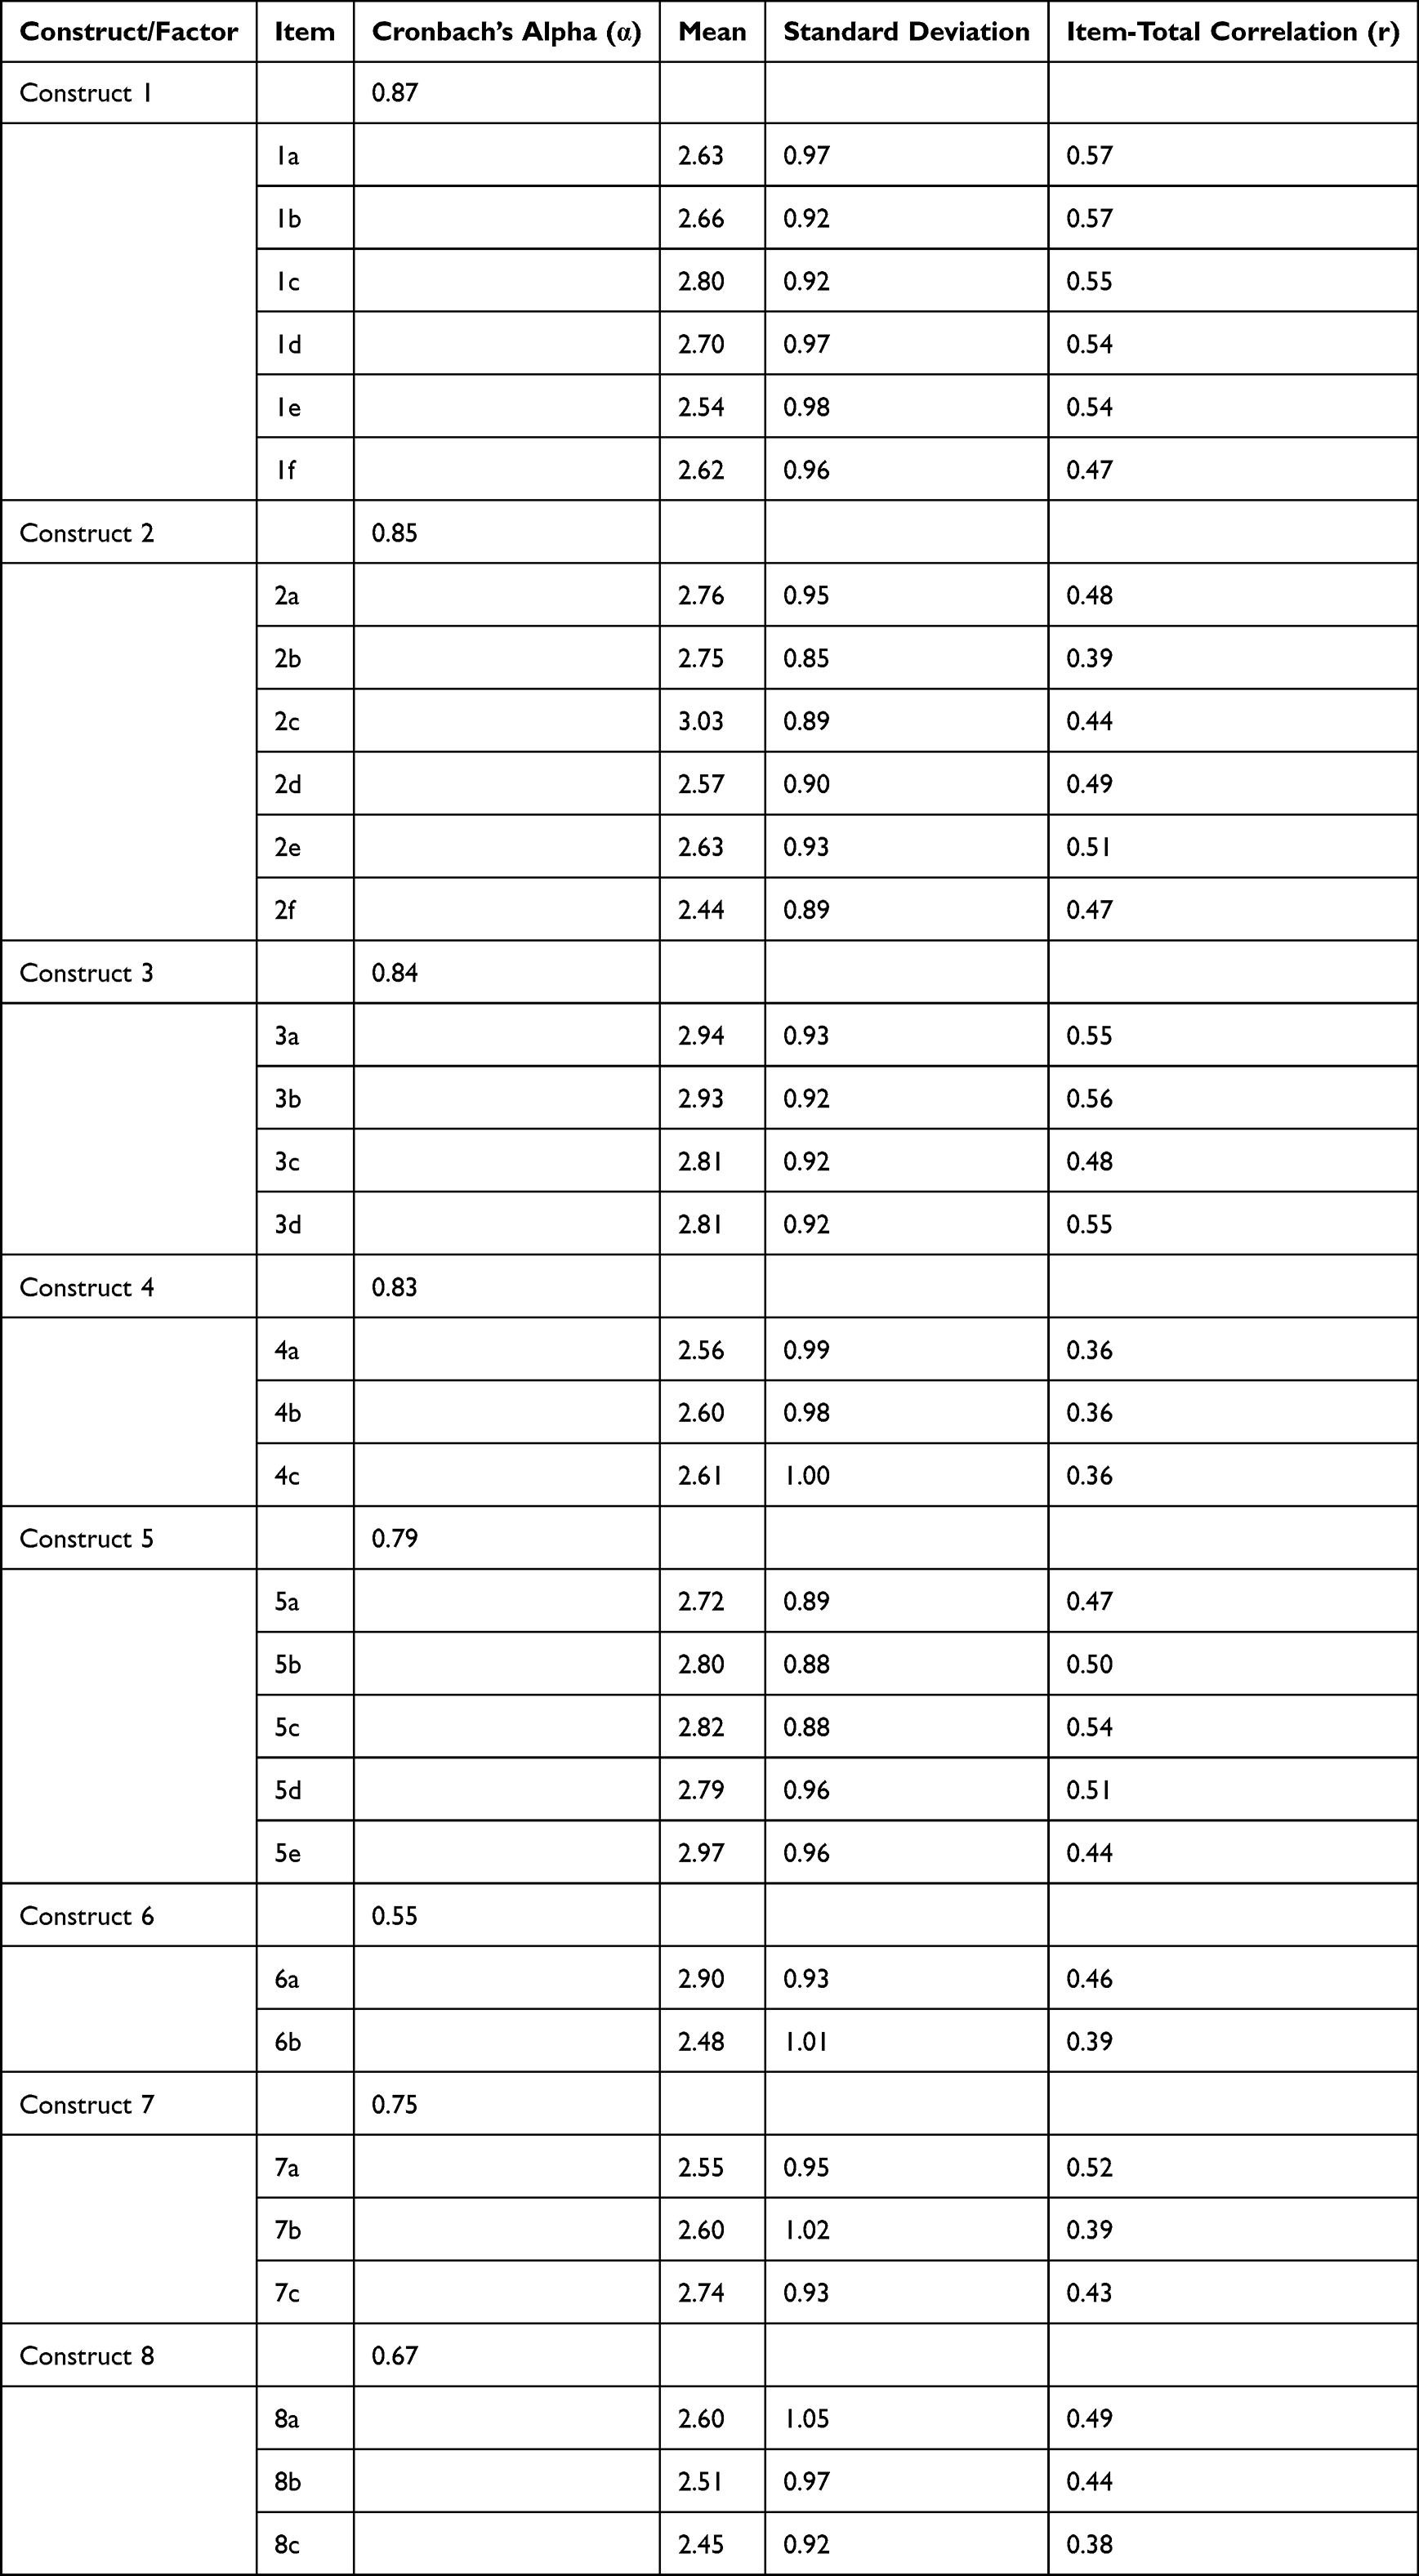 |
Table 2 Descriptive Statistics and Reliability (with 4-Point Scale) of Items on Drivers of Food Choice Among Private College Students in Bole Sub City, Addis Ababa, Ethiopia, 2021 (N = 320) |
Correlation Between Food Choice Drivers
The correlation matrix was conducted to evaluate the relationship between food choice driver constructs. In this correlation, the matrix correlation coefficient (r) was determined with its respective significant value. Thus, mood concern had positive medium-strength association with health concern (r = 0.489, P < 0.001), weak association with familiarity (r = 0.256, P < 0.001), and weight benefit (r = 0.287, P < 0.001). Health concern and convenience had medium level r/n ship (r = 0.455, P < 0.001); furthermore, there was a linear association between sensory appeal and convenience (r = 0.450, P < 0.001) (Table 3).
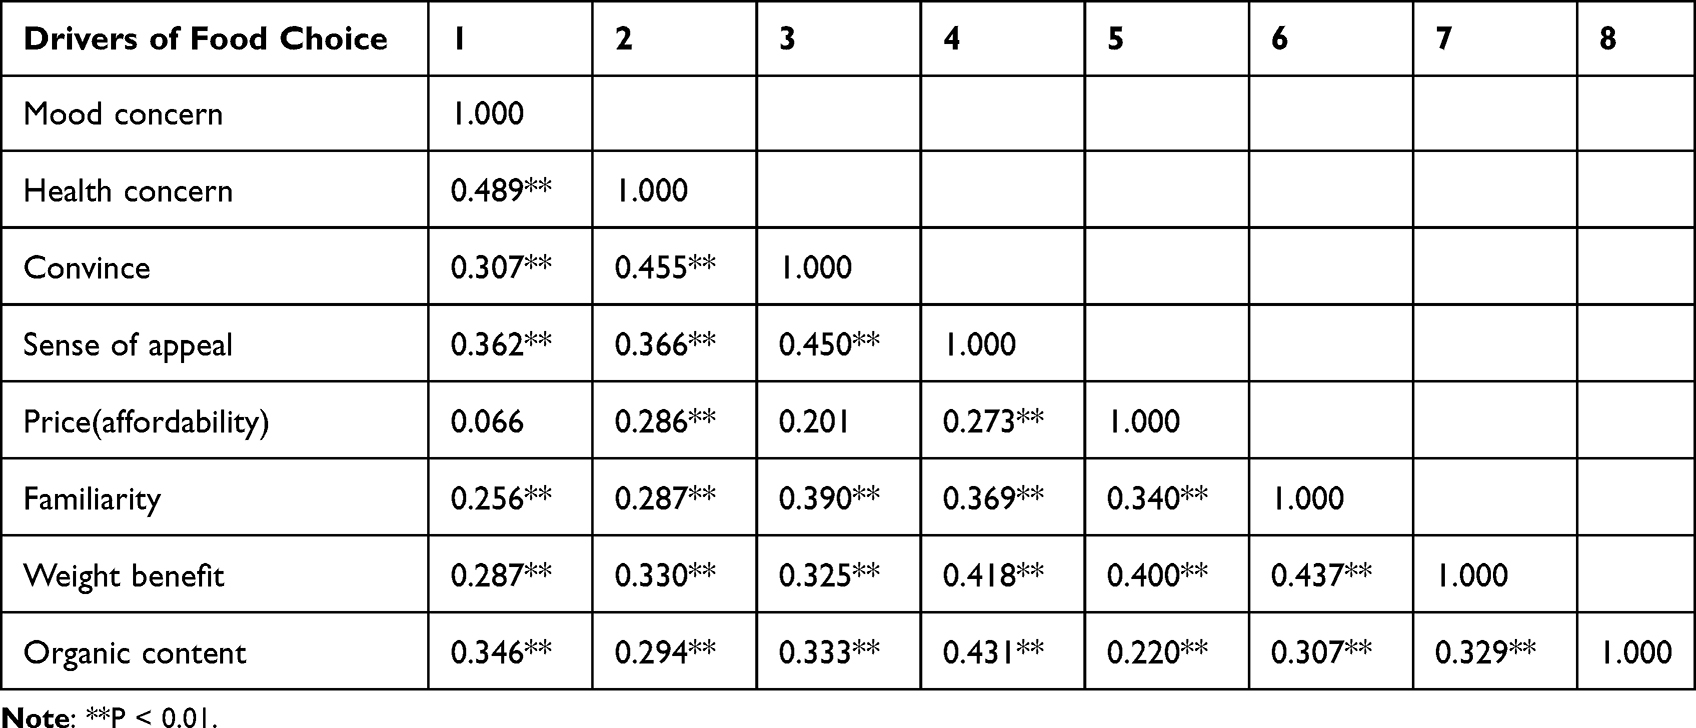 |
Table 3 Correlation Matrix Among Drivers of Food Choice Among Private College Students in Bole Sub City, Addis Ababa, Ethiopia, 2021 (N = 320) |
Confirmatory Analysis Model Results (Estimates)
Confirmatory factor analysis (CFA) was conducted using a structural equation model to measure fit with the original 32 items and the existence of eight underlying independent drivers for food choice. Overall model fit is adequate with two of the measures (RMSEA and SRMR) being in the acceptable cutoffs. In this model, the squared multiple correlations (R2) range from 0.26 for the item “contains no artificial ingredients” to 0.72 for the item “looks nice”. R2 indicates variances explained by a factor on a specific item. The variance explained by the factor construct 3 “sensory appeal” on the item 3b “looks nice” is 72%, and the variance explained by the construct 6 on the item 6b “contains no artificial ingredients” is 26%. The item “contains no artificial ingredients” has the lowest factor loading (0.51) confirming that it is the weakest measure of food choice drivers in the model, whereas the item under construct 3, 3a “looks nice” has the highest factor loading (0.85), indicating the strongest measure.
Factor loadings are interpreted as standardized regression coefficients. For example, as the standardized latent variable (factor) construct 1 when mood concern increases by one unit, the standardized responses to the item “cheer me up” increase by 0.84 (Table 4).
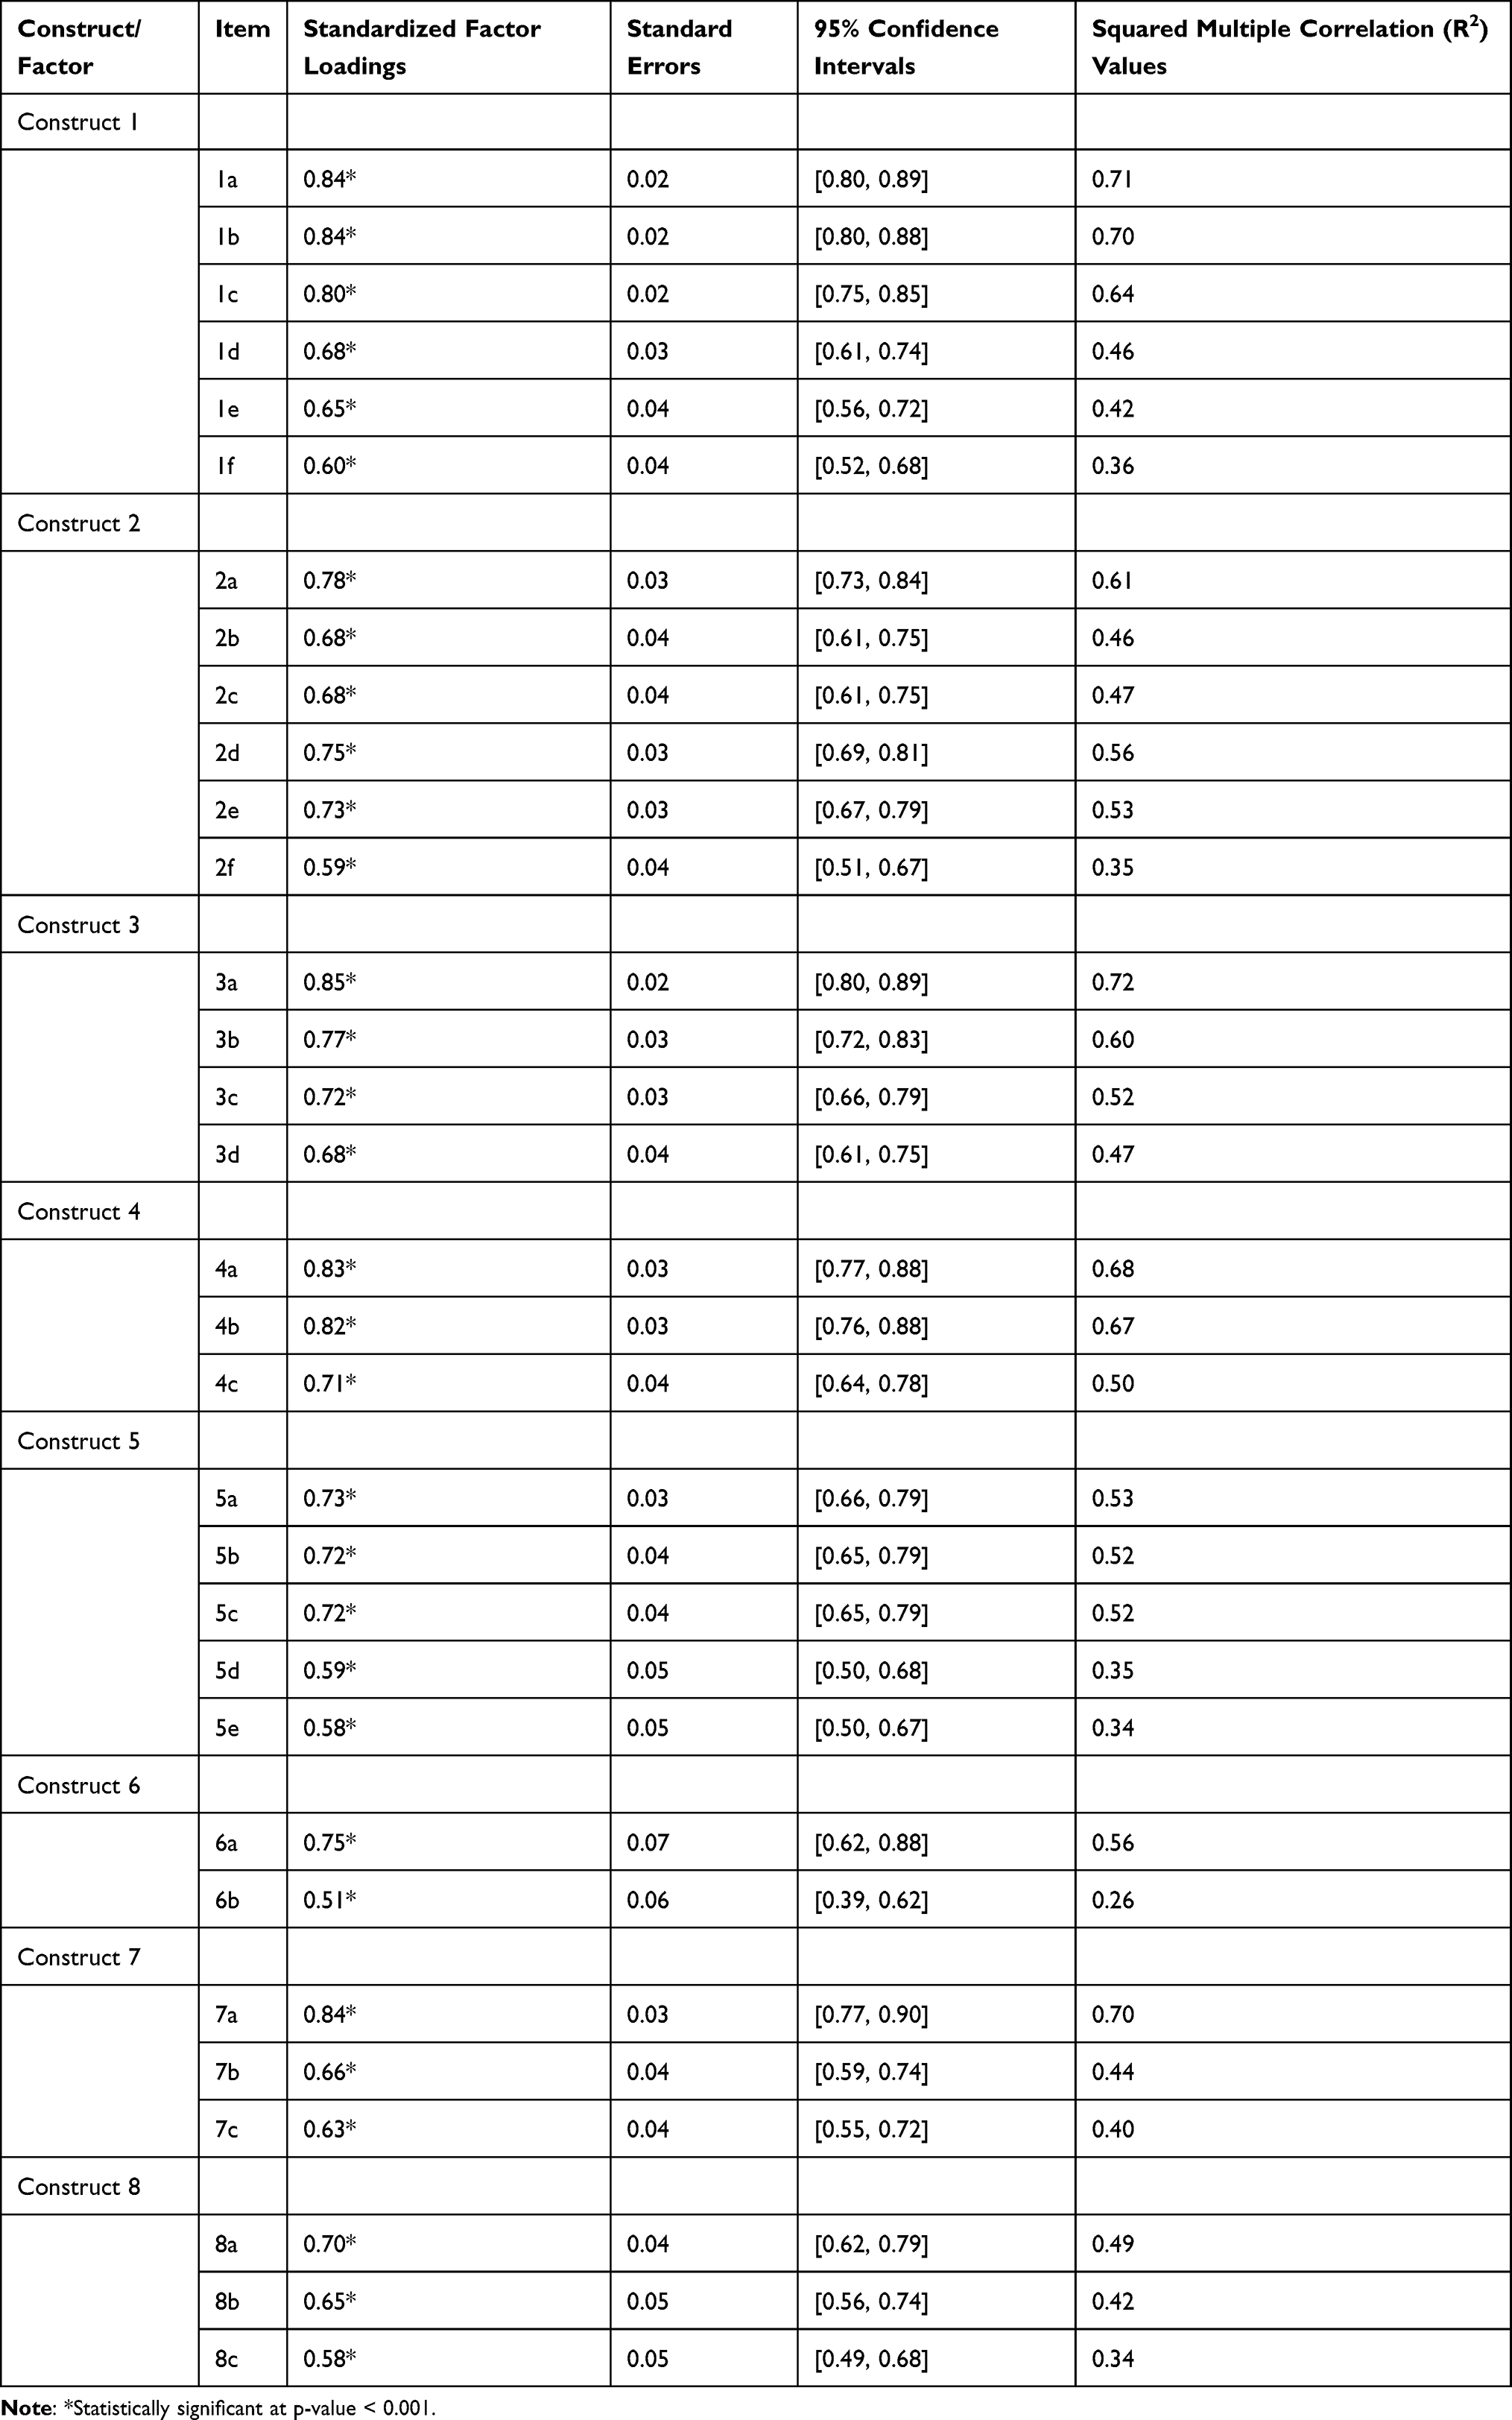 |
Table 4 Confirmatory Factor Analysis results for the Drivers of Food Choice Among Private College Students in Bole Sub City, Addis Ababa, Ethiopia, 2021 (N = 320) |
Discussion
In this study, drivers of food choice among private college students in Bole Sub City were assessed. The result indicates that mood, health concern, sensory appeal, price, convenience, natural content, familiarity, and weight benefit were confirmed as drivers of food choice among adult private college students.
In the present study, mood, health concern, sensory appeal, price, convenience, natural content, familiarity, and weight benefit were confirmed as drivers of food choice. In a study done in Debre-Berhan town, Ethiopia, religion, price and preparation convenience were the key factors, but in contrast to our study, mood, nutrient content and ethical concern were the least drivers of food choice among women, which may be due to demographic differences. The present research’s study sample consisted of young male and female participants, as opposed to women in the previous study.21 Gender differences can have an impact on individual and household dietary choices in a variety of ways. Men and women have different dietary preferences and patterns, according to research.11,22 Food prices, affordability, and availability all are important determinants of people's dietary choices. It may be possible to promote sustainable and healthy diets by addressing these issues. However, in order to effectively address these challenges, it is also critical to have a better understanding of the factors that influence food choices.
Furthermore, this conclusion was reinforced by other studies that found the dynamic nature of food affordability owing to daily swings in income and price to be a key driver of food choice within the food environment.3,14 Similarly, another qualitative study conducted in schools in Addis Abeba, Ethiopia, found that concerns about food safety, hygiene, and affordability influence adolescents' food choices.15 Even though the present study does not consider food safety, important indicators were addressed. As a result, price and affordability are major drivers of food choice; hence, interventions and policies that make nutritious foods more accessible and unhealthy foods more expensive have the potential to influence food choice toward better diets.
A study conducted in Ethiopia’s Somali Region revealed that residents have monotonous feeding habits and poor food choices, with food choice drivers such as crop failure, income, price, quality and availability of foods, market access, familiarity with new foods, knowledge of nutritious foods, and individuals’ health status being mentioned.23 Similarly, the recent study found that price and familiarity were remained the most important motivators. The previous research, however, did not report on mood or health concerns. As a result, our study studied the common drivers of urban areas and mood, sensory appeal, convenience, natural content, and as an additional driver for food choice among students, which will lead to subsequent research in other study groups and geographical regions throughout Ethiopia. A qualitative study in Botswana identified dietary factors time, location and companions, perceived peer rejection, and weight loss and dieting as driving factors of food choice in adolescents of which their food choice mainly depended on peer pressure.24 This implies that these food environment drivers might be important entry sites for interventions and policies promoting sustained healthy diets, raising awareness, and developing legislation.
In the current study, the sensory appeal was one of the most contributing drivers of the food choice. A similar finding was reported from other studies in Japan, Taiwan, Malaysia, and New Zealand.25 According to the findings of this study, sensory attributes, and notable flavor, were the most important motivational elements positively connected with consumer food choice. A similar discovery was made in China.26 Another study discovered that the sensory experience of eating is an important indicator of food consumption control, as well as a factor that influenced food choice and the optimal development of satiation and satiety, with each component of the sensory driving experience these behavioral patterns to food in different ways.27
There is much scientific evidence that diet impacts mood and performance, which is consistent with our findings.5,28–30 Carbohydrate-rich diets may boost mood in such persons by raising serotonin levels in the brain. The association between food and mood in supposedly normal people is intricate and relies on the time of day, the kind and macronutrient makeup of food, the quantity of food taken, and the subject’s age and dietary history.31
Although the political, economic, cultural, biophysical, food safety and environmental forces were acknowledged in the previous study,13 political, food safety and environmental variables were not specifically addressed in our study. Future research should include physical, environmental, and political influences on food choice.
Conclusion
This study highlights the gaps in the determinants of food choice throughout this life stage, making college an opportune time to begin life-long health habits, increase long-term quality of life, and lower society’s mortality, morbidity, and healthcare expenses.
The current study emphasized different biological, social, and economic elements that influence food selection decisions. With increasing factor loading mood, health concern, sensory appeal, price, and familiarity were verified as determinants of food choice. However, the issues of natural content and weight control had lower factor loadings and percent of explained variation, but they worry about the good-looking appearance of the food had the greatest value among students. Effective nutrition education and preventative interventions should be done with an emphasis on food driving factors. Targeted early intervention should be considered to support appropriate diet choice that helps to avoid non-communicable diseases and improve healthy eating habits among college students.
Abbreviations
CFA, Confirmatory Factor Analysis; EDHS, Ethiopian Mini Demographic Health Survey; EFA, Exploratory Factor Analysis; FBDGS, Food-Based Dietary Guidelines; FRO, Food Retail Outlet(s); NCDS, Non-Communicable Diseases.
Data Sharing Statement
The datasets used in this work are accessible upon reasonable request from the corresponding author.
Ethics Approval and Informed Consent
Haramaya University’s Institutional Health Research Ethics Review Committee (IHRERC) granted ethical approval. The selected colleges were then sent an official letter of collaboration and support from Haramaya University’s CHMS. After explaining the purpose, risks, and benefits of the study, informed voluntary written and signed consent was obtained from the college presidents/deans and each study participant. The participants’ confidentiality was protected by removing personal identifiers from the data gathering instruments. Furthermore, conventional precautions were taken to safeguard data collectors, supervisors, and research participants from the possibility of COVID-19. The entire ethical procedure adheres to the Helsinki Declaration.
Acknowledgments
We would like to thank Haramaya University and Addis Continental Institute of Public Health for their invaluable and unreserved support during the development of this research work. Finally, our gratitude goes to study participants, college deans’ and data collectors. This paper is based on the thesis of Hiwot Berhanu. It has been published on the institutional website: http://ir.haramaya.edu.et/hru/handle/123456789/4830.
Author Contributions
All of the authors made significant contributions to the article reported, whether in the conception, study design, data acquisition, analysis, and interpretations, or in all of these areas; participated in drafting, revising, or critically reviewing the article; provided final approval of the version to be published; agreed on the journal to which the article was submitted; and agreed to be accountable for all aspects of the work.
Disclosure
The authors declare that there are no conflicts of interest in this work.
References
1. Blundell JE, Cooling J. Routes to obesity: phenotypes, food choices and activity. Br J Nutr. 2000;83(SUPPL. 1):S33–S38. doi:10.1017/S0007114500000933
2. Mcguire S. Scientific Report of the 2015 Dietary Guidelines Advisory Committee. Washington, DC: US Departments of Agriculture and Health and Human Services, 2015; 2016:202–204.
3. Cabral D, Cunha LM, Vaz de Almeida MD. Food choice and food consumption frequency of Cape Verde inhabitants. Appetite. 2019;139:26–34. doi:10.1016/j.appet.2019.04.005
4. FAO, World Health Organization. Vitamin and Mineral Requirements in Human Nutrition.
5. Nirupma S, Ritu D, Virginia P. A systematic review on essentials of healthy eating. Int J Home Sci. 2020;6(2):295–299.
6. World Health Organization. Who, 2010. World Health Organization; 2010. 177.
7. Otemuyiwa IO, Adewusi SRA. Food choice and meal consumption pattern among undergraduate students in two universities in Southwestern Nigeria. Nutr Health. 2012;21(4):233–245. doi:10.1177/0260106013510994
8. Offei-Ansah C. Food habits and preferences as a factor in the choice of meals by students in the University of Cape Coast. Nutr Health. 2012;21(3):151–172. doi:10.1177/0260106012467245
9. Blake CE, Frongillo EA, Warren AM, Constantinides SV, Rampalli KK, Bhandari S. Elaborating the science of food choice for rapidly changing food systems in low-and middle-income countries. Glob Food Sec. 2021;28:100503. doi:10.1016/j.gfs.2021.100503
10. Popkin BM, Adair LS, Ng SW. Global nutrition transition and the pandemic of obesity in developing countries. Nutr Rev. 2012;70(1):3–21. doi:10.1111/j.1753-4887.2011.00456.x
11. Constantinides SV, Turner C, Frongillo EA, Bhandari S, Reyes LI, Blake CE. Using a global food environment framework to understand relationships with food choice in diverse low- and middle-income countries. Glob Food Sec. 2021;29:100511. doi:10.1016/j.gfs.2021.100511
12. Willett W, Rockström J, Loken B, et al. Food in the Anthropocene: the EAT–Lancet Commission on healthy diets from sustainable food systems. Lancet. 2019;393(10170):447–492. doi:10.1016/S0140-6736(18)31788-4
13. Turner C, Aggarwal A, Walls H, et al. Concepts and critical perspectives for food environment research: a global framework with implications for action in low-and middle-income countries. Glob Food Sec. 2018;18:93–101. doi:10.1016/j.gfs.2018.08.003
14. Assefa N, Abraham A. Drivers of food choices among households in Kersa District, Eastern Ethiopia; 2020.
15. Trübswasser U, Baye K, Holdsworth M, Loeffen M, Feskens EJMM, Talsma EF. Assessing factors influencing adolescents’ dietary behaviours in urban Ethiopia using participatory photography. Public Health Nutr. 2020;13:1–9.
16. Steptoe A, Pollard TM, Wardle J. Development of a measure of the motives underlying the selection of food: the food choice questionnaire. Appetite. 1995;25(3):267–284. doi:10.1006/appe.1995.0061
17. Lindeman M, Väänänen M. Measurement of ethical food choice motives. Appetite. 2000;34(1):55–59. doi:10.1006/appe.1999.0293
18. Milošević J, Žeželj I, Gorton M, Barjolle D. Understanding the motives for food choice in Western Balkan Countries. Appetite. 2012;58(1):205–214. doi:10.1016/j.appet.2011.09.012
19. Hair JF, Gabriel M, Patel V. AMOS covariance-based structural equation modeling (CB-SEM): guidelines on its application as a marketing research tool. Braz J Mark. 2014;13(2):12.
20. Memon AH, Rahman IA. Analysis of cost overrun factors for small scale construction projects in Malaysia using PLS-SEM method. Mod Appl Sci. 2013;7(8):78. doi:10.5539/mas.v7n8p78
21. Kibr G, Mulugeta A, Bosha T. Drivers of food choice among lactating women: the case of Debrebirhan Town, North Shoa Zone, Amhara Region, Ethiopia. Int J Food Nutr Res. 2019;3:1–20.
22. Kulkarni S, Frongillo EA, Cunningham K, Moore S, Blake CE. Women’s bargaining power and child feeding in Nepal: linkages through nutrition information. Matern Child Nutr. 2020;16(1):e12883. doi:10.1111/mcn.12883
23. Gebremichael B. Drivers of food choice among pastoral/agro-pastoral community in Somali Regional State, Eastern Ethiopia. Adv Public Health. 2019;2019:1–7.
24. Brown C, Shaibu S, Maruapula S, Malete L, Compher C. Perceptions and attitudes towards food choice in adolescents in Gaborone, Botswana. Appetite. 2015;95:29–35. doi:10.1016/j.appet.2015.06.018
25. Prescott J, Young O, O’Neill L, Yau NJN, Stevens R. Motives for food choice: a comparison of consumers from Japan, Taiwan, Malaysia and New Zealand. Food Qual Prefer. 2002;13(7–8):489–495. doi:10.1016/S0950-3293(02)00010-1
26. Jaacks LM, Slining MM, Popkin BM. Recent trends in the prevalence of under- and overweight among adolescent girls in low- and middle-income countries. Pediatr Obes. 2015;10(6):428–435. doi:10.1111/ijpo.12000
27. Mccrickerd K, Forde CG. Sensory influences on food intake control: moving beyond palatability. Obes Rev. 2016;17(1):18–29. doi:10.1111/obr.12340
28. Furst T, Connors M, Bisogni CA, Sobal J, Falk LW. Food choice: a conceptual model of the process. Appetite. 1996;26(3):247–266. doi:10.1006/appe.1996.0019
29. Bouhlal S, McBride CM, Ward DS, Persky S. Drivers of overweight mothers’ food choice behaviors depend on child gender. Appetite. 2015;84:154–160. doi:10.1016/j.appet.2014.09.024
30. Horská E, Ürgeová J, Prokeinová R. Consumers’ food choice and quality perception: comparative analysis of selected Central European countries. Agric Econ. 2011;57(10):493–499.
31. Stein Z, Susser M, Saenger G, Marolla F. Nutrition and mental performance. Science. 1972;178(4062):708–713. doi:10.1126/science.178.4062.708
 © 2023 The Author(s). This work is published and licensed by Dove Medical Press Limited. The full terms of this license are available at https://www.dovepress.com/terms.php and incorporate the Creative Commons Attribution - Non Commercial (unported, v3.0) License.
By accessing the work you hereby accept the Terms. Non-commercial uses of the work are permitted without any further permission from Dove Medical Press Limited, provided the work is properly attributed. For permission for commercial use of this work, please see paragraphs 4.2 and 5 of our Terms.
© 2023 The Author(s). This work is published and licensed by Dove Medical Press Limited. The full terms of this license are available at https://www.dovepress.com/terms.php and incorporate the Creative Commons Attribution - Non Commercial (unported, v3.0) License.
By accessing the work you hereby accept the Terms. Non-commercial uses of the work are permitted without any further permission from Dove Medical Press Limited, provided the work is properly attributed. For permission for commercial use of this work, please see paragraphs 4.2 and 5 of our Terms.