")
Back to Journals » Cancer Management and Research » Volume 11
Downregulation of TfR1 promotes progression of colorectal cancer via the JAK/STAT pathway
Authors Cui C, Cheng X, Yan L, Ding H, Guan X, Zhang W, Tian X, Hao C
Received 20 December 2018
Accepted for publication 20 April 2019
Published 9 July 2019 Volume 2019:11 Pages 6323—6341
DOI https://doi.org/10.2147/CMAR.S198911
Checked for plagiarism Yes
Review by Single anonymous peer review
Peer reviewer comments 2
Editor who approved publication: Professor Harikrishna Nakshatri
Can Cui,1 Xiaojing Cheng,2 Liang Yan,1 Huirong Ding,3 Xiaoya Guan,1 Wenlong Zhang,4 Xiuyun Tian,1 Chunyi Hao1
1Key Laboratory of Carcinogenesis and Translational Research (Ministry of Education/Beijing), Department of Hepato-Pancreato-Biliary Surgery, Peking University Cancer Hospital & Institute, Beijing 100142, People’s Republic of China; 2Key Laboratory of Carcinogenesis and Translational Research (Ministry of Education/Beijing), Gastrointestinal Carcinoma Translational Research Laboratory, Peking University Cancer Hospital & Institute, Beijing, People’s Republic of China; 3Key Laboratory of Carcinogenesis and Translational Research (Ministry of Education/Beijing), Central Laboratory, Peking University Cancer Hospital & Institute, Beijing 100142, People’s Republic of China; 4Key Laboratory of Carcinogenesis and Translational Research (Ministry of Education/Beijing), Department of Laboratory Animal, Peking University Cancer Hospital & Institute, Beijing 100142, People’s Republic of China
Background: Colorectal cancer (CRC) is one of the most prevalent gastrointestinal malignancies. The incidence of CRC has been rapidly increasing in China. Transferrin receptor 1 (TfR1) is a key regulator of cellular iron homeostasis. Several studies have demonstrated TfR1 overexpression in a variety of human tumors, but the association between TfR1 and CRC remains unclear.
Methods: TfR1 expression was evaluated in six CRC cell lines and tumor tissues. A total of 201 CRC patients were included for immunohistochemistry and 19 pairs of frozen tissues were used for real-time PCR. Cell proliferation, cell cycle, cell migration and invasion, and in vivo carcinogenesis were tested after downregulation of TfR1 by lentivirus. Protein microarray and Western blot analyses were used to explore the underlying mechanisms of TfR1 in CRC.
Results: TfR1 expression was higher in CRC tissues than in normal tissues (57.2% vs 22.9%, P<0.001). TfR1 expression was obviously higher in CRC tissues with well differentiation (P=0.008), no lymph node metastasis (P=0.002), no distant metastasis (P=0.006), no vascular invasion (P<0.001) and early TNM stage (P=0.013). CRC patients with TfR1-positive expression had a better survival than those with TfR1-negative expression (P=0.044). Downregulation of TfR1 expression inhibited cell proliferation, promoted cells from G1 phase to S phase and facilitated cell migration and invasion. Knockdown of TfR1 also suppressed tumor growth in BALB/C-nu mice. Protein microarray and Western blot analyses showed that the Janus protein tyrosine kinase/signal transducer and activator of transcription pathway was activated along with downregulation of TfR1 expression.
Conclusion: Though TfR1 was overexpressed in colorectal cancer tissues, there was evidence that downregulation of TfR1 could promote cancer progression.
Keywords: colorectal cancer, transferrin receptor 1, tumor progression, JAK/STAT pathway
Introduction
Colorectal cancer (CRC) is one of the most prevalent gastrointestinal malignancies. In the United States, CRC is the third most commonly diagnosed cancer, and CRC is the third leading cause of cancer-related death in both males and females.1 In China, the incidence of CRC is lower than in developed countries but has been rapidly increasing in recent years.2 A retrospective cohort study found that the incidence of CRC in patients below the age of 50 years has also been increasing.3 It is therefore crucial to identify important regulators and further clarify the mechanisms underlying CRC progression, to allow future development of effective interventions.
Transferrin receptor 1 (TfR1), also known as TFRC and CD71, is a type Ⅱ transmembrane glycoprotein ubiquitously expressed on the cell surface. It is a key regulator of cellular iron homeostasis and an essential protein involved in iron uptake and the regulation of cell growth.4,5 TfR1 is expressed at a low level in normal quiescent cells, but is upregulated in cells with high proliferation rate, such as the cells of the epidermal basal layer, intestinal epithelial cells and tumor cells.6–8 This upregulation can be explained by the increased need for iron in these cells. Several studies have demonstrated TfR1 overexpression in a variety of human tumors, such as lung cancer,9 hepatocellular carcinoma,10 pancreatic cancer,11–13 breast cancer,7,14 thyroid carcinoma,15 etc. Though some studies have demonstrated overexpression of TfR1 in CRC,16,17 there are no studies addressing the mechanism of TfR1 in CRC in detail.
Aberrant activation of intracellular signaling pathways confers malignant properties on cancer cells. Activation of Janus protein tyrosine kinase (JAK) can induce phosphorylation of signal transducer and activator of transcription (STAT) to form JAK-STAT dimer, which will then translocate to the nucleus to induce expression of target genes.18–20 The JAK/STAT signaling pathway participates widely in cell proliferation, apoptosis, angiogenesis and other biological processes; JAK/STAT pathway abnormalities have been reported to be correlated with tumor occurrence, invasion, metastasis, and prognosis.19,21–26
In this study, our aim was to explore the role and mechanism of TfR1 in CRC. We found that TfR1 expression was higher in CRC tissues than in normal tissues. Downregulation of TfR1 expression inhibited cell proliferation both in vitro and in vivo. TfR1 knockdown promoted cells from G1 phase to S phase, facilitated cell migration and invasion, and activated the JAK/STAT pathway.
Thus, this study showed that TfR1 played an extraordinary role in CRC. Though TfR1 was found to be overexpressed in CRC tissues, there was evidence that downregulation of TfR1 could promote cancer progression.
Materials and methods
Patients and samples
Tissue samples for immunohistochemistry were from 201 CRC patients who underwent surgical resection during 2004–2008 at Peking University Cancer Hospital, Beijing, China. Tumor tissues and paired noncancerous tissues were formalin-fixed immediately after resection and then embedded with paraffin. All patients were followed up for at least 5 years after surgery. The detailed clinicopathological features of the 201 CRC patients are described in Table 1.
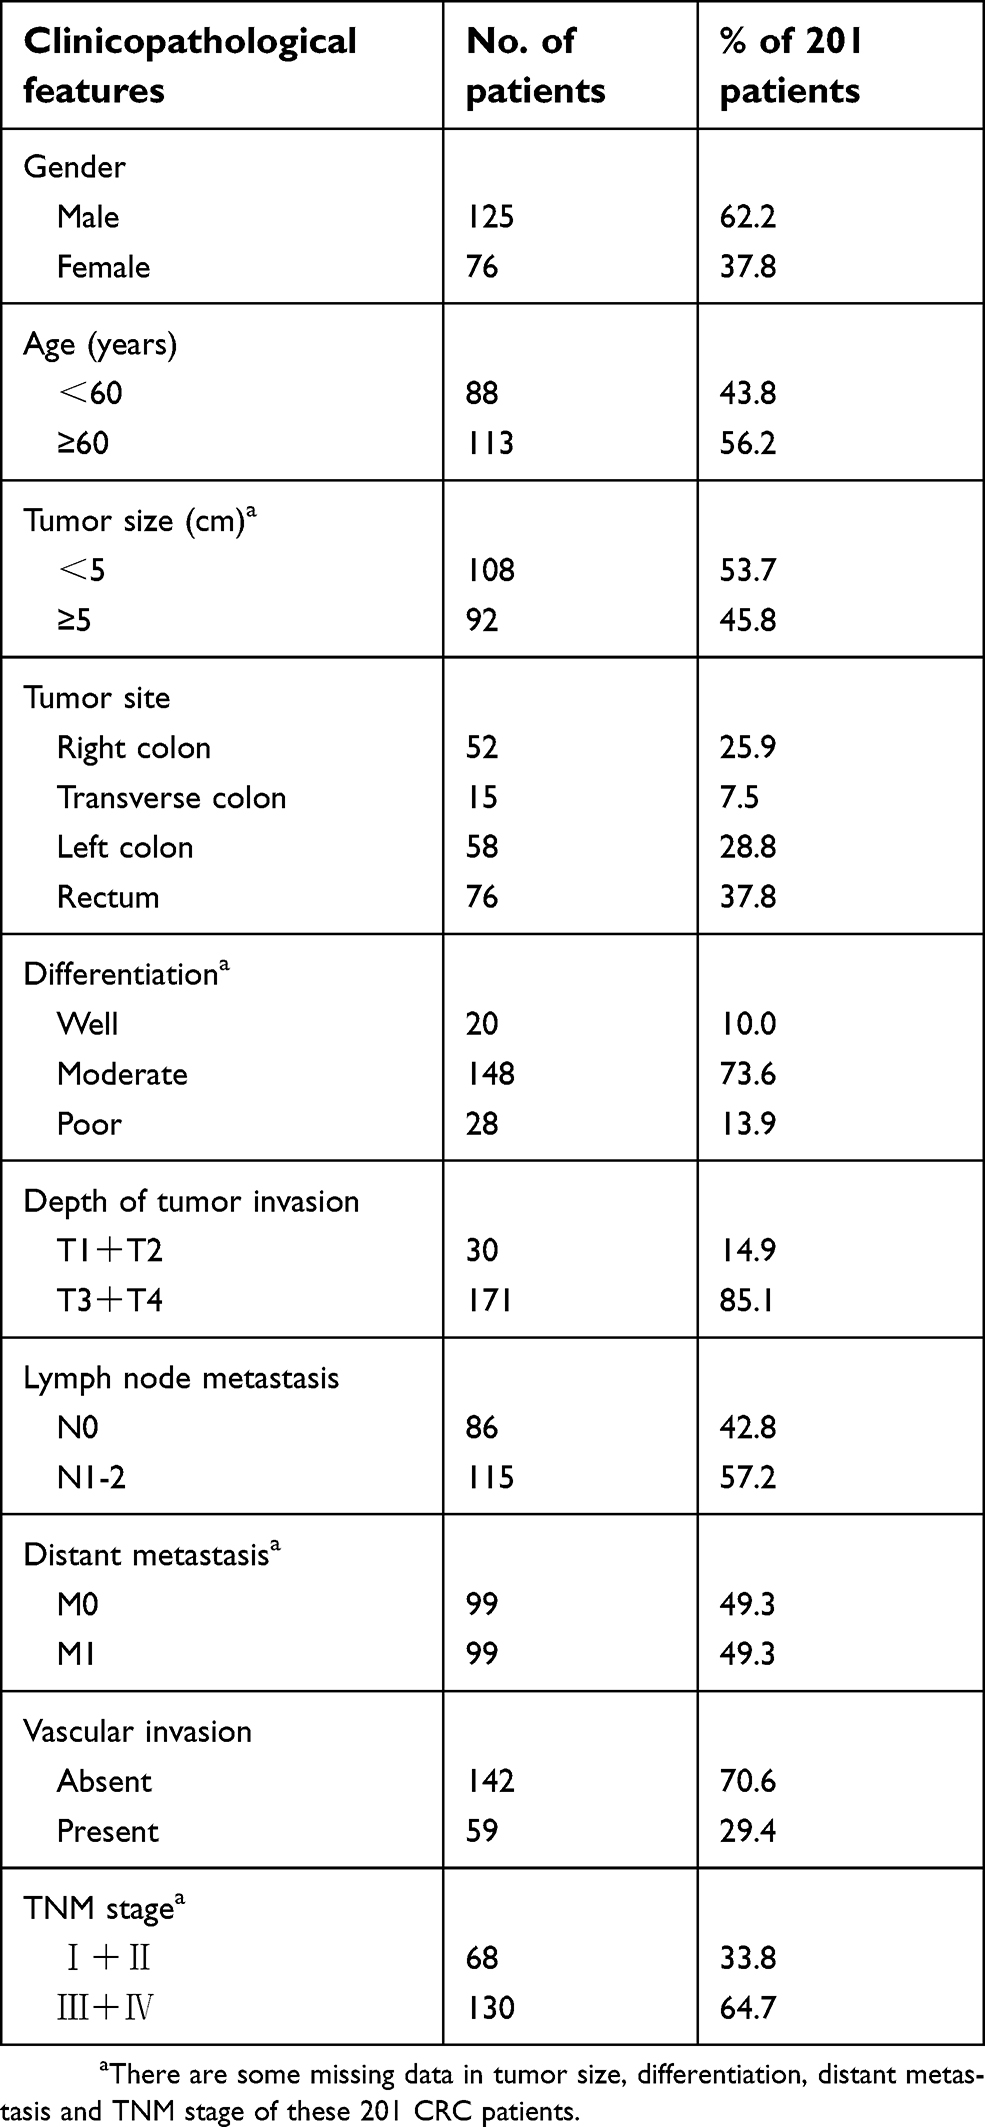 |
Table 1 Clinicopathological features of the 201 CRC patients |
Tissue samples for real-time PCR were from 19 patients who were diagnosed with CRC and received surgical resection in 2016 at Peking University Cancer Hospital, Beijing, China. Tumor tissues and paired noncancerous tissues were snap frozen in liquid nitrogen and stored at −80°C until use.
None of these patients received chemotherapy or radiation therapy before surgery and histopathological analyses of tissue samples were performed independently by two pathologists. This study was approved by the Ethical Committee of Peking University Cancer Hospital and was conducted according to the principles expressed in the Declaration of Helsinki. Written informed consent for tissue sample was acquired from each patient.
Cell lines and cell culture
The human CRC cell lines SW480, SW620, RKO, LoVo, HT-29 and HCT116 were purchased from the Chinese Academy of Medical Sciences & Peking Union Medical College. These cell lines were cultured in DMEM (GibcoBRL, Life Technologies, Grand Island, NY, USA) supplemented with 10% FBS, 100 μg/mL penicillin and 100 μg/mL streptomycin. All cell lines were maintained in a humidified 5% CO2 atmosphere at 37°C.
Immunohistochemistry
The 4-μm-thick slices were dewaxed in xylene and rehydrated in graded alcohol concentrations after being baked at 72°C for 1 hr. Slices were incubated in hydrogen peroxide (3%) to block the activity of endogenous peroxidase for 15 mins. The antigen retrieval was performed in a microwave for 10 mins in 0.01 mol/L citrate buffer (pH=6.0). After cooling to room temperature, the slices were blocked by goat serum (Beijing Zhongshan Golden Bridge Biotechnology Co., Ltd., Beijing, China) for 1 hr 37°C. Then, the sections were incubated with a kind of nanoparticle (gifted by Dr. Fan, the Institute of Biophysics, Chinese Academy of Sciences) at 4°C overnight. Ferritin is an iron storage protein composed of 24 subunits made up of the heavy chain ferritin (HFn) and light-chain ferritin, and ferritin is spherical with an outer diameter of 12 nm and interior cavity diameter of 8 nm.27 Meanwhile, HFn could bind to cells via TfR1.28 Dr. Fan et al oxidized Fe2+ in the inner cavity of ferritin and constructed a kind of ferritin nanoparticles which contained Fe2O3/Fe3O4 inside. In the presence of hydrogen peroxide, the inner iron oxide could catalyze the oxidation reaction of catalase substrate so that the tissue could be visualized without any targeting ligands.29
Therefore, the following day, the slices could be visualized by DAB regent directly without incubating with the secondary antibody. 3.3ʹ-Diaminobenzidine tetrahydrochloride (Dako, Glostrup, Denmark) containing hydrogen peroxide was used to visualize the reaction. After being counterstained with hematoxylin, the slices were dehydrated in the sequence of graded alcohol concentrations and xylene.
The staining of TfR1 was classified semiquantitatively based on the combined scores of positive-staining tumor cell percentage and staining intensity by two independent pathologists who were blinded to the patients’ clinical data. The percentage of positive cells (PP) was scored as 0 (negative), 1 (<25%), 2 (25–75%) and 3 (>75%) respectively, while the staining intensity (SI) was scored as 0 (negative), 1 (weak), 2 (moderate) and 3 (strong). The immunoreactivity score (IRS) was defined as PP multiplied SI, and IRS<1 was regarded as “negative” while IRS ≥1 was “positive”.
Establishment of stable TfR1-knockdown cell lines and rescue experiment
Lentivirus-mediated TfR1 small-hairpin RNA (shRNA) was constructed by GeneChem Company (Shanghai, China). Lenti-shRNA was manipulated according to the protocol provided by the manufacturer. The lentiviral vector containing non-silencing shRNA was used as the negative control. Stable shRNA transfectants were selected by culturing cell lines in medium supplemented with 0.3 μg/mL puromycin for SW620 and 2 μg/mL puromycin for SW480. Real-time PCR and Western blotting were used to confirm efficient downregulation of TfR1 expression.
As we obtained only one effective shRNA sequence, we performed a rescue experiment. The lentivirus-mediated TfR1 overexpression was also constructed by GeneChem Company (Shanghai, China), which contained a synonymous mutation according to the target interference sequence of the shRNA.
RNA extraction, RT-PCR and real-time PCR
Total RNA of cell lines and frozen tissues was isolated using Trizol reagent (Invitrogen, Life Technologies, Carlsbad, CA, USA) according to the manufacturer’s instructions. Reverse transcription was performed using 5× All-In One RT MasterMix (abm, Canada) with a 20 μL reaction volume containing 1 μg total RNA by a procedure of 25°C for 10 mins, 42°C for 50 mins and 85°C for 5 mins.
RT-PCR amplification was performed using TfR1 and β-actin gene-specific primers. The PCR procedure was as follows: pre-denaturation at 94°C for 5 mins, 25 PCR cycles and a final elongation at 72°C for 10 mins. Each PCR cycle comprised denaturation at 94°C for 30 s, annealing at 60°C for 30 s and extension at 72°C for 30 s. PCR products were separated by gel electrophoresis on 2% agarose gel stained with GelRed (Biotium, USA). Band intensity was measured on an UVP EC3 Imaging System (Uvp Inc., Upland, CA, USA).
In performing quantitative real-time PCR, GAPDH was used as the reference gene for cell lines while we used expressed Alu repeats (EAR)30 as loading control instead of GAPDH for tissues. cDNA was diluted 50 times when performing EAR amplification. Real-time PCR was performed with EvaGreen 2× qPCR MasterMix (abm, Canada), using the ABI 7500 fast Real-time PCR Detection System (Life Technologies) with pre-denaturation at 95°C for 10 mins, 40 cycles of denaturation at 95°C for 15 s, annealing at 60°C for 1 min and extension at 72°C for 30 s. All reactions were performed in triplicate. The fold change in mRNA was calculated by the 2−ΔΔCT method. The sequences of primers were shown in Table S1.
Western blot analysis
Total protein was extracted from cell lines by RIPA lysis buffer (Cat No. CW2333S, CWBIO) supplemented with protease and phosphatase inhibitor cocktail (Cat No. CW2200S and CW2383S, CWBIO). Protein was quantified using the BCA Protein Assay Kit (Cat No. CW0014S, CWBIO) and denatured at 70°C for 10 mins with 5× SDS-PAGE loading buffer (Cat No. CW0027S, CWBIO). Equivalent amounts of proteins were separated by 6% or 8% SDS-PAGE. After electrophoresis, the proteins were transferred onto polyvinylidene fluoride membrane. Afterwards, membranes were blocked with 5% skim milk for 1 hr at room temperature and then incubated with the corresponding primary antibody at 4°C overnight. The next day, after being washed 3 times with PBST (phosphate-buffered saline with 0.1% Tween-20) buffer, and the membranes were incubated with the corresponding secondary horseradish peroxidase conjugated anti-rabbit or anti-mouse antibody at room temperature for 1 hr. Finally, Immobilon Western HRP Substrate Luminal Reagent (Cat No. P90714 and P90715, MILLIPORE) was employed for detection of protein bands using an enhanced chemiluminescence detection system (Amersham Imager 600, GE). Information on corresponding primary and secondary antibodies is listed in Table S2.
Cell proliferation assay
Cell growth was performed using the Cell Counting Kit-8 (Dojindo). Cell lines were plated in 96-well plates at different densities (2×10³ cells per well for SW480 and 1×10³ cells per well for SW620) and cultured for 24, 48, 72, 96 and 120 hrs. Ten microliters of CCK-8 were added in each well and then cells were cultured at 37°C continuously for the appropriate time. Finally, the absorbance at 450 nm was measured using a microplate reader (iMark, Bio-Rad Laboratories, Hercules, CA, USA).
Plate colony formation
Cells were plated in 6-well plates at a density of 300 cells per well. After 3 weeks, colonies were fixed with 4% paraformaldehyde (Cat No. P1110, Solarbio Life Sciences) and then stained with 0.1% crystal violet (Cat No. G1063, Solarbio Life Sciences).
Cell cycle analysis
Cells analyzed for cell cycle were collected and washed with PBS. Next, cells were fixed with 75% ice-cold ethanol at 4°C overnight. The second day, the fixed cells were centrifuged and washed with PBS. Then, 1×10⁶ cells were suspended with 500 μL PI/RNase Staining Buffer (Cat No. 550825, BD Pharmingen) and incubated in the dark at room temperature for 15 mins. Finally, the samples were analyzed using a BD Accuri C6 flow cytometer.
Migration and invasion assays
For the migration assay, the chambers were under hydration by serum-free medium at 37°C for at least 2 hrs before the cells were seeded in chambers. 8×10⁴ SW480 cells, 3×10⁴ SW620 cells, 2×10⁵ RKO cells and 2×10⁵ LoVo cells were suspended in 200 μL serum-free medium and seeded into the upper chamber of a transwell insert with an 8-μm pore size membrane (Corning Costar, Cambridge, MA, USA). The lower chambers were filled with DMEM containing 20% FBS. After incubation for 24 hrs, nonmigrated cells in the upper chamber were removed using a cotton swab. The migrated cells on the underside of the filter membrane were fixed with 4% paraformaldehyde (Cat No. P1110, Solarbio Life Sciences) and then stained with 0.1% crystal violet (Cat No. G1063, Solarbio Life Sciences). The migrated cells were photographed in five randomly selected microscopic fields and the number of cells was counted using Image J software.
For the invasion assay, we used membrane matrix-coated upper chambers in a transwell plate with 8-μm pores (Cat No. 354,480, Corning Costar, Cambridge, MA, USA) and the chambers were moved from −20°C to room temperature for at least 30 mins before hydration. Cells were suspended in 500 μL serum-free medium in the upper chamber and were incubated for 48 hrs. The other protocols were the same as in the migration assay.
Cell sorting by flow cytometry
1×10⁶ cells were suspended in 100 μl PBS with 20 μl anti-CD71-PE antibody (Cat No. 555537, BD Pharmingen) and incubated in the dark at room temperature for 15 mins. Cells suspended in PBS were used as a negative control. Finally, cells were sorted into TfR1-positive and TfR1-negative groups by a BD FACSAria Ⅱ cell sorter (BD Biosciences).
Protein microarray analysis
A Proteome ProfilerTM Human Phospho-Kinase Array Kit (Cat No. ARY003B, R&D Systems), which contains 43 human phospho-kinases, was used for protein microarray analysis, and the experimental operation and analysis were performed according to the manufacturer’s protocols.
In vivo carcinogenesis
1×10⁶ Lenti-shCtrl cells and 1×10⁶ Lenti-shTfR1 cells suspended in DMEM with matrigel (1:1 ratio) were injected subcutaneously into the left and right dorsal flanks of female BALB/C-nu mice weighing 15–17 g. Tumor volumes were measured weekly, calculated according to the standard formula V = (L×W2)/2, in which L and W represented the long and short diameters of the tumor, respectively. After 5 weeks, the mice were sacrificed, and the tumors were weighed and fixed in formalin. All animal experiments were approved by the Committee on the Ethics of Animal Experiments of Peking University of Oncology (Permit Number EAEC2018-06), and the animal experiments were performed in accordance with the standard guidelines for the Care and Use of Laboratory Animals of Peking University Cancer Hospital.
Statistical analysis
The statistical analyses were performed using SPSS 20.0 software (SPSS Inc., Chicago, IL, USA). Two-tailed chi-squared (χ2) test was used to compare TfR1 expression between CRC tissues and paired non-cancerous tissues. Two-tailed chi-squared (χ2) test and Fisher’s exact test were performed to evaluate the relationship between TfR1 expression and clinicopathological features of CRC patients. Independent-samples T test was used to compare the mean value of two groups. Kaplan–Meier survival analysis and log rank test were used for survival analysis. A two-sided P-value less than 0.05 was considered statistically significant.
Results
Expression of TfR1 in CRC tissues
We assessed both mRNA and protein expression of TfR1 in tissue samples of CRC patients. First, TfR1 mRNA expression was assessed in 19 pairs of primary CRC tissues and paired noncancerous tissues by real-time PCR. As shown in Figure 1A, relative TfR1 mRNA expression in tumor tissues was notably higher than in noncancerous tissues (P=0.015).
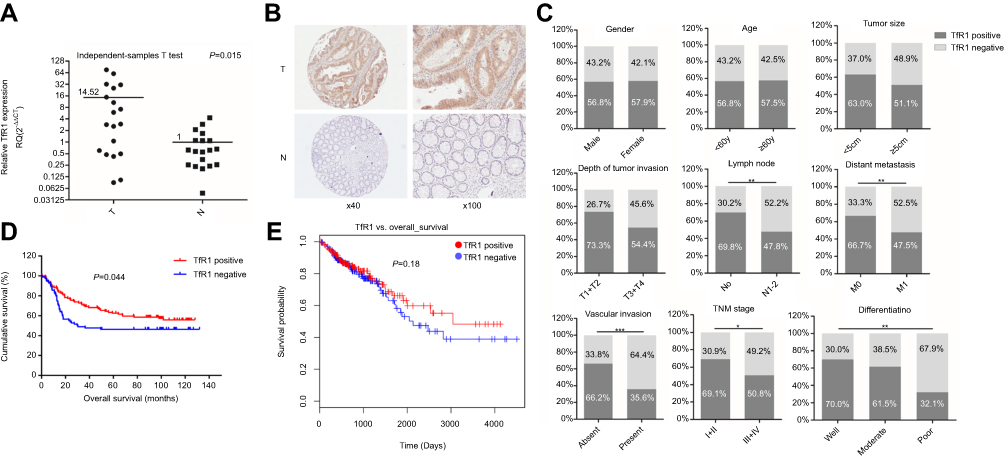 |
Figure 1 TfR1 expression in CRC tissues. (A) TfR1 mRNA expression in 19 pairs of primary colorectal cancer tissues and paired noncancerous tissues was assessed by real-time PCR. Relative TfR1 mRNA expression was notably higher in tumor tissues than in noncancerous tissues (P=0.015). T denotes colorectal tumor tissues and N denotes colorectal normal tissues. (B) Representative images of TfR1 expression in CRC tissues (T) and noncancerous tissues (N). TfR1 protein was predominantly localized in the cytoplasm (magnification: left, 40×; right, 100×). (C) Correlation of TfR1 expression with clinicopathological features of the 201 CRC patients. TfR1 expression in CRC tissues was obviously higher in CRC patients with well differentiation, no lymph node metastasis, no distant metastasis, no vascular invasion and early TNM stage, *P<0.05, **P<0.01, ***P<0.001. (D) CRC patients with positive TfR1 expression had a better postoperation survival than those with negative TfR1 expression, P=0.044. (E) The survival curve of TfR1 in LinkedOmics database shows that CRC patients with TfR1-positive expression have a better survival than those with TfR1-negative expression, though there is no statistical significance (P=0.18). |
Moreover, of the 201 cases in the immunohistochemistry assay, 9 noncancerous tissues were off-sectioned and cannot be assessed. In the remaining cases, TfR1 was expressed in 115 of the 201 tumor tissues and 44 of the 192 noncancerous tissues (57.2% vs 22.9%, P<0.001). Representative images of TfR1 expression showed that TfR1 protein was predominantly localized in the cytoplasm (Figure 1B).
Correlation of TfR1 expression with clinicopathological features and postoperation survival of CRC patients
As shown in Table 2 and Figure 1C, the positive rate of TfR1 expression decreased along with the decreasing degree of tumor differentiation. For tumor tissues with well, moderate and poor differentiation, TfR1 expression was 70%, 61.5% and 32.1% positive, respectively (P=0.008). Moreover, TfR1 expression in CRC tissues was obviously higher in CRC patients with no lymph node metastasis (no lymph node metastasis vs lymph node metastasis: 69.8% vs 47.8%, P=0.002), no distant metastasis (no distant metastasis vs distant metastasis: 66.7% vs 47.5%, P=0.006), no vascular invasion (no vascular invasion vs vascular invasion: 66.2% vs 35.6%, P<0.001) and early TNM stage (I + II vs III + IV: 69.1% vs 50.8%, P=0.013). In addition, TfR1 expression was higher in CRC tissues with smaller size (diameter less than 5 cm vs diameter more than 5 cm: 63.0% vs 51.1%, P=0.090) and weaker tumor invasion potential (T1 + T2 vs T3 + T4: 73.3% vs 54.4%,P=0.053) with no significant difference. From these results, we can preliminarily speculate that the TfR1 expression was higher in CRC tissues with a lower degree of malignancy.
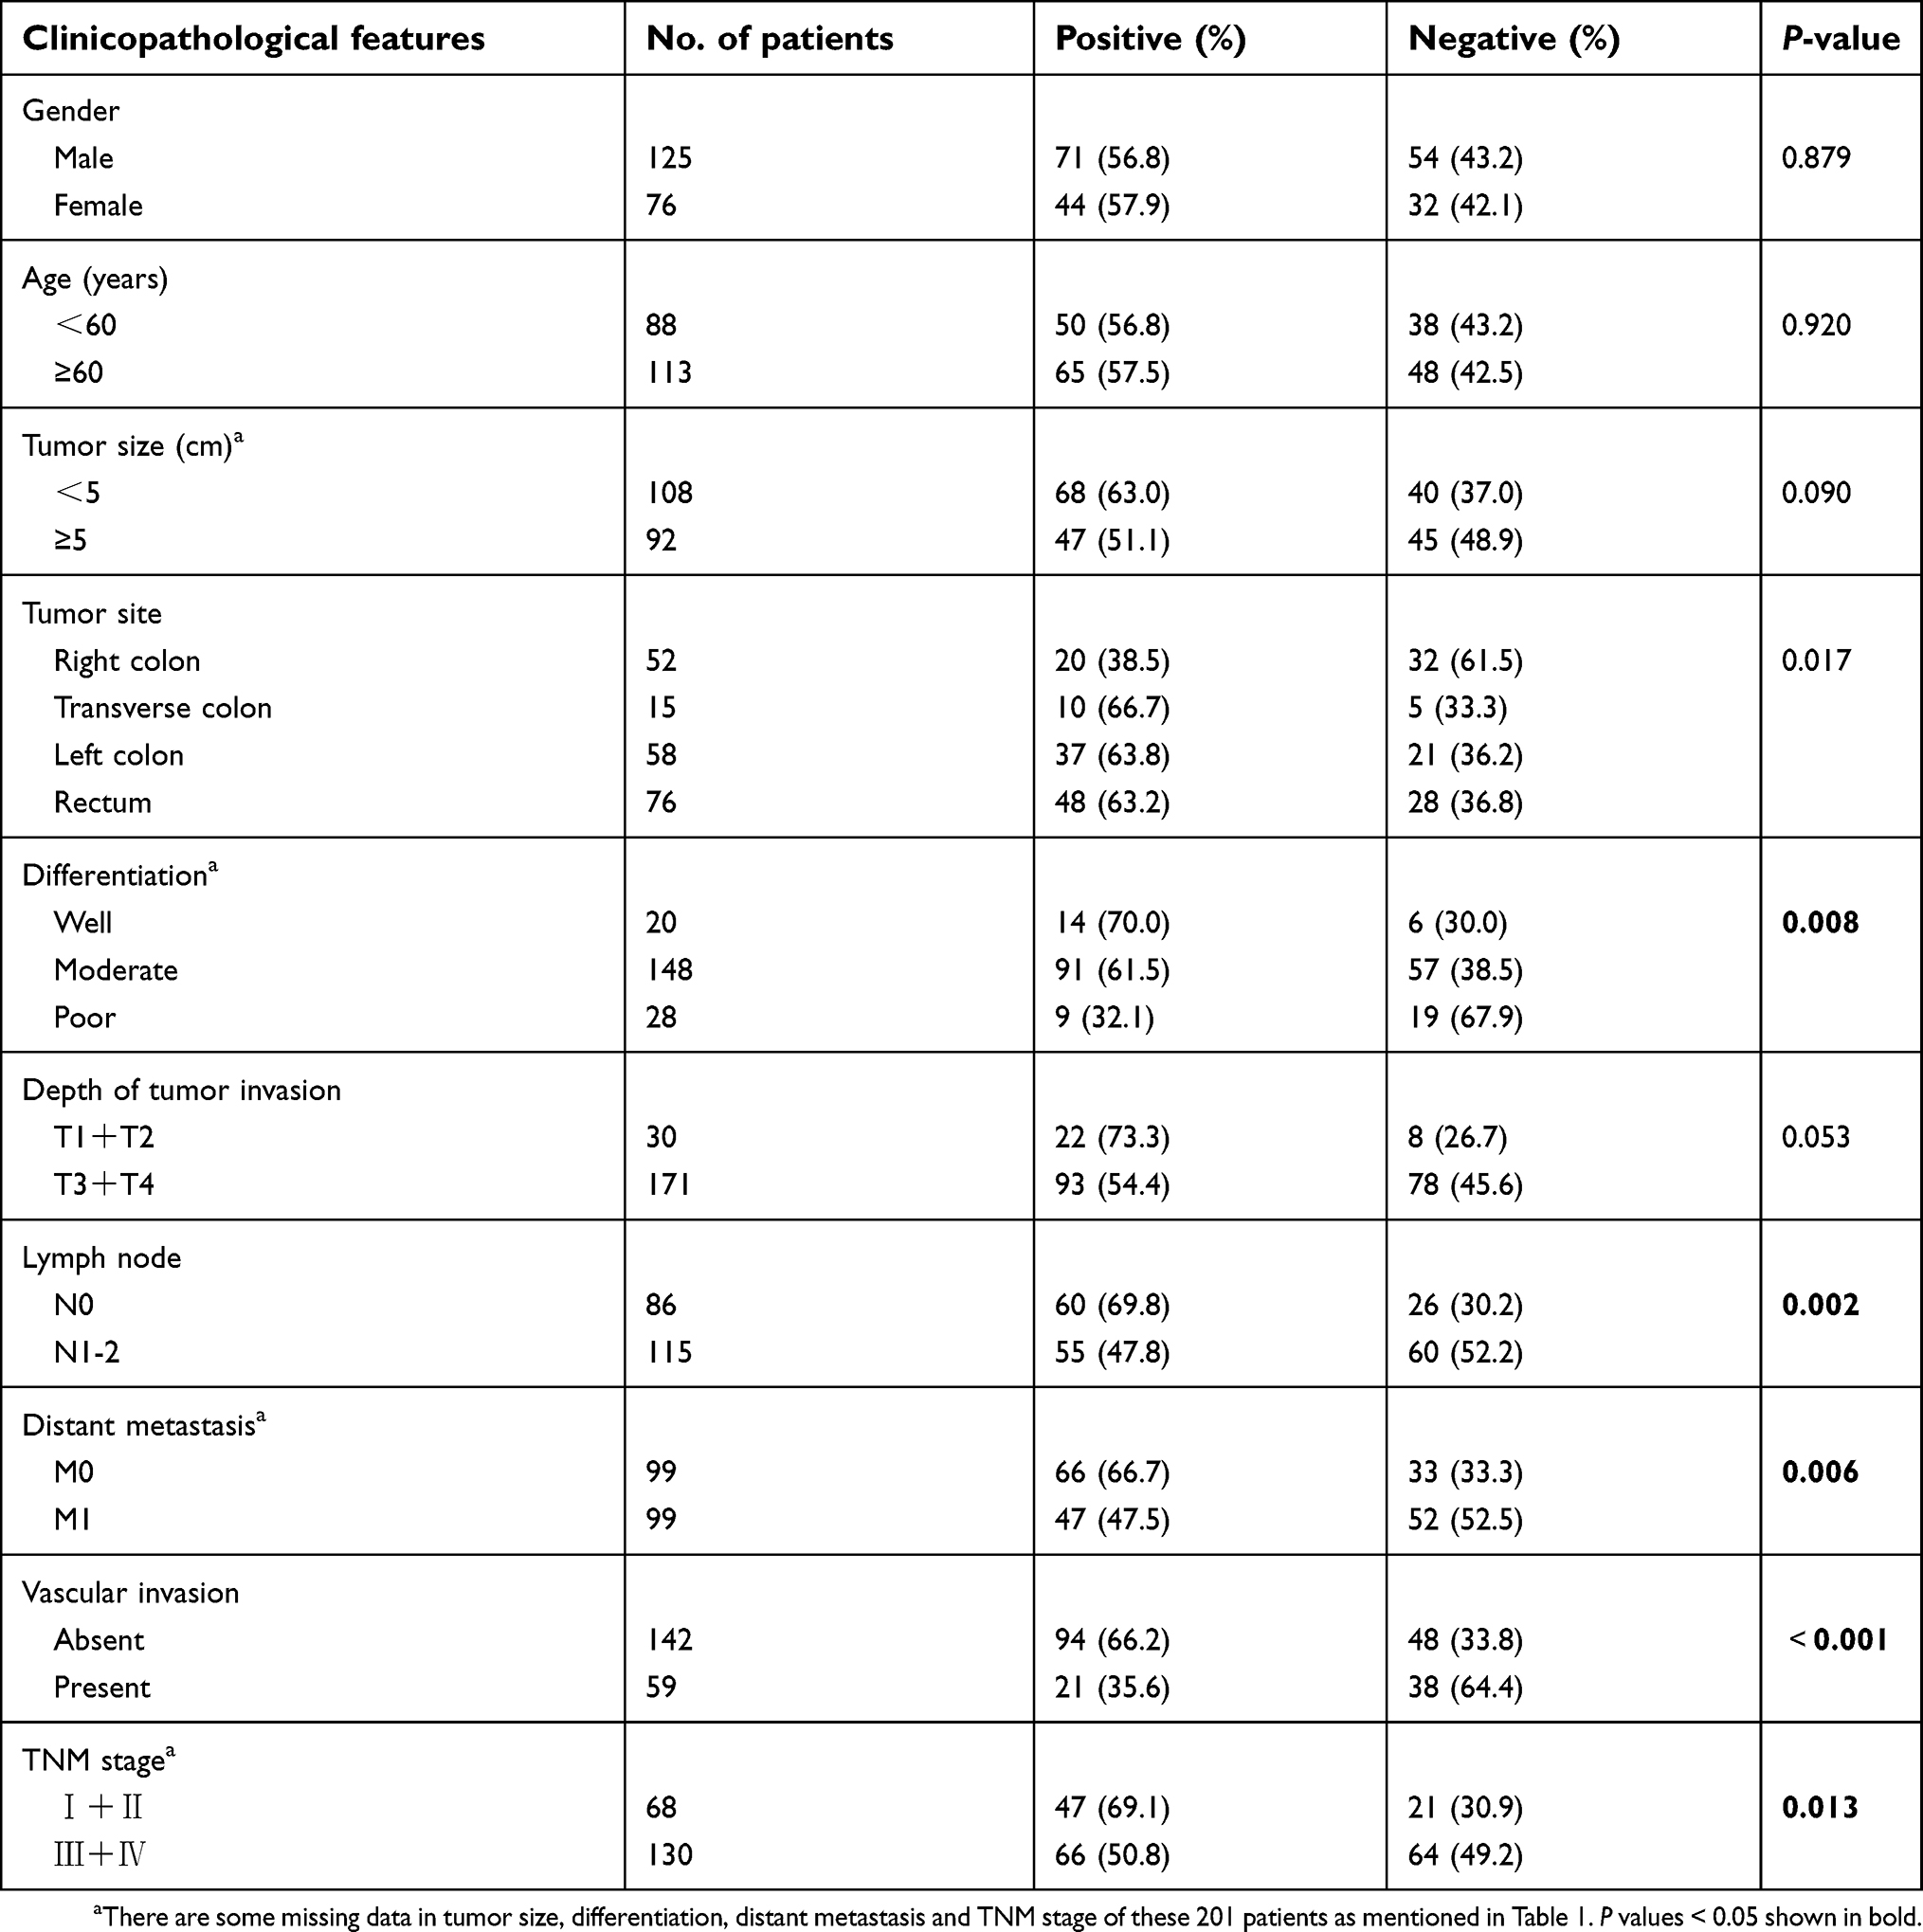 |
Table 2 Correlation between TfR1 expression and clinicopathological features of the 201 CRC patients |
In survival analysis, the median survival time was 72.06±4.26 months in TfR1-positive patients and 56.05±5.29 months in TfR1-negative patients. Kaplan–Meier survival analysis and log rank test showed a significant correlation between TfR1 positive expression and longer survival time of CRC patients (Figure 1D, P=0.044). Furthermore, a survival curve for TfR1 in the LinkedOmics database, which is a third-party software tool for the TCGA database,31 also shows that CRC patients with TfR1-positive expression have a better survival than those with TfR1-negative expression, although there is no statistical significance (Figure 1E, P=0.18). The survival analysis showed that the lower expression of TfR1 may result in CRC progression.
Expression of TfR1 in CRC cell lines
TfR1 mRNA expression was evaluated by RT-PCR and real-time PCR in six human CRC cell lines (SW480, SW620, HT-29, HCT116, RKO and LoVo). The differential expression of TfR1 mRNA is shown in Figure 2A and B. It can be seen that the TfR1 mRNA level was relatively higher in SW480 and SW620 cell lines while RKO and LoVo cell lines had comparatively lower expression levels. Among these cell lines, SW480 and SW620 have moderate metastasis potential while RKO and LoVo are highly metastatic cell lines.32 Meanwhile, TfR1 protein expression was consistent with mRNA expression in the CRC cell lines (Figure 2C).
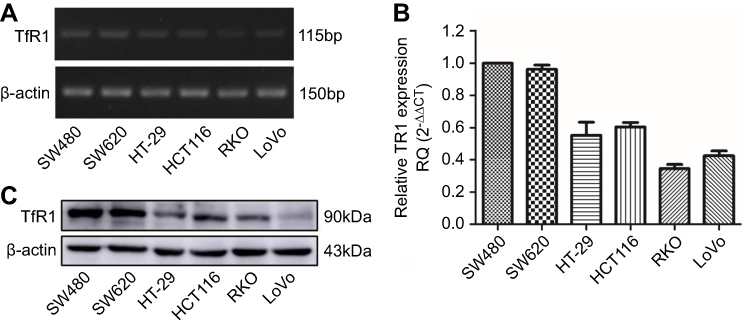 |
Figure 2 TfR1 expression in colorectal cancer cell lines. TfR1 mRNA expression in six CRC cell lines was examined by RT-PCR (A) and real-time PCR (B). TfR1 mRNA was relatively overexpressed in SW480 and SW620 cell lines, while RKO and LoVo cell lines had comparatively lower expression levels. (C) Differential TfR1 protein expression in the six CRC cell lines was evaluated by Western blot. The TfR1 protein expression levels in these cell lines were consistent with mRNA expression. |
Suppression of TfR1 expression reduced cell proliferation and colony formation
To evaluate the role of TfR1 in CRC, stable TfR1 knockdown SW480 and SW620 cell lines were established using lentivirus-mediated TfR1 small-hairpin RNA (shRNA). The efficiency of lentivirus-mediated shRNA was verified by real-time PCR and Western blot (Figure 3A–C).
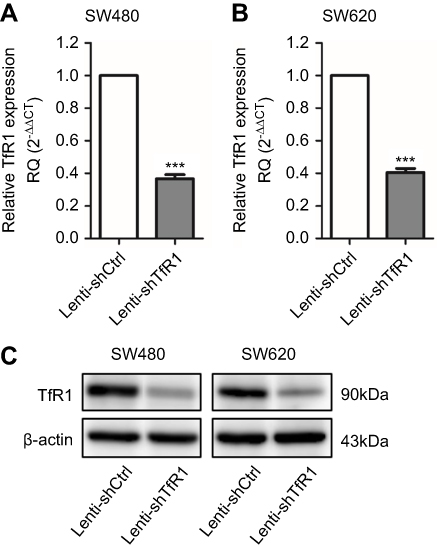 |
Figure 3 TfR1 expression was downregulated by lentivirus-mediated shRNA. TfR1 mRNA expression was verified by real-time PCR, showing that TfR1 expression in Lenti-shTfR1 cells was significantly lower than in control cells in both SW480 (A) and SW620 (B) cell lines, ***P<0.001. (C) The downregulation of TfR1 protein expression was assessed by Western blot. |
Cell growth and plate colony formation were carried out to examine whether downregulation of TfR1 would affect CRC cell proliferation in vitro. As shown in Figure 4A and B, downregulation of TfR1 inhibited CRC cell proliferation significantly in both SW480 and SW620 cell lines (P<0.001). Furthermore, knockdown of TfR1 expression decreased colony formation, with 42±12 colonies in Lenti-shTfR1 vs 129±50 colonies in control cells in SW480, and 4±3 colonies in Lenti-shTfR1 vs 43±23 colonies in control cells in SW620 (Figure 4C–E, P<0.05).
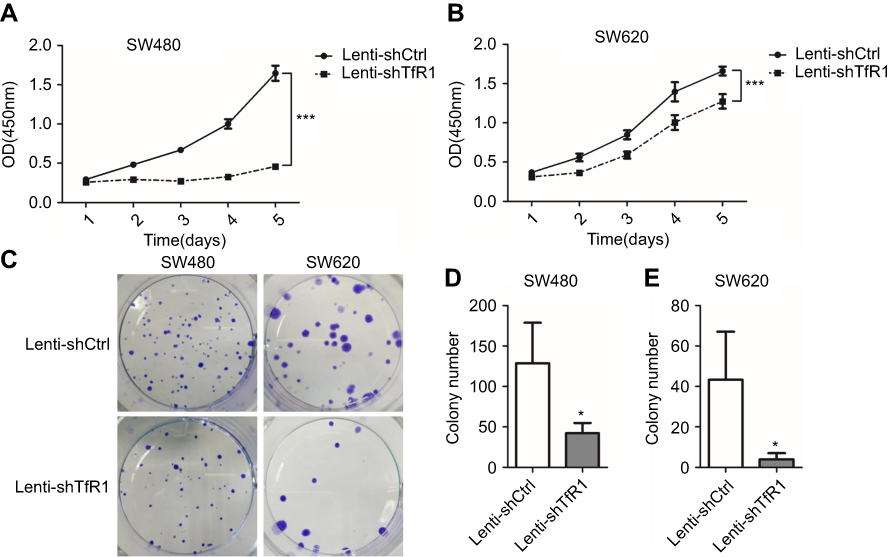 |
Figure 4 Downregulation of TfR1 inhibited proliferation of CRC cells. Cell proliferation was determined by CCK-8, and results showed that downregulation of TfR1 inhibited CRC cell proliferation significantly in both SW480 (A) and SW620 (B) cell lines, ***P<0.001. Knockdown of TfR1 expression decreased colony formation, with 42±12 colonies in Lenti-shTfR1 vs 129±50 colonies in control cells in SW480 (C and D), and 4±3 colonies in Lenti-shTfR1 vs 43±23 colonies in control cells in SW620 (C and E), *P<0.05. |
As we obtained only one effective shRNA sequence, we conducted a rescue experiment using a TfR1 overexpression lentivirus which contained a synonymous mutation according to the target interference sequence of the shRNA to avoid the off-target effect. Successful rescue of TfR1 expression was confirmed in Lenti-shTfR1 cells (Figure 5A–C). This was accompanied by a significantly faster growth rate in shTfR1-Lenti-TfR1 cells compared with shTfR1-Lenti-Ctrl cells (Figure 5D and E, P<0.001).
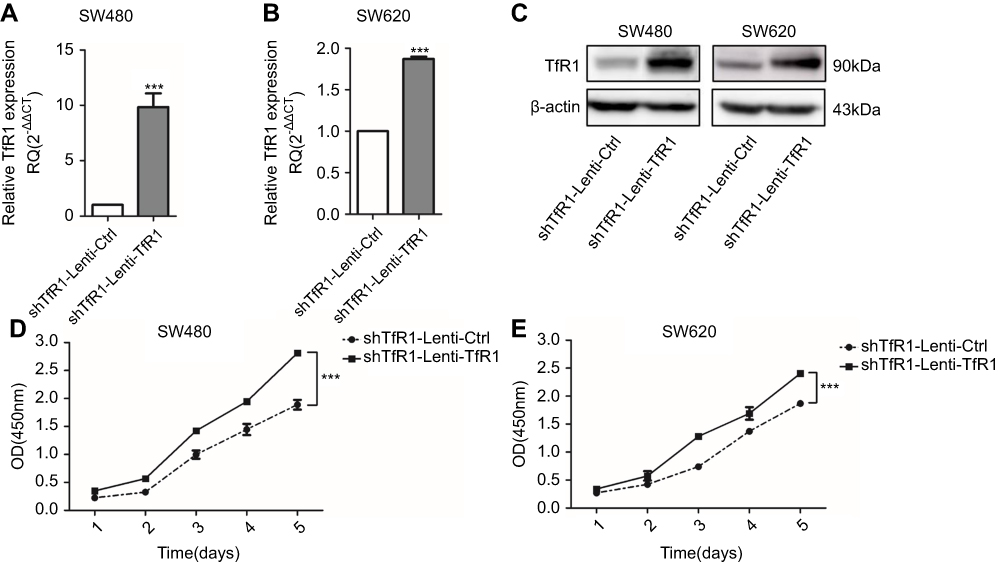 |
Figure 5 Successful rescue of TfR1 expression was confirmed after using TfR1 overexpression lentivirus in Lenti-shTfR1 cells. Rescue of TfR1 overexpression was confirmed by real-time PCR demonstrating that there was a significant overexpression of TfR1 in shTfR1-Lenti-TfR1 cells compared with control cells, in SW480 (A) and SW620 (B), ***P<0.001. (C) TfR1 protein expression was also higher in shTfR1-Lenti-TfR1 cells, evaluated by Western blot. At the same time, there was a significantly faster growth rate in shTfR1-Lenti-TfR1 cells compared with shTfR1-Lenti-Ctrl cells in SW480 (D) and SW620 (E), ***P<0.001. |
These results indicated that downregulation of TfR1 suppressed proliferation of CRC cell lines.
Downregulation of TfR1 expression promoted cells from G1 phase to S phase
Flow cytometry analysis showed that knockdown of TfR1 expression promoted cells from G1 phase to S phase. As shown in Figure 6A–C, the number of cells in G1 phase decreased significantly, from 52.68±0.97% in control cells to 41.02±3.56% in Lenti-shTfR1 cells in SW480, and from 55.86±9.48% in control cells to 42.63±8.96% in Lenti-shTfR1 cells in SW620 (P<0.01). Meanwhile, the number of cells in S phase increased significantly, from 29.42±1.99% in control cells to 35.79±4.31% in Lenti-shTfR1 cells in SW480, and from 33.12±8.19% in control cells to 42.00±7.20% in Lenti-shTfR1 cells in SW620 (P<0.05).
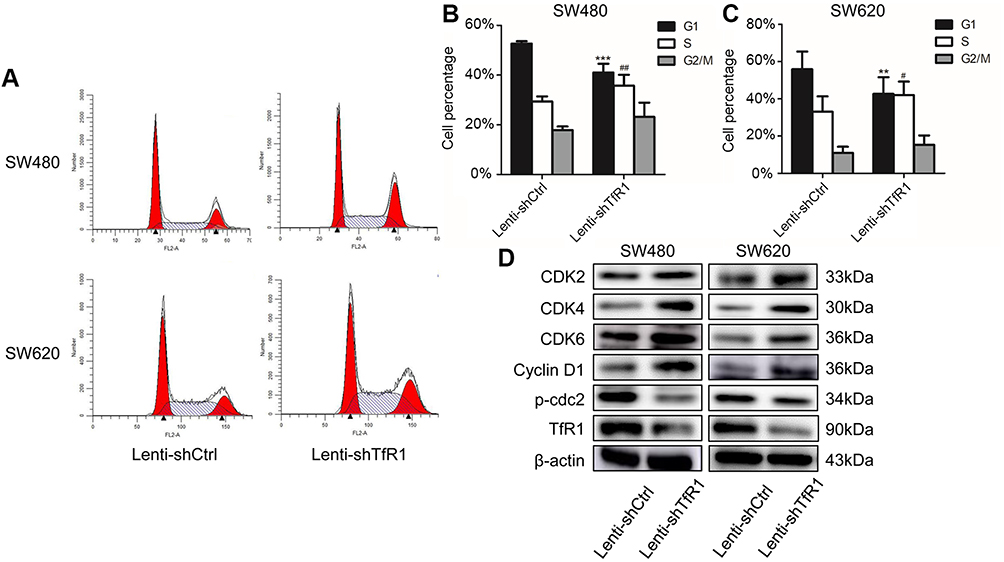 |
Figure 6 TfR1 knockdown changed cell cycle and promoted cells from G1 phase to S phase. (A) Cell cycle analysis showed that there was decrease of G1 phase and increase of S phase in Lenti-shTfR1 cells compared with control cells. (B) In SW480, G1 phase significantly decreased from 52.68±0.97% in control cells to 41.02±3.56% in Lenti-shTfR1 cells (***P<0.001) and S phase increased significantly from 29.42±1.99% in control cells to 35.79±4.31% in Lenti-shTfR1 cells (##P<0.01). (C) In SW620, G1 phase decreased significantly from 55.86±9.48% in control cells to 42.63±8.96% in Lenti-shTfR1 cells (**P<0.01), and S phase increased significantly from 33.12±8.19% in control cells to 42.00±7.20% in Lenti-shTfR1 cells (#P<0.05). (D) The expression of G1/S transition proteins (CDK2, CDK4, CDK6 and Cyclin D1) and G2 phase protein phospho-cdc2 was analyzed by Western blot. Knockdown of TfR1 expression resulted in upregulation of CDK2, CDK4, CDK6 and Cyclin D1 but downregulation of phospho-cdc2. |
Next, using Western blot, we assessed the expression of key proteins (CDK2, CDK4, CDK6 and Cyclin D1) which regulate the G1/S transition and G2 phase protein phospho-cdc2. Knockdown of TfR1 expression resulted in upregulation of CDK2, CDK4, CDK6 and Cyclin D1 but downregulation of phospho-cdc2 (Figure 6D). The changes in these cell cycle proteins further confirmed that downregulation of TfR1 expression could drive cells from G1 phase to S phase.
Downregulation of TfR1 expression promoted migration and invasion of CRC cells
To determine the effect of altered TfR1 expression on cell migration and invasion, we first used TfR1 knockdown cells for migration and invasion assays. As shown in Figure 7A and B, downregulation of TfR1 expression strongly promoted both migration and invasion in SW480 and SW620. Taking SW480 as an example, the number of migration cells per field was 908±113 cells in TfR1 knockdown cells vs 480±18 cells in control cells, and number of invasion cells per field was 632±23 cells in TfR1 knockdown cells vs 331±84 cells in control cells (P<0.01). The migration and invasion results showed that downregulation of TfR1 expression may promote CRC progression.
 |
Figure 7 TfR1 downregulation promoted migration and invasion of CRC cells. (A) In SW480, the number of migration cells per field was 908±113 in TfR1 knockdown cells vs 480±18 in control cells, and the number of invasion cells per field was 632±23 in TfR1 knockdown cells vs 331±84 in control cells (**P<0.01). (B) In SW620, the number of migration cells per field was 656±17 in TfR1 knockdown cells vs 290±34 in control cells (**P<0.01), and the number of invasion cells per field was 472±16 in TfR1 knockdown cells vs 165±26 in control cells (***P<0.001). |
Migration and invasion abilities of TfR1-negative CRC cells were stronger than those of TfR1-positive cells
In order to further explore the effect of TfR1 expression on cell migration and invasion, we chose RKO and LoVo with relatively lower TfR1 expression for flow cytometry sorting. The cells were sorted for TfR1-negative and TfR1-positive cells according to the sorting plot (Figure S1) and the sorted cells were then seeded into transwell chambers. The number of migration and invasion cells per field was significantly higher in TfR1-negative cells compared with TfR1-positive cells. Taking LoVo for example, the number of migration cells per field was 1,642±118 in TfR1-negative cells vs 906±60 cells in TfR1-positive cells, and the number of invasion cells per field was 1,293±39 in TfR1-negative cells vs 579±89 in TfR1-positive cells (Figure 8A and B, P<0.01). These results showed that TfR1-negative cells had much stronger migration and invasion abilities compared with TfR1-positive cells.
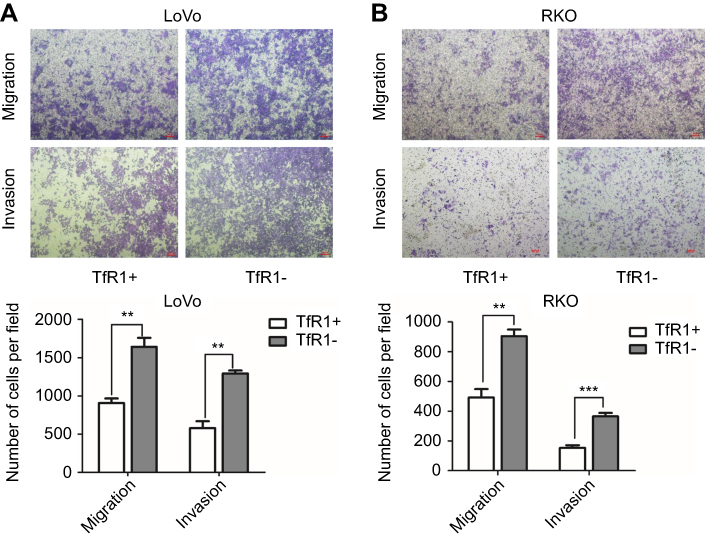 |
Figure 8 Migration and invasion abilities of TfR1-negative CRC cells were stronger than TfR1-positive cells. (A) In LoVo, the number of migration cells per field was 1642±118 in TfR1-negative cells vs 906±60 in TfR1-positive cells, and the number of invasion cells per field was 1293±39 in TfR1-negative cells vs 579±89 in TfR1-positive cells (**P<0.01). (B) In RKO, the number of migration cells per field was 905±44 in TfR1-negative cells vs 492±56 cells in TfR1-positive cells (**P<0.01), and the number of invasion cells per field was 365±24 in TfR1-negative cells vs 153±18 in TfR1-positive cells (***P<0.001). |
TfR1 knockdown resulted in activation of the JAK/STAT signaling pathway
In order to explore the mechanism of TfR1 in the progression of CRC, both Lenti-shCtrl and Lenti-shTfR1 cells were used for protein microarray analysis. The protein microarray results showed upregulation of phospho-STAT3(Ser727) in Lenti-shTfR1 cells in both SW480 and SW620 (Figure S2). Therefore, we tested the major proteins in the JAK/STAT signaling pathway. The phosphorylation level of most proteins in the JAK/STAT signaling pathway, such as p-Jak1, p-Tyk2, p-STAT1, p-STAT3(Ser727), p-STAT5 and p-STAT6, increased in Lenti-shTfR1 cells compared with control cells (Figure 9A and B). We did not detect the expression of p-Jak2 or p-Jak3, and we found a more distinct upregulation in the expression of p-STAT3(Ser727) instead of p-STAT3(Tyr705), which was consistent with the protein microarray analysis.
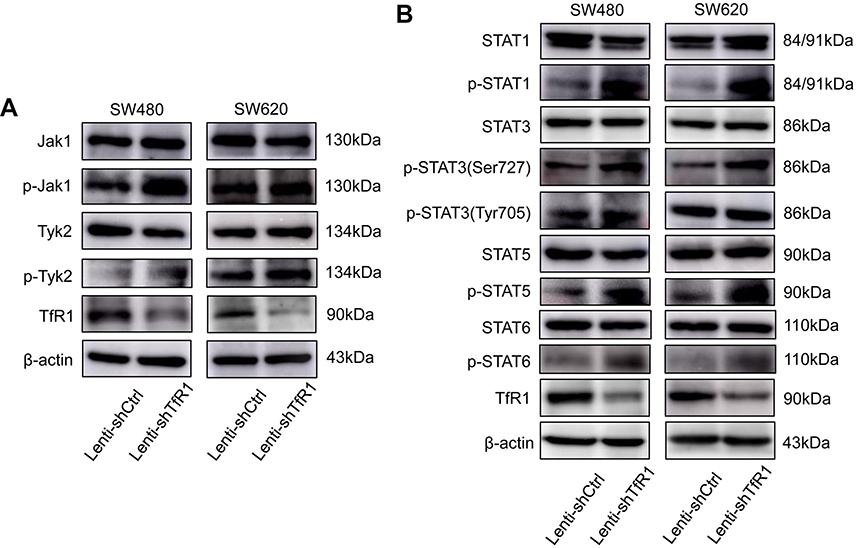 |
Figure 9 The JAK/STAT signaling pathway was activated after TfR1 downregulation. (A) p-Jak1 and p-Tyk2 in the JAK family were upregulated in Lenti-shTfR1 cells compared with control cells. Expression of p-Jak2 or p-Jak3 was not detected. (B) In the STAT family, p-STAT1, p-STAT3(Ser727), p-STAT5 and p-STAT6 were upregulated in Lenti-shTfR1 cells and there was a more distinct upregulation of p-STAT3(Ser727) than p-STAT3(Tyr705). |
These results indicated that downregulation of TfR1 expression may activate the JAK/STAT signaling pathway, which further suggested that lower expression of TfR1 in CRC may be harmful.
Downregulation of TfR1 expression reduced tumorigenicity in vivo
As we found that downregulation of TfR1 significantly inhibited CRC cell proliferation in vitro, we further evaluated the effect of TfR1 knockdown on tumor growth of CRC cells in BALB/C-nu mice. For SW620, tumors from Lenti-shTfR1 cells had a slower growth rate than tumors from Lenti-shCtrl cells, which was consistent with the in vitro growth rates (Figure 10A and B, P<0.05). Meanwhile, the tumor weight from Lenti-shTfR1 cells was lower than from control cells, with 0.63±0.12 g of Lenti-shTfR1 vs 0.98±0.23 g of Lenti-shCtrl (Figure 10C, P<0.05).
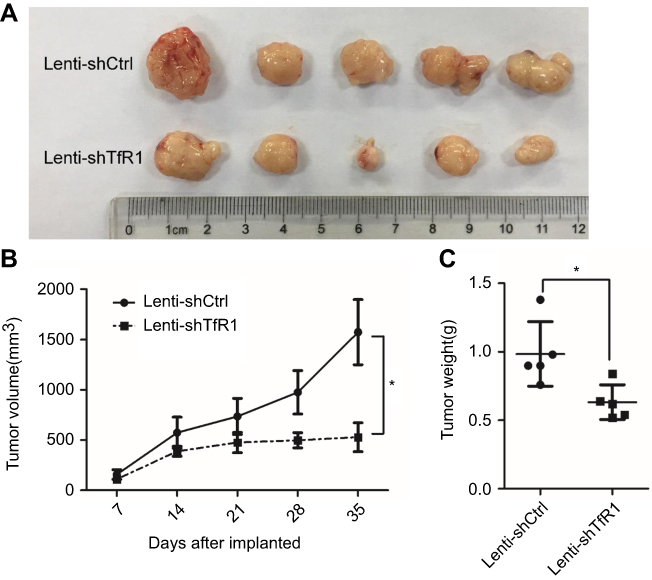 |
Figure 10 Downregulation of TfR1 expression reduced in vivo carcinogenesis. (A) Tumors from Lenti-shTfR1 SW620 cells (lower row) were smaller than tumors from Lenti-shCtrl SW620 cells (upper row). (B) In SW620, tumors from Lenti-shTfR1 cells had a slower growth rate than tumors from Lenti-shCtrl cells (*P<0.05). (C) Weight of tumors from Lenti-shTfR1 cells was lower than from control cells, with 0.63±0.12 g of Lenti-shTfR1 vs 0.98±0.23 g of Lenti-shCtrl (*P<0.05). |
In SW480, we also found a tendency for tumors from Lenti-shTfR1 cells to have a slower growth rate and for tumor weight to be lower than from control cells, though there was no statistical significance (Figure S3).
Taken together, these results showed that downregulation of TfR1 expression could also reduce the growth of colorectal tumors in vivo.
Discussion
Iron is circulated in the form of iron-bound transferrin in the human body and its cellular uptake is mediated via TfR1.33 As there is an increased need for iron in most tumor cells,34 TfR1 overexpression has been reported in many kinds of tumors.9–11,14,15,35,36 Anemia is a complication in patients with CRC because of bleeding from the gastrointestinal tract which will result in iron deficiency.16 In iron-deficient conditions, the iron regulatory proteins-1 will bind to the iron response elements regions, and the TfR1 mRNA is translate, so that the level of TfR1 on the cell surface will increase.4,37 In our study, we detected that relative TfR1 expression in CRC tissues was notably higher than in non-cancerous tissues (Figure 1A and B), indicating TfR1 overexpression in CRC.
TfR1 serves as the main port of entry for iron-bound transferrin,33 and several studies have reported that downregulation of TfR1 caused inhibition of cell proliferation.12,13,35,38,39 As we have shown in Figures 4A–E and 10A–C, downregulation of TfR1 inhibited CRC cell proliferation both in vitro and in vivo, possibly demonstrating that downregulation of TfR1 expression reduces cell uptake of iron-bound transferrin, causing the cell proliferation rate to decline.
Although downregulation of TfR1 expression resulted in the inhibition of CRC cell proliferation, we also discovered that TfR1 knockdown could promote CRC progression to an extraordinary degree. A previous study reported that the level of TfR1 expression decreased with increasing CRC stage: high expression of TfR1 was found in Dukes A or B grade and well-differentiated CRC samples while weak or no expression of TfR1 was observed in Dukes C or D and poorly differentiated samples.16 These results are consistent with our findings on TfR1 expression in CRC tissues and cell lines. TfR1 expression was higher in CRC tissues with a lower degree of malignancy (Figure 1C), and TfR1 mRNA was relatively overexpressed in CRC cell lines with moderate metastasis potential, while expressed at a lower level in CRC cell lines with high metastasis potential (Figure 2A–C).32 A possible explanation for the lower TfR1 expression in high Dukes grade CRC could be a deficiency of α1-AT,40 which could inhibit transferrin binding with TfR1.41 When there is a lack of α1-AT, iron uptake through transferrin binding with TfR1 will not be inhibited, causing the expression of free TfR1 to decrease. The correlation of TfR1 expression with clinicopathological features of CRC might be different from other types of tumors.42,43 Iron plays a complex role in CRC. Under normal circumstances, the small intestine can absorb no more than 10% of the total iron uptake, and so a large amount of iron is not absorbed in the small intestine, which may accumulate in the colon.44 Excess iron uptake could induce oxidative stress in cells and increase the risk of CRC.45,46 On the other hand, CRC patients at advanced stage could suffer from chronic hemorrhage in intestine, resulting in chronic loss of iron, and patients will be in an iron-deficient state.47 Therefore, the pathophysiological role of iron metabolism in CRC needs to be explored and understood more extensively.
Furthermore, our cell cycle analysis indicated that downregulation of TfR1 promoted cell transition from G1 phase to S phase (Figure 6A–D). This is in accordance with a study on esophageal squamous cell carcinoma in which CD71 siRNA induced cell accumulation in the S phase coupled with cell depletion in the G1 phase.35 Furthermore, there were more migration and invasion cells in Lenti-shTfR1 cells (Figure 7A and B) and TfR1-negative cells (Figure 8A and B). These results also showed that TfR1 knockdown may promote CRC progression. Several studies have reported that TfR1-negative cells have cancer stem cell potential. In gastric adenosquamous carcinoma, the scatter and invasive activities of CD71-negative cells were higher than those of CD71-positive cells, and only 100 CD71-negative cells could develop tumors in NOD/SCID mice, while CD71-positive cells could not.48 Tyagi A and colleagues demonstrated that cells sorted from the CD71-negative plot showed spheroid-forming ability and expressed stemness markers such as Oct4, Sox2, Nanog and CD133.49
In view of the change in cell phenotype after downregulation of TfR1, we detected that downregulation of TfR1 expression could activate the JAK/STAT signaling pathway (Figure 9A and B). The active JAKs phosphorylate tyrosine residues in the cytoplasmic region of the receptor, thus, creating binding sites which recruit STATs. Then, the STATs form dimers that translocate to the nucleus. The STAT dimers could bind specific promoter sequences and modulate transcription of genes that control cellular processes including proliferation, differentiation and apoptosis. Furthermore, JAK/STAT activation contributes to tumor invasion and metastasis in solid tumors.18,19 In esophageal squamous cell carcinoma, an obvious increase in the level of phospho-MEK1/2 has been found in CD71-suppressed cells, coupled with an increase in its downstream factor phosphor-ERK1/2.35 Together with our discovery of JAK/STAT pathway activation in TfR1 knockdown cells, we speculated that even if TfR1 expression was higher in tumor tissues than in normal tissues, low relative expression of TfR1 compared with tumor tissues alone might promote tumor progression. Furthermore, survival analysis showed that CRC patients with positive TfR1 expression had a better survival than those with negative TfR1 expression (Figure 1D and E). These results further support the tumor-promoting effect of low TfR1 expression.
Dr Fan and his colleagues at the Institute of Biophysics, Chinese Academy of Sciences, have compounded a kind of iron oxide nanoparticle encapsulated in a recombinant human heavy-chain ferritin (HFn) protein shell.29 Building on a previous finding that HFn can bind to tumor cells that overexpress TfR1,28 they loaded doxorubicin (Dox) into HFn and demonstrated that the Dox-loaded HFn (HFn-Dox) displayed an excellent safety profile, significantly reducing healthy organ drug exposure and improving the maximum tolerated dose compared with free Dox in CRC cell-derived xenograft mouse models50,51 and glioma.52 Dox is a kind of conventional antitumor drug which has serious side effects, including cardiotoxicity, myelosuppression and nephrotoxicity.33 HFn-Dox not only inhibited the growth of tumors effectively in mice, but also had less toxic effects than Dox. HFn-Dox could prolong the overall survival of mice by 5 to 6 days.50 HFn-Dox could suppress tumor growth and have less side effects at the same time. We are cooperating with their team and carrying out experiments with HFn-Dox on CRC patient-derived xenograft (PDX) mouse models. It is hoped that these explorations will yield a safer target therapy method for CRC.
Conclusion
In this study, we found that TfR1 played an extraordinary role in CRC. Though TfR1 expression was found to be higher in tumor tissues compared with normal tissues, there was evidence that low relative expression of TfR1 might promote CRC progression through the JAK/STAT pathway. TfR1 could be a therapeutic target for CRC through the use of specific nanoparticles.
Abbreviation list
CRC, colorectal cancer; TfR1, transferrin receptor 1; JAK, Janus protein tyrosine kinase; STAT, signal transducer and activator of transcription.
Ethics approval and informed consent
This study was approved by the Ethical Committee of Peking University Cancer Hospital and was conducted according to the principles expressed in the Declaration of Helsinki. Written informed consent for tissue sample was acquired from each patient.
All animal experiments were approved by the Committee on the Ethics of Animal Experiments of Peking University of Oncology (Permit Number EAEC2018-06), and the animal experiments were performed in accordance with the standard guidelines for the Care and Use of Laboratory Animals of Peking University Cancer Hospital.
Acknowledgments
We thank Dr. Fan very much for providing the nanoparticle kindly. This study was supported by Beijing Municipal Administration of Hospital’s Ascent Plan (approval No. DFL20181104); Beijing Municipal Administration of Hospitals Clinical Medicine Development of Special Funding Support (approval No. XMLX201708); Beijing Municipal Natural Science Foundation (approval No. 7153161); National Natural Science Funding (approval No. 31770836), Capital Characteristic Clinical Application Research (approval No. Z161100000516065), and Science Foundation of Peking University Cancer Hospital (approval No. 2017-15).
Author contributions
All authors contributed to data analysis, drafting and revising the article, gave final approval of the version to be published, and agree to be accountable for all aspects of the work.
Disclosure
The authors report no conflicts of interest in this work.
References
1. Siegel RL, Miller KD, Jemal A. Cancer statistics, 2018. CA Cancer J Clin. 2018;68(1):7–30. doi:10.3322/caac.21442
2. Holmes D. A disease of growth. Nature. 2015;521(7551):S2–S3. doi:10.1038/521S2a
3. Bailey CE, Hu CY, You YN, et al. Increasing disparities in the age-related incidences of colon and rectal cancers in the United States, 1975–2010. JAMA Surg. 2015;150(1):17–22. doi:10.1001/jamasurg.2014.1756
4. Daniels TR, Delgado T, Rodriguez JA, Helguera G, Penichet ML. The transferrin receptor part I: biology and targeting with cytotoxic antibodies for the treatment of cancer. Clin Immunol. 2006;121(2):144–158. doi:10.1016/j.clim.2006.06.010
5. Richardson DR, Kalinowski DS, Lau S, Jansson PJ, Lovejoy DB. Cancer cell iron metabolism and the development of potent iron chelators as anti-tumour agents. Biochim Biophys Acta. 2009;1790(7):702–717. doi:10.1016/j.bbagen.2008.04.003
6. Omary MB, Trowbridge IS, Minowada J. Human cell-surface glycoprotein with unusual properties. Nature. 1980;286(5776):888–891.
7. Faulk WP, Hsi BL, Stevens PJ. Transferrin and transferrin receptors in carcinoma of the breast. Lancet. 1980;2(8191):390–392.
8. Sutherland R, Delia D, Schneider C, Newman R, Kemshead J, Greaves M. Ubiquitous cell-surface glycoprotein on tumor cells is proliferation-associated receptor for transferrin. Proc Natl Acad Sci U S A. 1981;78(7):4515–4519. doi:10.1073/pnas.78.7.4515
9. Kondo K, Noguchi M, Mukai K, et al. Transferrin receptor expression in adenocarcinoma of the lung as a histopathologic indicator of prognosis. Chest. 1990;97(6):1367–1371.
10. Sciot R, Paterson AC, van Eyken P, Callea F, Kew MC, Desmet VJ. Transferrin receptor expression in human hepatocellular carcinoma: an immunohistochemical study of 34 cases. Histopathology. 1988;12(1):53–63.
11. Ryschich E, Huszty G, Knaebel HP, Hartel M, Buchler MW, Schmidt J. Transferrin receptor is a marker of malignant phenotype in human pancreatic cancer and in neuroendocrine carcinoma of the pancreas. Eur J Cancer. 2004;40(9):1418–1422. doi:10.1016/j.ejca.2004.01.036
12. Jeong SM, Hwang S, Seong RH. Transferrin receptor regulates pancreatic cancer growth by modulating mitochondrial respiration and ROS generation. Biochem Biophys Res Commun. 2016;471(3):373–379. doi:10.1016/j.bbrc.2016.02.023
13. Jeong SM, Lee J, Finley LW, Schmidt PJ, Fleming MD, Haigis MC. SIRT3 regulates cellular iron metabolism and cancer growth by repressing iron regulatory protein 1. Oncogene. 2015;34(16):2115–2124. doi:10.1038/onc.2014.124
14. Yang DC, Wang F, Elliott RL, Head JF. Expression of transferrin receptor and ferritin H-chain mRNA are associated with clinical and histopathological prognostic indicators in breast cancer. Anticancer Res. 2001;21(1b):541–549.
15. Magro G, Cataldo I, Amico P, et al. Aberrant expression of TfR1/CD71 in thyroid carcinomas identifies a novel potential diagnostic marker and therapeutic target. Thyroid. 2011;21(3):267–277. doi:10.1089/thy.2010.0173
16. Prutki M, Poljak-Blazi M, Jakopovic M, Tomas D, Stipancic I, Zarkovic N. Altered iron metabolism, transferrin receptor 1 and ferritin in patients with colon cancer. Cancer Lett. 2006;238(2):188–196. doi:10.1016/j.canlet.2005.07.001
17. Brookes MJ, Hughes S, Turner FE, et al. Modulation of iron transport proteins in human colorectal carcinogenesis. Gut. 2006;55(10):1449–1460. doi:10.1136/gut.2006.094060
18. Thomas SJ, Snowden JA, Zeidler MP, Danson SJ. The role of JAK/STAT signalling in the pathogenesis, prognosis and treatment of solid tumours. Br J Cancer. 2015;113(3):365–371. doi:10.1038/bjc.2015.233
19. Spano J-P, Milano G, Rixe C, Fagard R. JAK/STAT signalling pathway in colorectal cancer: A new biological target with therapeutic implications. Eur J Cancer. 2006;42(16):2668–2670. doi:10.1016/j.ejca.2006.07.006
20. Bromberg J. Stat proteins and oncogenesis. J Clin Invest. 2002;109(9):1139–1142. doi:10.1172/JCI15617
21. Lu H, Wu S, Chen H, et al. Crizotinib induces apoptosis of lung cancer cells through JAK-STAT pathway. Oncol Lett. 2018;16(5):5992–5996. doi:10.3892/ol.2018.9387
22. Li M, Zheng R, Yuan FL. MiR-410 affects the proliferation and apoptosis of lung cancer A549 cells through regulation of SOCS3/JAK-STAT signaling pathway. Eur Rev Med Pharmacol Sci. 2018;22(18):5987–5993. doi:10.26355/eurrev_201809_15933
23. Pappa E, Nikitakis N, Vlachodimitropoulos D, Avgoustidis D, Oktseloglou V, Papadogeorgakis N. Phosphorylated signal transducer and activator of transcription-1 immunohistochemical expression is associated with improved survival in patients with oral squamous cell carcinoma. J Oral Maxillofac Surg. 2014;72(1):211–221. doi:10.1016/j.joms.2013.06.198
24. Hu Y, Hong Y, Xu Y, Liu P, Guo DH, Chen Y. Inhibition of the JAK/STAT pathway with ruxolitinib overcomes cisplatin resistance in non-small-cell lung cancer NSCLC. Apoptosis. 2014;19(11):1627–1636. doi:10.1007/s10495-014-1030-z
25. Proietti C, Salatino M, Rosemblit C, et al. Progestins induce transcriptional activation of signal transducer and activator of transcription 3 (Stat3) via a Jak- and Src-dependent mechanism in breast cancer cells. Mol Cell Biol. 2005;25(12):4826–4840. doi:10.1128/MCB.25.12.4826-4840.2005
26. Leeman RJ, Lui VW, Grandis JR. STAT3 as a therapeutic target in head and neck cancer. Expert Opin Biol Ther. 2006;6(3):231–241. doi:10.1517/14712598.6.3.231
27. Theil EC. Ferritin: structure, gene regulation, and cellular function in animals, plants, and microorganisms. Annu Rev Biochem. 1987;56:289–315. doi:10.1146/annurev.bi.56.070187.001445
28. Li L, Fang CJ, Ryan JC, et al. Binding and uptake of H-ferritin are mediated by human transferrin receptor-1. Proc Natl Acad Sci U S A. 2010;107(8):3505–3510. doi:10.1073/pnas.0913192107
29. Fan K, Cao C, Pan Y, et al. Magnetoferritin nanoparticles for targeting and visualizing tumour tissues. Nat Nanotechnol. 2012;7(7):459–464. doi:10.1038/nnano.2012.90
30. Marullo M, Zuccato C, Mariotti C, et al. Expressed Alu repeats as a novel, reliable tool for normalization of real-time quantitative RT-PCR data. Genome Biol. 2010;11(1):R9. doi:10.1186/gb-2010-11-11-r110
31. Vasaikar SV, Straub P, Wang J, Zhang B. LinkedOmics: analyzing multi-omics data within and across 32 cancer types. Nucleic Acids Res. 2018;46(D1):D956–d963. doi:10.1093/nar/gkx1090
32. Zhang Y, Tian X, Ji H, et al. Expression of SATB1 promotes the growth and metastasis of colorectal cancer. PLoS One. 2014;9(6):e100413. doi:10.1371/journal.pone.0100413
33. Daniels TR, Bernabeu E, Rodriguez JA, et al. The transferrin receptor and the targeted delivery of therapeutic agents against cancer. Biochim Biophys Acta. 2012;1820(3):291–317. doi:10.1016/j.bbagen.2011.07.016
34. Ludwig H, Evstatiev R, Kornek G, et al. Iron metabolism and iron supplementation in cancer patients. Wien Klin Wochenschr. 2015;127(23–24):907–919. doi:10.1007/s00508-015-0842-3
35. Chan KT, Choi MY, Lai KK, et al. Overexpression of transferrin receptor CD71 and its tumorigenic properties in esophageal squamous cell carcinoma. Oncol Rep. 2014;31(3):1296–1304. doi:10.3892/or.2014.2981
36. Hanninen MM, Haapasalo J, Haapasalo H, et al. Expression of iron-related genes in human brain and brain tumors. BMC Neurosci. 2009;10:36. doi:10.1186/1471-2202-10-36
37. Jiang XP, Elliott RL, Head JF. Manipulation of iron transporter genes results in the suppression of human and mouse mammary adenocarcinomas. Anticancer Res. 2010;30(3):759–765.
38. Wang W, Deng Z, Hatcher H, et al. IRP2 regulates breast tumor growth. Cancer Res. 2014;74(2):497–507. doi:10.1158/0008-5472.CAN-13-1224
39. O’Donnell KA, Yu D, Zeller KI, et al. Activation of transferrin receptor 1 by c-Myc enhances cellular proliferation and tumorigenesis. Mol Cell Biol. 2006;26(6):2373–2386. doi:10.1128/MCB.26.6.2373-2386.2006
40. Yang P, Cunningham JM, Halling KC, et al. Higher risk of mismatch repair-deficient colorectal cancer in alpha(1)-antitrypsin deficiency carriers and cigarette smokers. Mol Genet Metab. 2000;71(4):639–645. doi:10.1006/mgme.2000.3089
41. Graziadei I, Gaggl S, Kaserbacher R, Braunsteiner H, Vogel W. The acute-phase protein alpha 1-antitrypsin inhibits growth and proliferation of human early erythroid progenitor cells (burst-forming units-erythroid) and of human erythroleukemic cells (K562) in vitro by interfering with transferrin iron uptake. Blood. 1994;83(1):260–268.
42. Adachi M, Kai K, Yamaji K, et al. Transferrin receptor 1 overexpression is associated with tumor dedifferentiation and acts as a potential prognostic indicator of hepatocellular carcinoma. Histopathology. 2019. doi:10.1111/his.13847
43. Greene CJ, Attwood K, Sharma NJ, et al. Transferrin receptor 1 upregulation in primary tumor and downregulation in benign kidney is associated with progression and mortality in renal cell carcinoma patients. Oncotarget. 2017;8(63):107052–107075. doi:10.18632/oncotarget.22323
44. Senesse P, Meance S, Cottet V, Faivre J, Boutron-Ruault MC. High dietary iron and copper and risk of colorectal cancer: a case-control study in Burgundy, France. Nutr Cancer. 2004;49(1):66–71. doi:10.1207/s15327914nc4901_9
45. Xue X, Shah YM. Intestinal iron homeostasis and colon tumorigenesis. Nutrients. 2013;5(7):2333–2351. doi:10.3390/nu5072333
46. Chua AC, Klopcic B, Lawrance IC, Olynyk JK, Trinder D. Iron: an emerging factor in colorectal carcinogenesis. World J Gastroenterol. 2010;16(6):663–672. doi:10.3748/wjg.v16.i6.663
47. Kishida T, Shinozawa I, Tanaka S, et al. Significance of serum iron and ferritin in patients with colorectal adenomas. Scand J Gastroenterol. 1997;32(3):233–237.
48. Ohkuma M, Haraguchi N, Ishii H, et al. Absence of CD71 transferrin receptor characterizes human gastric adenosquamous carcinoma stem cells. Ann Surg Oncol. 2011;19(4):1357–1364. doi:10.1245/s10434-011-1739-7
49. Tyagi A, Vishnoi K, Mahata S, et al. Cervical cancer stem cells selectively overexpress HPV oncoprotein E6 that controls stemness and self-renewal through upregulation of HES1. Clin Cancer Res. 2016;22(16):4170–4184. doi:10.1158/1078-0432.CCR-15-2574
50. Liang M, Fan K, Zhou M, et al. H-ferritin-nanocaged doxorubicin nanoparticles specifically target and kill tumors with a single-dose injection. Proc Natl Acad Sci U S A. 2014;111(41):14900–14905. doi:10.1073/pnas.1407808111
51. Fan K, Xi J, Fan L, et al. In vivo guiding nitrogen-doped carbon nanozyme for tumor catalytic therapy. Nat Commun. 2018;9(1):1440. doi:10.1038/s41467-018-03903-8
52. Fan K, Jia X, Zhou M, et al. Ferritin nanocarrier traverses the blood brain barrier and kills glioma. ACS Nano. 2018;12(5):4105–4115. doi:10.1021/acsnano.7b06969
Supplementary materials
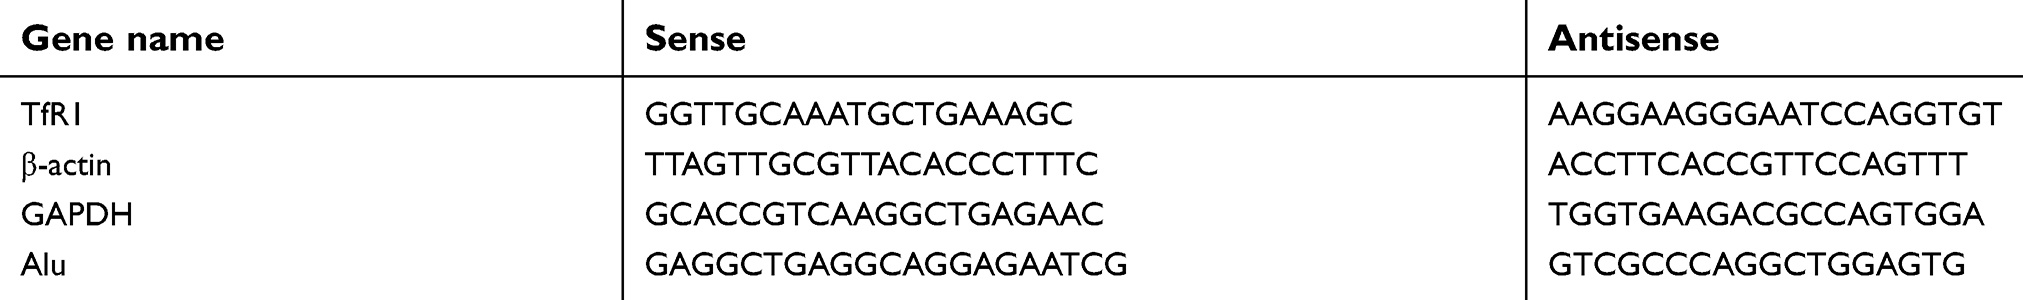 |
Table S1 The sequences of primers |
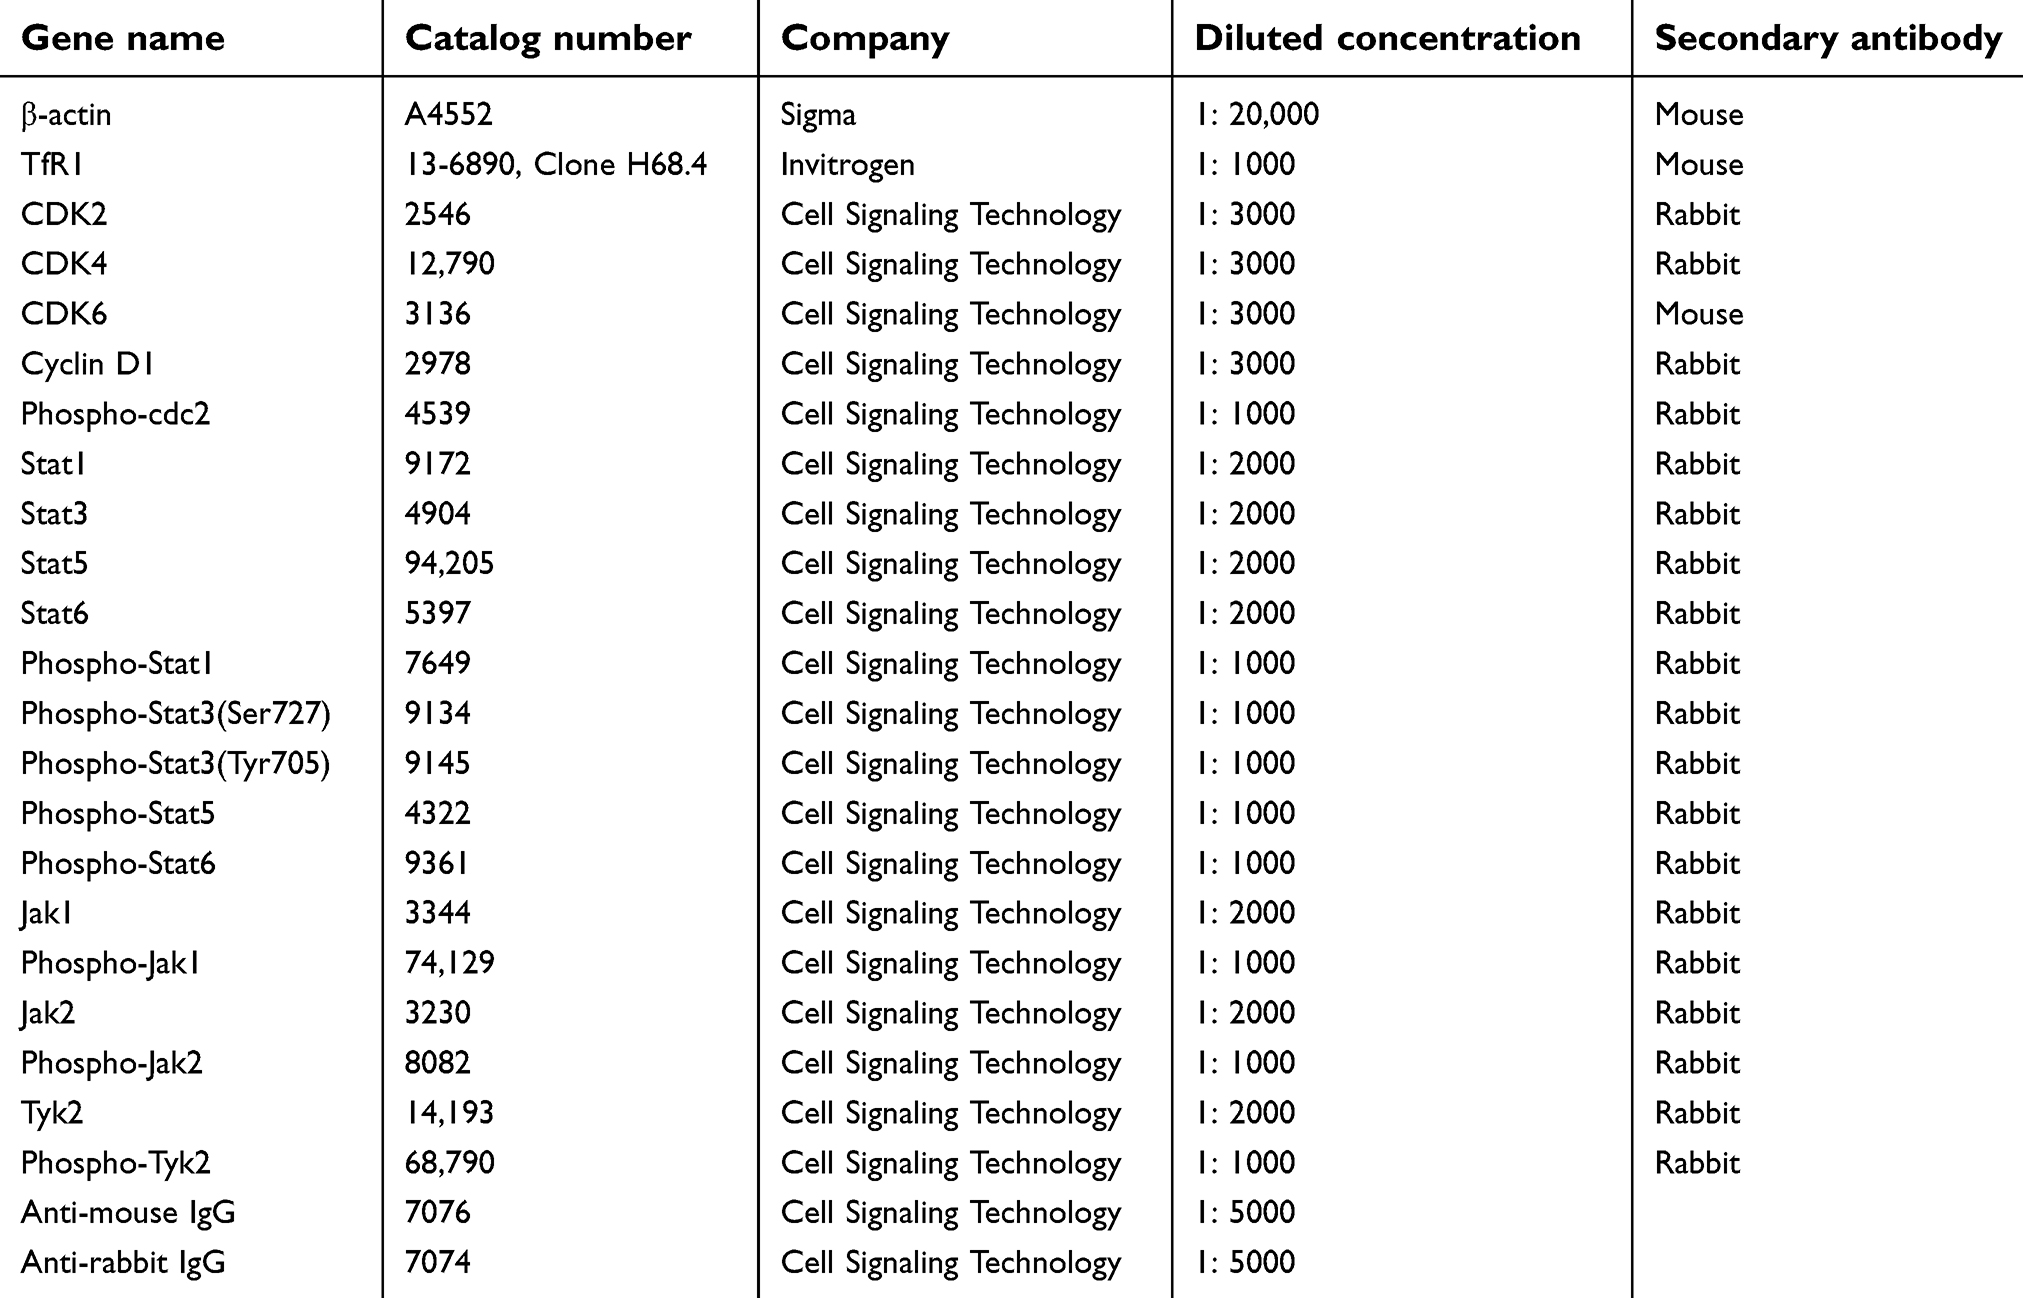 |
Table S2 The information of antibodies |
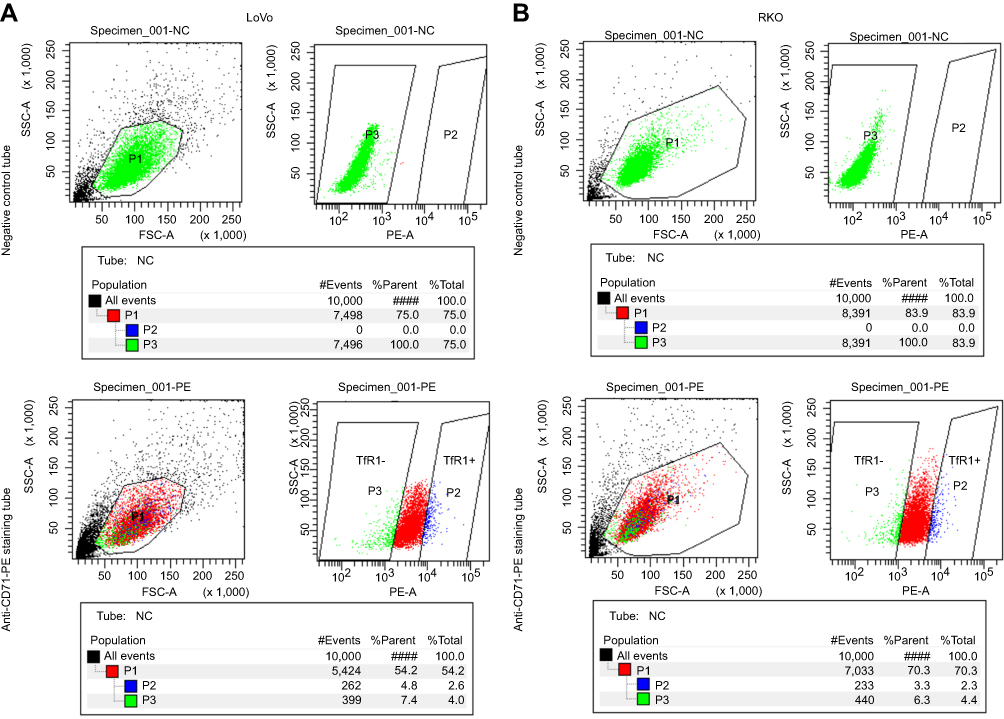 |
Figure S1 The cell sorting plot for flow cytometry sorting. The negative control tubes were null cells without any staining, which were used for determination of TfR1-negative plot (green). The rightmost cell population in staining tubes were chosen as TfR1-positive plot (blue). (A) is the sorting plot for LoVo and (B) is for RKO. |
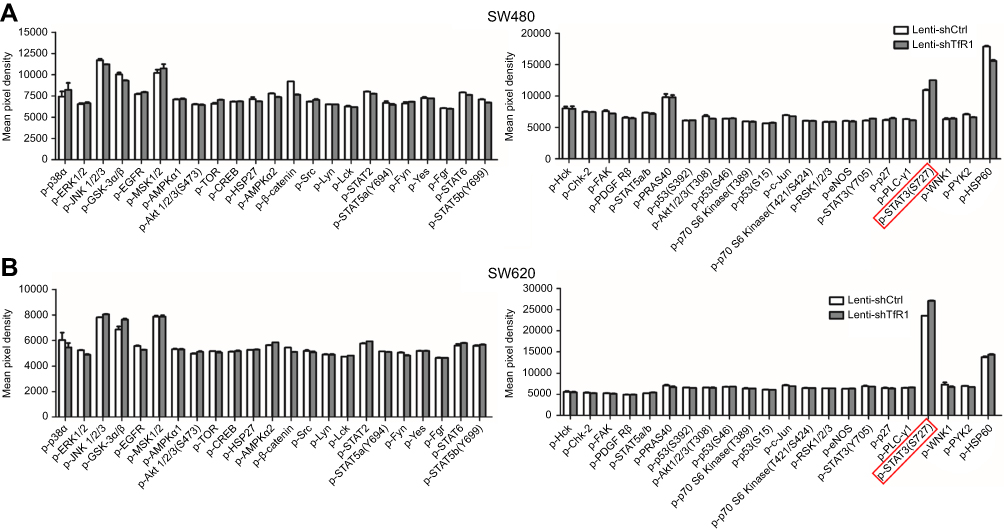 |
Figure S2 The result of protein microarray analysis. Both in SW480 (A) and SW620 (B), there was a consistent upregulation of phospho-STAT3(Ser727) in Lenti-shTfR1 cells (marked by the red frame) compared with control cells. |
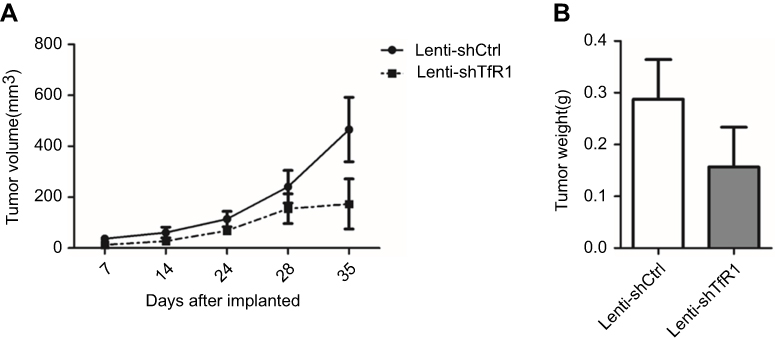 |
Figure S3 In vivo carcinogenesis of SW480. As for SW480 cells, tumors from Lenti-shTfR1 cells had a slower growth rate (A, P=0.12) and lighter tumor weight (B, P=0.29) than control cells, even if there was no statistical significance. |
 © 2019 The Author(s). This work is published and licensed by Dove Medical Press Limited. The full terms of this license are available at https://www.dovepress.com/terms.php and incorporate the Creative Commons Attribution - Non Commercial (unported, v3.0) License.
By accessing the work you hereby accept the Terms. Non-commercial uses of the work are permitted without any further permission from Dove Medical Press Limited, provided the work is properly attributed. For permission for commercial use of this work, please see paragraphs 4.2 and 5 of our Terms.
© 2019 The Author(s). This work is published and licensed by Dove Medical Press Limited. The full terms of this license are available at https://www.dovepress.com/terms.php and incorporate the Creative Commons Attribution - Non Commercial (unported, v3.0) License.
By accessing the work you hereby accept the Terms. Non-commercial uses of the work are permitted without any further permission from Dove Medical Press Limited, provided the work is properly attributed. For permission for commercial use of this work, please see paragraphs 4.2 and 5 of our Terms.