")
Back to Journals » OncoTargets and Therapy » Volume 13
Downregulation of RRM2 Attenuates Retroperitoneal Liposarcoma Progression via the Akt/mTOR/4EBP1 Pathway: Clinical, Biological, and Therapeutic Significance
Authors Zhang S, Yan L, Cui C, Wang Z, Wu J, Lv A, Zhao M, Dong B, Zhang W, Guan X, Tian X, Hao C
Received 19 January 2020
Accepted for publication 2 April 2020
Published 3 July 2020 Volume 2020:13 Pages 6523—6537
DOI https://doi.org/10.2147/OTT.S246613
Checked for plagiarism Yes
Review by Single anonymous peer review
Peer reviewer comments 2
Editor who approved publication: Prof. Dr. Nicola Silvestris
Sha Zhang,1 Liang Yan,1 Can Cui,2 Zhen Wang,1 Jianhui Wu,1 Ang Lv,1 Min Zhao,3 Bin Dong,4 Wenlong Zhang,5 Xiaoya Guan,1 Xiuyun Tian,1 Chunyi Hao1
1Key Laboratory of Carcinogenesis and Translational Research (Ministry of Education/Beijing), Department of Hepato-Pancreato-Biliary Surgery, Peking University Cancer Hospital & Institute, Beijing 100142, People’s Republic of China; 2Department of Breast Oncology, Tianjin Medical University Cancer Institute and Hospital, Key Laboratory of Breast Cancer Prevention and Therapy, Tianjin Medical University, Ministry of Education, Key Laboratory of Cancer Prevention and Therapy, Tianjin, People’s Republic of China; 3Key Laboratory of Carcinogenesis and Translational Research (Ministry of Education/Beijing), Department of Pathology, Peking University Cancer Hospital & Institute, Beijing, People’s Republic of China; 4Key Laboratory of Carcinogenesis and Translational Research (Ministry of Education/Beijing), Central Laboratory, Peking University Cancer Hospital & Institute, Beijing, People’s Republic of China; 5Key Laboratory of Carcinogenesis and Translational Research (Ministry of Education/Beijing), Department of Laboratory Animal, Peking University Cancer Hospital & Institute, Beijing 100142, People’s Republic of China
Correspondence: Chunyi Hao; Xiuyun Tian
Department of Hepato-Pancreato-Biliary Surgery, Peking University Cancer Hospital & Institute, No. 52, Fucheng Road, Haidian District, Beijing 100142, People’s Republic of China
Tel +86-10-88196182
; +86-10-88196841
Fax +86-10-88196548
Email [email protected]; [email protected]
Background: Retroperitoneal liposarcoma (RLPS) is a rare tumor with high recurrence rate. Ribonucleotide reductase small subunit M2 (RRM2) protein is essential for DNA synthesis and replication. Our previous study has demonstrated that RRM2 downregulation inhibited the proliferation of RLPS cells, but further association between RRM2 and RLPS and relevant mechanisms remains to be explored.
Methods: RRM2 expression was evaluated in RLPS tumor tissues and cell lines by using real-time PCR and immunohistochemical analysis. The effect of RRM2 downregulation on cell proliferation, apoptosis, cell cycle, cell migration and invasion was tested by lentivirus. The effect of RRM2 inhibition on tumor growth in vivo was assessed by using patient-derived tumor xenograft (PDX) of RLPS and RRM2 inhibitor. The underlying mechanisms of RRM2 in RLPS were explored by protein microarray and Western blotting.
Results: The results showed that RRM2 mRNA expression was higher in RLPS tissues than in normal fatty tissues (P< 0.001). RRM2 expression was higher in the dedifferentiated, myxoid/round cell, and pleomorphic subtypes (P=0.027), and it was also higher in the high-grade RLPS tissues compared to that in the low-grade RLPS tissues (P=0.004). There was no correlation between RRM2 expression and overall survival (OS) or disease-free survival (DFS) in this group of RLPS patients (P> 0.05). RRM2 downregulation inhibited cell proliferation, promoted cell apoptosis, facilitated cell cycle from G1 phase to S phase and inhibited cell migration and invasion. Inhibition of RRM2 suppressed tumor growth in NOD/SCID mice. Protein microarray and Western blot verification showed that activity of Akt/mammalian target of rapamycin/eukaryotic translation initiation factor 4E binding protein 1 (Akt/mTOR/4EBP1) pathway was downregulated along with RRM2 downregulation.
Conclusion: RRM2 was overexpressed in RLPS tissues, and downregulation of RRM2 could inhibit RLPS progression. In addition, suppression of RRM2 is expected to be a promising treatment for RLPS patients.
Keywords: retroperitoneal liposarcoma, ribonucleotide reductase small subunit M2, tumor progression, Akt/mTOR/4EBP1 pathway
Introduction
Retroperitoneal soft tissue sarcoma is a heterogeneous malignancy with an incidence of 0.5–1 per 100,000 residents, and liposarcoma is the most common subtype, accounting for 45% of retroperitoneal soft tissue sarcomas.1 Based on the morphological and genetic characteristics, retroperitoneal liposarcoma (RLPS) can be classified as four subtypes: well-differentiated liposarcoma (WDLPS), dedifferentiated liposarcoma (DDLPS), myxoid/round cell liposarcoma (MLPS), and pleomorphic liposarcoma (PLPS).2 WDLPS are low-grade tumors with more moderate behavior, whereas DDLPS, MLPS and PLPS are high-grade tumors with greater aggressiveness, recurrence and metastasis potential.3–5 At present, surgical resection is still the only method to cure RLPS; however, surgical resection cannot resolve the problem of local recurrence and often becomes not applicable for advanced-stage patients. In addition, different subtypes of liposarcoma have heterogeneous biological behaviors and inconsistent responses to radiotherapy and chemotherapy.6 Currently, clinical studies on targeted therapy of liposarcoma such as CDK4 inhibitor, MDM2 inhibitor and Exportin 1 inhibitor have not achieved ideal results.7–11 Therefore, it is urgent to figure out promising therapeutic targets.
The ribonucleotide reductase small subunit M2 (RRM2) protein is a key enzyme for the reduction of ribonucleotide diphosphate (NDP) to deoxyribonucleotide diphosphate (dNDP), so it is essential for DNA synthesis and replication.12 Zheng et al have shown that RRM2 overexpression played a key role in cell response to DNA damage, angiogenesis, tumor invasion and progression, and increased drug resistance in pancreatic cancer,13 and RRM2 overexpression could promote epithelial–mesenchymal transformation in prostate cancer cells14 and also could promote cervical carcinogenesis via ROS-ERK1/2-HIF-1α-VEGF by inducing angiogenesis.12 In addition, chimeric transcript RRM2-c2orf48 could promote metastasis and enhance resistance of chemotherapy in nasopharyngeal carcinoma.15 Till now, little is known about the role of RRM2 in RLPS. In our previous study, bioinformatics analysis of the GSE21122 dataset in the Gene Expression Omnibus (GEO) database has shown that RRM2 was overexpressed in liposarcoma (Table 1), and we also proved that RRM2 was highly expressed in RLPS cells . Moreover, RRM2 knockdown significantly reduced the proliferation capacity of RLPS cells.16
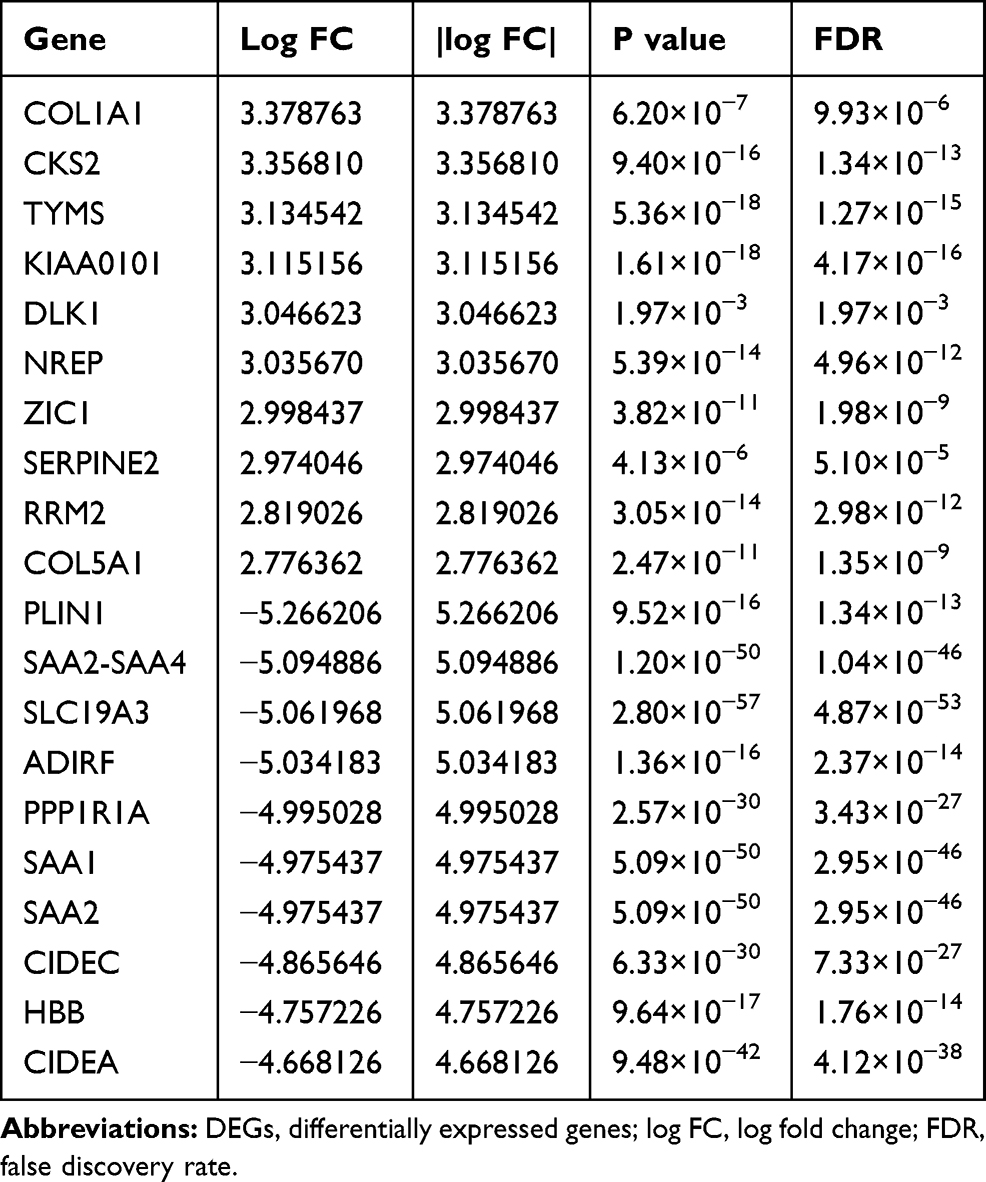 |
Table 1 Significant DEGs with the |log FC| at the Top of the List |
In this study, we aimed to further explore the role of RRM2 in RLPS. Our results showed that RRM2 expression was higher in RLPS tissues than in normal fatty (NF) tissues, and high-grade RLPS tissues had a higher RRM2 expression compared to low-grade RLPS tissues. Downregulation of RRM2 expression inhibited proliferation of RLPS cells, and RRM2 inhibitor could slow down the growth of RLPS patient-derived xenograft (PDX). In addition, RRM2 downregulation promoted apoptosis and cell cycle transformation from G1 to S phase, inhibited migration and invasion of RLPS cells. Moreover, knockdown of RRM2 downregulated the activity of the Akt/mammalian target of rapamycin/eukaryotic translation initiation factor 4E binding protein 1 (Akt/mTOR/4EBP1) pathway. Thus, this study showed an extraordinary role of RRM2 in RLPS.
Materials and Methods
Patients and Samples
Specimens of RLPS and NF tissues were obtained from patients who underwent surgery during 2015–2019 at the Peking University Cancer Hospital Sarcoma Center, Beijing, China. The detailed clinicopathological characteristics of the 94 RLPS patients for immunohistochemical analysis are shown in Table 2, seven of them were lost to follow-up, the median follow-up time was 33.6±3.2 months. A total of 21 RLPS tissues and 10 NF tissues (six men and four women, the mean age was 57.4±8.4 years old) were collected for quantitative real-time PCR. None of the patients received chemotherapy or radiotherapy before surgery. This study was approved by the Ethics Committee of Peking University Cancer Hospital (No. 2019KT19) and written informed consent was acquired from each participant.
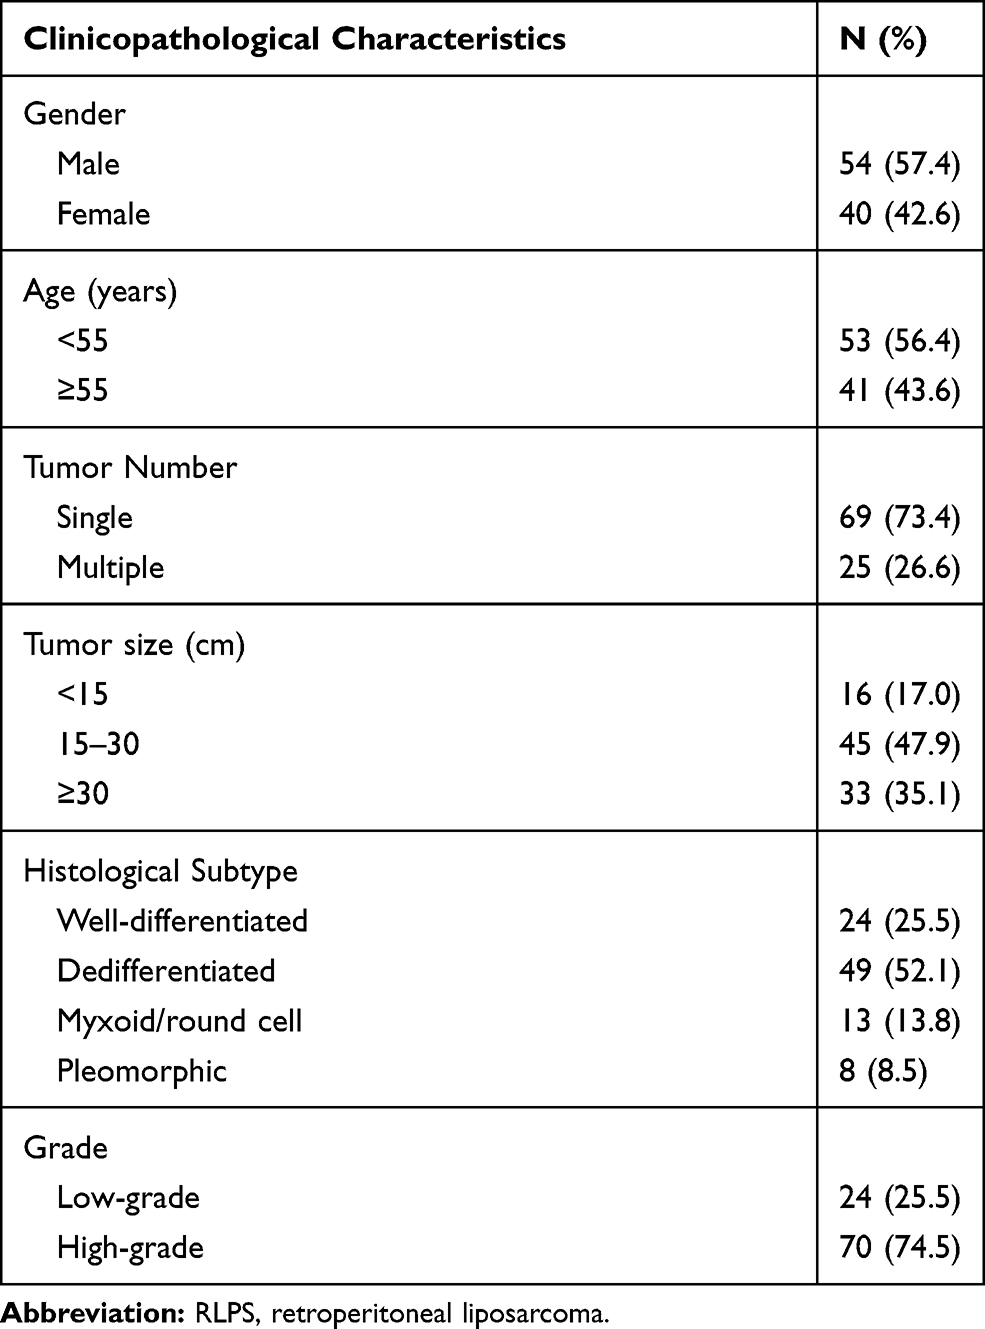 |
Table 2 Clinicopathological Characteristics of the 94 RLPS Patients |
Cell Lines and Cell Culture
The human RLPS cell lines 93T449, 94T778, and SW872 were purchased from ATCC (Manassas, VA, USA). These cell lines were cultured in 1640 RPMI (Gibco-BRL, Life Technologies, Grand Island, NY, USA) supplemented with 10% FBS, 100 μg/mL penicillin, and 100 μg/mL streptomycin. Cells were maintained at a humidified atmosphere of 37°C in a 5% CO2 incubator.
RNA Extraction, Reverse Transcription (RT-PCR) and Real-Time PCR
Total RNA of cells and tissues was extracted using TRIzol reagent (Invitrogen, Life Technologies, Carlsbad, CA, USA). Reverse transcription (RT-PCR) was conducted using 5X All-In One RT MasterMix kit (abm, Vancouver, Canada). Quantitative real-time PCR was performed on an ABI 7500 fast real-time PCR Detection System (Life Technologies) using EvaGreen 2X qPCR MasterMix kit (abm, Vancouver, Canada). Primers were designed with Primer 6.0 (ABI, Foster City, CA, USA) (Table S1). The relative mRNA expression was calculated and analyzed according to the 2−ΔΔCt formula using GAPDH as an internal reference gene for each sample.
Immunohistochemical Analysis
The slices were baked and then dewaxed in xylene and hydrated in gradient alcohol. The slices were incubated in 3% hydrogen peroxide to block the endogenous peroxidase activity. Antigen retrieval was conducted in 0.01 mol/L citrate buffer (pH=6.0) in a microwave. Goat serum (ZLI-9056, Beijing Zhongshan GoldenBridge Biotechnology Co., Ltd., Beijing, China) was used to block the slices. The slices were incubated with RRM2 antibody (1:800, ab57653, Abcam, Cambridge, MA, USA) and secondary antibody working fluid (PV-6000, Beijing Zhongshan Golden Bridge Biotechnology Co., Ltd., Beijing, China) respectively. The 3.3ʹ-Diaminobenzidine tetrahydrochloride (DAB, K5007, Dako, Glostrup, Denmark) containing hydrogen peroxide and the hematoxylin (HK100-9K, Biogenex, Fremont, CA, USA) were used to visualize the slices. Semi-quantitative classification of RRM2 staining was conducted by two pathologists independently who were blinded to the clinical data according to the percentage of positive cells (PP) and staining intensity (SI). The PP was scored as 0 (negative), 1 (<25%), 2 (25-75%), and 3 (>75%) while the staining intensity (SI) was scored as 0 (negative), 1 (weak), 2 (moderate), and 3 (strong). The immunoreactivity score (IRS) was defined as PP multiplied SI, while IRS=0 was considered “negative”, and IRS>0 was considered “positive”.
Western Blot Analysis
Total protein extracted from cells were separated by SDS-PAGE and then transferred onto polyvinylidene difluoride (PVDF) membranes. After incubated with a series of primary antibodies at 4°C overnight, the membranes were incubated with secondary antibody for 1 h at room temperature. Immobilon Western HRP Substrate Luminal Reagent (WBKLS0500, MILLIPORE, Billerica, MA, USA) and an enhanced chemiluminescence detection system (Amersham Imager 600, GE) were used to detect protein bands. All primary and secondary antibodies are listed in Table 3.
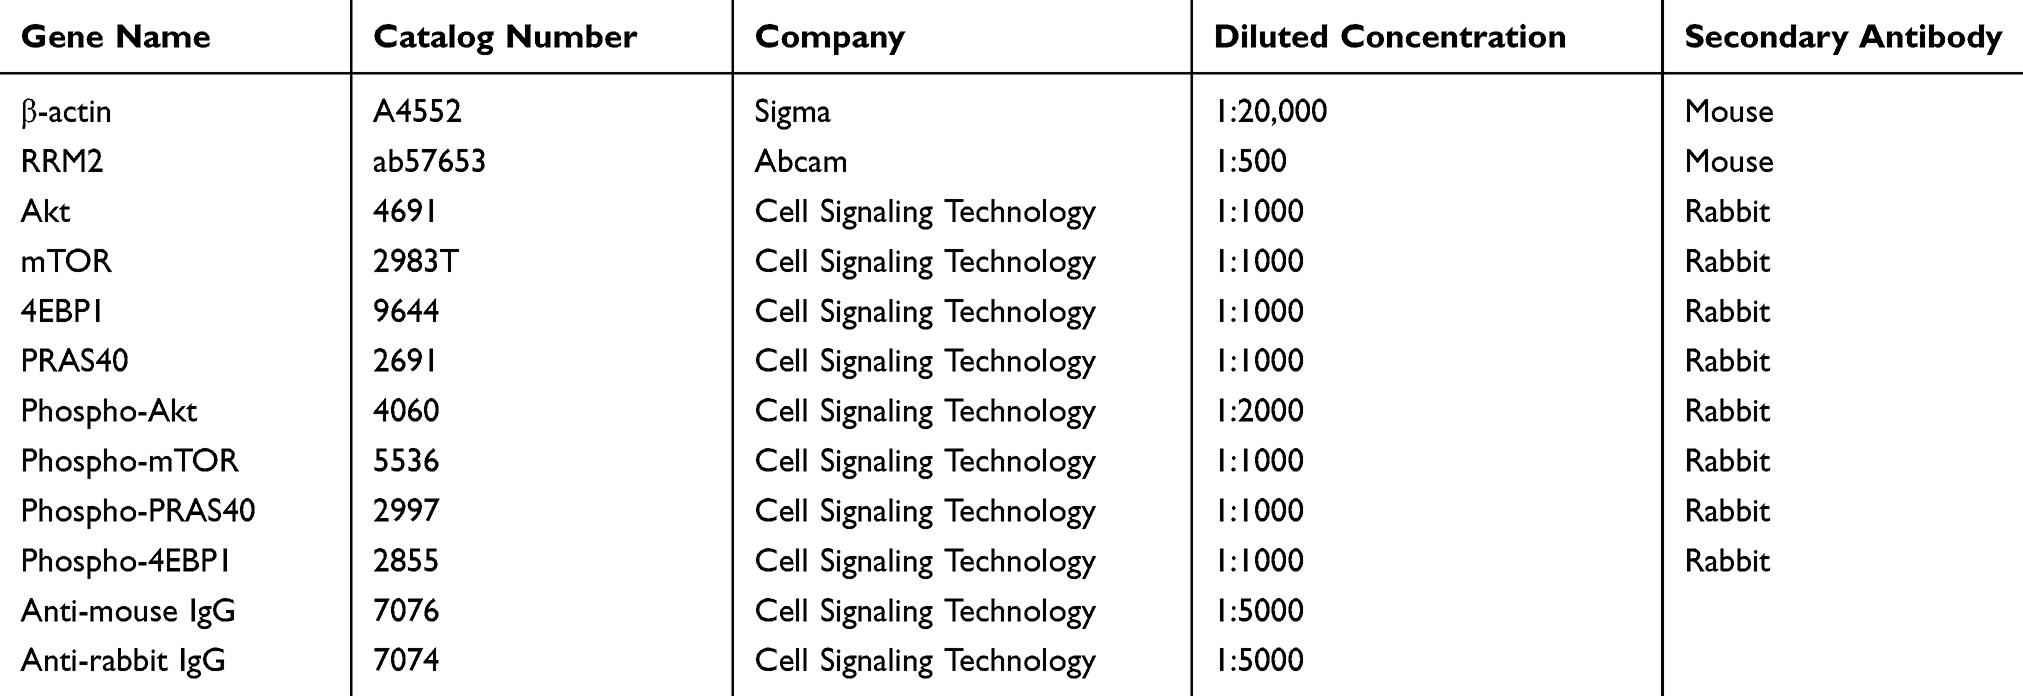 |
Table 3 The Information of Antibodies |
Immunofluorescence Staining
Cell lines were seeded on the glass coverslips (YA0351, Solarbio Life Sciences) for 24 h, then fixed with 4% paraformaldehyde (P1110, Solarbio Life Sciences, Beijing, China) and incubated with RRM2 antibody (1:500) overnight. After washing, the cells were incubated with the goat anti-mouse IgG-FITC conjugated antibody (1:100, ZF-0311, Beijing Zhongshan Golden Bridge Biotechnology Co., Ltd., Beijing, China), and the nucleus was stained with DAPI solution (0.5 μg/mL, D523, Dojindo, Kumamoto, Japan). Images were acquired through Multiphoton Laser Scanning Microscope.
Lentivirus-Mediated Short Hairpin RNA (Lenti-shRNA) Against RRM2
Lentivirus-mediated short hairpin RNA (Lenti-shRNA) against RRM2 was constructed, packaged and purified by GeneChem (Shanghai, China). Puromycin was used for screening stable transfected strains of 93T449 cells (1 μg/mL), 94T778 cells (1 μg/mL), and SW872 cells (2 μg/mL). The depletion efficiency was confirmed by real-time PCR and Western blot.
Cell Proliferation Assay
The CCK-8 (Dojindo, Kumamoto, Japan) assay was conducted to evaluate cell proliferation. Absorbance value (OD) at 450 nm was measured using a microplate reader (iMark, Bio-Rad Laboratories, Hercules, CA, USA).
Colony Formation Assay
Cells were plated in 6-well plates at a density of 300 cells per well. The cells were cultured at 37°C for 3 weeks, and then colonies were fixed with 4% paraformaldehyde and stained with 0.1% crystal violet (G1063, Solarbio Life Sciences, Beijing, China). The number of colonies was photographed and counted using colony count software.
TUNEL Assay for Cell Apoptosis Analysis
Cells were cultured on the slides for 24 h, then fixed with 4% paraformaldehyde and incubated with the reagents in the TUNEL cell apoptosis assay kit (T2190, Solarbio Life Sciences, Beijing, China) according to the manufacturer’s instructions. The nucleus was stained with DAPI solution (0.5 μg/mL, D523, Dojindo, Kumamoto, Japan). Images were acquired through Multiphoton Laser Scanning Microscope.
Cell Cycle Analysis
Cells were harvested with trypsin and washed with PBS, and then fixed overnight at 4°C with 75% ice-cold ethanol. The fixed cells were washed with PBS and incubated in dark conditions with 300–500 μL PI/RNase Staining Buffer (550825, BD Pharmingen, San Diego, CA) for 15 min. BD Accuri C6 flow cytometry was used for cell cycle analysis.
Migration and Invasion Assays
The chamber (migration assay, 3422; invasion assay, 354480, Corning Costar, Cambridge, MA, USA) was hydrated in serum-free medium for at least 2 h at 37°C. Cells mixed in a serum-free medium with a total volume of 200 µL for migration and 500 µL for invasion were inoculated in the upper compartment of the chamber. About 500 µL RPMI 1640 medium containing 20% FBS was added in the lower compartment of the chamber. After 24 h incubation for migration and 48 h for invasion, the cells underside the filter were fixed with 4% paraformaldehyde and stained with 0.1% crystal violet. The stained cells were photographed in five randomly selected microscope fields, and the number of cells was calculated by the Image J software.
The Construction of NOD/SCID Mice Subcutaneous Xenograft Model and RRM2 Inhibitor Therapy
Patient-derived xenograft (PDX) of RLPS was implanted subcutaneously into the right dorsal flanks of the female NOD/SCID mice weighing 18–19g. Tumor volumes were measured twice a week and calculated according to the formula V = (L×W2)/2, in which L represented the long and W represented the short diameter of the tumor. RRM2 inhibitor 3-Aminopyridine-2-carboxaldehyde thiosemicarbazone (3-AP) (5mg/kg) (S7470, Selleck Chemicals, Houston, TX) and 4% DMSO for experimental group and control group, respectively, were administered on the 1st, 5th, 9th, 13th, 17th and 21th days. The mice were sacrificed after 30 days. The animal experiments were approved by the Committee on the Ethics of Animal Experiments of Peking University of Oncology (Permit Number EAEC2018-06), and the animal experiments were performed in accordance with the standard guidelines for the Care and Use of Laboratory Animals of Peking University Cancer Hospital.
Protein Microarray Analysis
Proteome Profiler TM Array—Human Phospho-Kinase Array Kit (ARY003B, R&D Systems, Minneapolis, MN) was used to conduct protein microarray analysis in accordance with the manufacturer’s instructions.
Statistical Analysis
Two-tailed chi-square (χ2) test and Fisher’s exact test were used to evaluate the relationship between RRM2 expression and clinicopathological characteristics of RLPS patients. Kaplan–Meier survival method and log-rank test were used to conduct survival analysis. Independent Samples t- test was performed when comparing two groups of quantitative data and results were presented as mean ± SD. Data analysis was performed using SPSS 20.0 software (SPSS Inc., Chicago, IL, USA) and GraphPad Prism 7.0 software (San Diego, CA). P<0.05 was considered statistically significant.
Results
Expression of RRM2 in RLPS Tissues
RRM2 mRNA expression was assessed in 21 RLPS tissues and 10 NF tissues by real-time PCR. As shown in Figure 1A, relative mRNA expression of RRM2 was notably higher in RLPS tissues than in NF tissues (P<0.001).
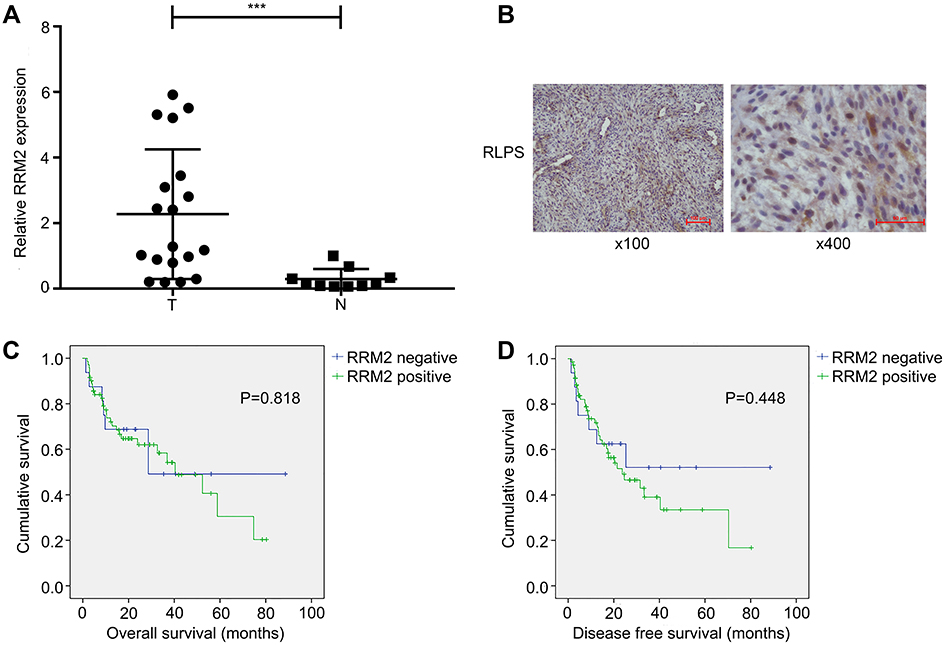 |
Figure 1 RRM2 expression in RLPS tissues. (A) RRM2 mRNA expression in 21 RLPS tissues and 10 normal fatty tissues was assessed by real-time PCR. Relative mRNA expression of RRM2 was notably higher in RLPS tissues than in normal fatty tissues (***P<0.001). T denotes RLPS tissues and N denotes normal fatty tissues. (B) Representative images of RRM2 expression in RLPS tissues. RRM2 protein was predominantly localized in the cytoplasm (magnification: left, ×100; right, ×400). (C and D) RRM2 expression was not related to overall survival (OS) or disease-free survival (DFS) of RLPS patients (for OS, P=0.818; for DFS, P=0.448). |
Moreover, of the 94 cases in the immunohistochemical assay, RRM2 was expressed in 78 of the 94 RLPS tissues (83%) and it was predominantly expressed in the cytoplasm (Figure 1B).
Correlation of RRM2 Expression with Clinicopathological Characteristics and Survival of RLPS Patients
As shown in Table 4, RRM2 was expressed in 62.5% (15/24), 87.8% (43/49), 92.3% (12/13), and 100.0% (8/8) of well-differentiated, dedifferentiated, myxoid/round cell, and pleomorphic RLPS subtypes, respectively (P=0.027). RRM2 expression was obviously higher in patients with high-grade RLPS compared to patients with low-grade RLPS (low-grade vs high-grade: 62.5% vs 90.0%, P=0.004).
 |
Table 4 Correlation Between RRM2 Expression and Clinicopathological Characteristics of RLPS Patients |
In the survival analysis, the median overall survival (OS) time was 42.50±4.75 months in RRM2-positive patients and 51.06±10.33 months in RRM2-negative patients, while the median disease-free survival (DFS) time was 35.92±4.64 months in RRM2-positive patients and 50.84±10.64 months in RRM2-negative patients. Though we can see that RLPS patients with positive RRM2 expression tended to have a poorer survival, we did not find a correlation between RRM2 expression and OS or DFS of RLPS patients (Figure 1C and D, for OS, P=0.818; for DFS, P=0.448).
Expression of RRM2 in RLPS Cell Lines
RRM2 protein expression was evaluated in three human RLPS cell lines (93T449, 94T778, SW872) by Western blot. As shown in Figure 2A, the RRM2 protein level was considerably high in all three RLPS cell lines. RRM2 was localized in the cytoplasm according to immunofluorescence results (Figure 2B), which was consistent with the IHC results. Therefore, we selected all three cell lines for subsequent experiments.
 |
Figure 2 RRM2 expression and localization in RLPS cell lines. (A) RRM2 protein expression was evaluated by Western blot in three RLPS cell lines. The RRM2 protein level was considerably high in all three RLPS cell lines. (B) The localization of RRM2 protein was detected using immunofluorescence. It was localized in the cytoplasm in all three human RLPS cell lines, which was consistent with IHC results. |
RRM2 Downregulation Inhibits Proliferation and Promotes Apoptosis of RLPS Cells
To investigate the role of RRM2 in RLPS cells, 93T449, 94T778 and SW872 cells were transfected with lentivirus-mediated RRM2 shRNA (Lenti-shRRM2-1 and Lenti-shRRM2-2), and lentiviral vectors containing non-silencing shRNA (Lenti-shCtrl) was used as control. Transfection efficiency was confirmed as shown in Figure 3A and B. CCK-8 assay demonstrated that Lenti-shRRM2 cells had a slower proliferation rate (Figure 4A, P<0.01) and a fewer colony formation number (Figure 4B and C, P<0.01) compared with Lenti-shCtrl cells. Furthermore, TUNEL analysis showed that Lenti-shRRM2 cells had more apoptotic cells than Lenti-shCtrl cells (Figure 5).
 |
Figure 3 RRM2 knockdown was verified by real-time PCR and Western blot. Control cells were transfected with lentiviral vectors containing non-silencing shRNA (Lenti-shCtrl), and experimental cells were transfected with lentivirus-mediated RRM2 shRNA (Lenti-shRRM2-1 and Lenti-shRRM2-2). (A) RRM2 mRNA expression in Lenti-shRRM2 cells was significantly lower than in Lenti-shCtrl cells of 93T449, 94T778, and SW872 cells using real-time PCR (**P<0.01). (B) The downregulation of RRM2 protein expression was confirmed by Western blot. |
 |
Figure 4 Downregulation of RRM2 inhibited the proliferation of RLPS cells. (A) The results of CCK-8 assay showed that the downregulation of RRM2 inhibited RLPS cell proliferation significantly in 93T449, 94T778, and SW872 cells (***P<0.001, **P<0.01). (B) and (C) Knockdown of RRM2 expression reduced colony-forming capacity of the three cell lines (***P<0.001, **P<0.01). |
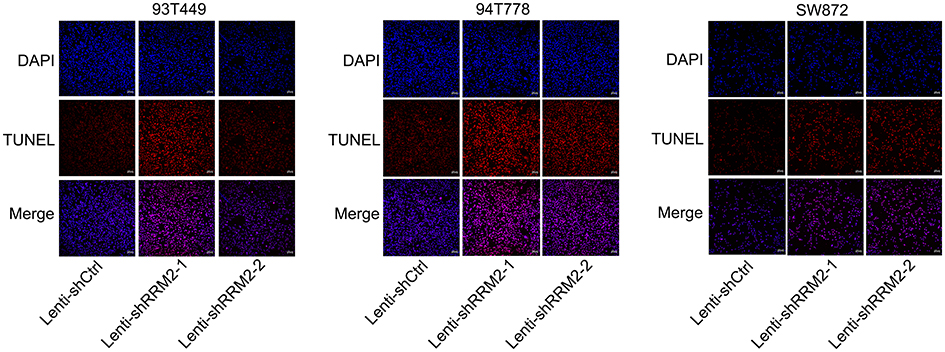 |
Figure 5 RRM2 downregulation promoted apoptosis of RLPS cells. This was conducted by using TUNEL assay. The nuclei were counterstained with DAPI. Lenti-shRRM2 cells produced more apoptotic cells compared with Lenti-shCtrl cells. |
Knockdown of RRM2 Promotes Cell Cycle from G1 to S Phase
Flow cytometry analysis showed that RRM2 knockdown promoted cell cycle from G1 to S phase. As shown in Figure 6A and B, in 93T449 cells, the number of G1 phase cells decreased significantly, from 88.47±0.29% in Lenti-shCtrl cells to 71.04±0.08% and 69.81±0.61% in Lenti-shRRM2-1 (P<0.001) and Lenti-shRRM2-2 cells (P<0.001) respectively, and meanwhile, the cells of S phase increased significantly. Similar results were observed in 94T778 and SW872 cells. These results indicated that RRM2 downregulation arrested the cell cycle of RLPS cells at S phase.
 |
Figure 6 RRM2 knockdown promoted cells from G1 to S phase. (A) Cell cycle analysis showed that the number of G1 phase cells decreased and the number of S phase cells increased significantly in Lenti-shRRM2 cells compared with control cells. (B) We further analyzed the difference statistically and expressed it as mean ± SD. In 93T449 cells, the number of G1 phase cells decreased significantly from 88.47±0.29% in Lenti-shCtrl cells to 71.04±0.08% and 69.81±0.61% in Lenti-shRRM2-1 (***P<0.001) and Lenti-shRRM2-2 (***P<0.001) cells, respectively, the number of S phase cells increased significantly from 10.17±0.85% in Lenti-shCtrl cells to 19.19±0.48% and 20.12±1.49% in Lenti-shRRM2-1 (***P<0.001) and Lenti-shRRM2-2 (**P<0.01) cells, respectively; In 94T778, the number of G1 phase cells decreased significantly from 87.25±0.41% in Lenti-shCtrl cells to 85.17±0.62% and 82.14±0.49% in Lenti-shRRM2-1 (*P<0.05) and Lenti-shRRM2-2 (***P<0.001) cells, respectively, the number of S phase cells increased significantly from 7.34±0.06% in Lenti-shCtrl cells 9.92±0.42% and 10.78±0.54% in Lenti-shRRM2-1 (**P<0.01) and Lenti-shRRM2-2 (**P<0.01) cells, respectively; In SW872, the number of G1 phase cells decreased significantly from 89.37±0.37% in Lenti-shCtrl cells to 85.89±0.18% and 85.97±1.35% in Lenti-shRRM2-1 (**P<0.01) and Lenti-shRRM2-2 (*P<0.05) cells, respectively, the number of S phase cells increased significantly from 6.65±0.88% in Lenti-shCtrl cells to 11.20±0.34% and 10.33±1.82% in Lenti-shRRM2-1 (***P<0.001) and Lenti-shRRM2-2 cells, respectively (**P<0.01). |
Downregulation of RRM2 Inhibits Migration and Invasion Ability of RLPS Cells
We used transwell assays to investigate the effect of RRM2 expression on cell migration and invasion ability. As shown in Figure 7A–D, there were fewer cells underside the chamber in the Lenti-shRRM2 group compared with the Lenti-shCtrl group. As for 93T449 cells, the number of migration cells per field was 215±66 in Lenti-shRRM2-1 group (***P<0.001) and 220±18 in Lenti-shRRM2-2 group (***P<0.001) vs 1254±27 in control group. Similarly, the number of invasion cells per field was 216±65 in Lenti-shRRM2-1 group (***P<0.001) and 232±61 in Lenti-shRRM2-2 group (***P<0.001) vs 553±89 in control group. RRM2 knockdown markedly inhibited both migration and invasion ability of RLPS cells. The results revealed that RRM2 downregulation might inhibit RLPS progression.
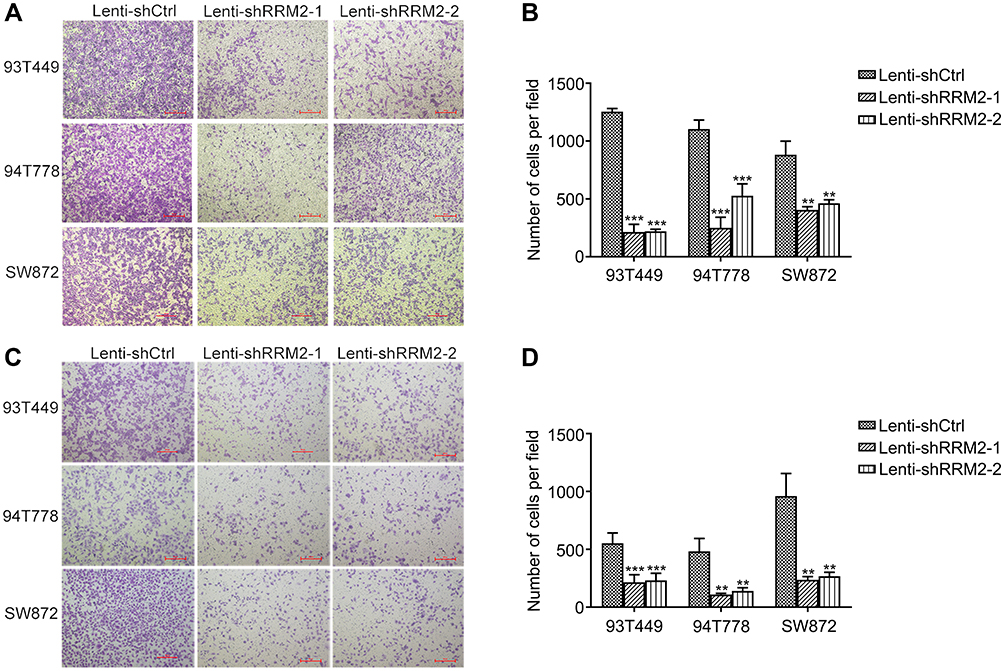 |
Figure 7 RRM2 downregulation inhibited the migration and invasion ability of RLPS cells. Both migration and invasion ability were tested by transwell assay. The cells in five randomly selected microscope fields were counted and statistically analyzed. (A and B) The number of migration cells per field was 215±66 in Lenti-shRRM2-1 cells (***P<0.001) and 220±18 in Lenti-shRRM2-2 cells (***P<0.001) vs 1254±27 in control cells in 93T449 cells, the number of migration cells per field was 251±91 in Lenti-shRRM2-1 (***P<0.001) cells and 528±103 in Lenti-shRRM2-2 cells (***P<0.001) vs 1104±78 in control cells in 94T778 cells, the number of migration cells per field was 406±27 in Lenti-shRRM2-1 (**P<0.01) cells and 463±30 in Lenti-shRRM2-2 cells (**P<0.01) vs 882±117 in control cells in SW872 cells. (C and D) The number of invasion cells per field was 216±65 in Lenti-shRRM2-1 cells (***P<0.001) and 232±61 in Lenti-shRRM2-2 cells (***P<0.001) vs 553±89 in control cells in 93T449 cells, the number of invasion cells per field was 109±11 in Lenti-shRRM2-1 cells (**P<0.01) and 140±28 in Lenti-shRRM2-2 cells (**P<0.01) vs 483±112 in control cells in 94T778 cells, the number of invasion cells per field was 237±27 in Lenti-shRRM2-1 cells (**P<0.01) and 268±33 in Lenti-shRRM2-2 cells (**P<0.01) vs 961±195 in control cells in SW872 cells. |
The Histological Characteristics and RRM2 Expression of PDX Were Consistent with the Primary RLPS Tissue of the Patient
The primary RLPS tissue was from a 59-year-old female patient with DDLPS, and we used it to construct the PDX model. From the HE staining and IHC results, we can see that the PDX model was consistent with the primary tumor tissue and RRM2 expression was observed in the primary RLPS tissue of the patient and the PDX model (Figure 8A and B). Therefore, the PDX model can be used in subsequent RRM2 inhibitor therapy experiment to explore the potential effect of RRM2 inhibition on the growth of transplanted tumors.
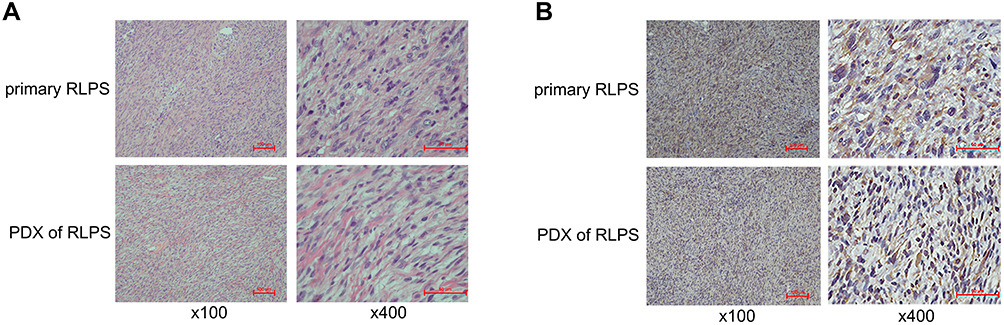 |
Figure 8 Hematoxylin-eosin (HE) staining and RRM2 expression in primary RLPS tissue of the patient and patient-derived xenograft (PDX). (A) The histological features of the PDX were consistent with the primary RLPS tissue of the patient. (B) RRM2 expression was found in the primary RLPS tissue of the patient and the PDX. |
Inhibitor of RRM2 Slows Down Tumor Growth in NOD/SCID Mice
As we found that downregulation of RRM2 significantly inhibited proliferation of RLPS cells, we further evaluated the effect of RRM2 inhibitor 3-AP on tumor growth in NOD/SCID mice. Five mice in each group were inoculated with PDX of RLPS, and 3-AP (5mg/kg) and 4% DMSO were given in the experimental group and control group, respectively. The results showed that mice treated with 3-AP had a slower PDX growth rate than mice treated with 4% DMSO, which was consistent with the in vitro results (Figure 9A and B, P<0.01). There was no death or significant weight loss of mice in 3-AP group or 4% DMSO group (Figure 9C).
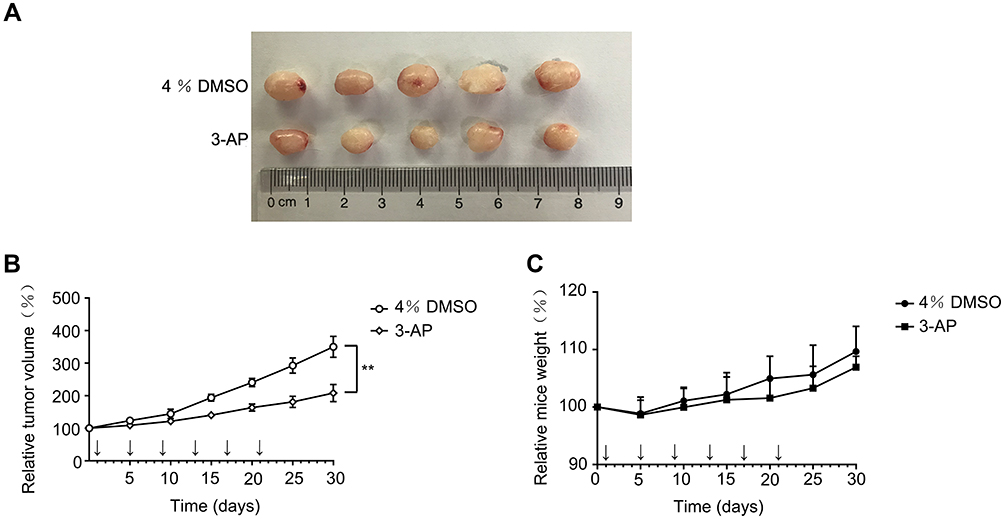 |
Figure 9 Inhibitor of RRM2 slowed down tumor growth in vivo. (A) PDX treated with RRM2 inhibitor 3-AP (lower row) were smaller than PDX treated with 4% DMSO (upper row). (B) Mice treated with RRM2 inhibitor 3-AP had a slower PDX growth rate than mice treated with 4% DMSO (**P<0.01). 3-AP (5mg/kg) and 4% DMSO for experimental group and control group, respectively, were administered on the 1st, 5th, 9th, 13th, 17th and 21th days. (C) Neither the 4% DMSO group nor the 3-AP group showed significant weight loss. |
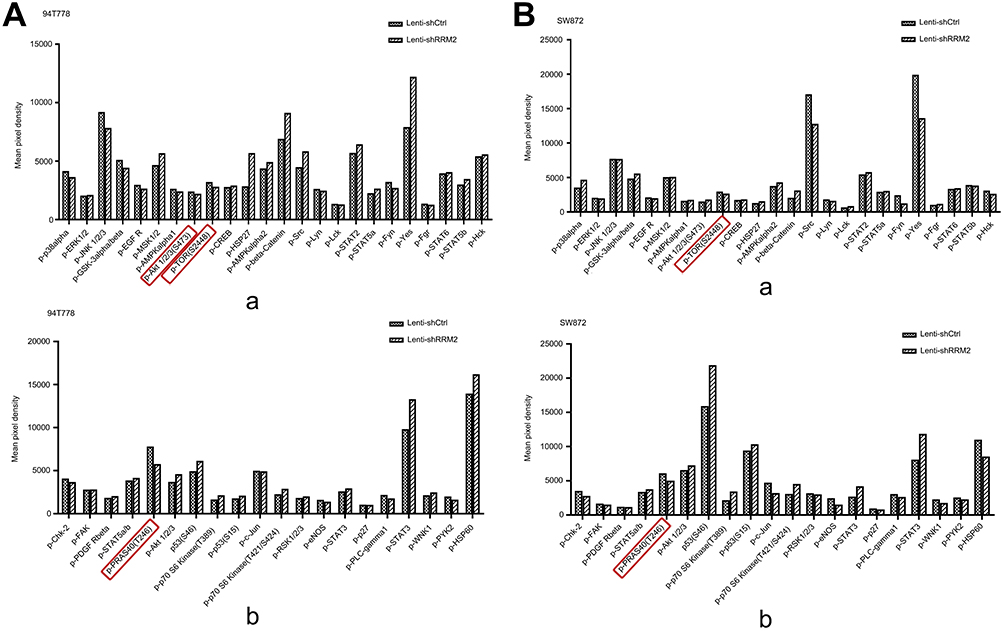 |
Figure 10 The results of protein microarray analysis. This assay was conducted by using protein microarray analysis. The results are shown in (A) 94T778 cells and (B) SW872 cells. The downregulation of phospho-Akt (Ser473), phospho-mTOR (Ser2448) and phospho-PRAS40 (Thr246) in Lenti-shRRM2 cells of 94T778 and the downregulation of phospho-mTOR (Ser2448) and phospho-PRAS40 (Thr246) in Lenti-shRRM2 cells of SW872 were detected (marked by red frame). |
Akt/mTOR/4EBP1 Signaling Is Suppressed in RLPS Cells in Response to RRM2 Downregulation
From the above results, we can see that RRM2 played an important role in the progression of PLPS, but the involved mechanism is still unclear. Therefore, protein microarray analysis was used to explore the possible mechanisms of RRM2 in the progression of PLPS. The results showed the downregulation of phospho-Akt (Ser473), phospho-mTOR (Ser2448) and phospho-proline-rich Akt substrate of 40 kDa (Thr246) (phospho-PRAS40 (Thr246)) and the up-regulation phosphor-p70 ribosomal protein S6 kinase (T421/S424) (phospho-p70-S6K (T421/S424)) in Lenti-shRRM2 cells compared with Lenti-shCtrl cells (Figure 10Aa, b and 10Ba, b). Due to the downregulation of phospho-PRAS40 (Thr246) and the up-regulation of phospho-p70-S6K (T421/S424), we speculated that RRM2 knockdown might suppress the activity of Akt/mTOR/4EBP1 pathway rather than Akt/mTOR/p70-S6K pathway. Therefore, we used Western blot to test the expression level of major proteins involved in the Akt/mTOR/4EBP1 signaling pathway, including the total proteins of Akt, mTOR, 4EBP1 and the corresponding phosphorylated proteins. The expression level of PRAS40 and phospho-PRAS40 was also detected. The results showed that the expression of phosphorylated Akt, mTOR, 4EBP1 and PRAS40 was downregulated in Lenti-shRRM2 cells, which was consistent with the results of protein microarray analysis (Figure 11). These results indicated that RRM2 downregulation could suppress the activity of the Akt/mTOR/4EBP1 signaling in RLPS cells, thereby inhibiting the progression of RLPS.
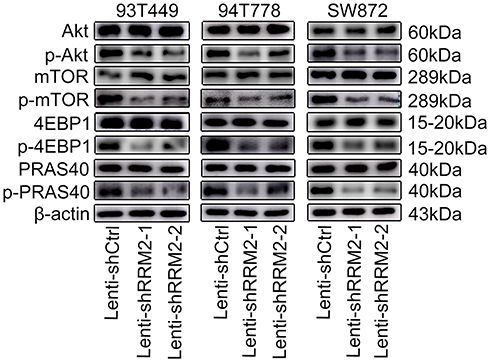 |
Figure 11 RRM2 knockdown downregulated activity of the Akt/mTOR/4EBP1 signaling in RLPS cells. Western blot assay showed that phospho-Akt (Ser473), phospho-mTOR (Ser2448), phospho-PRAS40 (Thr246) and phospho-4EBP1 (Thr37/46) were downregulated in Lenti-shRRM2 cells compared with control cells. |
Discussion
RLPS is a rare tumor with an estimated 2 to 5 new cases per million inhabitants per year.17 For patients with retroperitoneal liposarcoma, surgical resection remains the most recommended treatment when feasible. Local recurrence often occurs even after complete excision.18 In addition, this kind of tumor is insensitive to chemoradiotherapy. Therefore, it is particularly important to find effective therapeutic targets and carry out combined treatment. In our previous study, we compared the mRNA expression profiles between LPS and NF samples of GSE21122 dataset in the GEO database and found that RRM2 was highly expressed in liposarcoma tissues. Real-time PCR showed that RRM2 was also highly expressed in RLPS cells. In addition, high content screening (HCS) demonstrated that RRM2 knockdown could inhibit proliferation of RLPS cells, so we intended to explore the role of this gene extensively in RLPS.
Liu et al showed a tendency of shorter OS and progress-free survival (PFS) in colorectal cancer patients with RRM2 overexpression.19 Pathway-centric integrative analysis revealed that RRM2 was a prognostic marker of breast cancer and high RRM2 expression was associated with poor distant metastasis-free survival (DMFS).20 In addition, overexpression of RRM2 could promote the invasiveness of gastric cancer cell via Akt/NF-κB signaling pathway.21 Combined with our previous results, we can see that RRM2 is of great research value in RLPS.
In this study, RRM2 mRNA expression was notably higher in RLPS tissues than in NF tissues. The IHC results showed that RRM2 protein was expressed in most samples (83.0%). In addition, in dedifferentiated, myxoid/round cell and pleomorphic subtypes which are considered as high grade with worse clinical behaviors, RRM2 expression was significantly higher. RRM2-positive patients had a shorter median OS and DFS than RRM2-negative patients; however, survival analysis showed no significant correlation between RRM2 expression and survival (OS and DFS) of RLPS patients (for OS, P=0.818; for DFS, P=0.448). Survival analysis for RRM2 and sarcoma in the Gene Expression Profiling Interactive Analysis (GEPIA) database (http://gepia.cancer-pku.cn/?from=timeline&isappinstalled=0) showed that sarcoma patients with RRM2-positive expression have a poorer survival (OS and DFS) than those with RRM2-negative expression (for OS, P=0.04; for DFS, P=0.0098) ( Figure S1A and B). In this study, RRM2 expression was not significantly related to the survival of RLPS patients, possibly due to the short follow-up time of some patients. We will continue to follow up and renew the survival data in future research.
Studies have reported that downregulation or inhibition of RRM2 could inhibit cell proliferation, such as in lung squamous cell carcinoma,22 colorectal cancer,19 gastric adenocarcinoma,23 and pancreatic cancer.13 Consistent with these studies, our results also showed that downregulation of RRM2 could inhibit the proliferation of RLPS cells in vitro.
Zheng et al showed that RRM2 downregulation could induce cell cycle arrest at S phase in pancreatic cell, resulting in the reduction of cell colony accumulation formation,13 and another study revealed that RRM2 inhibition could decrease migration and invasion property of breast cancer cells.24 These were consistent with our findings that downregulation of RRM2 promoted the cell cycle transition from G1 to S phase and suppressed the migration and invasion ability of RLPS cells (Figures 6 and 7). These results revealed that RRM2 downregulation may slow down RLPS progression.
Based on the in-vitro findings that downregulation of RRM2 inhibited RLPS progression, we further tested the effect of RRM2 inhibition on RLPS growth by using RRM2 inhibitors in PDX models of RLPS. 3-AP is a RRM2-specific inhibitor,25 and it has been reported that the combination of 3-AP with agents that can damage DNA could result in synergistic inhibition of L1210 leukemia cells.26 In this study, we evaluated the effect of RRM2 inhibition on tumor growth by using 3-AP. Consistent with the effect of RRM2 knockdown, 3-AP could suppress the growth of RLPS PDX in mice. It is hoped that this exploration will provide a new direction for target therapy of RLPS.
Activation of intracellular signals is an important factor for tumor development and progression. Kyoto Encyclopedia of Genes and Genomes (KEGG) pathway enrichment analysis of upregulated differentially expressed genes (DEGs) (DEGs were obtained from GSE21122 dataset in GEO database through bioinformatics analysis)16 revealed that RRM2 was related to p53 signaling pathway in LPS (Table S2). In order to further explore the mechanism of RRM2 downregulation in the progression of PLPS, we carried out protein microarray analysis. We found the downregulation of phospho-Akt (Ser473), phospho-mTOR (Ser2448) and phospho-PRAS40 (Thr246) after RRM2 downregulation through the protein microarray analysis. PRAS40 is not only a substrate for Akt, but also a component of mTOR complex 1 (mTORC1), which connects Akt to the mTOR pathway.27 We inferred that the changes in biological behaviors after RRM2 downregulation may be related to Akt/mTORC1 signaling pathway. What is more, p70-S6K and 4EBP1 are two major downstream effectors of mTORC1. According to the protein microarray analysis, downregulation of RRM2 resulted in upregulation of phospho-p70-S6K in both 94T778 and SW872 cells, so it is not regulated through the Akt/mTOR/p70-S6K pathway. On the other hand, 4EBP1 binds to the eukaryotic translation initiation factor 4E (EIF4E) to prevent the formation of the translation initiation complex, mTOR phosphorylates 4EBP1 to separate it from EIF4E, thereby forming the translation initiation complex.28 Therefore, we can further deduce that the changes in biological behaviors after RRM2 downregulation may be connected to Akt/mTORC1/4EBP1 signaling pathway. This speculation was further verified by Western blot (Figure 11). Similar to our study, it was previously reported that scutellarin suppressed cell proliferation and promoted apoptosis in lung adenocarcinoma cells via AKT/mTOR/4EBP1 pathway.29 In addition, by regulating Akt/mTOR/4EBP1 and other signaling pathways, salvianolic acid B protected endothelial progenitor cells from oxidative stress-mediated dysfunction.30
To our best knowledge, this is the first study to explore the effect of RRM2 expression on RLPS in vitro and in vivo. And the present study has demonstrated that RRM2 downregulation might inhibit RLPS progression through downregulating the activity of Akt/mTOR/4EBP1 signaling pathway. In the future studies, we will explore the extensive mechanisms of RRM2 on RLPS.
Conclusion
We found that RRM2 inhibition may attenuate RLPS progression through downregulating the Akt/mTOR/4EBP1 pathway. In addition, RRM2 could be used as a potential effective therapeutic target for RLPS patients.
Abbreviations
3-AP, 3-aminopyridine-2-carboxaldehyde thiosemicarbazone; DEG, differentially expressed gene; DFS, disease-free survival; dNDP, deoxyribonucleotide diphosphate; 4EBP1, eukaryotic translation initiation factor 4E binding protein 1; GEO, Gene Expression Omnibus; HCS, high content screening; Lenti-shRNA, lentivirus-mediated short hairpin RNA; mTOR, mammalian target of rapamycin; NDP, ribonucleotide diphosphate; NF, normal fatty; OS, overall survival; PDX, patient-derived xenograft; PRAS40, phospho-proline-rich Akt substrate of 40 kDa; p70-S6K, p70 ribosomal protein S6 kinase; RLPS, retroperitoneal liposarcoma; RRM2, ribonucleotide reductase small subunit M2.
Data Sharing Statement
The data supporting the results are available from the corresponding author on reasonable request.
Disclosure
The authors report no conflicts of interest in this work.
References
1. Yan L, Wang Z, Cui C, et al. Comprehensive immune characterization and T-cell receptor repertoire heterogeneity of retroperitoneal liposarcoma. Cancer Sci. 2019;110(10):3038–3048. doi:10.1111/cas.14161
2. Casadei L, Calore F, Creighton CJ, et al. Exosome-derived miR-25-3p and miR-92a-3p stimulate liposarcoma progression. Cancer Res. 2017;77(14):3846–3856. doi:10.1158/0008-5472.CAN-16-2984
3. Mazzu YZ, Hu Y, Soni RK, et al. miR-193b-regulated signaling networks serve as tumor suppressors in liposarcoma and promote adipogenesis in adipose-derived stem cells. Cancer Res. 2017;77(21):5728–5740. doi:10.1158/0008-5472.CAN-16-2253
4. Dei Tos AP. Liposarcomas: diagnostic pitfalls and new insights. Histopathology. 2014;64(1):38–52. doi:10.1111/his.12311
5. Dodd LG, Sara Jiang X, Rao K, Bui MM. Pleomorphic liposarcoma: a cytologic study of five cases. Diagn Cytopathol. 2015;43(2):138–143. doi:10.1002/dc.23148
6. Cananzi FCM, Ruspi L, Sicoli F, Minerva EM, Quagliuolo V. Did outcomes improve in retroperitoneal sarcoma surgery? Surg Oncol. 2019;28:96–102. doi:10.1016/j.suronc.2018.11.004
7. Ray-Coquard I, Blay JY, Italiano A, et al. Effect of the MDM2 antagonist RG7112 on the P53 pathway in patients with MDM2-amplified, well-differentiated or dedifferentiated liposarcoma: an exploratory proof-of-mechanism study. Lancet Oncol. 2012;13(11):1133–1140. doi:10.1016/S1470-2045(12)70474-6
8. Wagner AJ, Banerji U, Mahipal A, et al. Phase I trial of the human double minute 2 inhibitor MK-8242 in patients with advanced solid tumors. J Clinical Oncol. 2017;35(12):1304–1311. doi:10.1200/JCO.2016.70.7117
9. Dickson MA, Schwartz GK, Keohan ML, et al. Progression-free survival among patients with well-differentiated or dedifferentiated liposarcoma treated with CDK4 inhibitor palbociclib: a Phase 2 clinical trial. JAMA Oncol. 2016;2(7):937–940. doi:10.1001/jamaoncol.2016.0264
10. Infante JR, Cassier PA, Gerecitano JF, et al. A Phase I study of the cyclin-dependent kinase 4/6 inhibitor ribociclib (LEE011) in patients with advanced solid tumors and lymphomas. Clin Cancer Res. 2016;22(23):5696–5705. doi:10.1158/1078-0432.CCR-16-1248
11. Gounder MM, Zer A, Tap WD, et al. Phase IB study of selinexor, a first-in-class inhibitor of nuclear export, in patients with advanced refractory bone or soft tissue sarcoma. J Clinical Oncol. 2016;34(26):3166–3174. doi:10.1200/JCO.2016.67.6346
12. Wang N, Zhan T, Ke T, et al. Increased expression of RRM2 by human papillomavirus E7 oncoprotein promotes angiogenesis in cervical cancer. Br J Cancer. 2014;110(4):1034–1044. doi:10.1038/bjc.2013.817
13. Zheng S, Wang X, Weng YH, et al. siRNA knockdown of RRM2 effectively suppressed pancreatic tumor growth alone or synergistically with doxorubicin. Mol Ther Nucleic Acids. 2018;12:805–816. doi:10.1016/j.omtn.2018.08.003
14. Mazzu YZ, Armenia J, Chakraborty G, et al. A novel mechanism driving poor-prognosis prostate cancer: overexpression of the DNA repair gene, ribonucleotide reductase small subunit M2 (RRM2). Clin Cancer Res. 2019;25(14):4480–4492. doi:10.1158/1078-0432.CCR-18-4046
15. Han P, Chen RH, Wang F, et al. Novel chimeric transcript RRM2-c2orf48 promotes metastasis in nasopharyngeal carcinoma. Cell Death Dis. 2017;8(9):e3047. doi:10.1038/cddis.2017.402
16. Zhang S, Yan L, Cui C, et al. Identification of TYMS as a promoting factor of retroperitoneal liposarcoma progression: Bioinformatics analysis and biological evidence. Oncol Rep. 2020;44:565–576. doi:10.3892/or.2020.7635.
17. Gronchi A, Collini P, Miceli R, et al. Myogenic differentiation and histologic grading are major prognostic determinants in retroperitoneal liposarcoma. Am J Surg Pathol. 2015;39(3):383–393. doi:10.1097/PAS.0000000000000366
18. Ecker BL, Peters MG, McMillan MT, et al. Preoperative radiotherapy in the management of retroperitoneal liposarcoma. Br J Surg. 2016;103(13):1839–1846. doi:10.1002/bjs.10305
19. Liu X, Zhang H, Lai L, et al. Ribonucleotide reductase small subunit M2 serves as a prognostic biomarker and predicts poor survival of colorectal cancers. Clin Sci. 2013;124(9):567–578. doi:10.1042/CS20120240
20. Putluri N, Maity S, Kommagani R, et al. Pathway-centric integrative analysis identifies RRM2 as a prognostic marker in breast cancer associated with poor survival and tamoxifen resistance. Neoplasia (New York, NY). 2014;16(5):390–402. doi:10.1016/j.neo.2014.05.007
21. Zhong Z, Cao Y, Yang S, Zhang S. Overexpression of RRM2 in gastric cancer cell promotes their invasiveness via AKT/NF-kappaB signaling pathway. Pharmazie. 2016;71(5):280–284.
22. Chen P, Wu JN, Shu Y, et al. Gemcitabine resistance mediated by ribonucleotide reductase M2 in lung squamous cell carcinoma is reversed by GW8510 through autophagy induction. Clin Sci. 2018;132(13):1417–1433. doi:10.1042/CS20180010
23. Kang W, Tong JH, Chan AW, et al. Targeting ribonucleotide reductase M2 subunit by small interfering RNA exerts anti-oncogenic effects in gastric adenocarcinoma. Oncol Rep. 2014;31(6):2579–2586. doi:10.3892/or.2014.3148
24. Shah KN, Wilson EA, Malla R, Elford HL, Faridi JS. Targeting ribonucleotide reductase M2 and NF-kappaB activation with didox to circumvent tamoxifen resistance in breast cancer. Mol Cancer Ther. 2015;14(11):2411–2421. doi:10.1158/1535-7163.MCT-14-0689
25. Rasmussen RD, Gajjar MK, Tuckova L, Jensen KE, Maya-Mendoza A, Holst CB. BRCA1-regulated RRM2 expression protects glioblastoma cells from endogenous replication stress and promotes tumorigenicity. Nat Commun. 2016;7:13398. doi:10.1038/ncomms13398
26. Finch RA, Liu M, Grill SP, et al. Triapine (3-aminopyridine-2-carboxaldehyde- thiosemicarbazone): a potent inhibitor of ribonucleotide reductase activity with broad spectrum antitumor activity. Biochem Pharmacol. 2000;59(8):983–991. doi:10.1016/S0006-2952(99)00419-0
27. Xiong X, Xie R, Zhang H, et al. PRAS40 plays a pivotal role in protecting against stroke by linking the Akt and mTOR pathways. Neurobiol Dis. 2014;66:43–52. doi:10.1016/j.nbd.2014.02.006
28. Wu CC, Hou S, Orr BA, et al. mTORC1-mediated inhibition of 4EBP1 is essential for hedgehog signaling-driven translation and medulloblastoma. Dev Cell. 2017;43(6):673–688.e675. doi:10.1016/j.devcel.2017.10.011
29. Cao P, Liu B, Du F, et al. Scutellarin suppresses proliferation and promotes apoptosis in A549 lung adenocarcinoma cells via AKT/mTOR/4EBP1 and STAT3 pathways. Thoracic Cancer. 2019;10(3):492–500. doi:10.1111/1759-7714.12962
30. Tang Y, Jacobi A, Vater C, Zou X, Stiehler M. Salvianolic acid B protects human endothelial progenitor cells against oxidative stress-mediated dysfunction by modulating Akt/mTOR/4EBP1, p38 MAPK/ATF2, and ERK1/2 signaling pathways. Biochem Pharmacol. 2014;90(1):34–49. doi:10.1016/j.bcp.2014.04.008
 © 2020 The Author(s). This work is published and licensed by Dove Medical Press Limited. The full terms of this license are available at https://www.dovepress.com/terms.php and incorporate the Creative Commons Attribution - Non Commercial (unported, v3.0) License.
By accessing the work you hereby accept the Terms. Non-commercial uses of the work are permitted without any further permission from Dove Medical Press Limited, provided the work is properly attributed. For permission for commercial use of this work, please see paragraphs 4.2 and 5 of our Terms.
© 2020 The Author(s). This work is published and licensed by Dove Medical Press Limited. The full terms of this license are available at https://www.dovepress.com/terms.php and incorporate the Creative Commons Attribution - Non Commercial (unported, v3.0) License.
By accessing the work you hereby accept the Terms. Non-commercial uses of the work are permitted without any further permission from Dove Medical Press Limited, provided the work is properly attributed. For permission for commercial use of this work, please see paragraphs 4.2 and 5 of our Terms.