")
Back to Journals » Cancer Management and Research » Volume 13
Downregulation of FHOD1 Inhibits Metastatic Potential in A549 Cells
Authors Hałas-Wiśniewska M , Izdebska M , Zielińska W , Grzanka A
Received 11 October 2020
Accepted for publication 15 December 2020
Published 8 January 2021 Volume 2021:13 Pages 91—106
DOI https://doi.org/10.2147/CMAR.S286239
Checked for plagiarism Yes
Review by Single anonymous peer review
Peer reviewer comments 3
Editor who approved publication: Dr Chien-Feng Li
Marta Hałas-Wiśniewska, Magdalena Izdebska, Wioletta Zielińska, Alina Grzanka
Department of Histology and Embryology, Nicolaus Copernicus University in Toruń, Faculty of Medicine, Collegium Medicum in Bydgoszcz, Bydgoszcz 85-092, Poland
Correspondence: Marta Hałas-Wiśniewska
Department of Histology and Embryology, Nicolaus Copernicus University in Toruń, Faculty of Medicine, Collegium Medicum in Bydgoszcz, 24 Karłowicza Street, Bydgoszcz 85-092, Poland
Tel +48525853725
Fax +48525853734
Email [email protected]
Purpose: Metastasis remains a serious clinical problem in which epithelial-to-mesenchymal transition is strictly involved. The change of cell phenotype is closely related to the dynamics of the cytoskeleton. Regarding the great interest in microfilaments, the manipulation of ABPs (actin-binding proteins) appears to be an interesting treatment strategy.
Material: The research material was the highly aggressive A549 cells with FHOD1 (F FH1/FH2 domain-containing protein 1) downregulation. The metastatic potential of the cells and the sensitivity to treatment with alkaloids (piperlongumine, sanguinarine) were analyzed.
Results: In comparison to A549 cells with naïve expression of FHOD1, those after manipulation were characterized by a reduced migratory potential. The obtained results were associated with microfilaments and vimentin reorganization induced by the manipulation of FHOD1 together with alkaloids treatment. The result was also an increase in the percentage of late apoptotic cells.
Conclusion: Downregulation of FHOD1 induced reorganization of microfilament network followed by the reduction in the metastatic potential of the A549 cells, as well as their sensitization to selected compounds. The presented results and the analysis of clinical data indicate the possibility of transferring research from the basic level to in vivo models in the context of manipulation of ABPs as a new therapeutic target in oncology.
Keywords: FHOD1, lung cancer, F-actin, migration, A549
Introduction
Metastasis is one of the crucial problems among cancer patients, contributing to 67% of mortality.1 This also applies to lung cancer, of which as much as 75% is identified as a metastatic or late-stage.2 While for patients with tumors limited only to the primary focus, the 5-year survival rate is estimated at 56%, when metastases occur, this parameter decreases to just 5%.3 These statistics make it highly justified to search for new therapy goals based on cancer biology. The formation of secondary tumors is a multi-stage process that includes initiation, invasion, intravasation, circulation, and extravasation.4 All steps lead to the independent functioning of cancer cells in a new location. The acquisition of the ability to migrate is the result of changes in the cell from epithelial to mesenchymal type, known as EMT (epithelial-to-mesenchymal transition).5 EMT plays a pivotal role during the initial stage of metastasis and is, therefore, an interesting target for cancer therapy.6 In initially stable, immobile cancer cells, numerous changes take place, including the reorganization of the cytoskeleton and alterations in the expression of genes responsible for their shape.5
The actin cytoskeleton is a dynamic network created by G- and F-actin. It is an element necessary to maintain homeostasis in many cellular processes of normal and cancer cells.7 Additionally, the involvement of actin in cell movement is beyond doubt. The characteristic feature of cells with invasive potential is a strong accumulation of actin in the cortical region, as well as the formation of invasive structures – lamellipodia and filopodia.8 Moreover, the dynamic rearrangement of microfilaments promotes the change of the cell shape and the increase in motor properties, which is strictly regulated by the proteins belonging to the Rho family, as well as the group of ABPs (actin-binding proteins).7 ABPs are a numerous group of proteins responsible for the correct and continuous reorganization of the actin network (polymerization and depolymerization).9 In the context of EMT, attractive targets are ABPs responsible, e.g., for the stabilization and promotion of actin filament elongation. Literature reports indicate that Arp 2/3, together with the WASP/WAVE family, regulates the formation of filopodia and lamellipodia.10 In turn, proteins from the tropomyosin family likely play a role in amoeboid and mesenchymal migration.9,11 Studies on the other proteins from the ABPs family – cortactin and fascin-1 showed their importance in the regulation of invadopodia in cancer cells.12
The ABPs involved in extending the positive ends of actin filaments are formins. This conservative group includes 15 isoforms. One of them is FHOD1 (FH1/FH2 domain-containing protein 1).13 In addition to its functional connection with the actin network, the literature shows its correlation with microtubules. Together with proteins accompanying this structure, they influence its stabilization during interphase and mitosis.14 Furthermore, recently the role of FHOD1 in actin stress fiber formation was also highlighted.15 Another interesting aspect is the importance of FHOD1 in the EMT and migration of cancer cells.16 Literature reports have suggested that cells with a mesenchymal phenotype show a high level of FHOD1 expression, especially in the cortical part of migrating cells.17 Moreover, Koka et al 2003 presented that overexpression of FHOD1 resulted in increased migration potential of melanoma cells.18 Given the few reports on the manipulation of FHOD1, the protein could be a target in inhibition of the tumor cell invasiveness. Therefore, the main goal of the presented study was the assessment of the downregulation of FHOD1 expression in non-small cell lung cancer A549 cells. The manipulation of the protein level was used to assess the effect of the microfilament reorganization on the metastatic potential of the cells, as well as their sensitivity to the selected compounds. To our knowledge, this is the first work presenting the effect of FHOD1 manipulation on the A549 cell line.
Materials and Methods
Cell Culture and Treatment
The study material was the A549 cell line obtained from the European Collection of Authenticated Cell Cultures (Sigma-Aldrich, St Louis, MO, USA). The cells were grown as a monolayer in DMEM (Dulbecco’s Modified Eagle’s Medium; Lonza Group, Ltd., Basel, Switzerland) with the addition of 10% FBS (fetal bovine serum; Sigma-Aldrich, Merck KGaA, Darmstadt, Germany) and 50 μg/mL gentamycin (Sigma-Aldrich). To ensure high-quality, the A549 cell line was grown up to the 6th passage and tested for Mycoplasma.19 To assess the effect of FHOD1 downregulation on A549 sensitivity to the selected compounds, the cells were treated with alkaloids. During the experiments, 4 µM PL (piperlongumine; ABCAM; Cambridge, United Kingdom), 1 µM SAN (sanguinarine; ABCAM), or the combination of alkaloids in a ratio of 4:1were applied for 24h. Compounds were dissolved in DMSO (Sigma-Aldrich). Both CTRL (untreated) and treated cells were cultured in standard culture conditions (5% CO2, 37°C, 95% air atmosphere). The concentrations of alkaloids used in the research were developed experimentally based on MTT tests. Selected concentration ratio of 4:1 resulted in synergism, which was estimated based on the CI (combination index) method of Chou-Talalay (synergism: CI < 1, additive effect: CI=1 and antagonism: CI > 1).20,21 The process of the development of the applied combination has already been described in our previous study.22
Transfection Using Nucleofection
To downregulate FHOD1 expression level in A549 cells, the nucleofection with siRNA against FHOD1 (Qiagen, Hilden, Germany) and SF Cell Line 4D-Nucleofector®X kit (Lonza, Basel, Switzerland) was performed. Transfection was based on electroporation using 4D-Nucleofector (Lonza) according to the manufactures’ instructions and the methods applied in our previous studies.23,24 After 72h, the cells were treated with PL, SAN, PL/SAN, and used for further experiments. The control cells were the A549 with the naïve expression of FHOD1. The transfection efficiency was evaluated by GFP (green fluorescent protein; pmaxGFP control vector; Lonza) using Tali image-based cytometer (ThermoFisher, Carlsbad, CA, USA) and measurement of FHOD1 fluorescence intensity from confocal images. The semi-quantitative analysis of the post-translational expression of FHOD1 was analyzed by the Western blot method in accordance with the methodology described in our previous studies.23,25
Apoptosis Assay
For the cell death analysis, the AV (annexin V) and PI (propidium iodide) double staining followed by the cytometric measurement using a Guava easyCyte 6HT-2L Benchtop Flow Cytometer (Merck KGaA) were performed. After treatment with 4 µL PL, 1 µM SAN, and 4 µL PL/1 µL SAN, the cells were harvested with 0.25% trypsin (37°C, 5 min; Sigma-Aldrich), centrifugated (8 min x 500g) and suspended in 100 µL of Annexin Binding Buffer (ABB, Invitrogen; Thermo Fisher Scientific, Inc., Waltham, MA, USA) with the addition of 5 µL AV Alexa Fluor 488 (Invitrogen, Thermo Fisher) for 20 min. After centrifugation (5 min x 300g), cells were incubated with 1 µL PI (Invitrogen, Thermo Fisher) for 3 min and analyzed in cytometer and FlowJo vX0.7 software (FlowJo LLC, Ashland, OR, USA). According to the recorded signal, the cells were classified as live (AV-/PI-), early apoptotic (AV+/PI-), late apoptotic (AV+/PI+), and necrotic (AV-/PI+). The studies assessed the type of cell death in A549 cells with the naïve expression of FHOD1 (A549) and A549 cells with the downregulation of the protein (A549 FHOD1-) treated/untreated with the alkaloids.
Fluorescence Staining of Selected Proteins
To compare the organization of FHOD1, F-actin, vimentin, and cell nuclei of A549 and A549 FHOD1- cells treated with alkaloids, fluorescence staining was performed. The cells were grown on coverslips in 12-wells plates. After transfection and treatment with 4 µM PL, 1 µM SAN, and 4 µM PL/1 µM SAN, cells were fixed in 4% paraformaldehyde for 20 min (Sigma-Aldrich). After the series of washing with PBS (3x 5 min), A549 cells were permeabilized with 0.25% Triton X-100 (5 min; Serva) and blocked in 1% (w/v) BSA (30 min; Sigma-Aldrich). For F-actin labeling, the cells were stained with Alexa Fluor 488-conjugated phalloidin (1:40 in PBS, 20 min, dark; Invitrogen; Thermo Fisher Scientific, Inc.). In turn, for the detection of vimentin and FHOD1, the primary mouse anti-vimentin antibody (1:70 in BSA, 1h, Sigma-Aldrich) and the primary rabbit anti-FHOD1 antibody (1:50 in BSA, 1h, Sigma-Aldrich) were used. To visualize the proteins, secondary anti-mouse or anti-rabbit antibodies conjugated with Alexa Fluor 488 were used (dilution 1:100 in PBS, 1h, dark; Invitrogen; Thermo Fisher Scientific, Inc.). The cell nuclei were labeled using DAPI (dilution 1:20,000, dark; Sigma-Aldrich). Finally, the cells were mounted in Aqua-Poly/Mount (Polysciences) and assessed using Nikon Eclipse E800 fluorescence microscope and NIS-Elements 4.0 software (Nikon).
Migration Potential
To evaluate the migratory potential of A549 and A549 FHOD1- cells, invasion and migration transwell assays, wound healing assay, and flow cytometric measurement of F-actin and standard markers of EMT including E-, N-cadherin and vimentin were performed. All methods were described in detail in our previous paper.22 In short, A549 cells were grown to 100% confluence and the monolayer surface was mechanically scratched to form a wound. At selected time points after the treatment of the cells with compounds (0, 3, 6, 29, 34, and 36h), the wound was photographed by TE100-U inverted contrast-phase microscope with a CCD camera DS-5Mc-U1 and NIS-Elements software version 3.30 (Nikon). To determine the migration potential of A549 cells transwell migration assay (8 μm pore size; Corning, NY, USA) was performed. In turn, to evaluate the invasive prosperities of cells, transwell inserts (Corning) with the addition of 100 µL Matrigel (2 mg/mL in serum-free DMEM; Corning) were used. After 24h incubation with the addition of chemoattractant in the lower chamber (15% FBS), the cells were fixed in 4% paraformaldehyde and stained with 0.25% crystal violet. Then, the cells from the upper part of the insert (with low migratory potential) were removed using cotton swabs. The outside of the inserts was examined using light microscope Nikon Eclipse E800 (Nikon) and CCD camera DS-5Mc-U1 and NIS-Elements software version 3.30 (Nikon). The data obtained from wound healing, invasion, and migration transwell assay were analyzed by ImageJ software (Ver1.45s, National Institutes of Health, Bethesda, MD, USA). Additionally, the flow cytometric analysis of fluorescence intensity of selected proteins was performed. To evaluate the level of E- and N-cadherin the A549 cells were harvested using EDTA solution (4°C, 10 min; Sigma-Aldrich), rinsed in PBS, fixed in Cytofix/Cytoperm (20 min; BD Falcon), and stained with mouse anti-N-cadherin antibody (dilution 1:100, 1h, ABCAM) or mouse anti-E-cadherin antibody (dilution 1:100, 1h, RT; Sigma-Aldrich). In turn, for labeling of vimentin, mouse anti-vimentin antibody (dilution 1:100, 1h; Sigma-Aldrich) was applied. The anti-mouse Alexa Fluor 647 (dilution 1:500, 1h, dark; Invitrogen; Thermo Fisher Scientific, Inc.) was used as a secondary antibody. F-actin was detected using Alexa Fluor 488-conjugated phalloidin (1:40; Invitrogen; Thermo Fisher Scientific, Inc.). The data were analyzed by Guava easyCyte 6HT-2L Benchtop Flow Cytometer (Merck KGaA) and FlowJo vX0.7 software (FlowJo LLC).
Statistical Analysis
Data obtained from MTT assay were analyzed using the Wilcoxon test, where the control group absorbance was estimated as 100%. In the case of cell death, migration and invasion transwell assays, and cytometric analysis of selected proteins 2way ANOVA was used. In turn, in the statistical analysis of transfection efficiency and wound healing assay, the U Mann–Whitney and non-parametric Kruskal–Wallis with Dunn’s post hoc test were applied. In all analyses, GraphPad Prism version 6.0 (GraphPad Software, Inc., La Jolla, CA, USA) was used. Data are presented as mean with SD (standard division). p<0.05 was considered statistically significant. To analyze publicly available data sets of FHOD1 mRNA expression in adenocarcinoma, the online database Kaplan-Meier plotter was used.26,27
Results
Transfection Efficiency of FHOD1 Expression in A549 Cell Line
The A549 cells were transfected with the pmaxGFP control vector. The obtained efficiency is presented in Figure S1. The Tali Image-based cytometric measurement of the level of GFP fluorescence showed that the average transfection efficiency was 89.8% (see Supplementary Information, Figure S1A and B). In the next step, the reduction of FHOD1 level in A549 cells was also evaluated. Densitometric analysis of the bands reflecting the protein level obtained by Western blot showed a 0.52-fold decrease in FHOD1 expression in siRNA-transfected cells in relation to control cells transfected with the empty control plasmid vector (Figure S1C). Confocal images obtained using a specific anti-FHOD1 antibody showed a 0.62-fold decrease in the average fluorescence intensity (MFI=902.70) compared to cells with the naïve expression of FHOD1 (MFI=1449.05) (Figure S1D and E).
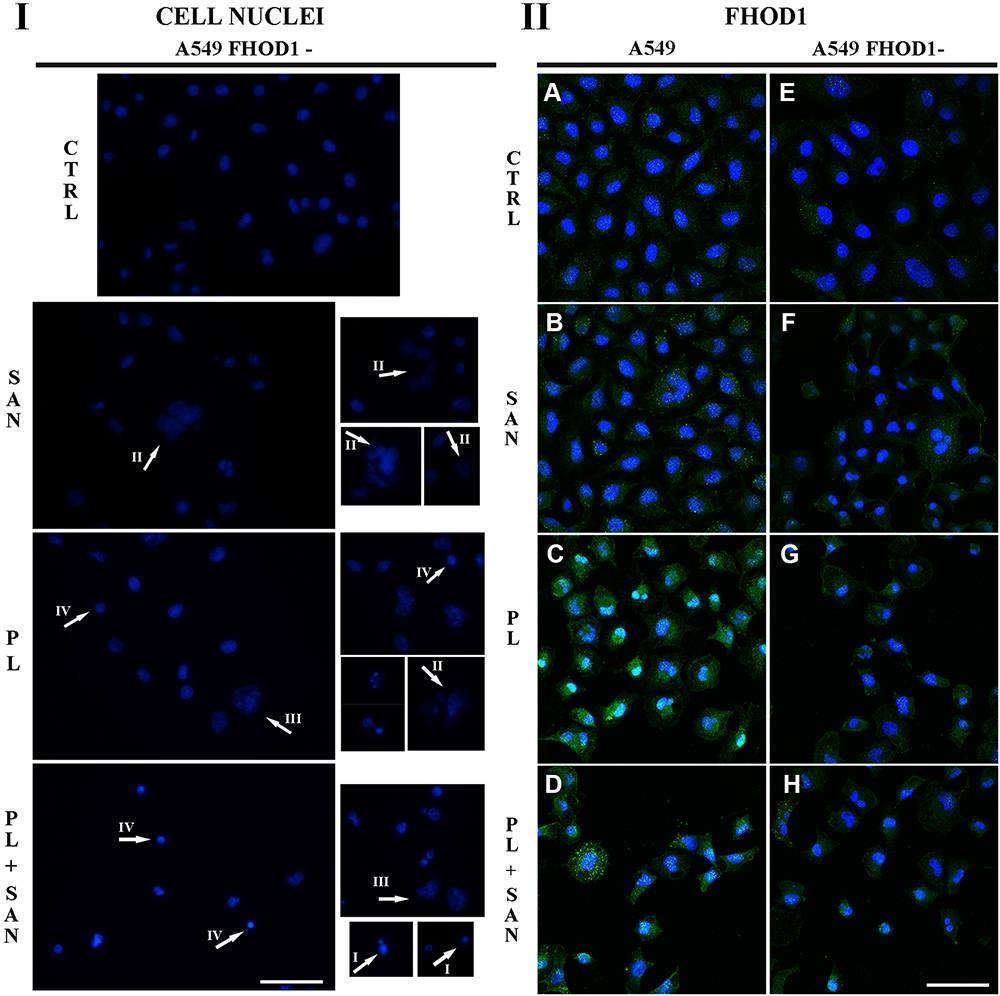 |
Figure 1 (I) The effect of FHOD1 downregulation on cell nuclei of non-small cell lung cancer A549 cells. A549 cells with the naïve expression of FHOD1 (A549) and after transfection with siRNA against FHOD1 (A549 FHOD1-) were treated for 24h with 1 µM sanguinarine (SAN), 4 µM piperlongumine (PL) and their combination (PL/SAN). The cell nuclei were stained by DAPI (blue). Arrows mark the observed changes - shrunken cells with visible chromatin decondensation, apoptotic bodies (apoptotic phenotype – I), shrunken nucleus (IV) and nuclei with features of a mitotic catastrophe - numerous micronuclei (II) or large size (III). (II) The effect of FHOD1 downregulation on FHOD1 of non-small cell lung cancer A549 cells. A549: (A–D) A549 FHOD1-: (E–H) Fluorescent staining of FHOD1 (green) and nuclei (blue). Bar = 50µm. |
Effect of Downregulation of FHOD1 on Cell Death of A549 Cell Line
In the next step, we checked whether FHOD1 downregulation affects A549 cells’ response to the treatment with selected alkaloids. For this, the standard AV/PI double-labeling method was used. In the population of A549 FHOD1- living cells, 92.55 ± 0.55% for the control, 89.62 ± 5.36% for 1 μM SAN, 72.54 ± 7.38% for 4 μM PL and 56.62 ± 8.33% for their combination were observed. Incubation with alkaloids induced an increase in the percentage of early apoptosis from 1.14 ± 0.56% (CTRL) to 1.41 ± 0.65% and 2.73 ± 0.95% for SAN and PL, respectively (see Supplementary Information, Figure S2A). In turn, the analysis of the effect of 4 μM PL/1 μM SAN showed an increase in the percentage of AV+/PI- cells to 4.89 ± 1.67% (Figure S2B). We noted that treatment with all doses of alkaloids elevated the percentage of the late-apoptotic cell population in a statistically significant manner. The greatest differences compared to the control (2.55 ± 0.74%) were induced by the use of 4 μM PL (16.97 ± 5.06%) and 4 μM PL/1 μM SAN (27.72 ± 5.06%) (Figure S2C). In the case of the evaluation of the percentage of necrotic cells, a statistically significant increase was also shown for the PL and 4 μM PL/1 μM SAN from 4.33 ± 0.4% (CTRL) to 7.27 ± 1.02% and 11.36 ± 3.5%, respectively (Figure S2D).
Comparative analysis between cells transfected with siRNA directed against FHOD1 (A549 FHOD1-) and cells without changes in the level of the protein expression (A549) showed statistically significant differences in the percentage of cell populations. Significant differences in the case of live cells were observed only for those with naïve expression of FHOD1 treated with 1 μM SAN (an increase from 83.52 ± 3.39 for A549 to 89.62 ± 5.36% for A549 FHOD1 -) (Figure S2A). Assessment of the percentage of cells with a signal characteristic for early apoptosis (AV +/PI-) and necrosis (AV-/PI +) for FHOD1-downregulated A549 cells showed a reduction in comparison to the values obtained for cells without altered FHOD1 levels for all alkaloid concentrations. A statistically significant decrease in the percentage of early apoptotic cells was observed from 3.72 ± 0.65% (A549) to 1.41 ± 0.65% (A549 FHOD1-) for 1 μM SAN, from 6.83 ± 1.69% to 2.74 ± 0.95% for 4 μM PL and in their combination from 4.88 ± 1.67% to 8.57 ± 1.29% (Figure S2B). The population of necrotic cells for A549 FHOD1- after treatment with all doses of alkaloids also decreased in a statistically significant manner in comparison to those without FHOD1 manipulation (Figure S2D). Figure 2C shows the data obtained for the late apoptotic cell population. The conducted studies showed a statistically significant increase in the percentage of cells with a positive signal for AV and PI compared to A549 with the naïve expression of FHOD1. The highest values were recorded for the treatment with 4 μM PL (an increase from 9.70 ± 2.54% for A549 to 16.97 ± 5.06% for A549 FHOD1-) and the combination of alkaloids (from 22.49 ± 4.91% to 27.72 ± 6.63%) (Figure S2C).
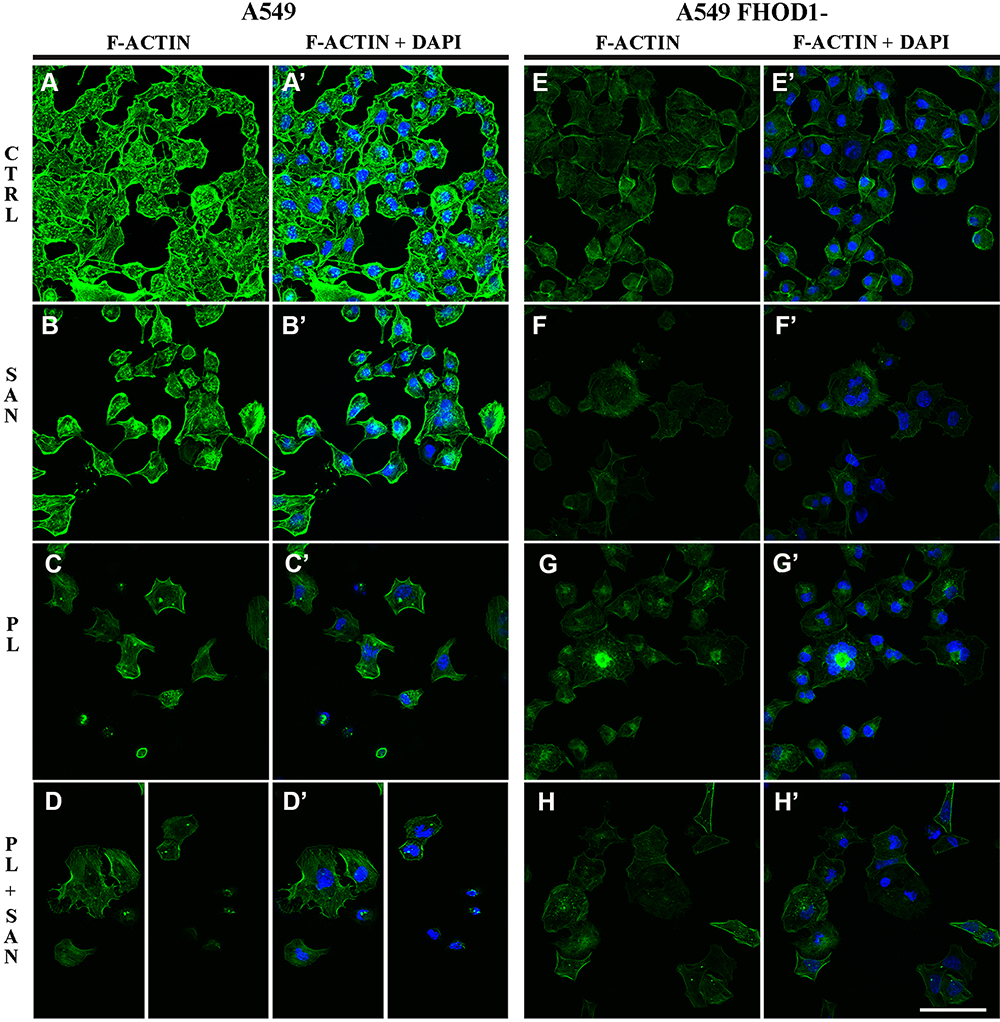 |
Figure 2 The effect of FHOD1 downregulation on actin network of non-small cell lung cancer A549 cells. A549 cells with the naïve expression of FHOD1 (A549) (A,A’–D,D’) and after transfection with siRNA against FHOD1 (A549 FHOD1-) (E,E’–H, H’) were treated for 24h with 1 µM sanguinarine (SAN), 4 µM piperlongumine (PL) and their combination (PL/SAN). Fluorescent staining of actin (green) and nuclei (blue). Bar = 50µm. |
Effect of Downregulation of FHOD1 on Nuclei Morphology and FHOD1 Organization of A549 Cell Line
To further evaluate the effect of FHOD1 downregulation on A549 cells, together with the treatment with selected alkaloids, fluorescent labeling of cell nuclei was used. The assessment of the morphology of nuclei of A549 FHOD1- cells in comparison to the control group showed no significant changes in their appearance. In the case of treatment with 1 μM SAN, in addition to unaffected cells, mainly large cells with numerous micronuclei were visible. On the other hand, the addition of 4 μM PL promoted the phenotype of cells with features typical for apoptosis (shrunken nuclei). We also observed single cells with giant nuclei or several micronuclei. After 24h incubation with the combination of PL and SAN at a constant concentration ratio of 4:1, a reduction in the number of cells in the field of view was noticed. The assessed cells were characterized by shrunken nuclei and condensed chromatin. Some of the cells had features of advanced apoptosis with visibly fragmented nuclei and apoptotic bodies. Representative photos are shown in Figure 1I.
Fluorescent staining of FHOD1 in cells with the naïve expression and after its downregulation made it possible to assess the protein organization in the cells, as well as to visualize transfection efficiency. Untreated A549 FHOD1- cells were characterized by a weaker fluorescent signal of the labeled protein compared to cells without manipulation (Figure 1IIA and E). Similar observations were made for 1 μM SAN (Figure 1IIB and F). In A549 cells treated with 4 μM PL and 4 μM PL/1 μM SAN, an increase in the FHOD1 fluorescence signal with visible point condensation around the cell nuclei was observed. This was a characteristic of cells with apoptotic features (Figure 1IIC and D). When the same concentrations were used in A549 FHOD1- cells, a decrease in the FHOD1 signal was noticed. Single cells with point accumulation of protein in the nuclei were also observed. In contrast, most of the cells were characterized by the scattering of the FHOD1 fluorescence signal (Figure 1IIG and H). The obtained results confirmed the estimated efficiency of transfection.
Effect of Downregulation FHOD1 on the Selected Cytoskeletal Proteins of A549 Cell Line
Vimentin and F-actin play a crucial role in cell motility. To assess the effect of the downregulation of FHOD1 on the migration potential of A549 cells, fluorescence staining was performed.
The evaluation of the fluorescent F-actin labeling showed that the A549 FHOD1- cells had a lower intensity of the visible protein signal compared to A549 cells with the naïve expression of the protein (Figure 2A,A’- D,D’). Untreated cells were characterized by lower F-actin fluorescence intensity in the cytoplasm. Moreover, single cells with multiple tension fibers were noted (Figure 2E, E’). 24h incubation with 1 μM SAN induced a reduction in the F-actin signal in the whole cell. The actin network in cells with the features of a mitotic catastrophe formed an extended ring in the cortical part of the cell but also was characterized by noticeably weaker fluorescence signal (Figure 2F, F’). In the case of treatment with 4 μM PL, marked reduction in the number of cells in the field of view and a spread of actin filaments, especially in cells with extensive cytoplasm, were noted. Moreover, most of the A549 FHOD1- cells had an F-actin network in the form of multiple stress fibers (Figure 2G, G′). Treatment with the combination of alkaloids in a constant ratio of 4:1 resulted in the accumulation of F-actin in the form of clusters located within the cell nucleus with particular emphasis on cells with micronuclei. In most cells, the F-actin network throughout the cytoplasm occurred in the form of stress fibers. In turn, some of them were characterized by a dispersed network of microfilaments located in the cytoplasm in the form of short polymers. In contrast, apoptotic cells showed a strong reorganization of the F-actin cytoskeleton (Figure 2H, H′).
The evaluation of the vimentin network showed that A549 FHOD1- cells were characterized by a lower fluorescence signal of protein in comparison to A549 cells without manipulation (Figure 3). In untreated A549 FHOD1- cells, both cells with a well-developed network of vimentin and a small population with a diffuse organization of the protein were visible (Figure 3E, E’). After 24h incubation with 1 μM SAN irregular vimentin fibers, especially in the case of a mitotic catastrophe, were noticed (Figure 3F, F’). On the other hand, treatment with 4 μM PL induced the accumulation of the vimentin fluorescence signal in the form of points located near the cell nucleus (Figure 3G, G’). Similar observations were made for the combination of alkaloids. In apoptotic cells with a fragmented nucleus or visible apoptotic buds, an intensification of the vimentin point signal was noted (Figure 3H, H’). The performed analysis correlated with the changes observed in the actin cytoskeleton. Obtained results may indicate a reduction of the migratory properties of A549 cells after downregulation of FHOD1 level.
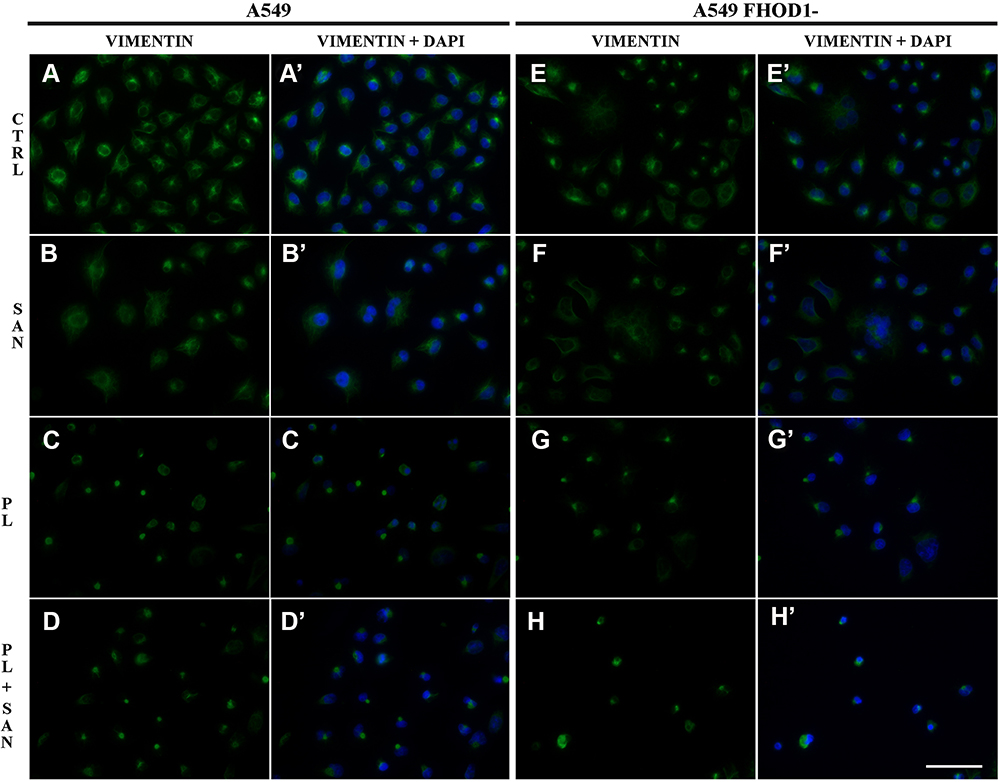 |
Figure 3 The effect of FHOD1 downregulation on vimentin network of non-small cell lung cancer A549 cells. A549 cells with the naïve expression of FHOD1 (A549) (A,A’–D,D’) and after transfection with siRNA against FHOD1 (A549 FHOD1-) (E,E’–H, H’) were treated for 24h with 1 µM sanguinarine (SAN), 4 µM piperlongumine (PL) and their combination (PL/SAN). Fluorescent staining of vimentin (green) and nuclei (blue). Bar = 50µm. |
Effect of the FHOD1 Downregulation on Migration Potential of the A549 Cell Line
In the next step, we evaluated the effect of the downregulation of the FHOD1 level in A549 cells in the context of the migration potential. For this purpose, wound healing assay, invasion and migration assays, assessment of EMT markers, F-actin, and vimentin levels were performed.
According to the adopted methodology, the observation of the overgrowth of the mechanically formed “wound” was carried out until complete healing (100%) in untreated cells (36h). At the same time, after the treatment of A549 FHOD1- cells with the alkaloids, the scratch area was covered in 94.5 ± 2.16% and 88.20 ± 2.71% for SAN and PL, respectively. After 36h in the combination of the selected compounds in the ratio of 4:1, the “wound” overgrown to 85.22 ± 3.19% (Figure 4A and B). The comparative analysis after 24h showed that A549 non-small cell lung cancer cells with downregulation of FHOD1 level had lower motility compared to cells with the naïve expression of the protein. In the case of the CTRL, there was a reduction in the “wound” for A549 FHOD1- (60.44 ± 7.99%) in comparison to A549 CTRL cells (85.14 ± 3.74%). For individual concentrations of the alkaloids a statistically significant reduction in the motility of A549 FHOD1- cells was also observed. The overgrowth of the “wound” was visible in 54.51 ± 6.42% (A549 - 77.33 ± 6.01%) for 1 μM SAN and 40.46 ± 6.32% (A549 - 57.79 ± 3.32%) for 4 μM PL. Also, in this case, the greatest inhibition of the migration of cells was induced by the combination of PL and SAN in a constant concentration ratio of 4:1. The value was reduced from 53.73 ± 6.81% (A549) to 29.76 ± 4.87% (A549 FHOD1-) (Figure 4C).
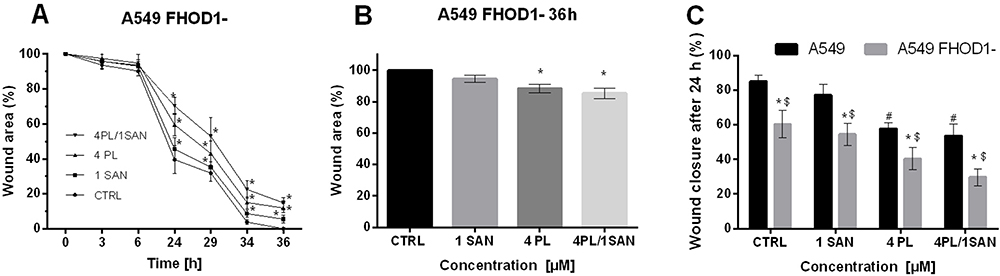 |
Figure 4 The effect of FHOD1 downregulation on metastasis potential of non-small cell lung cancer A549 cells – wound healing assay. A549 cells with the naïve expression of FHOD1 (A549) and after transfection with siRNA against FHOD1 (A549 FHOD1-) were treated for 24h with 1 µM SAN (sanguinarine), 4 µM PL (piperlongumine) and their combination (4PL/1SAN). The time-course of closure of the wounded areas in A549 cells with downregulation of FHOD1 is shown (A). Wound closure at 36h after treatment (B). Wound closure at 24h after treatment as a percentage of A549 CTRL migration (C). Data represents the mean ± SD obtained from 3 independent replicates (n=3). Statistically significant differences between A549 cells and A549 with downregulation of FHOD1 levels are marked with “*”, and compared to control cells for A549 “#” and “$” for A549 FHOD1- (p <0.05; two-way ANOVA). |
Figure 5A presents representative images of the transwell migration assay. The analysis of A549 FHOD1- cells showed that in the CTRL 369.5 ± 27.58 cells with high migratory potential were observed. After treatment with 1 μM SAN, 4 μM PL, and 4 μM PL/1 μM SAN their mean number was reduced to 319.67 ± 33.61, 34.83 ± 4.88, and 12.83 ± 6.27, respectively (Figure 5B). Obtained results indicated that downregulation of FHOD1 inhibited the migration of A549 cells by 61.23 ± 4.97% for CTRL, 66.47 ± 5.01% for 1 μM SAN, 96.33 ± 0.74% for 4 μM PL, and 98.33 ± 0.70% for the combination of alkaloids in the ratio of 4:1 in comparison to untreated A549 cells with the naïve expression of FHOD1 (Figure 5C).
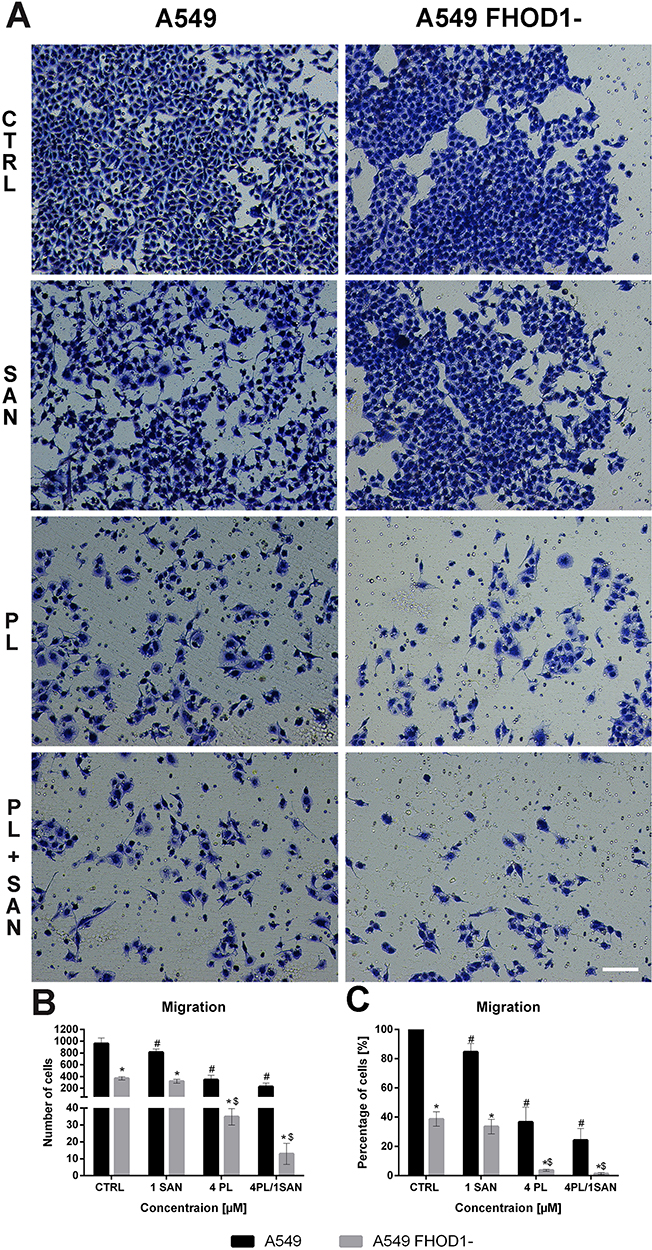 |
Figure 5 The effect of FHOD1 downregulation on metastasis potential of non-small cell lung cancer A549 cells – migration assay. A549 cells with the naïve expression of FHOD1 (A549) and after transfection with siRNA against FHOD1 (A549 FHOD1-) were treated for 24h with 1 µM SAN (sanguinarine), 4 µM PL (piperlongumine) and their combination (4PL/1SAN). Representative image of transwell migration assay. Bar = 50µm (A). The average number of cells with high migratory potential (B) and an average percentage of cells relative to CTRL (estimated as 100%) (C). Data represents the mean ± SD obtained from 4 independent replicates (n=4). Statistically significant differences between A549 cells and A549 with downregulation of FHOD1 levels are marked with “*”, and compared to control cells for A549 “#” and “$” for A549 FHOD1- (p <0.05; two-way ANOVA). |
In the case of the invasion assay, there was also a significant reduction in the invasive potential of A549 FHOD1-, both in the untreated cells and after the application of the alkaloids (Figure 6). After 24h, on the outside of the insert, 468.67 ± 71.40 cells for untreated cells, 406.0 ± 15.82 for 1 μM SAN, 241.33 ± 78.14 for 4 μM PL, and 88.0 ± 10.2 cells for compound combinations were observed (Figure 6B). The comparison of the results obtained for A549 FHOD1- and A549 with the naïve expression of FHOD1 showed that the manipulation of the ABP contributed to the inhibition of the invasive properties of non-small cell lung cancer cells. We observed a reduction in invasive potential by 36.9 ± 12.57% (CTRL), 45.64 ± 3.34% (1 SAN), 68.07 ± 9.25% (4 PL) and 88.21 ± 1.46% (4 μM PL/1 μM SAN) (Figure 6C). Moreover, the assays demonstrated that the downregulation of FHOD1 level expression significantly impaired the migration and invasiveness of A549 cells.
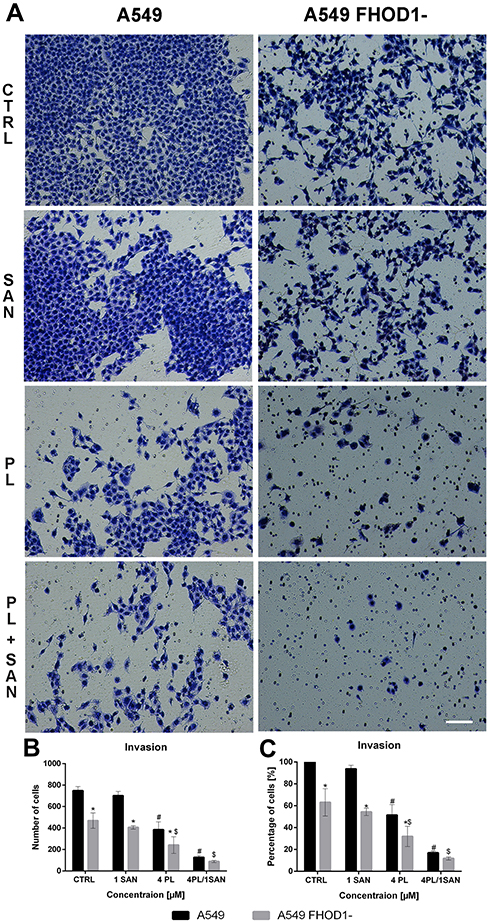 |
Figure 6 The effect of FHOD1 downregulation on metastasis potential of non-small cell lung cancer A549 cells – invasion assay. A549 cells with the naïve expression of FHOD1 (A549) and after transfection with siRNA against FHOD1 (A549 FHOD1-) were treated for 24h with 1 µM SAN (sanguinarine), 4 µM PL (piperlongumine) and their combination (4PL/1SAN). Representative image of transwell invasion assay. Bar = 50µm (A). The average number of cells with high invasiveness potential (B) and an average percentage of cells relative to CTRL (estimated as 100%) (C). Data represents the mean ± SD obtained from 4 independent replicates (n=4). Statistically significant differences between A549 cells and A549 with downregulation of FHOD1 levels are marked with “*”, and compared to control cells for A549 “#” and “$” for A549 FHOD1- (p <0.05; two-way ANOVA). |
In the next step, a cytometric evaluation of the average level of fluorescence intensity of EMT markers (N-cadherin, E-cadherin, vimentin) and F-actin was performed. The obtained results were presented as multiplicity in comparison to A549 CTRL (assumed as 1) (Figure 7). The assessment of N-cadherin showed a decrease in the level of the observed fluorescent signal of the protein. After treatment of A549 FHOD1- cells with 4 μM PL (0.65 ± 0.07-fold) and 4 μM PL/1 μM SAN (0.55 ± 0.07-fold) a statistically significant reduction was observed. In a comparative analysis of A549 and A549 FHOD1- cells a significant reduction in the level of N-cadherin fluorescence intensity was noted for 24h incubation with 1 μM SAN (from 0.99 ± 0.18-fold for A549 to 0.79 ± 0.05 -fold for A549 FHOD1-) and 4 μM PL (from 0.79 ± 0.06-fold for A549 to 0.65 ± 0.07-fold for A549 FHOD1-) (Figure 7A). The analysis of E-cadherin showed an increase in the mean level of fluorescence intensity in A549 FHOD1- cells. The combination of alkaloids caused a statistically significant increase in E-cadherin fluorescence intensity compared to A549 FHOD1- CTRL estimated as 1.77 ± 0.14. The change was also significant for A549 cells with the naïve expression of FHOD1 (an increase from 1.46 ± 0.13) (Figure 7B). In the case of vimentin, a statistically significant reduction of the signal was observed. There was a 0.88 ± 0.06-fold decrease in fluorescence intensity for CTRL, while for alkaloids 0.61 ± 0.09-fold and 0.51 ± 0.07-fold reduction were noted, respectively, for 1 μM SAN and 4 μM PL (from 0.81 ± 0.08-fold for 1 μM SAN; 0.67± 0.08-fold for 4 μM PL). The combination of alkaloids induced a 0.31 ± 0.04-fold decrease in the mean fluorescence intensity level (from 0.56 ± 0.05-fold for A549) (Figure 7C). Cytometric evaluation of the mean level of F-actin fluorescence intensity showed that cells with decreased FHOD1 expression had significantly lower values of the labeled protein compared to A549 cells. In the case of CTRL, there was a 0.75 ± 0.14-fold decrease in the average level of F-actin fluorescence intensity, while after treatment with alkaloids it reached 0.65 ± 0.15-fold and 0.59 ± 0.1-fold for 1 μM SAN and 4 μM PL, respectively. 24h incubation of A549 FHOD1- with 4 μM PL/1 μM SAN significantly reduced the F-actin signal from 0.61 ± 0.09-fold for A549 to 0.47 ± 0.11-fold for A549 FHOD1- (Figure 7D). Obtained results correlated with the observations made during fluorescent F-actin and vimentin labeling.
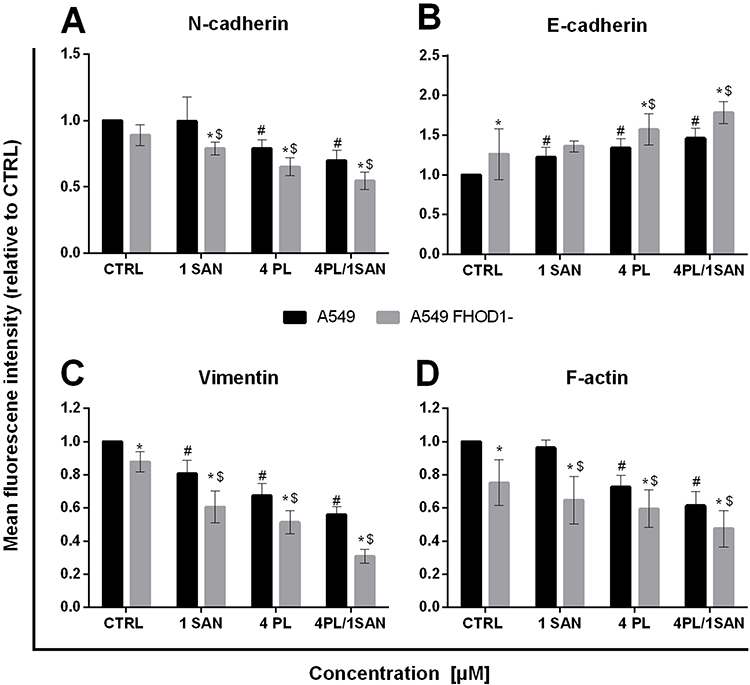 |
Figure 7 The effect of FHOD1 downregulation on metastasis potential of non-small cell lung cancer A549 cells – cytometric analysis. A549 cells with the naïve expression of FHOD1 (A549) and after transfection with siRNA against FHOD1 (A549 FHOD1-) were treated for 24h with 1 µM SAN (sanguinarine), 4 µM PL (piperlongumine) and their combination (4PL/1SAN). The mean fluorescence intensity of N-cadherin (A), E-cadherin (B), vimentin (C) and F-actin (D). Levels of the proteins were normalized to CTRL and results were expressed as fold change vs. A549 CTRL (estimated as 1). Data represents the mean ± SD obtained from 3 independent replicates (n=3). Statistically significant differences between A549 cells and A549 with downregulation of FHOD1 levels are marked with “*”, and compared to control cells for A549 “#” and “$” for A549 FHOD1- (p <0.05; two-way ANOVA). |
In silico Analysis Based on Online Available Databases
To verify the significance of the presented results, an in silico analysis of data obtained from the online database (http://kmplot.com/analysis/) was performed. The assessment was based on the level of mRNA expression for FHOD1 among patients diagnosed with lung adenocarcinoma. The analysis showed that a low level of formin increases the median survival of patients (103 vs. 96.2 months for the identified low and high levels of the protein, respectively) (Figure 8A). Similarly, among smokers, the mean survival is higher for patients with lower FHOD1 expression (54.17 months) compared to the second group (36 months) (Figure 8B). In the case of non-smokers, it was 88.70 vs. 76 months for patients with identified low and high formin levels, respectively (Figure 8C). The data described above indicate that a lower level of FHOD1 correlates with higher survival rates of patients diagnosed with lung cancer, which may be related to a reduced migration potential of cancer cells and, consequently, a lower probability of metastasis.
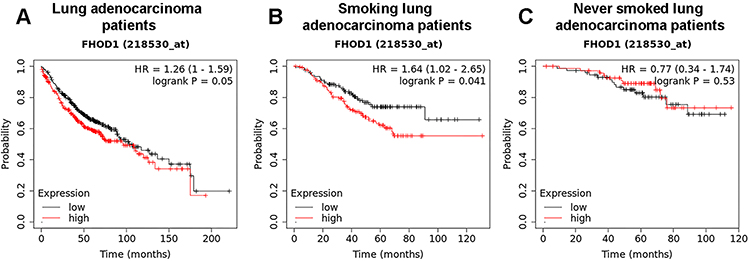 |
Figure 8 FHOD1 mRNA expression in patients with lung adenocarcinoma. Overall survival (OS) of lung adenocarcinoma patients, n=719 (A). OS of smoking lung adenocarcinoma patients, n= 246 (B). OS of never smoked lung adenocarcinoma patients, n=143 (C). |
Discussion
The inhibition of EMT is an attractive target in anti-cancer therapy. It seems that the reduction of the motor properties of cancer cells may be of significant importance in inhibiting the formation of secondary foci, as well as in sensitizing solid tumors to cytostatics.9,28 High hopes are placed on the manipulation of proteins associated with the cytoskeleton, especially ABPs.7 Studies conducted in recent years show that these assumptions are correct. Manipulation of profilin-1 in lung and breast cancer cells and cofilin-1 and gelsolin in colon cancer cells inhibit the proliferation and migration of cells.24,29–31 Therefore, we decided to check the effect of downregulation of the FHOD1 in non-small cell lung cancer A549 cell line. Additionally, we assessed the impact of the low level of FHOD1 expression on the response of A549 cells to the selected compounds.
In the case of the studies on the expression of FHOD1, single reports indicate an important role of this protein in the acquisition of invasive properties. In a study on the MDA-MB−231 and BT−549 TNBCs (triple-negative breast cancer) cell lines, Heuser et al have found that low levels of FHOD1 inhibited cell proliferation and migration.32 Similarly, studies conducted by Jurmeister et al on breast cancer cells with a reduced level of FHOD1 allowed to present its importance in the context of EMT. The author has shown that FHOD1 regulates MLC2, which expression stimulates SRF-dependent transcription while silencing of FHOD1 significantly affects the disturbance and reduction of intracellular accumulation of G-actin, which reduces the motor properties of cells.17 In turn, Gardberg et al have demonstrated the importance of the FHOD1 manipulation in oral squamous cell carcinoma cells. The results presented by the research group suggest that the downregulation of FHOD1 inhibited the migration potential in comparison to control cells. Moreover, the measurements of the FHOD1 level in the clinical material from patients with SCC showed a relationship between its growth and the stage and aggressiveness.16 Based on these reports, FHOD1 seems to play an important role in the structural and functional changes of microfilaments necessary for the transformation of the cell phenotype from epithelial to mesenchymal. Similar observations were made by Peippo et al, who indicated that, depending on the FHOD1 level, melanoma cell lines (WM164 and WM239) were characterized by different migration potential and a degree of invasiveness.33 In our study, we presented that downregulation of FHOD1 in non-small cell lung cancer A549 cell line suppressed migration and invasion potential probably through a decrease in the level of the cytoplasmic vimentin and actin pool. Both proteins are required for cell migration.34–36 Alterations in the organization of these cytoskeleton structures inhibit cell adhesion and induce changes in cell shape and invasive protrusion formation. Alieva et al have reported that the formins family and myosin IIA are involved in filopodia adhesion.37 In turn, Iskratsch et al presented that FHOD1 is required for adhesion and migration of mouse fibroblasts via actin polymerization.38 Similarly, results described by Gauvin et al indicate that the downregulation of another member of the formins family – FLMN3 results in a decrease in the number of cell protrusions and weakening of cell-cell adhesion in U2OS cells.39
Our study enriches the above-mentioned reports on the importance of FHOD1 manipulation in the A549 cell line. To assess the effect of FHOD1 downregulation on A549 sensitivity to the selected compounds, cells were treated with alkaloids. Based on our previous research, we used PL and SAN and their synergistic combination.22 Both compounds are characterized by cytotoxic and anti-migratory properties. It has been documented on various cell lines, including lung, breast, gastric, and prostate cancer.40–44 Additionally, our research shows that compounds of natural origin have a cytotoxic effect on cancer cells and, together with the manipulation of ABPs, may be helpful in therapy. Results presented in this paper indicate that the consequence of downregulation of the level of FHOD1 is inhibition of proliferation and enhanced apoptotic effect of PL and SAN. The increase in the apoptotic cell population can be associated with alterations in the actin network. Literature reports suggest that actin plays a crucial role during cell death via ABPs activity.45,46 The alterations in the filament network include changes in cell shape, the formation of apoptotic blebs, and permeabilization of the mitochondrial membrane.45 Similar observations have been reported by Ménard et al in HeLa cells, which has shown the correlation between FHOD1 and caspase-3 cleavage corresponding to apoptosis. Authors have also revealed that the C-terminal part of FHOD1 suppressed RNA polymerase I transcription. Moreover, they have suggested that alterations in the structure of FHOD1 in HeLa cells influence the interaction of the protein with actin, disrupting the reorganization of the actin cytoskeleton during apoptosis.47 In turn, manipulation of another member of the formins family - FMNL-2 induces apoptosis in the gastric cancer cell line.48 In the case of cell death, the nuclear actin pool and its translocation from/to the cytoplasm may also be of importance. Grzanka et al have shown that changes in the expression level of ABPs: cofilin-1 and a special AT-rich sequence 1 binding protein (SATB1) induce changes in nuclear F-actin and consequently an increase in the subG1 and apoptotic cell population in MCF-7 cells.49 Similar results were obtained by Izdebska et al, who showed that the disturbance of F-actin transport to the nucleus sensitizes cells of the H1299 cell line to the cytotoxic effect of doxorubicin.50 The association of FHOD1 with nuclear actin may indirectly explain the increase in apoptosis. The above-mentioned studies, together with our results, show that FHOD1 is a therapeutically interesting protein in the context of metastasis inhibition and cell death.
Additionally, in our study, the in silico analysis of the publicly accessible data considering the FHOD1 mRNA level in non-small cell lung cancer patients was performed. The values presented in the form of Kaplan-Meier survival graphs suggested that patients diagnosed with lung cancer with low expression of FHOD1 mRNA have a higher survival rate than people with increased levels of the protein. The differences between the group of smokers and non-smokers may result from the fact that tobacco smoke induces oxidative stress.51 This factor may affect the organization of intercellular connections (AJs, TJs) and the cytoskeleton, including actin filaments.52 In the case of basal-like breast cancer tissue, the high level of FHOD1 was also presented.32 Clinical trials show that an increase in mortality in patients with oncological diseases is often associated with the formation of metastases.4 The actin network is involved in this process, while its dynamic is determined by the proteins accompanying microfilaments like formin. The results presented in our work correlate with other studies indicating that a low level of ABPs is associated with the limited motor activity of cancer cells.53
Conclusions
In summary, in this report, we demonstrated for the first time the effects of the downregulation of FHOD1 in non-small cell lung cancer. Manipulation induced the reorganization of microfilament networks, which in turn, was associated with reduced migration and invasive potential of the highly aggressive A549 cells. Moreover, introduced changes in the protein level were able to sensitize the cells to the selected compounds. The presented results and the analysis of online available clinical data indicate the possibility of transferring research from the basic level to in vivo models in the context of ABPs manipulation as a new therapeutic target in oncology.
Acknowledgments
We would like to thank members of the Department of Histology and Embryology CM UMK for technical assistance and helpful discussions.
Funding
This research was supported by statutory activities No. 163 (Nicolaus Copernicus University in Toruń, Faculty of Medicine, Collegium Medicum in Bydgoszcz).
Disclosure
The authors report no conflicts of interest in this work.
References
1. Dillekås H, Rogers MS, Straume O. Are 90% of deaths from cancer caused by metastases? Cancer Med. 2019;8(12):5574–5576. doi:10.1002/cam4.2474
2. Hsu JC, Wei CF, Yang SC, Lin PC, Lee YC, Lu CY. Lung cancer survival and mortality in Taiwan following the initial launch of targeted therapies: an interrupted time series study. BMJ Open. 2020;10:e033427. doi:10.1136/bmjopen-2019-033427
3. U.S. National Institute Of Health, National Cancer Institute. SEER Cancer Statistics Review. 2018;1975–2015.
4. Fares J, Fares MY, Khachfe HH, et al. Molecular principles of metastasis: a hallmark of cancer revisited. Signal Transduct Target Ther. 2020;5:28.
5. Tsai JH, Yang J. Epithelial-mesenchymal plasticity in carcinoma metastasis. Genes Dev. 2013;27(20):2192–2206. doi:10.1101/gad.225334.113
6. Heerboth S, Housman G, Leary M, et al. EMT and tumor metastasis. Clin Transl Med. 2015;4(1):6. doi:10.1186/s40169-015-0048-3
7. Izdebska M, Zielińska W, Grzanka D, Gagat M. The role of actin dynamics and actin-binding proteins expression in epithelial-to-mesenchymal transition and its association with cancer progression and evaluation of possible therapeutic targets. Biomed Res Int. 2018;2018:4578373. doi:10.1155/2018/4578373
8. Svitkina T. The actin cytoskeleton and actin-based motility. Cold Spring Harb Perspect Biol. 2018;10(1):a018267. doi:10.1101/cshperspect.a018267
9. Gross SR. Actin binding proteins: their ups and downs in metastatic life. Cell Adh Migr. 2013;7(2):199–213. doi:10.4161/cam.23176
10. Swaney KF, Li R. Function and regulation of the Arp2/3 complex during cell migration in diverse environments. Curr Opin Cell Biol. 2016;42:63–72. doi:10.1016/j.ceb.2016.04.005
11. Cui J, Cai Y, Hu Y, et al. Epigenetic silencing of TPM2 contributes to colorectal cancer progression upon RhoA activation. Tumour Biol. 2016;37(9):2477–12483. doi:10.1007/s13277-016-5103-1
12. Beghein E, Devriese D, Van Hoey E, Gettemans J. Cortactin and fascin-1 regulate extracellular vesicle release by controlling endosomal trafficking or invadopodia formation and function. Sci Rep. 2018;8(1):15606. doi:10.1038/s41598-018-33868-z
13. Sanematsu F, Kanai A, Ushijima T, et al. Fhod1, an actin-organizing formin family protein, is dispensable for cardiac development and function in mice. Cytoskeleton (Hoboken). 2019;76(2):219–229. doi:10.1002/cm.21523
14. Kawabata Galbraith K, Kengaku M. Multiple roles of the actin and microtubule-regulating formins in the developing brain. Neurosci Res. 2019;138:59–69. doi:10.1016/j.neures.2018.09.008
15. Shi X, Zhao S, Cai J, Wong G, Jiu Y. Active FHOD1 promotes the formation of functional actin stress fibers. Biochem J. 2019;476(20):2953–2963. doi:10.1042/BCJ20190535
16. Gardberg M, Kaipio K, Lehtinen L, et al. FHOD1, a formin upregulated in epithelial-mesenchymal transition, participates in cancer cell migration and invasion. PLoS One. 2013;8(9):e74923. doi:10.1371/journal.pone.0074923
17. Jurmeister S, Baumann M, Balwierz A, et al. MicroRNA-200c represses migration and invasion of breast cancer cells by targeting actin-regulatory proteins FHOD1 and PPM1F. Mol Cell Biol. 2012;32(3):633–651. doi:10.1128/MCB.06212-11
18. Koka S, Neudauer CL, Li X, Lewis RE, McCarthy JB, Westendorf JJ. The formin-homology-domain-containing protein FHOD1 enhances cell migration. J Cell Sci. 2003;116:1745–1755. doi:10.1242/jcs.00386
19. Jung H, Wang S-Y, Yang I-W, et al. Detection and treatment of mycoplasma contamination in cultured cells. Chang Gung Med J. 2003;26(4):250–258.
20. Chou TC, Talalay P. Quantitative-analysis of dose-effect relationships - the combined effects of multiple-drugs or enzyme-inhibitors. Adv Enzyme Regul. 1984;22:27–55. doi:10.1016/0065-2571(84)90007-4
21. Chou TC, Martin N. CompuSyn Software for Drug Combinations and for General Dose Effect Analysis, and User’s Guide. Paramus, NJ, USA: ComboSyn Inc; 2007.
22. Hałas-Wiśniewska M, Zielińska W, Izdebska M, Grzanka A. The synergistic effect of piperlongumine and sanguinarine on the non-small lung cancer. Molecules. 2020;25(13):3045. doi:10.3390/molecules25133045
23. Gagat M, Grzanka D, Izdebska M, Grzanka A. Effect of L-homocysteine on endothelial cell-cell junctions following F-actin stabilization through tropomyosin-1 overexpression. Int J Mol Med. 2013;32(1):115–129. doi:10.3892/ijmm.2013.1357
24. Gagat M, Hałas-Wiśniewska M, Zielińska W, Izdebska M, Grzanka D, Grzanka A. The effect of piperlongumine on endothelial and lung adenocarcinoma cells with regulated expression of profilin-1. Onco Targets Ther. 2018;11:8275–8292. doi:10.2147/OTT.S183191
25. Izdebska M, Gagat M, Grzanka A. Overexpression of lamin B1 induces mitotic catastrophe in colon cancer LoVo cells and is associated with worse clinical outcomes. Int J Oncol. 2018;52(1):89–102. doi:10.3892/ijo.2017.4182
26. Nagy Á, Lánczky A, Menyhárt O, Győrffy B. Validation of miRNA prognostic power in hepatocellular carcinoma using expression data of independent datasets. Sci Rep. 2018;8(1):9227. doi:10.1038/s41598-018-27521-y
27. Gyorffy B, Surowiak P, Budczies J, Lanczky A, Chellappan SP. Online survival analysis software to assess the prognostic value of biomarkers using transcriptomic data in non-small-cell lung cancer. PLoS One. 2013;8(12):e82241. doi:10.1371/journal.pone.0082241
28. Popper HH. Progression and metastasis of lung cancer. Cancer Metastasis Rev. 2016;35(1):75–91. doi:10.1007/s10555-016-9618-0
29. Ding Z, Joy M, Bhargava R, et al. Profilin-1 downregulation has contrasting effects on early vs late steps of breast cancer metastasis. Oncogene. 2014;33(16):2065–2074. doi:10.1038/onc.2013.166
30. Su J, Zhou Y, Pan Z, et al. Downregulation of LIMK1-ADF/cofilin by DADS inhibits the migration and invasion of colon cancer. Sci Rep. 2017;7:45624. doi:10.1038/srep45624
31. Li W, Yang M, Hong X, et al. Overexpression of gelsolin reduces the proliferation and invasion of colon carcinoma cells. Mol Med Rep. 2016;14(4):3059–3065. doi:10.3892/mmr.2016.5652
32. Heuser VD, Mansuri N, Mogg J, et al. Formin proteins FHOD1 and INF2 in triple-negative breast cancer: association with basal markers and functional activities. Breast Cancer (Auckl). 2018;12:1178223418792247. doi:10.1177/1178223418792247
33. Peippo M, Gardberg M, Lamminen T, Kaipio K, Carpen O, Heuser VD. FHOD1 formin is upregulated in melanomas and modifies proliferation and tumor growth. Exp Cell Res. 2017;350(1):267–278. doi:10.1016/j.yexcr.2016.12.004
34. Chen S, Hourwitz MJ, Campanello L, Fourkas JT, Losert W, Parent CA. Actin cytoskeleton and focal adhesions regulate the biased migration of breast cancer cells on nanoscale asymmetric sawteeth. ACS Nano. 2019;13:1454–1468. doi:10.1021/acsnano.8b07140
35. Ritch SJ, Brandhagen BN, Goyeneche AA, Telleria CM. Advanced assessment of migration and invasion of cancer cells in response to mifepristone therapy using double fluorescence cytochemical labeling. BMC Cancer. 2019;19(1):376. doi:10.1186/s12885-019-5587-3
36. Strouhalova K, Přechová M, Gandalovičová A, Brábek J, Gregor M, Rosel D. Vimentin intermediate filaments as potential target for cancer treatment. Cancers (Basel). 2020;12(1):84. doi:10.3390/cancers12010184
37. Alieva NO, Efremov AK, Hu S, et al. Myosin IIA and formin dependent mechanosensitivity of filopodia adhesion. Nat Commun. 2019;10(1):3593. doi:10.1038/s41467-019-10964-w
38. Iskratsch T, Yu C-H, Mathur A, et al. FHOD1 is needed for directed forces and adhesion maturation during cell spreading and migration. Dev Cell. 2013;27(5):545–559. doi:10.1016/j.devcel.2013.11.003
39. Gauvin TJ, Young LE, Higgs HN, Pollard TD. The formin FMNL3 assembles plasma membrane protrusions that participate in cell–cell adhesion. Mol Biol Cell. 2015;26(3):467–477. doi:10.1091/mbc.E14-07-1247
40. Xu J-Y, Meng Q-H, Chong Y, et al. Sanguinarine is a novel VEGF inhibitor involved in the suppression of angiogenesis and cell migration. Mol Clin Oncol. 2013;1(2):331–336. doi:10.3892/mco.2012.41
41. Dong XZ, Song Y, Lu YP, Hu Y, Liu P, Zhang L. Sanguinarine inhibits the proliferation of BGC-823 gastric cancer cells via regulating miR-96-5p/miR-29c-3p and the MAPK/JNK signaling pathway. J Nat Med. 2019;73:777–788. doi:10.1007/s11418-019-01330-7
42. Gaziano R, Moroni G, Buè C, Miele MT, Sinibaldi-Vallebona P, Pica F. Antitumor effects of the benzophenanthridine alkaloid sanguinarine: evidence and perspectives. World J Gastrointest Oncol. 2016;8:30–39. doi:10.4251/wjgo.v8.i1.30
43. Chen D, Ma Y, Guo Z, et al. Two natural alkaloids synergistically induce apoptosis in breast cancer cells by inhibiting STAT3 activation. Molecules. 2020;25(1):216. doi:10.3390/molecules25010216
44. Kismali G, Ceylan A, Meral O, et al. Piperlongumine inhibits cell growth and enhances TRAIL-induced apoptosis in prostate cancer cells. Asian Pac J Trop Biomed. 2020;10(5):216–223. doi:10.4103/2221-1691.281465
45. Desouza M, Gunning PW, Stehn JR. The actin cytoskeleton as a sensor and mediator of apoptosis. Bioarchitecture. 2012;2(3):75–87. doi:10.4161/bioa.20975
46. Grzanka D, Gagat M, Izdebska M. Actin is required for cellular death. Acta Histochem. 2013;115(8):775–782. doi:10.1016/j.acthis.2013.04.002
47. Ménard I, Gervais FG, Nicholson DW, Roy S. Caspase-3 cleaves the formin-homology-domain-containing protein FHOD1 during apoptosis to generate a C-terminal fragment that is targeted to the nucleolus. Apoptosis. 2006;11(11):1863–1876. doi:10.1007/s10495-006-0087-8
48. Zhong B, Wang K, Xu H, Kong F. Silencing formin-like 2 inhibits growth and metastasis of gastric cancer cells through suppressing internalization of integrins. Cancer Cell Int. 2018;18(1):79. doi:10.1186/s12935-018-0576-1
49. Grzanka D, Izdebska M, Klimaszewska-Wisniewska A, Gagat M. The alterations in SATB1 and nuclear F-actin expression affect apoptotic response of the MCF-7 cells to geldanamycin. Folia Histochem Cytobiol. 2015;53(1):79–87. doi:10.5603/FHC.a2015.0008
50. Izdebska M, Gagat M, Grzanka D, Halas M, Grzanka A. The role of exportin 6 in cytoskeletal-mediated cell death and cell adhesion in human non-small-cell lung carcinoma cells following doxorubicin treatment. Folia Histochem Cytobiol. 2014;52(3):195–205. doi:10.5603/FHC.2014.0023
51. Lu Y, Ward SC, Cederbaum AI. Nicotine enhances ethanol-induced fat accumulation and collagen deposition but not inflammation in mouse liver. Alcohol. 2013;47(5):353–357. doi:10.1016/j.alcohol.2013.04.004
52. Yao Y, Lacroix D, Mak AFT. Effects of oxidative stress-induced changes in the actin cytoskeletal structure on myoblast damage under compressive stress: confocal-based cell-specific finite element analysis. Biomech Model Mechanobiol. 2016;15(6):1495–1508. doi:10.1007/s10237-016-0779-0
53. Vermillion KL, Lidberg KA, Gammill LS. Expression of actin-binding proteins and requirement for actin-depolymerizing factor in chick neural crest cells. Dev Dyn. 2014;243(5):730–738. doi:10.1002/dvdy.24105
 © 2021 The Author(s). This work is published and licensed by Dove Medical Press Limited. The full terms of this license are available at https://www.dovepress.com/terms.php and incorporate the Creative Commons Attribution - Non Commercial (unported, v3.0) License.
By accessing the work you hereby accept the Terms. Non-commercial uses of the work are permitted without any further permission from Dove Medical Press Limited, provided the work is properly attributed. For permission for commercial use of this work, please see paragraphs 4.2 and 5 of our Terms.
© 2021 The Author(s). This work is published and licensed by Dove Medical Press Limited. The full terms of this license are available at https://www.dovepress.com/terms.php and incorporate the Creative Commons Attribution - Non Commercial (unported, v3.0) License.
By accessing the work you hereby accept the Terms. Non-commercial uses of the work are permitted without any further permission from Dove Medical Press Limited, provided the work is properly attributed. For permission for commercial use of this work, please see paragraphs 4.2 and 5 of our Terms.