")
Back to Journals » OncoTargets and Therapy » Volume 11
Downregulation of CPT2 promotes tumorigenesis and chemoresistance to cisplatin in hepatocellular carcinoma
Authors Lin MH, Lv D, Zheng YL, Wu ML, Xu C, Zhang Q, Wu LH
Received 21 January 2018
Accepted for publication 26 March 2018
Published 25 May 2018 Volume 2018:11 Pages 3101—3110
DOI https://doi.org/10.2147/OTT.S163266
Checked for plagiarism Yes
Review by Single anonymous peer review
Peer reviewer comments 2
Editor who approved publication: Prof. Dr. Geoffrey Pietersz
Meihua Lin, Duo Lv, Yunliang Zheng, Minglan Wu, Chang Xu, Qiao Zhang, Lihua Wu
Research Center of Clinical Pharmacy, State Key Laboratory for Diagnosis and Treatment of Infectious Disease, First Affiliated Hospital, Zhejiang University, Hangzhou, China
Background: Cancer cells often have characteristic changes in metabolism. Besides Warburg effect, abnormal lipid metabolism is also considered as one of the most typical metabolic symbols of cancer. Thus, understanding the mechanisms of cell metabolic reprogramming may provide a potential avenue for cancer treatment.
Materials and methods: In total, 41 pairs of matched samples of primary hepatocellular carcinoma (HCC) and adjacent non-cancerous liver tissues were collected. Afterward, we performed quantitative reverse transcriptase polymerase chain reaction to investigate carnitine palmitoyltransferase-2 (CPT2) expression and then systematically analyzed its relationship with clinicopathologic features. We further performed proliferation, colony formation, migration and invasion, drug resistance, and lipogenesis assays to determine the function of CPT2 in HCC.
Results: In this study, we have identified CPT2 which is the rate-limiting enzyme of fatty acid oxidation, downregulated in HCC and was significantly associated with tumor histological differentiation and venous invasion. In vitro studies demonstrated that knockdown of CPT2 remarkably enhanced the tumorigenic activity and metastatic potential of hepatoma cells. In addition, CPT2 silencing induced chemoresistance to cisplatin. Mechanistically, low expression of CPT2 promoted cancer cell lipogenesis via upregulation of stearoyl-CoA desaturase-1, the key enzyme involved in the synthesis of monounsaturated fatty acids, at both mRNA and protein levels in hepatoma cell line.
Conclusion: Altogether, our findings demonstrate that CPT2 has a critical role in HCC progression and chemoresistance and may potentially serve as a novel prognostic marker and therapeutic target for HCC treatment.
Keywords: lipid metabolism, CPT2, HCC, SCD1, chemoresistance
Introduction
Hepatocellular carcinoma (HCC) is one of the most common malignant tumors and the leading cause of cancer-related deaths in the world.1 Although the death rate of HCC has decreased with advances in prevention, surgical resection, and targeted therapies, there are still ~1,000,000 new cases every year. The prognosis of HCC is very poor, and the 5-year survival rate worldwide remains low, mainly because of a high potential for vascular invasion, metastasis, drug resistance, and recurrence even after surgical resection.2,3 Therefore, there is an urgent need to further understand the molecular mechanism underlying HCC and identify novel treatment strategies that may help overcome drug resistance.
Aberrant lipid metabolism has been increasingly recognized as an emerging hallmark of cancer cells, which could clarify the pathogenesis and provide potential targets for novel and specific cancer therapies.4 Lipogenesis signaling is continuously activated in cancer cells and provides cells with membrane building blocks, signaling lipid molecules, and post-translational modification of proteins to support cellular transformation and cancer progression.5,6 In HCC, activation of lipogenesis is detected in tumor tissues characterized by an aggressive phenotype.7–9 However, mechanisms underlying the increased lipogenesis in cancers have not yet been completely clarified. Furthermore, a recent work has highlighted the importance of fatty acid oxidation (FAO) to cellular energy homeostasis in cancer metabolism.32 The carnitine palmitoyltransferase-1 and -2 (CPT1 and CPT2) are two genetically distinct mitochondrial membrane-bound enzymes and play critical role in the regulation of FAO in normal cells.10 A few recent reports have shown that CPT1, a rate-limiting enzyme of FAO, regulates apoptosis and cancer development and that blocking CPT1 may be a potential therapeutic strategy.11,12
In this study, we investigated the potential role of CPT in HCC. Unexpectedly, CPT2, being another key regulatory enzyme of FAO, but not CPT1A (the liver isoform of CPT1) expression is significantly decreased in HCC tissues, most obviously in poorly differentiated group. Downregulated CPT2 promotes hepatoma cell proliferation, migration, invasion, and chemoresistance to cisplatin. Furthermore, CPT2 influenced the lipid metabolic pathway. Our study is the first to apply histopathology to analyze CPT2 expression in tumor tissues and to show that a reduction in CPT2 expression is associated with lipogenesis in HCC. Our work offers a novel approach for understanding aberrant lipogenic metabolism in HCC and provides a promising diagnostic and prognostic biomarker for HCC.
Materials and methods
Patients and tissue samples
Matched samples of primary HCC and adjacent non-cancerous liver tissues were retrieved from the archive of the First Affiliated Hospital of Zhejiang University (Hangzhou, China) from 2010 to 2013. Clinical and pathological data, including age, tumor size, tumor stage, histological grading, tumor encapsulation, and venous invasion were reviewed retrospectively. The tumor stages were categorized according to the tumor-node-metastasis system by American Joint Committee on Cancer or the Barcelona Clinic Liver Cancer staging classification system. Written informed consents were obtained from all patients. The study protocol was reviewed and approved by the ethics committee of the First Affiliated Hospital of Zhejiang University (Hangzhou, China). For the protein expression studies, 17 pairs of primary HCC samples were collected from the Key Laboratory of Combined Multi-organ Transplantation, Ministry of Public Health, First Affiliated Hospital of Zhejiang University (Hangzhou, China).
Cell lines and cell culture
HCC cell lines HepG2, Huh7, SMMC-7721, HCC-LM3, and SK-Hep1 were kindly donated by the Key Laboratory of Combined Multi-organ Transplantation, Ministry of Public Health, First Affiliated Hospital of Zhejiang University (Hangzhou, China). And the use of gifted cell lines was reviewed and approved by the ethics committee of the First Affiliated Hospital of Zhejiang University (Hangzhou, China). SMMC-7721 cell was cultured in RPMI-1640 containing 10% fetal bovine serum. The other cell lines were cultured in minimum essential medium supplemented with 10% fetal bovine serum. All cells were incubated in a humidified atmosphere of 5% CO2 incubator at 37°C.
Plasmid transfection
The siRNA-1 sequence (CCAGTGAGAACCGAGACAT) and siRNA-2 sequence (TCTTGAATGATGGCCAGTT), which respectively matches 875-893 and 212-230 nucleotides of CPT2 (NM_000098), were separately subcloned into eukaryotic expression vectors purchased from Genechem (Shanghai, China, containing hU6-MCS-ubiquitin-EGFP-IRES-puromycin elements) to construct shRNA-1 and shRNA-2. Lentivirus was produced by using the plasmids and applied to infect HepG2 cells, according to the manufacturer’s instructions.
RNA extraction and quantitative reverse transcriptase polymerase chain reaction (qRT-PCR)
Total RNA was extracted by using RNeasy Mini kit (Qiagen NV, Venlo, the Netherlands) and reverse transcription PCR was performed using PrimeScript™ II 1st Strand cDNA Synthesis Kit (Takara, Shiga, Japan) according to the manufacturer’s instructions. For qRT-PCR, the cDNA was amplified by using SYBR® Premix Ex Taq™ II (Tli RNaseH Plus; Takara) and Roche LightCycler®480 (Hoffman-La Roche Ltd., Basel, Switzerland). All the primers used in this study were synthesized by Sangon Biotech (Shanghai, China), and the primer sequences are listed in Table 1.
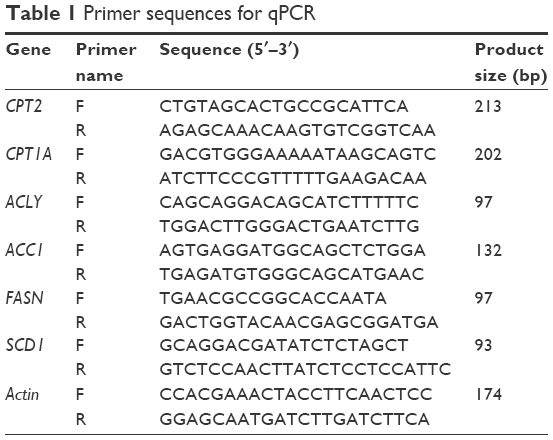 | Table 1 Primer sequences for qPCR |
Western blot assays
Total protein was extracted from the indicated cells by using RIPA buffer (Beyotime, Shanghai, China) at 4°C. After centrifugation at 14,000 g for 15 minutes at 4°C, the protein concentrations of supernatants were measured by the BCA protein assay (Rockford, IL, USA). Equal amounts of protein lysates were separated by 10% sodium dodecyl sulfate polyacrylamide gel electrophoresis and transferred onto polyvinyl difluoride membrane. The blots were probed with the following specific primary antibodies: β-actin (1:5,000, ab8227; Abcam, Cambridge, MA, USA), CPT2 (1:1,000, ab181114; Abcam), and SCD1 (1:1,000, #2438; CST, Danvers, MA, USA). Immunodetection was carried out by Luminol Enhancer Solution (Thermo Fisher Scientific, Waltham, MA, USA), and scanned by ChemiScope Western Blot image system (CLiNX Science Instruments, Co., Ltd., Shanghai, China).
Immunohistochemistry
Immunohistochemistry staining was performed by using paired paraffin-embedded tissues from 17 primary HCC patients. Briefly, the tissue block was cut into 4 μm sections, deparaffinized, and rehydrated. Antigen retrieval was done in 10 mmol/L citric acid buffer (pH 6.0) in a 750 W microwave for 15 minutes. After staining with anti-CPT2 antibody (1:500; ab181114; Abcam) overnight at 4°C, the slides were washed in phosphate-buffered saline (PBS) and then incubated with secondary antibody for 30 minutes. The slides were rinsed in PBS, incubated with DAB for 2 minutes, then rinsed gently in distilled water, and counterstained with hematoxylin. Negative control slides were also stained in parallel by using an isotypic antibody at the same concentration as the primary antibody. All slides were scanned by using the NDPview 2 system (Hamamatsu Photonics K. K., Systems Division, Hamamatsu, Japan). The extent of CPT2 staining was scored by assigning the staining area and intensity of positive tumor cells (0, negative; 1, weak; 2, moderate; 3, strong).
Cell proliferation and colony formation assay
For cell proliferation assay, 5×10³ cells/well were seeded in 96-well plate, and cell growth rate was assessed by Cell Counting Kit-8 (Beyotime). For colony formation assay, 6×10³ infected HepG2 cells were placed in 6 cm dish. After 15 days of incubation, the surviving colonies were fixed, stained with crystal violet, and counted. The experiments were carried out three times independently.
In vitro wound healing assay
For wound healing assay, cells were seeded in 6-well plate (1×10⁶ cells/well). After reaching appropriate 90% confluency, a 1 ml pipette tip was applied to produce a wound line on the cell monolayer. Image were captured at 0 and 48 h by microscopy to assess the rate of gap closure. The distance between two edges was measured by ImageJ software (NIH, USA). The results show that wound closure rate = (0 h scratch width−24 h/48 h scratch width)/0 h scratch width × 100%.
Transwell invasion assay
The invasion ability assay was performed by using transwell chambers with pore size of 8.0 μm (EMD Millipore, Billerica, MA, USA). Filters for invasion assays were coated with Matrigel (BD Biosciences, San Jose, CA, USA) in the upper compartment before cell seeding. A total of 1×10⁵ cells were suspended in 200 μL of serum-free medium and seeded in the upper chamber, while 800 μL of medium with 20% FBS was added to the lower compartment. After 48 h, the total invasive cells on the bottom surface were stained with Wright-Giemsa Stain kit according to the instruction (Nanjing JianCheng Technology Co., Ltd, Nanjing, China). The invading cells were photographed by using NDPview2 and counted.
Cell viability assay
Cell viability was determined with the 3-(4,5-dimethyl-2-thiazolyl)-2,5-diphenyl-2H-tetrazolium bromide (MTT) assay (Sigma-Aldrich Co., St Louis, MO, USA). Cells (1×10⁴ cells per well) were seeded in flat-bottom 96-well plates. After incubation for 16 h, cells were treated with varying concentrations of cisplatin (Qilu Pharmaceutical Co., Ltd., Shandong, China) for 72 h. Then 20 μL MTT solution (5 mg/mL) was added to each well, followed by 4 h incubation at 37°C. Absorbance at 595 nm was measured by using a multimode detector (Beckman Coulter, Inc., Indianapolis, IN, USA). Relative cell viability was calculated as a percentage of untreated controls. Drug sensitivity was determined and expressed as the half inhibitory concentration (IC50), using standard curve-fitting routines (GraphPad Software, Inc., La Jolla, CA, USA).
Quantification of triglycerides (TGs), cholesterol, and phospholipid (PL)
Intracellular TG, cholesterol, and PL content were assayed by using a tissue TG assay kit (GPO-POD; Applygen Technologies Inc., Beijing, China), tissue total cholesterol assay kit (GPO-POD; Applygen Technologies Inc.), and EnzyChrom™ PL assay kit (BioAssay Systems, Hayward, CA, USA), respectively, with detailed experimental procedure provided in the kit.
Oil red O staining
Cells were seeded in six-well plate till reaching the confluence of 80% and incubated at 37°C in a 5% carbon dioxide incubator. The cell layers were fixed and stained with Oil red O staining kit according to the manufacturer’s instruction (Solarbio, Beijing, China).
Statistical analysis
Data are displayed as means ± standard deviation (SD). Statistical analyses were made with SPSS 19.0 program (IBM Corporation, Armonk, NY, USA) and GraphPad Prism 5 (GraphPad Software Inc.). Analysis of variance and Student’s t-test were used to determine the statistical significance of the differences between experimental groups. The relationship between CPT2 expression and clinicopathological variables was assessed by the chi-square test. A value of P<0.05 was considered statistically significant.
Ethical approval
All procedures performed in studies involving human participants were in accordance with the ethical standards of the institution of The First Affiliated Hospital of Zhejiang University. For this type of retrospective study, formal consent is not required.
Results
CPT2 was frequently downregulated in HCC tissues and cell lines
Expression of CPT1A and CPT2 in 41 pairs of HCC and their corresponding non-tumorous liver tissues were analyzed by qPCR. CPT2 transcripts (defined as a ≤2.0-fold decrease) were frequently (58.5%, 24/41) downregulated in the HCC tissues as compared with the non-tumorous tissues. Moreover, the transcript levels of CPT2 were significantly lower in most (83.3%, 15/18) poorly differentiated HCC tissue samples, compared with that in well and moderately differentiated HCC tissues (39.1%, 9/23) (P=0.0005; Figure 1A). However, there was no difference of CPT1A expression between these two groups (data not shown). We further assessed the expression level of CPT2 in normal human hepatocytes (LO2) and different types of HCC cell lines (HepG2, Huh7, SMMC-7721, HCC-LM3, and SK-Hep1).13–15 Consistently, we found that CPT2 was significantly downregulated in poorly differentiated HCC cell lines (HCC-LM3 and SK-Hep1) (Figure 1B). The immunohistochemistry studies performed with paraffin-embedded HCC specimens confirmed the downregulation of CPT2 in HCC, particularly in the most poorly differentiated HCC tissues and suggested a diffuse cytosolic cellular staining pattern (Figure 1C–F). These results suggest that CPT2 expression was decreased in HCC.
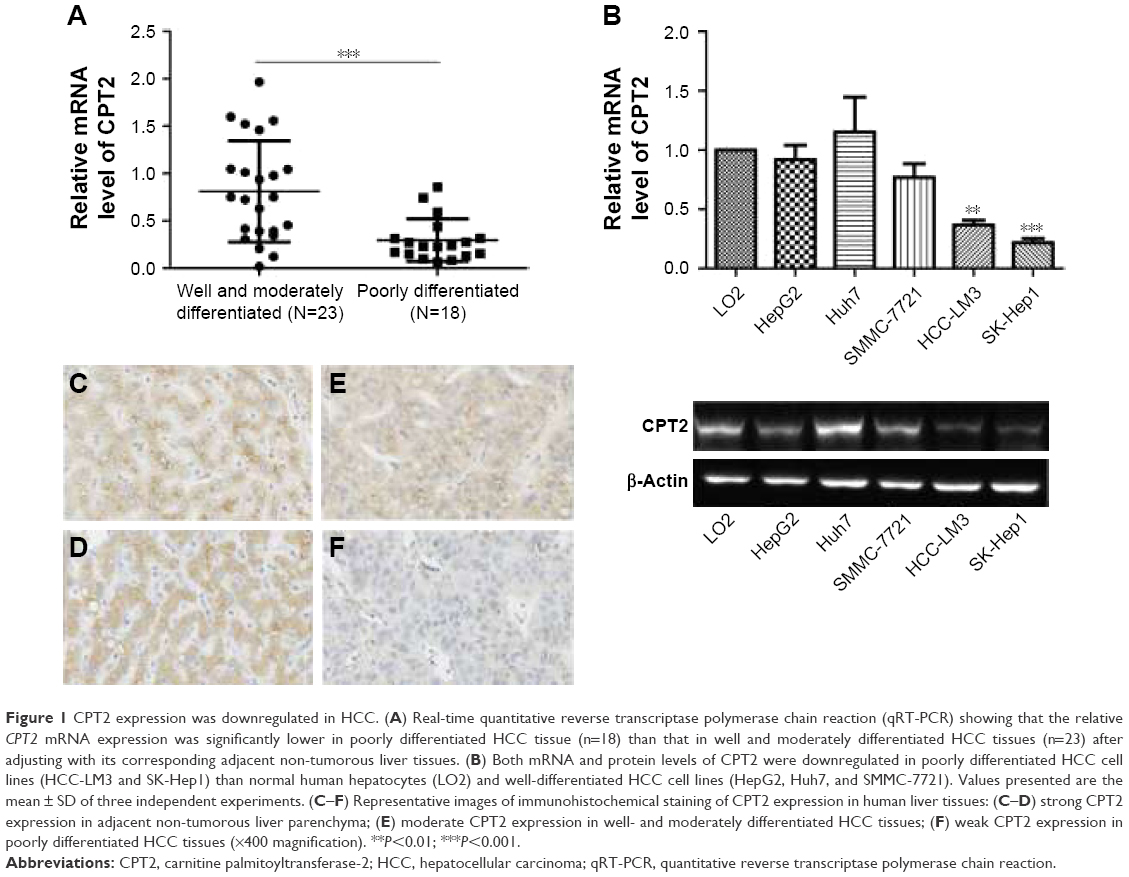 | Figure 1 CPT2 expression was downregulated in HCC. (A) Real-time quantitative reverse transcriptase polymerase chain reaction (qRT-PCR) showing that the relative CPT2 mRNA expression was significantly lower in poorly differentiated HCC tissue (n=18) than that in well and moderately differentiated HCC tissues (n=23) after adjusting with its corresponding adjacent non-tumorous liver tissues. (B) Both mRNA and protein levels of CPT2 were downregulated in poorly differentiated HCC cell lines (HCC-LM3 and SK-Hep1) than normal human hepatocytes (LO2) and well-differentiated HCC cell lines (HepG2, Huh7, and SMMC-7721). Values presented are the mean ± SD of three independent experiments. (C–F) Representative images of immunohistochemical staining of CPT2 expression in human liver tissues: (C–D) strong CPT2 expression in adjacent non-tumorous liver parenchyma; (E) moderate CPT2 expression in well- and moderately differentiated HCC tissues; (F) weak CPT2 expression in poorly differentiated HCC tissues (×400 magnification). **P<0.01; ***P<0.001. |
Downregulated CPT2 expression was associated with vascular invasion and tumor differentiation in HCC
The correlation of CPT2 expression with HCC clinicopathological features was analyzed statistically by using qPCR data from 41 pairs of informative HCC clinical samples. As shown in Table 2, lower CPT2 expression was significantly associated with the presence of vascular invasion (P=0.008) and poor tumor differentiation (P=0.010), whereas no significant relevance was found with age, HBV, α-fetoprotein, tumor size, tumor encapsulation, or tumor stage.
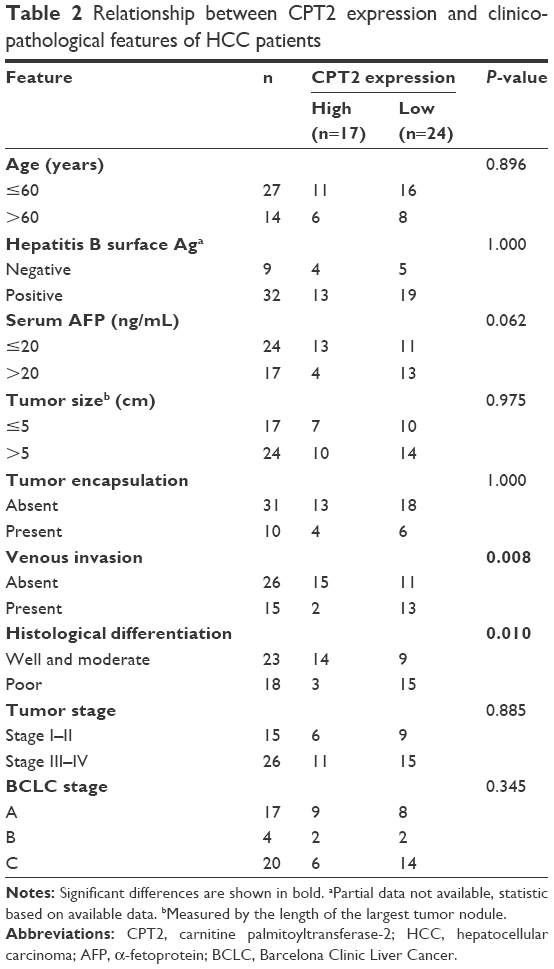 | Table 2 Relationship between CPT2 expression and clinicopathological features of HCC patients |
CPT2-depleted HepG2 cells displayed increased cell proliferation, metastasis capabilities, and chemoresistance to cisplatin
To directly investigate the biological functions of CPT2 in cell proliferation, migration, invasion, and resistance to chemotherapy, CPT2 was stably and specifically silenced in HepG2 cells by two different shRNAs (Figure 2A). For exploring the effect of CPT2 on the growth properties, we conducted a cell proliferation and colony formation assay. CPT2 silencing HepG2 cells showed increased growth rates (Figure 2B) and greater colony-forming abilities (Figure 2C) than its control group. Then, the effect of CPT2 on hepatoma cell motility was further studied. In vitro wound healing assays demonstrated that CPT2-depleted cells filled up the wound faster as compared with control cells (Figure 2D). Two-chamber transwell assay was further employed to determine the effects of CPT2 on the invasion capability of HepG2 cells. As shown in Figure 2E, knockdown of CPT2 clearly enhanced the HepG2 cell invasion. Collectively, these results provide evidence that reduction of CPT2 was capable of promoting HCC proliferation and metastasis in vitro. Moreover, an MTT assay was performed to assess the chemosensitivity of CPT2-depleted HepG2 cells. Dose-dependent cell viability was measured 72 h after drug treatment. Compared with control group, CPT2-repressing HepG2 cells exhibited much more resistance to cell death induced by cisplatin (Figure 2F) and a higher IC50 (2.96±1.02 and 2.91±1.04 vs 2.09±1.03, P=0.03).
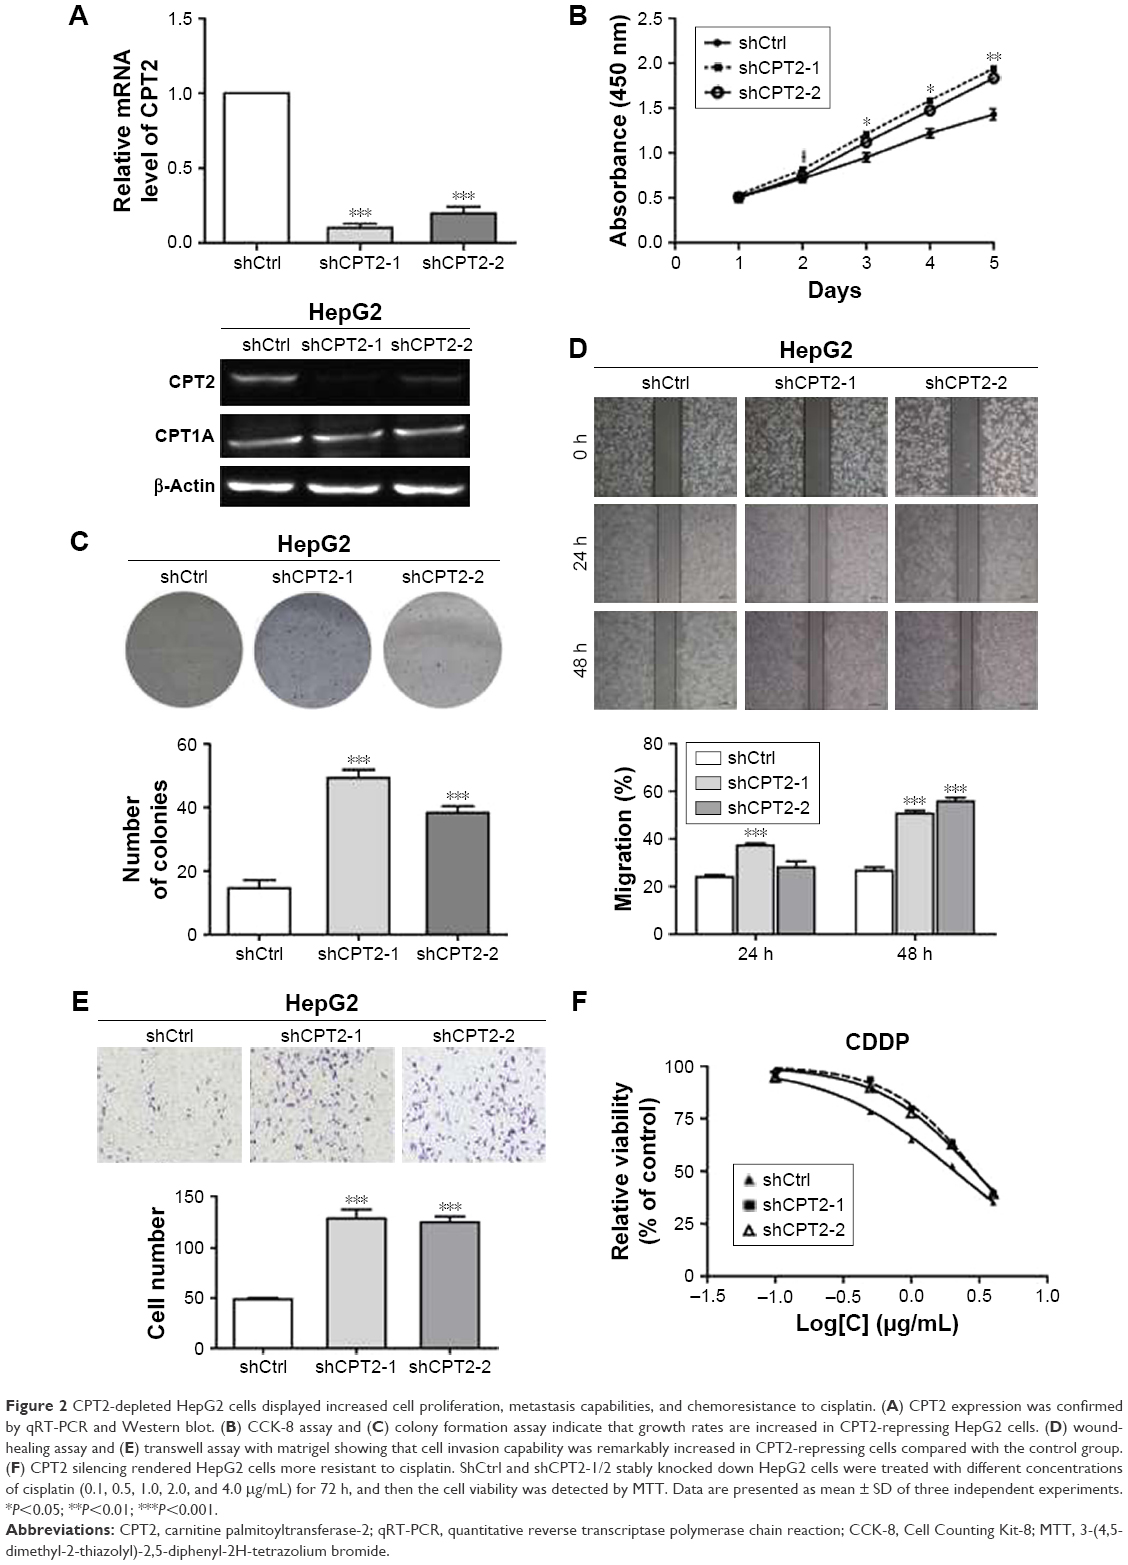 | Figure 2 CPT2-depleted HepG2 cells displayed increased cell proliferation, metastasis capabilities, and chemoresistance to cisplatin. (A) CPT2 expression was confirmed by qRT-PCR and Western blot. (B) CCK-8 assay and (C) colony formation assay indicate that growth rates are increased in CPT2-repressing HepG2 cells. (D) wound-healing assay and (E) transwell assay with matrigel showing that cell invasion capability was remarkably increased in CPT2-repressing cells compared with the control group. (F) CPT2 silencing rendered HepG2 cells more resistant to cisplatin. ShCtrl and shCPT2-1/2 stably knocked down HepG2 cells were treated with different concentrations of cisplatin (0.1, 0.5, 1.0, 2.0, and 4.0 μg/mL) for 72 h, and then the cell viability was detected by MTT. Data are presented as mean ± SD of three independent experiments. *P<0.05; **P<0.01; ***P<0.001. |
CPT2 silencing significantly increased the level of lipogenesis in HepG2 cells
As the development of HCC is accompanied by abnormal lipid metabolism and CPT2 is one of the rate-limiting enzymes of fatty acid β-oxidation, we hypothesized that CPT2 might be involved in the regulation of aberrant lipid metabolism in HCC cells. So first, we evaluated the effect of CPT2 on lipid content in HepG2 cells. Our data showed that HepG2 cells with CPT2 knockdown had significantly increased levels of intracellular TG, cholesterol, and PLs, compared to control cells (Figure 3A–C). These results were further supported by cellular staining with the Oil Red O staining, indicating that lipid droplets in CPT2-repressing HepG2 cells were much more and larger than those in control cells (Figure 3D). These findings strongly suggested that CPT2 could promote the reprograming of lipid metabolism in HCC cells.
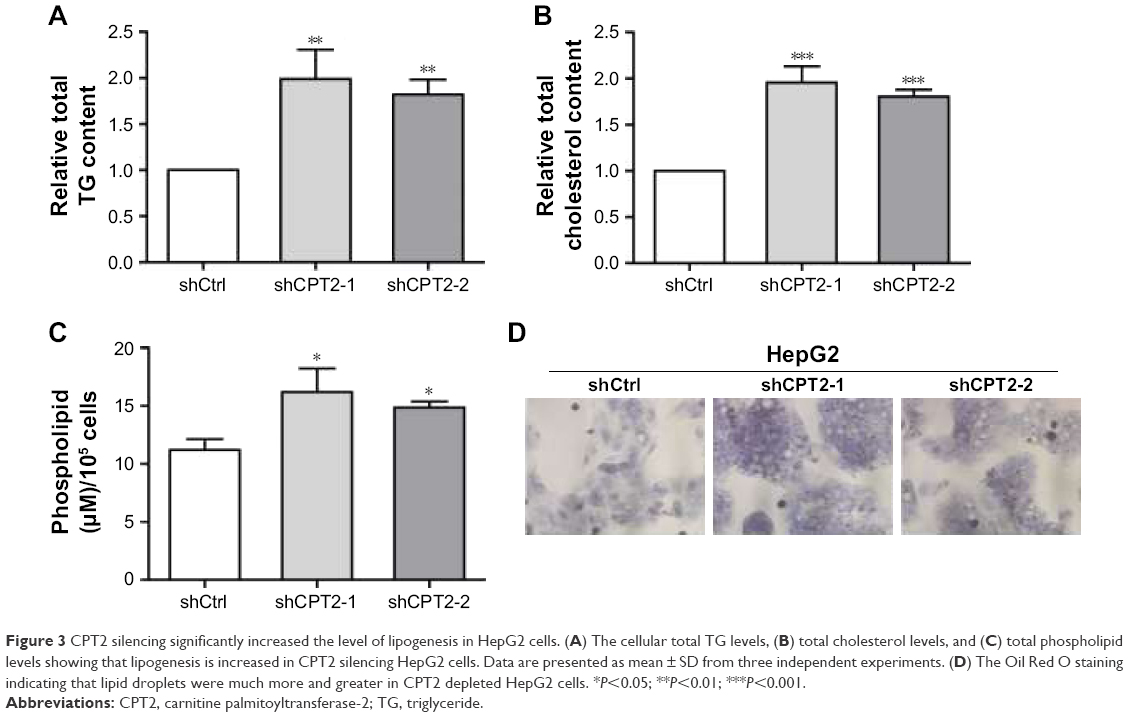 | Figure 3 CPT2 silencing significantly increased the level of lipogenesis in HepG2 cells. (A) The cellular total TG levels, (B) total cholesterol levels, and (C) total phospholipid levels showing that lipogenesis is increased in CPT2 silencing HepG2 cells. Data are presented as mean ± SD from three independent experiments. (D) The Oil Red O staining indicating that lipid droplets were much more and greater in CPT2 depleted HepG2 cells. *P<0.05; **P<0.01; ***P<0.001. |
CPT2-depleted HepG2 cells promoted lipogenesis via the upregulation of SCD1 expression
To find out more about how CPT2 influences the process of lipogenesis, we analyzed the key lipogenic enzymes including ACLY, ACC1, FASN, and SCD1 in CPT2-repressing HepG2 cells. Our results indicated that the expression level of SCD1 was significantly increased at both mRNA and protein levels in HepG2 CPT2 knockdown cells when compared to control cells (Figure 4A and B).
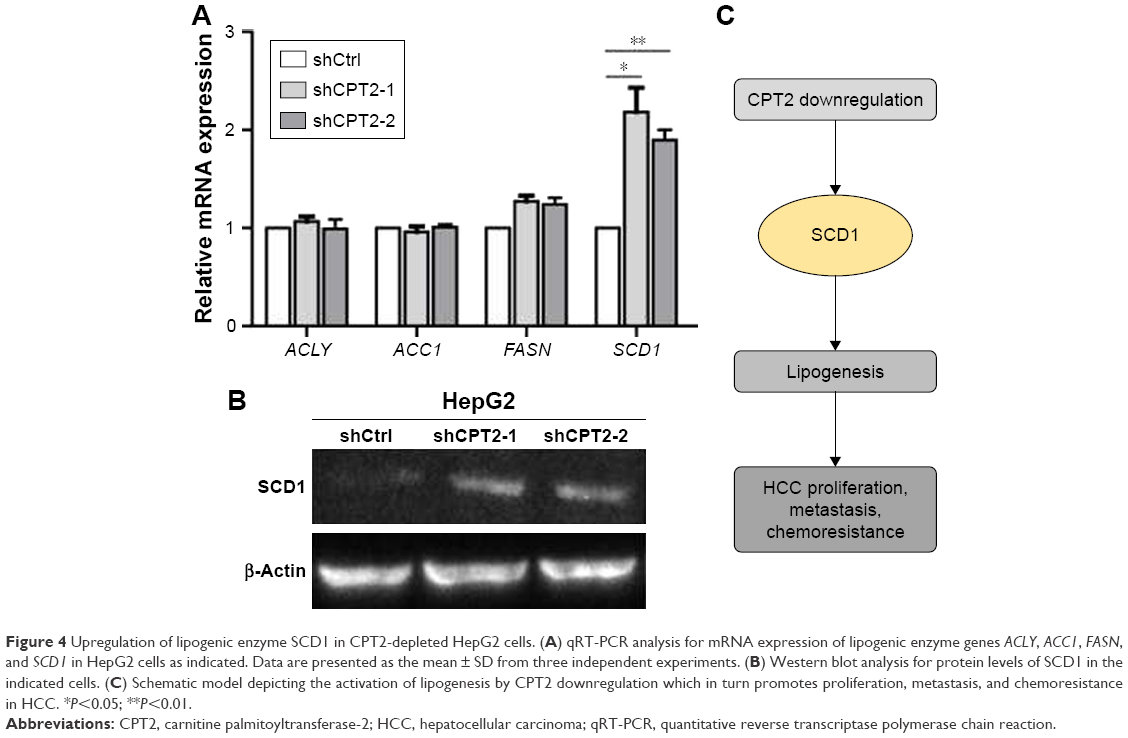 | Figure 4 Upregulation of lipogenic enzyme SCD1 in CPT2-depleted HepG2 cells. (A) qRT-PCR analysis for mRNA expression of lipogenic enzyme genes ACLY, ACC1, FASN, and SCD1 in HepG2 cells as indicated. Data are presented as the mean ± SD from three independent experiments. (B) Western blot analysis for protein levels of SCD1 in the indicated cells. (C) Schematic model depicting the activation of lipogenesis by CPT2 downregulation which in turn promotes proliferation, metastasis, and chemoresistance in HCC. *P<0.05; **P<0.01. |
Discussion
In this study, we demonstrated that CPT2 expression is significantly decreased in poorly differentiated HCC patients and that low CPT2 expression is highly correlated with several clinicopathological indicators such as tumor differentiation and venous invasion. Functional studies illustrate that CPT2 silencing HepG2 cells facilitate cell proliferation, migration, and invasion. Furthermore, CPT2 repressing cells reduced the sensitivity to cisplatin. Intriguingly, our work indicates that CPT2 is involved in lipogenesis via upregulation of SCD1 expression in HCC.
Cancer cells derive >90% of fatty acids from de novo synthesis during their rapid growth and proliferation, in respective of an abundant supply of extracellular fatty acids.16 Thus, several key lipogenic enzymes are dysregulated and abnormally to enhance de novo lipogenesis of cancer cells. It has been reported that stearoyl-CoA desaturase-1 (SCD1) expression is elevated in several human cancers, chemically induced tumors, as well as in oncogene-transformed cells.17–20 Moreover, SCD1 expression levels are also positively associated with aggressiveness of hepatocarcinoma, prostate, and breast cancer.19,21,22 SCD1 is the rate-limiting enzyme in the catalyzation of saturated fatty acids (SFA) into monounsaturated fatty acids (MUFAs) and thus maintains the balance of the ratio of SFA/MUFA to meet the functional requirements of the cells. MUFAs are used as major substrates for the synthesis of various kinds of lipids including PLs, TGs, and cholesteryl esters, thus facilitating the unremitting membrane biogenesis process ongoing in rapidly replicating cells.23 Furthermore, increased levels of endogenously synthesized MUFA in tumor cells positively correlated with greater capacity for spontaneous metastasis when implanted in mice.24 More recent work done in cellular models of oncogenic transformation confirmed that abnormally increased levels of MUFA is a biochemical hallmark of the carcinogenic process and that this greater MUFA abundance is predominantly caused by elevated SCD1 expression/activity.25,26
Consistently, our results demonstrate that CPT2 deficiency could promote the lipid synthesis of HCC cells through the upregulation of SCD1. Since aggressive cancer cells require lipid for the generation of cellular membranes, and other essential functions, a reduced lipolytic metabolism is expected to sustain tumor progression. A previous study based on genomic profiling shows that CPT1 and fatty acid incorporation into an oxidative pathway is attenuated in four aggressive cancer cells, including melanoma, breast, ovarian, and prostate malignancies, compared to their non-aggressive counterparts.27 Another study based on whole genome microarray has shown that FAO-related genes, besides CPT1 are downregulated in HCC tissues. However, CPT2 was not mentioned.28 Intriguingly, our data show that the aggressive cancer cells used in this study possess lower levels of CPT2, but not CPT1 compared to their non-aggressive cells. Nevertheless, recent studies have shown that elevated CPT1A or CPT1C activity promotes cell survival, tumor growth, or cellular motility in certain types of cancer cells and that blocking CPT may be a novel cancer therapeutic target.11,12,29,30 These results suggest that FAO pathways may be attenuated during cancer progression to shunt fatty acids from β-oxidation to generate more structural and oncogenic signaling lipids. Blocking CPT1 may still be an attractive target for combating certain types of cancer with less aggressive or well differentiated features.
Finally, there is currently no reliably effective therapy for patients with advanced or metastatic stage of HCC, while traditional chemotherapy with platinum compounds remains the mainstay therapy for those patients. Unfortunately, the response to CDDP is plagued by resistance, and this in turn has been linked to a more aggressive behavior of HCC. Our results indicate that CPT2-depleted HepG2 cells promote tumorigenesis and chemoresistance to CDDP. Based on our observations, it is tempting to speculate that SCD1-modulated lipid metabolism may, in turn, influence the tumor progression and chemoresistance in HCC. However, the precise mechanisms by which SCD1 protects HCC cells from chemotherapy-induced apoptosis will require further study. These data were further strengthened by the demonstration that increased expression of SCD promotes HCC development and resistance to chemotherapy, and specific genetic or pharmacologic SCD suppression resulted in inhibition of cell proliferation and increased sensitivity to chemotherapy drugs.19 And it was also manifested by the study that blockade of SCD1 activity could revert resistance to cisplatin in human lung cancer stem cells.
In summary, we show a key regulatory role of CPT2 in SCD1-mediated lipid metabolism in HCC tumorigenesis and chemoresistance. Furthermore, such a new function provides an alternative mechanism underlying the CPT2-mediated aggressiveness of HCC. Thus, our results provide novel insights into understanding the critical role of CPT2 in HCC progression and develop new diagnostic and treatment strategies for HCC.
Conclusion
Altogether, our findings demonstrate that lower CPT2 expression was significantly associated with the presence of vascular invasion and poor tumor differentiation in HCC. Subsequently, we illustrated that the downregulation of CPT2 could promote cell proliferation, migration, invasion, chemoresistance to cisplatin, and lipogenesis. Our study would provide a novel potential prognostic marker and therapeutic target for HCC.
Acknowledgments
The authors appreciate the generous help from Mr XP Yu and Mr WF Song for their excellent technical support. This work was supported by the Public Welfare Projects of Zhejiang Province, China (Grant No 2015C33166) to LHW.
Disclosure
The author reports no conflicts of interest in this work.
References
Yang JD, Roberts LR. Hepatocellular carcinoma: a global view. Nat Rev Gastroenterol Hepatol. 2010;7(8):448–458. | ||
Ferlay J, Soerjomataram I, Dikshit R, et al. Cancer incidence and mortality worldwide: sources, methods and major patterns in GLOBOCAN 2012. Int J Cancer. 2015;136(5):E359–E386. | ||
Bruix J, Sherman M. American Association for the Study of Liver Diseases. Management of hepatocellular carcinoma: an update. Hepatology. 2011;53(3):1020–1022. | ||
Glaysher J. Lipid metabolism and cancer. Curr Opin Lipidol. 2013;24(6):530–531. | ||
Mounier C, Bouraoui L, Rassart E. Lipogenesis in cancer progression (review). Int J Oncol. 2014;45(2):485–492. | ||
Menendez JA, Lupu R. Fatty acid synthase and the lipogenic phenotype in cancer pathogenesis. Nat Rev Cancer. 2007;7(10):763–777. | ||
Calvisi DF, Wang C, Ho C, et al. Increased lipogenesis, induced by AKT-mTORC1-RPS6 signaling, promotes development of human hepatocellular carcinoma. Gastroenterology. 2011;140(3):1071–1083. | ||
Na TY, Shin YK, Roh KJ, et al. Liver X receptor mediates hepatitis B virus X protein-induced lipogenesis in hepatitis B virus-associated hepatocellular carcinoma. Hepatology. 2009;49(4):1122–1131. | ||
You X, Liu F, Zhang T, Li Y, Ye L, Zhang X. Hepatitis B virus X protein upregulates oncogene Rab18 to result in the dysregulation of lipogenesis and proliferation of hepatoma cells. Carcinogenesis. 2013;34(7):1644–1652. | ||
Bonnefont JP, Djouadi F, Prip-Buus C, Gobin S, Munnich A, Bastin J. Carnitine palmitoyltransferases 1 and 2: biochemical, molecular and medical aspects. Mol Aspects Med. 2004;25(5–6):495–520. | ||
Rotondo D, Davidson J. Genetics and molecular biology: fatty acid metabolism in cancer cell survival; carnitine palmitoyltransferase-1 as a critical anticancer target. Curr Opin Lipidol. 2011;22(5):428–429. | ||
Zaugg K, Yao Y, Reilly PT, et al. Carnitine palmitoyltransferase 1C promotes cell survival and tumor growth under conditions of metabolic stress. Genes Dev. 2011;25(10):1041–1051. | ||
Wang SY, Chen LY, Tsai TF, Su TS, Choo KB, Ho CK. Constitutive production of colony-stimulating factors by human hepatoma cell lines: possible correlation with cell differentiation. Exp Hematol. 1996;24(3):437–444. | ||
Yang LY, Chen WL, Lin JW, et al. Differential expression of antioxidant enzymes in various hepatocellular carcinoma cell lines. J Cell Biochem. 2005;96(3):622–631. | ||
Ding ZB, Shi YH, Zhou J, et al. Association of autophagy defect with a malignant phenotype and poor prognosis of hepatocellular carcinoma. Cancer Res. 2008;68(22):9167–9175. | ||
Currie E, Schulze A, Zechner R, Walther TC, Farese RV Jr. Cellular fatty acid metabolism and cancer. Cell Metab. 2013;18(2):153–161. | ||
Yahagi N, Shimano H, Hasegawa K, et al. Co-ordinate activation of lipogenic enzymes in hepatocellular carcinoma. Eur J Cancer. 2005;41(9):1316–1322. | ||
Thai SF, Allen JW, DeAngelo AB, George MH, Fuscoe JC. Detection of early gene expression changes by differential display in the livers of mice exposed to dichloroacetic acid. Carcinogenesis. 2001;22(8):1317–1322. | ||
Bansal S, Berk M, Alkhouri N, Patrick DA, Fung JJ, Feldstein A. Stearoyl-CoA desaturase plays an important role in proliferation and chemoresistance in human hepatocellular carcinoma. J Surg Res. 2014;186(1):29–38. | ||
Kumar-Sinha C, Ignatoski KW, Lippman ME, Ethier SP, Chinnaiyan AM. Transcriptome analysis of HER2 reveals a molecular connection to fatty acid synthesis. Cancer Res. 2003;63(1):132–139. | ||
Budhu A, Roessler S, Zhao X, et al. Integrated metabolite and gene expression profiles identify lipid biomarkers associated with progression of hepatocellular carcinoma and patient outcomes. Gastroenterology. 2013;144(5):1066–1075.e1061. | ||
Peck B, Schug ZT, Zhang Q, et al. Inhibition of fatty acid desaturation is detrimental to cancer cell survival in metabolically compromised environments. Cancer Metab. 2016;4:6. | ||
Li LO, Klett EL, Coleman RA. Acyl-CoA synthesis, lipid metabolism and lipotoxicity. Biochim Biophys Acta. 2010;1801(3):246–251. | ||
Calorini L, Fallani A, Tombaccini D, et al. Lipid characteristics of RSV-transformed Balb/c 3T3 cell lines with different spontaneous metastatic potentials. Lipids. 1989;24(8):685–690. | ||
Scaglia N, Caviglia JM, Igal RA. High stearoyl-CoA desaturase protein and activity levels in simian virus 40 transformed-human lung fibroblasts. Biochim Biophys Acta. 2005;1687(1–3):141–151. | ||
Fritz V, Benfodda Z, Rodier G, et al. Abrogation of de novo lipogenesis by stearoyl-CoA desaturase 1 inhibition interferes with oncogenic signaling and blocks prostate cancer progression in mice. Mol Cancer Ther. 2010;9(6):1740–1754. | ||
Louie SM, Roberts LS, Mulvihill MM, Luo K, Nomura DK. Cancer cells incorporate and remodel exogenous palmitate into structural and oncogenic signaling lipids. Biochim Biophys Acta. 2013;1831(10):1566–1572. | ||
Wu JM, Skill NJ, Maluccio MA. Evidence of aberrant lipid metabolism in hepatitis C and hepatocellular carcinoma. HPB (Oxford). 2010;12(9):625–636. | ||
Pacilli A, Calienni M, Margarucci S, et al. Carnitine-acyltransferase system inhibition, cancer cell death, and prevention of myc-induced lymphomagenesis. J Natl Cancer Inst. 2013;105(7):489–498. | ||
Liu L, Wang YD, Wu J, Cui J, Chen T. Carnitine palmitoyltransferase 1A (CPT1A): a transcriptional target of PAX3-FKHR and mediates PAX3-FKHR-dependent motility in alveolar rhabdomyosarcoma cells. BMC Cancer. 2012;12:154. | ||
Pisanu ME, Noto A, De Vitis C, et al. Blockade of Stearoyl-CoA-desaturase 1 activity reverts resistance to cisplatin in lung cancer stem cells. Cancer Lett. 2017;406:93–104. | ||
Li J, Huang Q, Long X, et al. CD147 reprograms fatty acid metabolism in hepatocellular carcinoma cells through Akt/mTOR/SREBP1c and P38/PPARa pathways. J Hepatol. 2015;63(6):1378–1389. |
 © 2018 The Author(s). This work is published and licensed by Dove Medical Press Limited. The full terms of this license are available at https://www.dovepress.com/terms.php and incorporate the Creative Commons Attribution - Non Commercial (unported, v3.0) License.
By accessing the work you hereby accept the Terms. Non-commercial uses of the work are permitted without any further permission from Dove Medical Press Limited, provided the work is properly attributed. For permission for commercial use of this work, please see paragraphs 4.2 and 5 of our Terms.
© 2018 The Author(s). This work is published and licensed by Dove Medical Press Limited. The full terms of this license are available at https://www.dovepress.com/terms.php and incorporate the Creative Commons Attribution - Non Commercial (unported, v3.0) License.
By accessing the work you hereby accept the Terms. Non-commercial uses of the work are permitted without any further permission from Dove Medical Press Limited, provided the work is properly attributed. For permission for commercial use of this work, please see paragraphs 4.2 and 5 of our Terms.