")
Back to Journals » OncoTargets and Therapy » Volume 9
Downregulation of ALDOB is associated with poor prognosis of patients with gastric cancer
Authors He J, Jin Y, Chen Y, Yao HB, Xia YJ, Ma YY, Wang W, Shao QS
Received 9 April 2016
Accepted for publication 6 July 2016
Published 7 October 2016 Volume 2016:9 Pages 6099—6109
DOI https://doi.org/10.2147/OTT.S110203
Checked for plagiarism Yes
Review by Single anonymous peer review
Peer reviewer comments 2
Editor who approved publication: Professor Min Li
Jun He,1 Yi Jin,1 Yuan Chen,2 Hai-Bo Yao,1 Ying-Jie Xia,3 Ying-Yu Ma,4 Wei Wang,2 Qin-Shu Shao1
1Department of Gastroenterology and Pancreatic Surgery, 2Department of Pathology, 3Key Laboratory of Gastroenterology of Zhejiang Province, 4Clinic Research Institute, Zhejiang Provincial People’s Hospital, Hangzhou, People’s Republic of China
Objectives: To examine the expression of ALDOB in gastric cancer (GC) tissue and to reveal its potential clinicopathological and prognostic significance.
Materials and methods: We screened for genes that were differentially expressed between GC and nontumor tissues using a microarray, specifically the Affymetrix U133 Plus 2.0 Array platform. We then verified the transcriptional and translational levels of ALDOB by performing quantitative real-time polymerase chain reaction (qRT-PCR) and immunohistochemistry (IHC). In addition, a merged data set based on the Gene Expression Omnibus was generated and a survival analysis performed.
Results: The microarray analysis revealed that ALDOB was downregulated (more than sevenfold) in GC compared with nontumor tissue. Both qRT-PCR and IHC validated the decrease of ALDOB in GC tissue. Moreover, we found that the expression of ALDOB was significantly related to tumor-invasion depth, lymph-node metastasis, distant metastasis, and TNM stage. The survival analysis, based on the IHC and merged data set, indicated that the overall survival was better in patients with high ALDOB expression. The Cox regression analysis showed that ALDOB expression was an independent prognostic factor for GC.
Conclusion: The expression of ALDOB in GC tissue was significantly related to the clinicopathological features and prognosis of the disease, thus suggesting that ALDOB could act as a novel molecular marker for GC.
Keywords: ALDOB, gastric cancer, microarray analysis, molecular marker
Introduction
Gastric cancer (GC) is the fifth-commonest cancer and third-leading cause of cancer mortality worldwide, with approximately 951,000 new cases and 723,000 deaths in 2012.1 In the People’s Republic of China, GC remains the third-commonest cancer (~420,000 new cases a year) and is the third-leading cause of cancer-related death (~290,000 deaths a year).2 Although there have been great improvements in diagnosis and treatment, the 5-year survival rate for patients with GC remains at 25%–30% worldwide.3 The cause of gastric carcinogenesis is very complicated: both environmental and host-related factors play critical roles in its etiology. Exploration of the underlying molecular mechanisms of GC pathogenesis is crucial to improving the diagnosis, treatment, and prognosis of this disease.4 Therefore, studies have focused on the molecular mechanisms of GC, and a number of potential biomarkers have been found, such as HER2, EGFR, and the MET proto-oncogene.5–7 However, specific and reliable molecular markers are limited; it is critical to identify new biomarkers for GC to aid in early diagnosis, treatment strategy, and prognosis evaluation.
ALDO, also known as fructose-bisphosphate aldolase, includes three isozymes (ALDOA, -B, and -C). Its major function is to catalyze the reversible conversion of fructose-1,6-bisphosphate into dihydroxyacetone phosphate and glyceraldehyde-3-phosphate.8,9 ALDOB is mainly expressed in the liver, and has a sequence similar to ALDOA (66% identity) and ALDOC (68% identity).8,10 Abnormal changes in ALDOB correlate with many diseases, such as hereditary fructose intolerance, hepatitis, liver cirrhosis, and even cancer.11,12 Previous studies have found that the aberrant expression of ALDO has a close relationship with lung squamous cell carcinoma, oral squamous cell carcinoma, and osteosarcoma.13–15 Asaka et al found that ALDOB was significantly decreased in hepatocellular carcinoma (HCC) and markedly reduced in GC.11 Recent research has demonstrated an obvious reduction of ALDOB in HCC, and also revealed its potential roles in HCC.16,17 However, the role of ALDOB in stomach cancer remains largely unknown. In the present study, we detected the comparative expression levels of ALDOB in GC tissues and paired nontumor tissues. Our findings revealed the potential relationship of ALDOB with the clinicopathological characteristics of GC and its prognostic significance.
Materials and methods
Patients and tissue specimens
Paired fresh specimens were collected from 44 patients who had undergone radical gastrectomy for GC at Zhejiang Provincial People’s Hospital from May 2011 to June 2012. Both the tumor lesions and adjacent nontumor mucosa were rapidly frozen in liquid nitrogen after resection and stored at −80°C. Ten matched specimens were used to perform a GeneChip® Array (Affymetrix U133 Plus 2.0 Array platform); the remaining samples were used for quantitative real-time polymerase chain reaction (qRT-PCR). For immunohistochemical analysis, another 116 patients with GC who had undergone curative resection at Zhejiang Provincial People’s Hospital during 2006–2008 were recruited for this study. The fresh tumor specimens were fixed in 4% (v/v) paraformaldehyde and then embedded in paraffin until use. The patients were aged 30–82 years (median 59 years), and included 82 males and 34 females. All cases were followed up until December 2014. Each patient’s clinicopathological data were collected, including age, sex, tumor location, size, pathological differentiation, invasion depth, node metastasis, distant metastasis, and tumor-node-metastasis (TNM) stage. The diagnosis of all patients was confirmed by two pathologists according to the American Joint Committee on Cancer’s AJCC Cancer Staging Manual (seventh edition).18 Sixty nontumor gastric tissue specimens from patients without tumors were acquired by endoscopy as controls.
This study was approved by the ethics committee of Zhejiang Provincial People’s Hospital, and all patients signed an informed consent. No patient enrolled in this study had ever received either chemotherapy or radiotherapy prior to surgery.
Microarray analysis
Total RNA was extracted from ten pairs of GC tissue and adjacent nontumor mucosa using Trizol reagent (Thermo Fisher Scientific, Waltham, MA, USA) following the manufacturer’s instructions. The RNA integrity number, detected by an Agilent Bioanalyzer 2100 (Agilent Technologies, Santa Clara, CA, USA), was used to determine RNA integrity. Total RNA meeting the specified quality criteria (integrity numbers ≥7 and 28S/18S ≥0.7) were further purified using an RNase-Free DNase Set (Qiagen NV, Venlo, the Netherlands) and an RNeasy® microkit (Qiagen) according to the manufacturer’s instructions. Purified total RNA was then used for obtaining biotin-labeled complementary RNA by applying the GeneChip® 3′IVT Express Kit (Affymetrix, Santa Clara, CA, USA) according to the manufacturer’s instructions. Then, the GeneChip® hybridization, wash, and stain kit (Affymetrix) was used for performing the array hybridization and wash, with the use of a GeneChip® Hybridization Oven 645 (Affymetrix) and a GeneChip® Fluidics Station 450 (Affymetrix). All arrays were scanned using a GeneChip® Scanner 3000 (Affymetrix) and Command Console Software 3.1 (Affymetrix) with the default settings. Raw data were normalized by the MAS 5.0 algorithm with GeneSpring GX 11.0 software (Agilent Technologies). Significance analysis of microarrays was used to identify genes that were differentially expressed between the GC and nontumor tissues. Genes were considered to be differentially expressed when the tumor versus nontumor signal log-ratio values were ≥2 or ≤0.5. Genes (fold change ≥2 or ≤0.5, P<0.05) were selected for further analysis. Heat-map plots were done with the R package “pheatmap” for the target genes. Gene-ontology and pathway-enrichment analyses were done using Fisher’s exact test with the R package “clusterProfiler” for the target genes. Gene-ontology categories and pathways with Fisher’s exact-test P-values <0.05 were selected.
qRT-PCR
Total RNA from the frozen GC and adjacent nontumor tissues was isolated using the Trizol® reagent. Then, RNA was reverse-transcribed to complementary DNA with the PrimeScript™ RT reagent kit (Takara, Tokyo, Japan) following the manufacturer’s instructions. GAPDH was used as an internal control. qRT-PCR to detect the messenger RNA (mRNA) level of ALDOB was performed using the Mx3000P qPCR system (Stratagene, La Jolla, CA, USA) using the SYBR® Premix Ex Taq™ II kit (Takara). The primer sequences for ALDOB and GAPDH were as follows: ALDOB forward, 5′-GCT ATC CAG GAA AAC GCC AAC GC-3′; ALDOB reverse, 5′-TTC ACT CAT GCC ACC AGA CAA AA-3′; GAPDH forward, 5′-TGA AGG TCG GAG TCA ACG G-3′; and GAPDH reverse, 5′-CTG GAA GAT GGT GAT GGG ATT-3′. The PCR reaction procedure was as follows: an initial denaturation (95°C for 4 minutes), 40 cycles of amplification (95°C for 10 seconds, then 59°C for 20 seconds, and 72°C for 20 seconds). Melting-curve analysis was performed at the end of the PCR cycles. Each qRT-PCR was performed in triplicate, and then the mean value was calculated. The expression level of ALDOB mRNA was determined using 2−ΔΔCt, in which ΔCt = Ct(ALDOB) − Ct(GAPDH).
Immunohistochemistry
Immunohistochemical staining was performed using an SP-9000 detection kit (ZSGB-Bio, Beijing, People’s Republic of China) on 4 μm-thick, formalin-fixed, paraffin-embedded tissue slices. All paraffin sections were routinely deparaffinized and rehydrated in xylene and graded ethanol solutions. After hydration, high-pressure antigen retrieval was performed in 10 mM sodium citrate buffer (pH 6). All sections were then successively incubated with 3% (v/v) H2O2 solution for 15 minutes and 10% (v/v) goat serum for 20 minutes to block endogenous peroxidase activity and nonspecific binding at room temperature. The sections were incubated at 4°C overnight with an anti-ALDOB antibody (1:100 dilution; Abcam, Cambridge, UK), a primary rabbit monoclonal antibody against ALDOB. The sections were subsequently incubated with a biotin-labeled secondary antibody for 20 minutes and with horseradish peroxidase-labeled streptavidin for another 20 minutes at room temperature. Finally, all slides were stained with 3,3′-diaminobenzidine tetrahydrochloride (ZSGB-Bio), followed by counterstaining, dehydration, and mounting. As a control, immunohistochemical staining without the anti-ALDOB antibody was also performed.
All sections were evaluated independently by two pathologists blinded to the clinicopathological characteristics. Ambiguous cases were judged after discussion among them. A combined scoring system, based on staining intensity and extent, was used to evaluate the expression level of ALDOB. Staining intensity was scored from 0 to 3+ as per the following criteria: 0 (no staining), 1+ (weak immunoreactivity), 2+ (moderate immunoreactivity), and 3+ (strong immunoreactivity). Cells showing positive staining were categorized as per the following criteria: 0 (<5% positive cells), 1+ (5%–25% positive cells), 2+ (26%–50% positive cells), 3+ (51%–75% positive cells), and 4+ (76%–100% positive cells). The total score of each case was obtained by multiplying the intensity and proportion scores. Final scores from 0 to 3 were regarded as negative staining for ALDOB, and final scores from 4 to 12 were regarded as positive staining for ALDOB.
GEO data set and survival analysis
A data set containing 876 GC samples was generated as described previously for breast cancer.19 In brief, we set up the data set using gene-expression data downloaded from the Gene Expression Omnibus (GEO; http://www.ncbi.nlm.nih.gov/geo). For this, we utilized the keywords “gastric”, “cancer”, “GPL96”, and “GPL570”. Only publications containing raw gene-expression files, clinical survival information, and at least 30 patients were included. Affymetrix HG-U133A (GPL96) and HG-U133 Plus 2.0 (GPL570) gene chips were considered because of their overlapping 22,277 probe sets. The raw CEL files were MAS 5.0-normalized in the R statistical environment (http://www.r-project.org) using the Affy Bioconductor library. Finally, we performed a second scaling normalization to set the average expression on each chip to 1,000 to reduce batch effects.20 Kaplan–Meier analysis was performed using GraphPad Prism® version 5.0 (GraphPad Software, San Diego, CA, USA).
Statistical analysis
Statistical analysis was performed using SPSS 19.0 (IBM, Armonk, NY, USA) and GraphPad Prism® version 5.0. The Wilcoxon signed-rank test was used to analyze the ALDOB mRNA levels in the paired specimens; a χ2 test was used to examine the correlation between ALDOB expression and clinicopathological parameters. Kaplan–Meier survival curves were plotted, and survival data were analyzed by a log-rank test and univariate and multivariate Cox regression analyses. A difference was considered significant when P<0.05.
Results
ALDOB-gene expression detected via microarray
Differences in gene expression between GC and nontumor tissues were analyzed using a complementary RNA-based microarray. The raw data files have been submitted to GEO (accession GSE79973). Many genes involved in tumor genesis, growth, metastasis, and tumor suppression were identified. The results of heat-map and bioinformatic analysis are presented in Figures S1 and S2, respectively. The microarray analysis revealed that ALDOB was one of the most downregulated genes, with greater than a sevenfold change between the nontumor and GC tissues (P<0.01) (Table 1). Therefore, it was selected as a promising candidate biomarker, and we attempted to investigate its potential role in GC in this study.
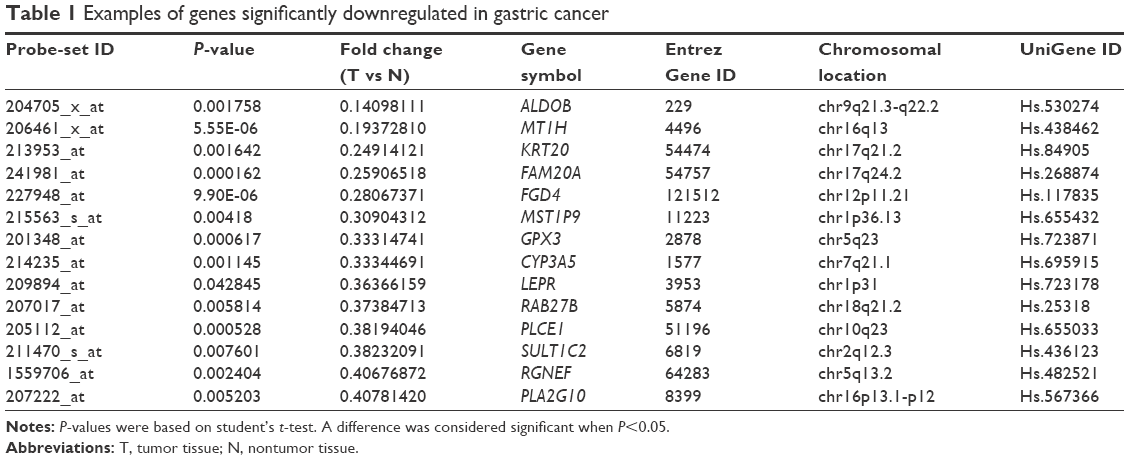 | Table 1 Examples of genes significantly downregulated in gastric cancer |
ALDOB-mRNA expression in GC and nontumor tissues
The qRT-PCR analysis detected the mRNA expression of ALDOB in 34 pairs of GC and nontumor specimens. The overall expression level of ALDOB in GC was significantly lower than that in the adjacent nontumor tissues (P<0.001) (Figure 1A). In individuals, the ALDOB mRNA level was significantly downregulated in the GC tissue compared with its paired nontumor tissue in 28 (82.3%) patients (Figure 1B).
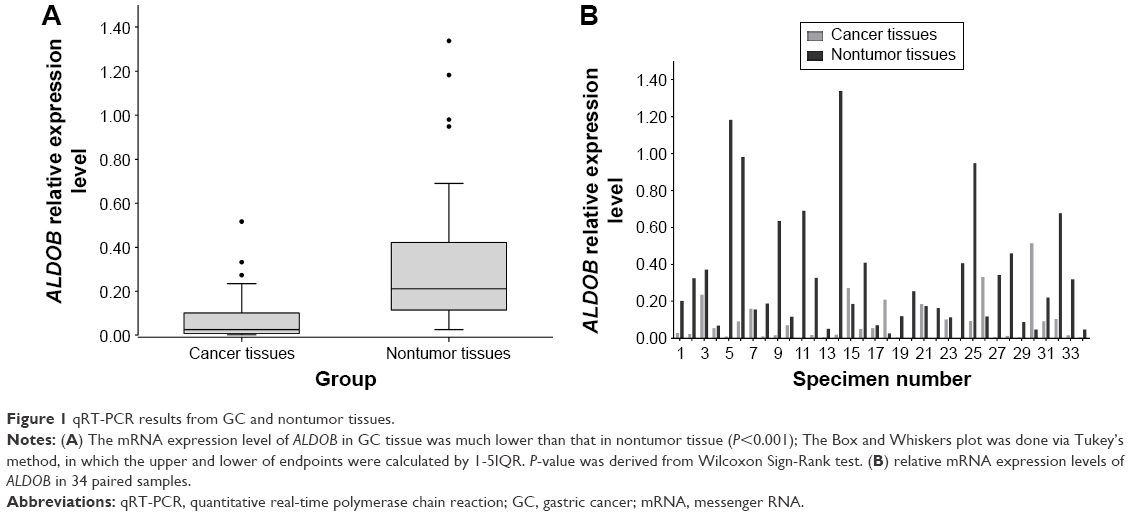 | Figure 1 qRT-PCR results from GC and nontumor tissues. |
ALDOB-protein expression in GC and nontumor tissues
The protein-expression level of ALDOB was analyzed in 116 GC cases using immunohistochemistry (IHC). As shown in Figure 2, ALDOB was mainly localized in the cytoplasm, and occasionally in the nuclei. Furthermore, the positive-expression rate of ALDOB in nontumor gastric tissues was higher than that in GC tissue, with 33.6% (39 of 116) ALDOB-positive staining in GC specimens and 86.7% (52 of 60) ALDOB-positive staining in nontumor tissues (P<0.001).
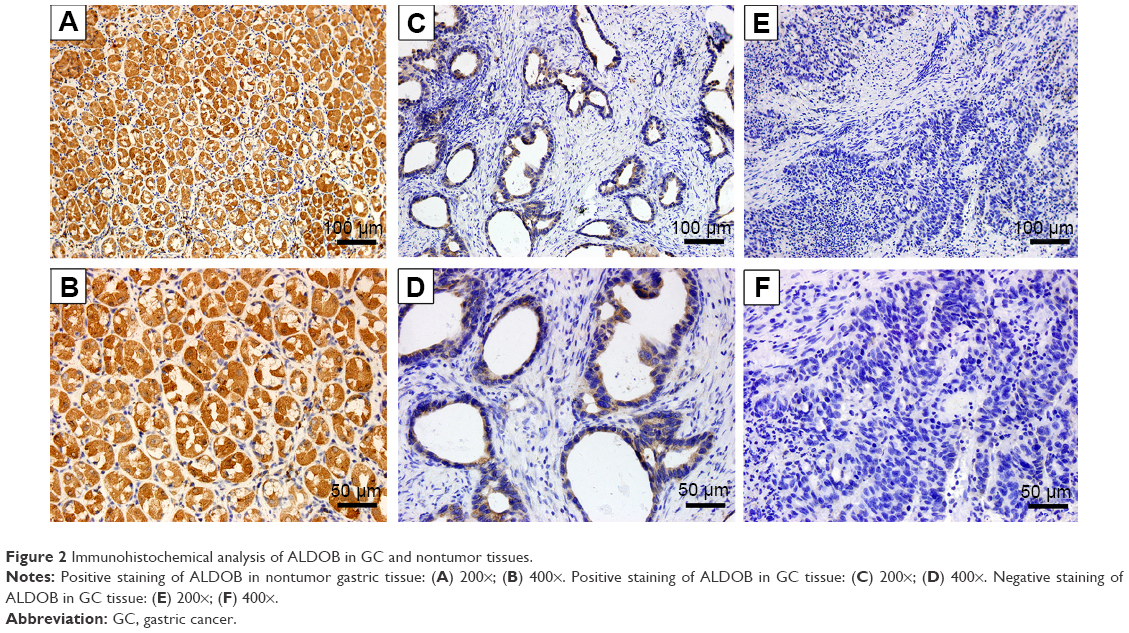 | Figure 2 Immunohistochemical analysis of ALDOB in GC and nontumor tissues. |
Correlations between ALDOB expression and clinicopathological features
The relationships between ALDOB expression and clinicopathological data were then investigated. We found that ALDOB expression was significantly correlated with invasion depth (P=0.001), lymph-node metastasis (P<0.001), distant metastasis (P=0.014), and TNM stage (P<0.001). However, no correlations were observed between ALDOB expression and sex (P=0.537), age (P=0.327), tumor size (P=0.472), location (P=0.551), or the degree of histological differentiation (P=0.253) (Table 2).
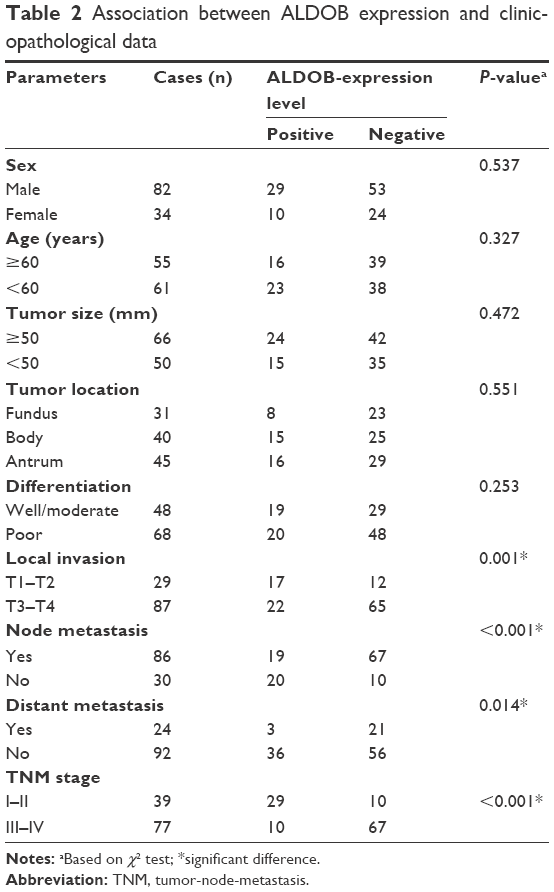 | Table 2 Association between ALDOB expression and clinicopathological data |
Association between ALDOB expression and prognosis
According to the Kaplan–Meier survival curve based on the IHC (Figure 3A), we discovered that the median survival period of patients with ALDOB-positive expression was longer than that of ALDOB-negative expression (58 vs 17 months, log-rank P=0.0001). The multivariate Cox regression analysis revealed that local invasion (P=0.006), distant metastasis (P<0.001), and ALDOB expression (P=0.028) were independent prognostic factors for GC (Table 3). Another Kaplan–Meier survival analysis performed on our merged GC data set (n=876) demonstrated that high expression of ALDOB indicated better overall survival for patients with GC (hazard ratio 0.64, 95% confidence interval 0.53–0.76; log-rank P<0.0001). Median survival in the ALDOB-high group was 58.7 months compared with 25.1 months in the ALDOB-low group (Figure 3B).
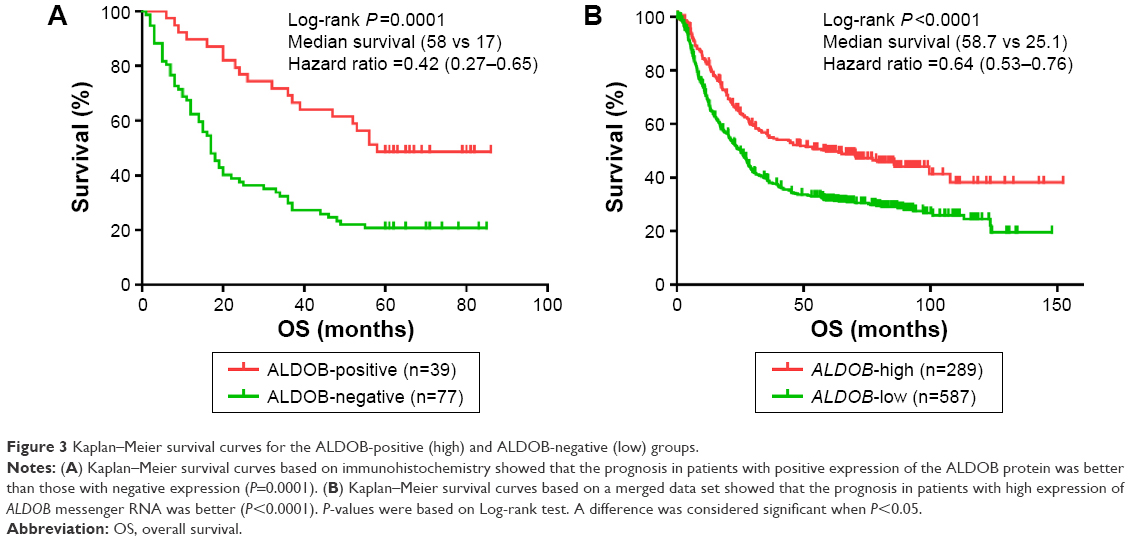 | Figure 3 Kaplan–Meier survival curves for the ALDOB-positive (high) and ALDOB-negative (low) groups. |
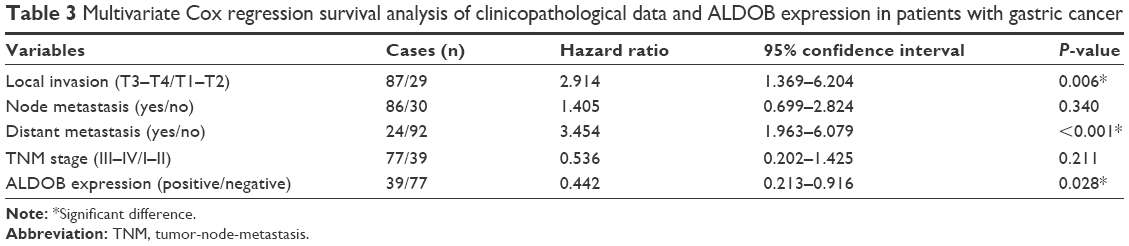 | Table 3 Multivariate Cox regression survival analysis of clinicopathological data and ALDOB expression in patients with gastric cancer |
Discussion
The mortality of GC remains high worldwide. Mortality rates are highest in developing countries, particularly in eastern Asia (14 in 100,000 in males, 9.8 in 100,000 in females).1 The main reason for the high mortality of GC is its late detection, due to the absence of early specific symptoms.21 Despite the improvement in treatment for GC, including surgery, chemotherapy, and radiotherapy, the efficacy of treatments for advanced cancer is still unsatisfactory.22 In recent years, studies have revealed that molecular targets can play a significant role in prognosis prediction and biological treatment.4,22,23 The application of trastuzumab (a HER2-targeting antibody) and ramucirumab (a VEGFR2-targeting antibody) are typical treatments in corresponding GC types.24,25 Therefore, the exploration of novel molecular markers is essential for the early diagnosis of GC, targeted therapies, and prognosis evaluation.
Metabolic reprogramming, a hallmark of malignancy involving changes in glycolytic enzymes, is becoming widely recognized.26 ALDO, which contains four catalytic tetramers, is a key enzyme in glycolysis.9 Evidence has shown that ALDO not only takes part in glycometabolism but is also involved in cell proliferation, signal transduction, and transcription. Therefore, the aberrant alteration of ALDO could be responsible for malignant transformation.27–29 In recent years, studies of the underlying roles of ALDO in cancer have become popular, and have revealed that the abnormal expression of ALDO has a close relationship with lung and oral squamous cell carcinoma, osteosarcoma, pancreatic carcinoma, and HCC.13–16,30
ALDOB, which contains a large number of ALDOB-specific amino acid residues (eg, Phe58, Glu/Asp60, and Ser68) in its isozyme-specific region 2, is mainly responsible for cleaving fructose-1-phosphate into dihydroxyacetone phosphate and glyceraldehyde.12,31 In the human body, the highest concentration of ALDOB is in the liver; it is also distributed in other tissues, such as the kidney, small intestine, and stomach.30,32 Hereditary fructose intolerance, an autosomal-recessive disorder with characteristics of fructose intolerance, is caused by mutations occurring in the ALDOB gene.12 In previous studies, a remarkable decrease in ALDOB was detected in GC, HCC, and clear cell renal cell carcinoma.11,32,33 Peng et al identified that the downregulation of ALDOB positively correlated with aggressive features of tumors, such as poor differentiation, a higher grade of TNM stage, earlier tumor recurrence, and shorter 5-year survival.17 Another study confirmed that lower ALDOB expression in patients was correlated with poor prognosis, and revealed the possible mechanism of ALDOB: ALDOB inhibited HCC metastasis by elevating the expression level of TET1, a gene acting as a tumor suppressor with the function of promoting DNA demethylation.16,34 However, the potential role of ALDOB expression in GC was not clear. The present study is the first to investigate the underlying significance of ALDOB in the clinicopathological characteristics and prognosis of GC.
According to our microarray analysis, ALDOB was dramatically downregulated (more than sevenfold) in GC tissues compared with adjacent nontumor tissues. qRT-PCR and IHC were performed to verify the differential expression. Our results demonstrated that ALDOB in GC tissues was distinctly lower than that in nontumor tissues, both at the transcriptional and translational levels. Moreover, we found that the expression of ALDOB was negatively related with tumor-invasion depth, node metastasis, distant metastasis, and TNM stage in GC patients. Furthermore, the long-term survival time for patients with lower ALDOB expression was shorter than that of patients with higher expression. The multivariate analysis indicated that ALDOB expression was an independent prognostic factor after surgical treatment. These results indicated that lower expression of ALDOB was a common characteristic of GC, and that ALDOB might represent a prognostic biomarker and therapeutic target in patients with GC. However, how ALDOB participates in cancer generation, progression, and metastasis is still largely unclear, and further in vitro or in vivo investigation is required to reveal the molecular mechanisms.
Conclusion
ALDOB was significantly decreased in GC tissue, and downregulation of ALDOB was closely related to poor pathological features and worse long-term survival. These findings indicate that ALDOB might act as a tumor suppressor in GC, suggesting that ALDOB could serve as a novel prognostic biomarker and a potential treatment target in patients with GC.
Acknowledgments
This work was supported by the Natural Science Foundation of Zhejiang Province (grant LZ12H16004) and the Medical Science Research Foundation of the Health Bureau of Zhejiang Province (grant 2016KYB013).
Disclosure
The authors report no conflicts of interest in this work.
References
Ferlay J, Soerjomataram I, Dikshit R, et al. Cancer incidence and mortality worldwide: sources, methods and major patterns in GLOBOCAN 2012. Int J Cancer. 2015;136(5):E359–E386. | ||
Chen W, Zheng R, Zeng H, Zhang S, He J. Annual report on status of cancer in China, 2011. Chin J Cancer Res. 2015;27(1):2–12. | ||
Allemani C, Weir HK, Carreira H, et al. Global surveillance of cancer survival 1995–2009: analysis of individual data for 25,676,887 patients from 279 population-based registries in 67 countries (CONCORD-2). Lancet. 2015;385(9972):977–1010. | ||
Tan P, Yeoh KG. Genetics and molecular pathogenesis of gastric adenocarcinoma. Gastroenterology. 2015;149(5):1153–1162.e3. | ||
Valtorta E, Martino C, Sartore-Bianchi A, et al. Assessment of a HER2 scoring system for colorectal cancer: results from a validation study. Mod Pathol. 2015;28(11):1481–1491. | ||
Galizia G, Lieto E, Orditura M, et al. Epidermal growth factor receptor (EGFR) expression is associated with a worse prognosis in gastric cancer patients undergoing curative surgery. World J Surg. 2007;31(7):1458–1468. | ||
Lee J, Seo JW, Jun HJ, et al. Impact of MET amplification on gastric cancer: possible roles as a novel prognostic marker and a potential therapeutic target. Oncol Rep. 2011;25(6):1517–1524. | ||
Penhoet E, Rajkumar T, Rutter WJ. Multiple forms of fructose diphosphate aldolase in mammalian tissues. Proc Natl Acad Sci U S A. 1966;56(4):1275–1282. | ||
Dalby AR, Tolan DR, Littlechild JA. The structure of human liver fructose-1,6-bisphosphate aldolase. Acta Crystallogr D Biol Crystallogr. 2001;57(Pt 11):1526–1533. | ||
Rottmann WH, Deselms KR, Niclas J, et al. The complete amino acid sequence of the human aldolase C isozyme derived from genomic clones. Biochimie. 1987;69(2):137–145. | ||
Asaka M, Kimura T, Meguro T, et al. Alteration of aldolase isozymes in serum and tissues of patients with cancer and other diseases. J Clin Lab Anal. 1994;8(3):144–148. | ||
Malay AD, Allen KN, Tolan DR. Structure of the thermolabile mutant aldolase B, A149P: molecular basis of hereditary fructose intolerance. J Mol Biol. 2005;347(1):135–144. | ||
Li YJ, Huang TH, Hsiao M, et al. Suppression of fructose-bisphosphate aldolase C expression as a predictor of advanced oral squamous cell carcinoma. Head Neck. 2016;38 Suppl 1:E1075–E1085. | ||
Long F, Cai X, Luo W, Chen L, Li K. Role of aldolase A in osteosarcoma progression and metastasis: in vitro and in vivo evidence. Oncol Rep. 2014;32(5):2031–2037. | ||
Du S, Guan Z, Hao L, et al. Fructose-bisphosphate aldolase a is a potential metastasis-associated marker of lung squamous cell carcinoma and promotes lung cell tumorigenesis and migration. PLoS One. 2014;9(1):e85804. | ||
Tao QF, Yuan SX, Yang F, et al. Aldolase B inhibits metastasis through ten-eleven translocation 1 and serves as a prognostic biomarker in hepatocellular carcinoma. Mol Cancer. 2015;14:170. | ||
Peng SY, Lai PL, Pan HW, Hsiao LP, Hsu HC. Aberrant expression of the glycolytic enzymes aldolase B and type II hexokinase in hepatocellular carcinoma are predictive markers for advanced stage, early recurrence and poor prognosis. Oncol Rep. 2008;19(4):1045–1053. | ||
Washington K. 7th Edition of the AJCC cancer staging manual: stomach. Ann Surg Oncol. 2010;17(12):3077–3079. | ||
Gyorffy B, Schafer R. Meta-analysis of gene expression profiles related to relapse-free survival in 1,079 breast cancer patients. Breast Cancer Res Treat. 2009;118(3):433–441. | ||
Fekete T, Rásó E, Pete I, et al. Meta-analysis of gene expression profiles associated with histological classification and survival in 829 ovarian cancer samples. Int J Cancer. 2012;131(1):95–105. | ||
Hiripi E, Jansen L, Gondos A, et al. Survival of stomach and esophagus cancer patients in Germany in the early 21st century. Acta Oncol. 2012;51(7):906–914. | ||
Orditura M, Galizia G, Sforza V, et al. Treatment of gastric cancer. World J Gastroenterol. 2014;20(7):1635–1649. | ||
Elimova E, Wadhwa R, Shiozaki H, et al. Molecular biomarkers in gastric cancer. J Natl Compr Canc Netw. 2015;13(4):e19–e29. | ||
Wilke H, Muro K, Van Cutsem E, et al. Ramucirumab plus paclitaxel versus placebo plus paclitaxel in patients with previously treated advanced gastric or gastro-oesophageal junction adenocarcinoma (RAINBOW): a double-blind, randomised phase 3 trial. Lancet Oncol. 2014;15(11):1224–1235. | ||
Bang YJ, Van Cutsem E, Feyereislova A, et al. Trastuzumab in combination with chemotherapy versus chemotherapy alone for treatment of HER2-positive advanced gastric or gastro-oesophageal junction cancer (ToGA): a phase 3, open-label, randomised controlled trial. Lancet. 2010;376(9742):687–697. | ||
Lincet H, Icard P. How do glycolytic enzymes favour cancer cell proliferation by nonmetabolic functions? Oncogene. 2015;34(29):3751–3579. | ||
Mamczur P, Gamian A, Kolodziej J, Dziegiel P, Rakus D. Nuclear localization of aldolase A correlates with cell proliferation. Biochim Biophys Acta. 2013;1833(12):2812–2822. | ||
Caspi M, Perry G, Skalka N, et al. Aldolase positively regulates of the canonical Wnt signaling pathway. Mol Cancer. 2014;13:164. | ||
Canete-Soler R, Reddy KS, Tolan DR, Zhai J. Aldolases A and C are ribonucleolytic components of a neuronal complex that regulates the stability of the light-neurofilament mRNA. J Neurosci. 2005;25(17):4353–4364. | ||
Ji S, Zhang B, Liu J, et al. ALDOA functions as an oncogene in the highly metastatic pancreatic cancer. Cancer Lett. 2016;374(1):127–135. | ||
Berardini TZ, Amsden AB, Penhoet EE, Tolan DR. Identification of conserved promoter elements for AldB and isozyme specific residues in aldolase B. Comp Biochem Physiol B Biochem Mol Biol. 1999;122(1):53–61. | ||
Saito H. [The distribution of the aldolase isoenzymes in various human tissues and the anomaly in cancerous tissues: especially in gastric cancer (author’s transl)]. Hokkaido Igaku Zasshi. 1975;50(6): 540–548. | ||
Sanders E, Diehl S. Analysis and interpretation of transcriptomic data obtained from extended Warburg effect genes in patients with clear cell renal cell carcinoma. Oncoscience. 2015;2(2):151–186. | ||
Ito S, Shen L, Dai Q, et al. Tet proteins can convert 5-methylcytosine to 5-formylcytosine and 5-carboxylcytosine. Science. 2011;333(6047):1300–1303. |
Supplementary materials
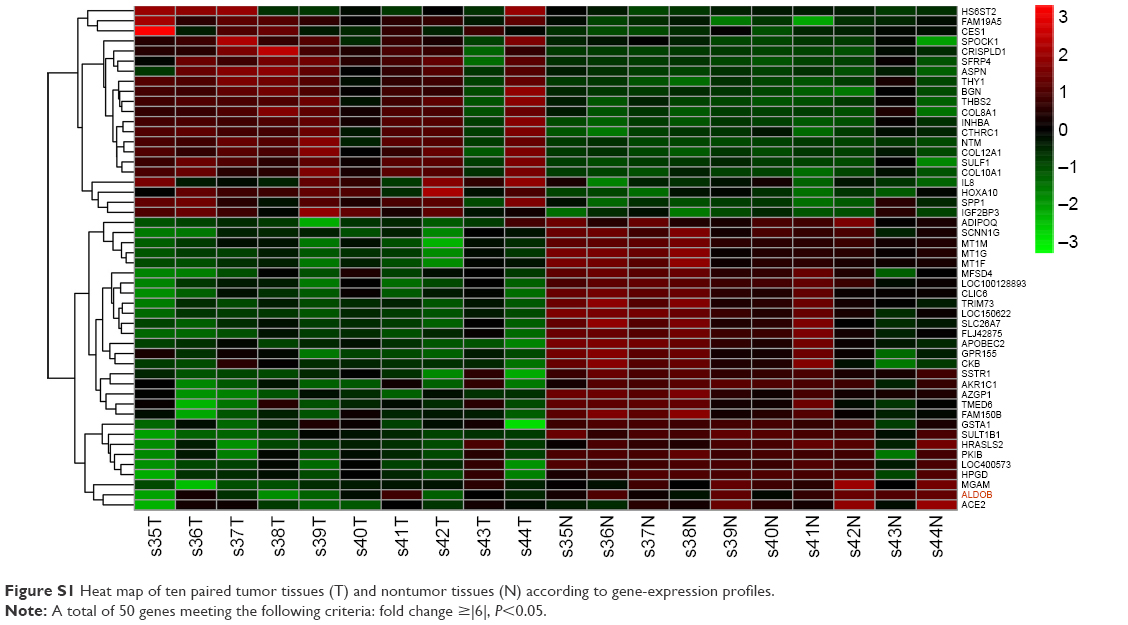 | Figure S1 Heat map of ten paired tumor tissues (T) and nontumor tissues (N) according to gene-expression profiles. |
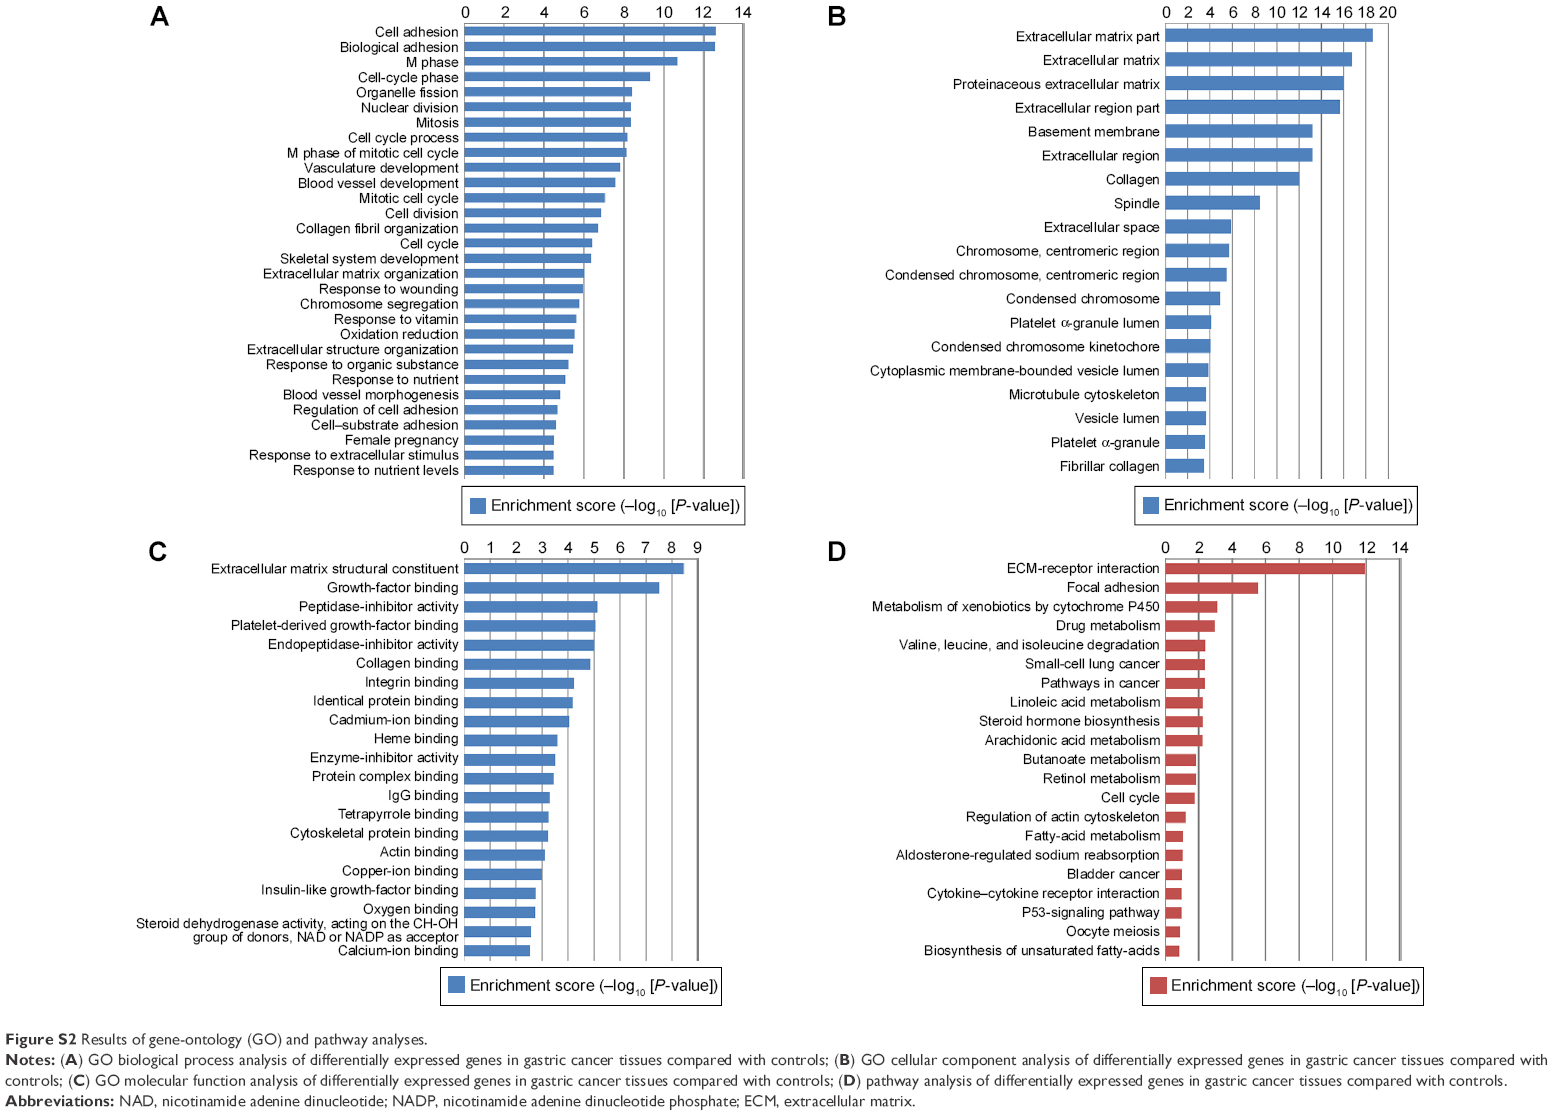 | Figure S2 Results of gene-ontology (GO) and pathway analyses. |
 © 2016 The Author(s). This work is published and licensed by Dove Medical Press Limited. The full terms of this license are available at https://www.dovepress.com/terms.php and incorporate the Creative Commons Attribution - Non Commercial (unported, v3.0) License.
By accessing the work you hereby accept the Terms. Non-commercial uses of the work are permitted without any further permission from Dove Medical Press Limited, provided the work is properly attributed. For permission for commercial use of this work, please see paragraphs 4.2 and 5 of our Terms.
© 2016 The Author(s). This work is published and licensed by Dove Medical Press Limited. The full terms of this license are available at https://www.dovepress.com/terms.php and incorporate the Creative Commons Attribution - Non Commercial (unported, v3.0) License.
By accessing the work you hereby accept the Terms. Non-commercial uses of the work are permitted without any further permission from Dove Medical Press Limited, provided the work is properly attributed. For permission for commercial use of this work, please see paragraphs 4.2 and 5 of our Terms.