")
Back to Journals » International Journal of General Medicine » Volume 15
Downregulation of ALDH6A1 is a New Marker of Muscle Insulin Resistance in Type 2 Diabetes Mellitus
Authors Liu S, Cai X, Wang T, Xu J, Cheng W, Wang X, Wei G, Yan S
Received 27 October 2021
Accepted for publication 21 January 2022
Published 25 February 2022 Volume 2022:15 Pages 2137—2147
DOI https://doi.org/10.2147/IJGM.S343727
Checked for plagiarism Yes
Review by Single anonymous peer review
Peer reviewer comments 2
Editor who approved publication: Dr Scott Fraser
Song Liu,1,* Xiaojun Cai,1,* Tao Wang,1 Jiwen Xu,2 Weilun Cheng,3 Xuling Wang,1 Gangjie Wei,4 Shuang Yan5
1Endocrinology Department, Traditional Chinese Medicine Academy of Heilongjiang, Harbin, Heilongjiang Province, People’s Republic of China; 2Anatomy, Histology and Embryology Teaching and Research Section, School of Basic Medicine, Heilongjiang University of Chinese Medicine, Harbin, Heilongjiang Province, People’s Republic of China; 3Department of General Surgery, The First Affiliated Hospital of Harbin Medical University, Harbin, Heilongjiang Province, People’s Republic of China; 4Medical Department, Traditional Chinese Medicine Academy of Heilongjiang, Harbin, Heilongjiang Province, People’s Republic of China; 5Department of Endocrinology and Metabolism, The Fourth Affiliated Hospital of Harbin Medical University, Harbin, Heilongjiang Province, People’s Republic of China
*These authors contributed equally to this work
Correspondence: Shuang Yan, Email [email protected]
Purpose: Skeletal muscle insulin resistance (IR) is an important etiology of type 2 diabetes mellitus (T2DM); however, its molecular mechanism is yet to be fully defined. This study attempted to identify the gene expression patterns and molecular disorders in T2DM patients’ skeletal muscle samples.
Methods: First, the difference in genetic expression among GSE25462 data was analyzed. Next, PPI network analysis of differential genes was carried out, after which the maladjustment module was identified. Then, an enrichment analysis and gene set enrichment analysis (GSEA) were carried out. Finally, the transcription factors that regulate the modular genes by raid were predicted.
Results: Most differentially expressed genes were found to be able to form an interaction network and cluster into 9 modules. These modular genes were shown to possess a significant correlation with immune inflammation and metabolic response. Importantly, the top 15 genes of area under receiver operating characteristic curve (AUC) were identified, and the expression of 10 genes by GSE12643, GSE18732 and GSE29221 was confirmed. The expression and AUC value of ALDH6A1 were then verified according to three sets of data, where ALDH6A1 was found to be negatively correlated with follicular helper T cells. However, among the predicted transcription regulators, HDAC was shown to have a better regulatory effect.
Conclusion: The findings highlight that the dysregulation of ALDH6A1 expression in IR of T2DM may serve as a potential therapeutic target. ALDH6A1 is involved in the immune inflammation and metabolic pathways.
Keywords: type 2 diabetes mellitus, ALDH6A1, immune inflammatory response, metabolic pathway, HDAC
Introduction
Diabetes has been recognized as one of the four major non-infectious diseases, which has resulted in about 1.6 million deaths worldwide. It is regarded as the third risk factor of premature death due to complications, including cardiovascular diseases.1 It has been estimated that the global prevalence of diabetes is 8.8% (as of 2017), which is expected to rise to 9.9% by 2045.2 In China, the prevalence of diabetes reached 11.6% in 2010, affecting about 113.9 million adults.3 Type 2 diabetes mellitus (T2DM) is the most common type of diabetes, accounting for 95% of all global cases.4 Skeletal muscle insulin resistance (IR) has been noted to be an early feature in the progression of T2DM.5
Fasting blood glucose, 2 hours postprandial blood glucose, glycosylated hemoglobin, insulin resistance and other clinical indicators are widely used in the diagnosis and classification of T2DM.6 Compared with the general population, people with type 2 diabetes have an increased risk of cardiovascular disease, heart failure and death.7 Moreover, studies have shown that the excess risk associated with diabetes is mainly caused by hyperglycemia.8,9 The pathogenesis of T2DM includes two major abnormalities: insulin resistance and insulin secretion dysfunction, which lead to an inability in regulating blood glucose levels.10,11 Previous animal experiments have found that IR is related to tyrosine metabolism and affects the development of T2DM.12 Interestingly, studies have also shown that low-grade inflammation is related to T2DM risk, subclinical inflammation can lead to insulin resistance, and is related to features of metabolic syndrome, including hyperglycemia.13,14 Increased tumor necrosis factor (TNF)-α secretion is associated with obesity-related insulin resistance. Obesity is a risk factor for the development of T2DM,15,16 and blood pressure has also been shown to be independently associated with the development of T2DM.17
Recently, researchers have conducted a comprehensive and systematic study on the changes of gene expression in T2DM patients using genomics technology, in which its biomarkers and possible metabolic pathways were studied, providing a theoretical basis for the pathogenesis of T2DM. In order to fully understand the pathological mechanism of T2DM and provide ideas and references for future research on the pathogenesis of T2DM, the genetic expression of skeletal muscle samples is analyzed in the present study. Furthermore, this study attempts to provide a theoretical basis for the disease mechanism and molecular markers related to IR in the skeletal muscle of T2DM patients.
Materials and Methods
Identification of Differentially Expressed Genes (DEGs) from Microarray Data
Transcriptome sequencing data of skeletal muscle samples in the GSE25462, GSE12643, GSE18732 and GSE29221 datasets were collected from the GEO (gene expression omnibus) database.18 GSE25462 included 10 patients with T2DM and 15 healthy controls; GSE12643 included 10 obese T2DM patients and 10 healthy controls; GSE18732 included 45 patients with T2DM and 47 healthy controls; and GSE29221 included 3 patients with T2DM and 3 healthy controls. The pre-processing of the original data of each microarray included background correction, normalization and log 2 conversion. The R language software package, DESeq, was used to determine the DEGs between the T2DM samples and control samples. P < 0.05 was taken as the cut-off criterion.
Construction of the Protein–Protein Interactions (PPI) Network
Using the online search tool to search the interaction gene (String) website (http://string-db.org), the comprehensive score was >0.4, and the PPI network19 of DEGs was then constructed. Then, the molecular complexity detection (MCODE) plug-in20 in Cytoscape was used to filter the modules in the PPI network according to the default settings.
Enrichment Analysis and GSEA of Module Genes
The R-package clusterProfiler21 was used to enrich and analyze the module genes in the gene ontology (GO) and Kyoto genome Encyclopedia (KEGG). P < 0.05 was defined as the cut-off for the significant function and pathway analysis. Additionally, the mgeneSim function of the R package in GOSemSim was used to calculate the functional similarity of GO.
In order to identify significantly dysregulated biological pathways in T2DM, GSEA22 was performed by the clusterProfiler R package under the functional annotations of the KEGG database. According to the default weighted enrichment statistical method, each analysis was repeated 1000 times. Activated and suppressed pathways with P < 0.05 in each dataset were then merged, after which those with a higher frequency (found in ≥3 datasets) were identified as dramatically changed KEGG pathways in T2DM.
Prediction of Transcription Factors
The transcription factor (TF) with a regulatory effect on the module gene was then predicted. The human transcription factor target data in TRRUST version 2 was downloaded so as to select the TF related to the module gene. Then, the rentrez R package was utilized to acquire the interactions in the NCBI database and filter the TF. Finally, the TFs that regulated more than 20 module genes were screened, which were tested using the hypergeometric method.
Results and Discussion
Identification of Differentially Expressed Genes in the Skeletal Muscle of Diabetic Patients
In order to identify the DEGs related to IR in skeletal muscle of T2DM, the gene expression of GSE25462 samples in the GEO database was analyzed. Accordingly, 1772 DEGs (Table S1) were identified, of which 1080 were upregulated and 692 were downregulated (Figure 1A and B). The top 10 upregulated and downregulated DEGs are listed in Table 1. In order to better understand the action network of these DEGs, PPI network identification was carried out. Using the MCODE plug-in, 732 genes with high interaction were identified, which were then clustered into 9 modules (Figure 1C). These nine modules may represent different molecular mechanisms related to IR of T2DM in skeletal muscle.
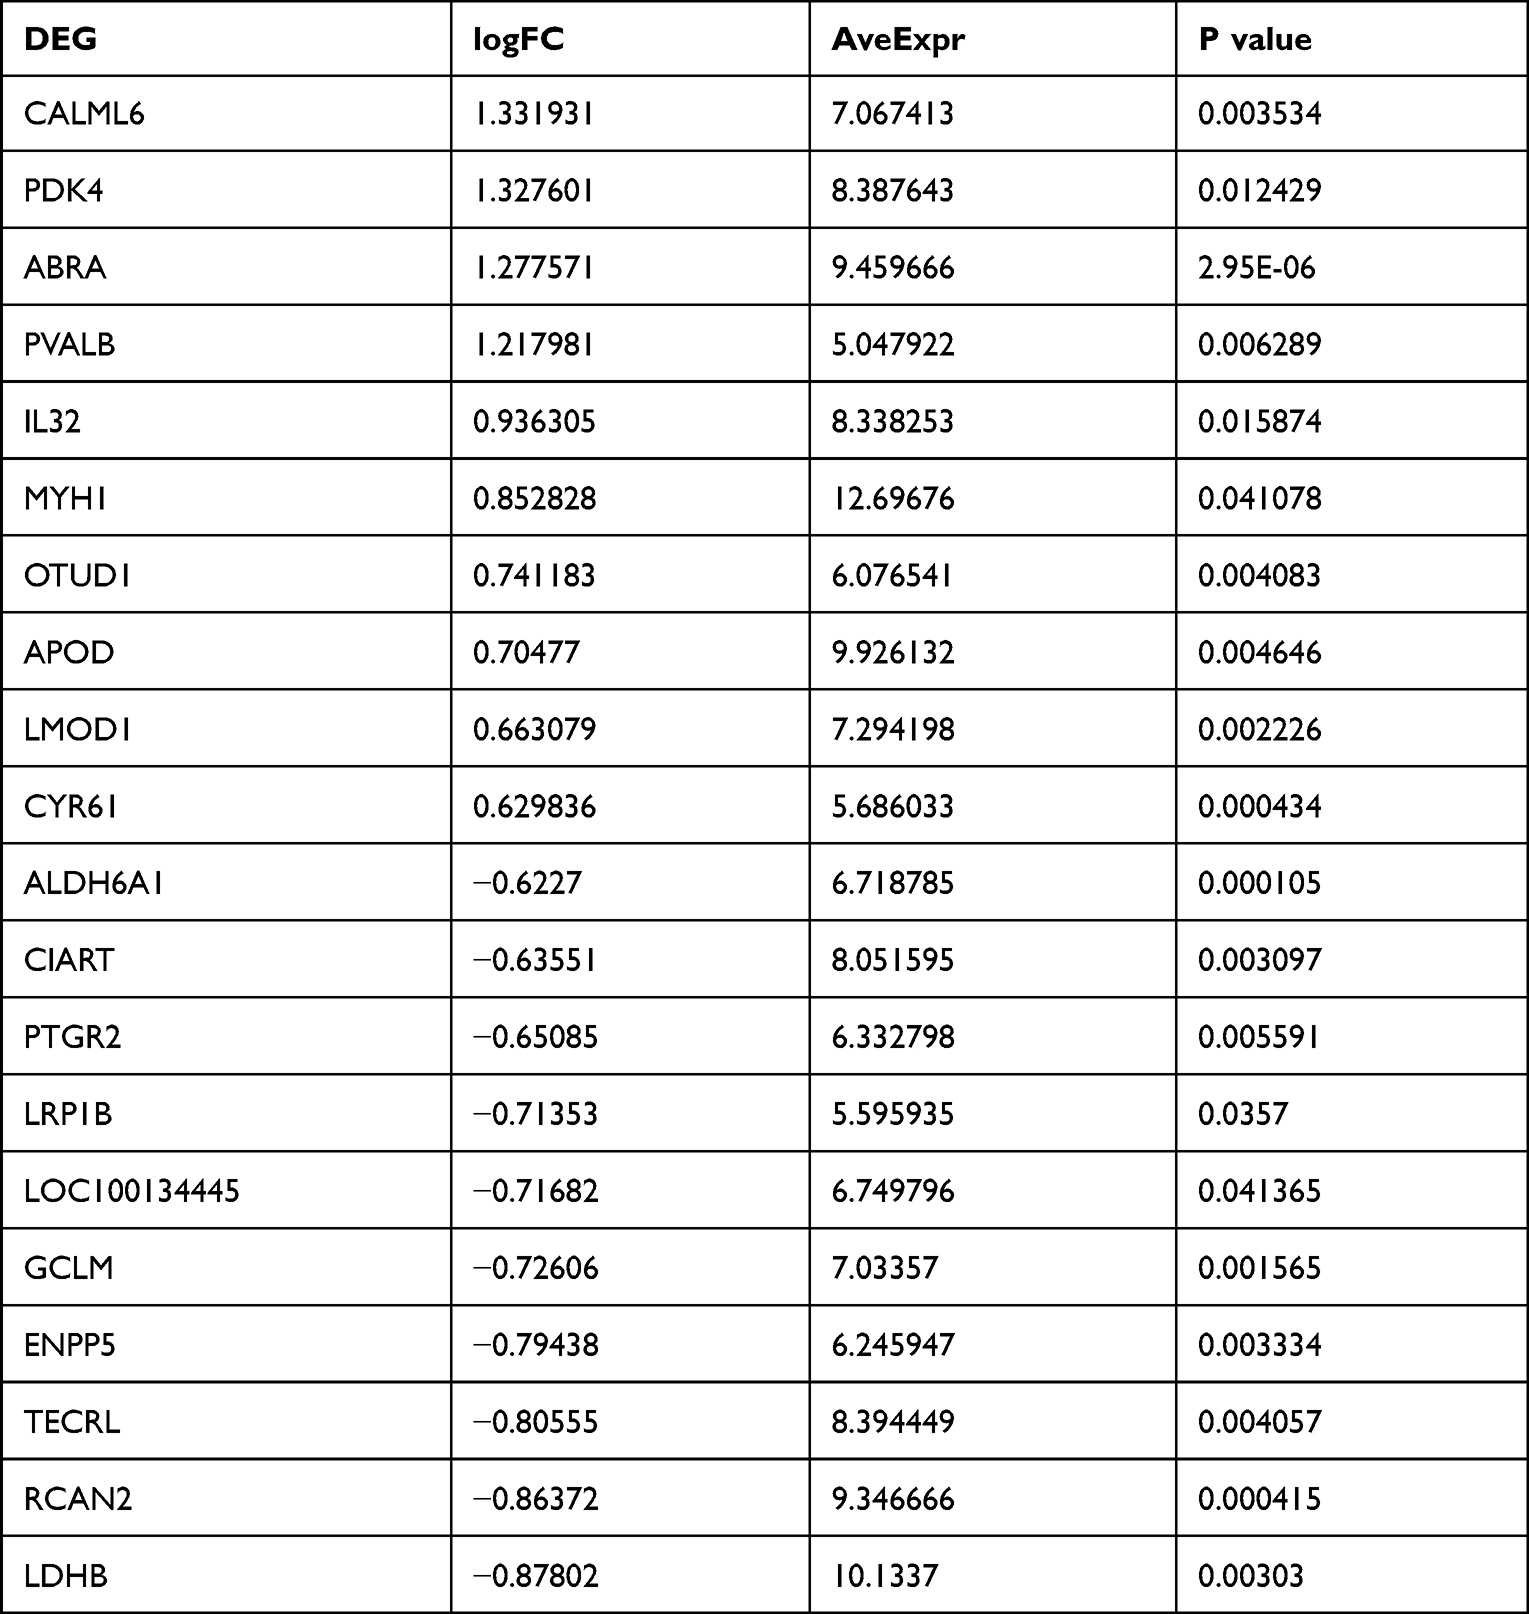 |
Table 1 Top 10 Upregulated and Downregulated Differentially Expressed Genes |
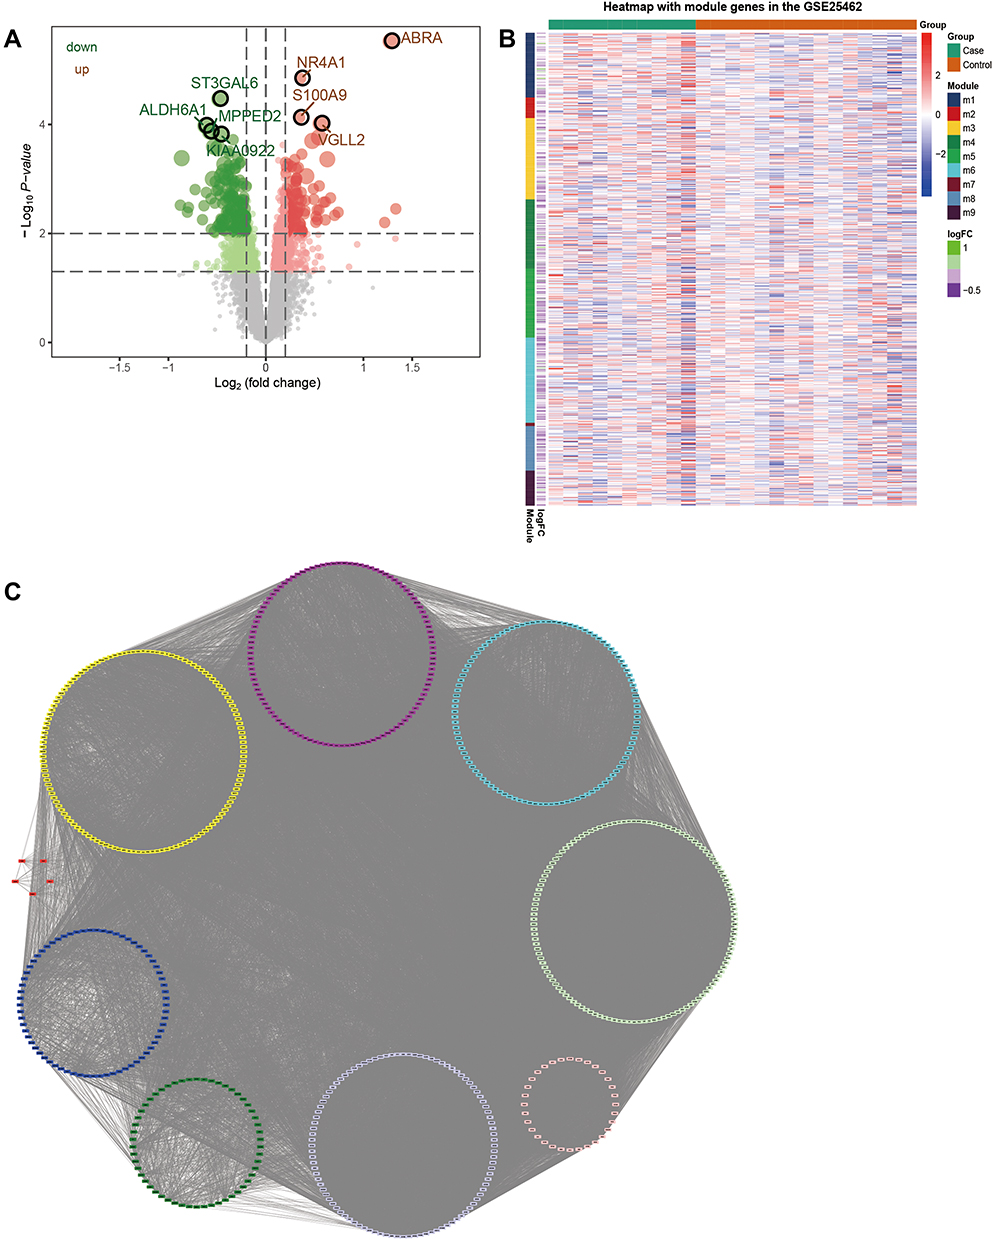 |
Figure 1 PPI network formed by differentially expressed genes in the skeletal muscle of diabetic patients. (A) Volcanic map of differentially expressed genes in the skeletal muscle of diabetic patients. (B) Heatmap of differentially expressed genes in the skeletal muscle of diabetic patients. Red node represents an upregulated gene, while green represents a downregulated gene. (C) Nine subnetworks of PPI network for differentially expressed genes. |
Transcriptional Regulators of Regulatory Module Genes
Transcriptional regulation plays an important role in gene function. Therefore, the transcription factors that regulate the module genes were predicted. Among the 333 transcription factors predicted and screened through the interactions search in the NCBI gene database, 16 transcription factors that interacted with more than 20 target genes were identified. Hypergeometric analysis of the 16 TFs showed a high correlation between transcription factors, especially HDAC, which was itself coupled with transcription factors in order to play a regulatory role (Figure 2A). Numerous types of target regulatory relationships exist between key regulatory factors and target genes (Figure 2B). Therefore, it is believed that HDAC is the core gene in the regulatory network.
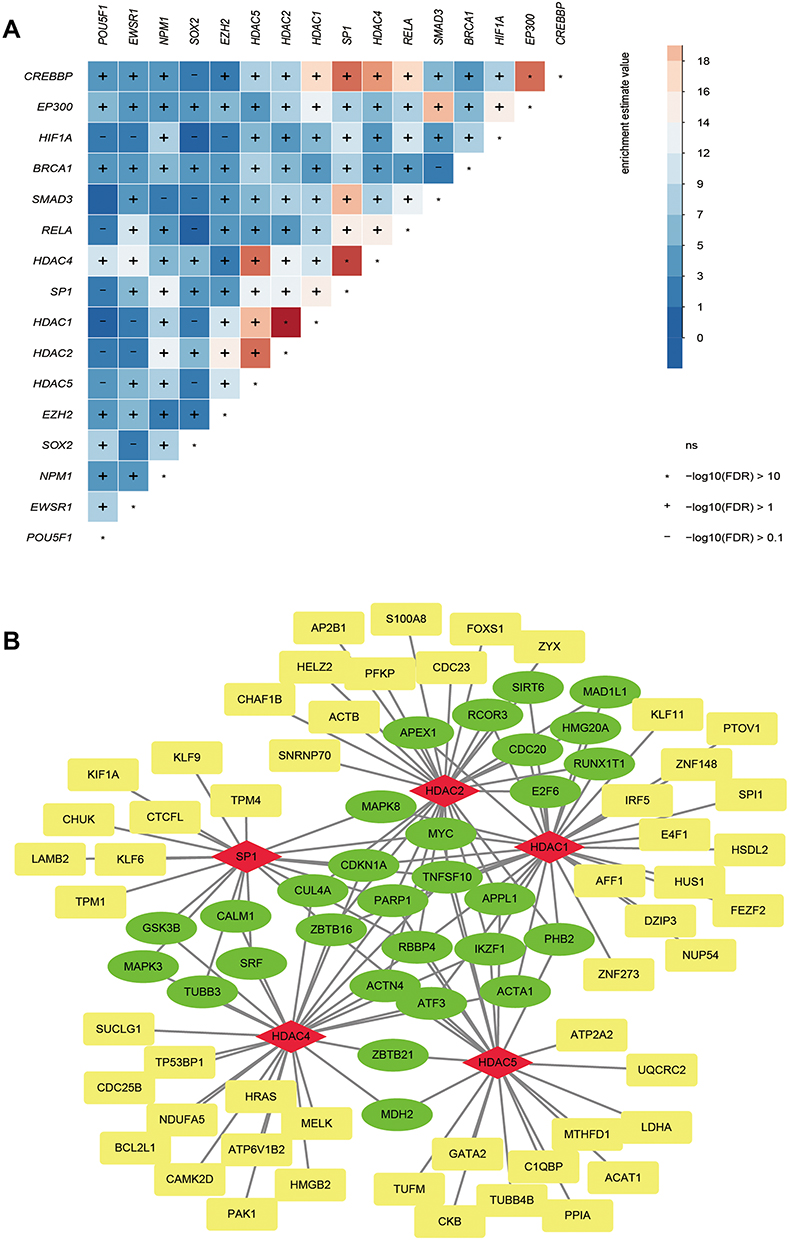 |
Figure 2 Transcription factors that regulate modular genes. (A) Sixteen transcription factors with more than 20 regulatory module genes were identified as key transcription factors. (B) Targeting relationship between regulatory factors and target genes. The red node is a transcription factor, while green is a gene regulated by more than two regulators and yellow is a gene regulated by only one regulator. |
Biological Function and Signal Pathway of Modular Genes
In order to study the biological function of the identified module genes, the data was analyzed by an enrichment analysis and GSEA. The enrichment analysis showed that the module genes participated in the 4577 BP, 448 CC, 779 MF and 229 KEGG signaling pathways (Table S2). GO functions mainly included the regulation of leukocyte activation, positive regulation of neurogenesis, regulation of cytoskeleton organization and other biological functions (Figure 3A). Among them, module 1 was mainly found to be related to the regulation of the muscle system process. Module 2 was shown to be mainly related to cell morphogenesis involved in neuron differentiation. Meanwhile, module 3 was mainly related to the regulation of leukocyte activation; module 4 was mainly related to the regulation of body fluid levels; module 5 was mainly related to the small molecule catabolic process; module 6 was mainly related to cell amino acid metallic process; module 7 was mainly related to muscle organ development; module 8 was mainly related to hormone secretion; and module 9 was mainly related to the steroid metabolic process.
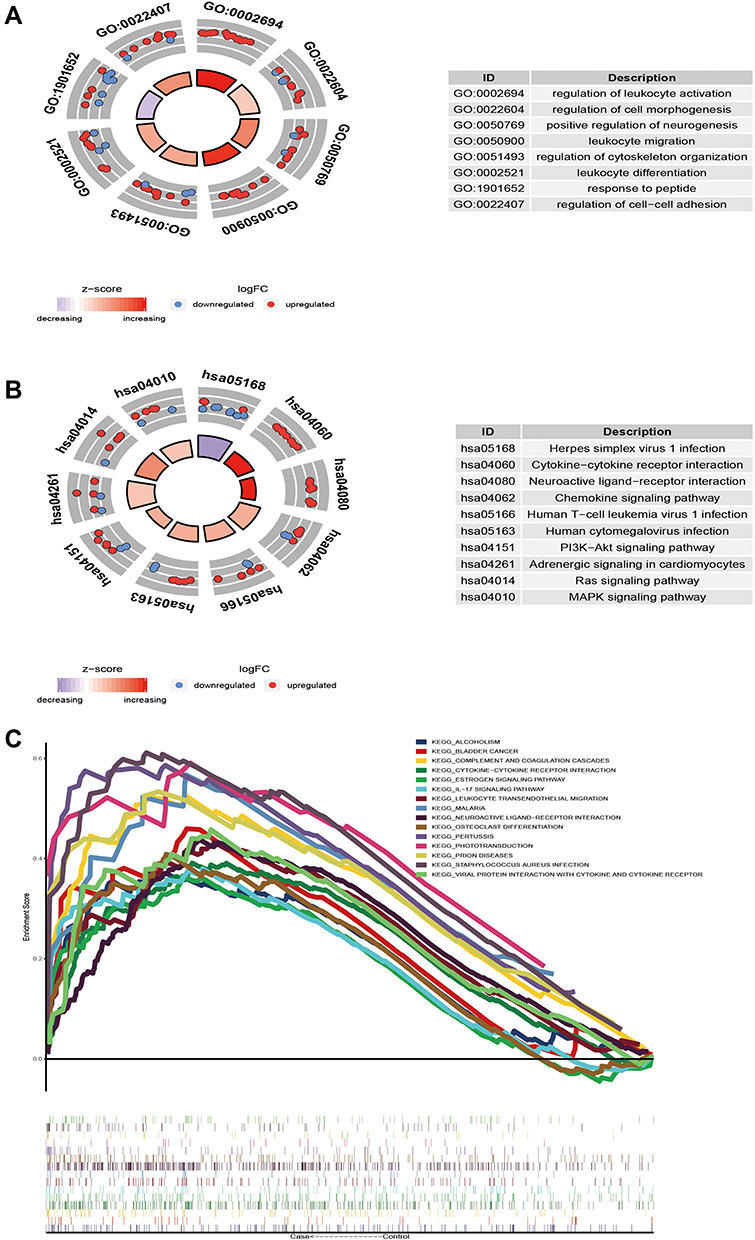 |
Figure 3 The biological function and signal pathway of module genes. (A) Module genes participate in biological processes. (B) The KEGG pathway of modular genes. (C) Fifteen GSEA pathways were the same as the KEGG pathway. |
However, the KEGG pathways involved in the module genes were observed to be mainly neuroactive live receiver interaction, MAPK signaling pathway and chemokine signaling pathway (Figure 3B). GSEA showed that 15 pathways (Figure 3C) had the same signal pathway as that of KEGG enrichment, including the IL-17 signaling pathway, osteoclast differentiation, and estrogen signaling pathway. These results indicated that the differentially expressed genes in skeletal muscle of diabetic patients are mainly related to immune and neural responses.
Identification of the Key Dysregulation Gene
In order to identify the key genes that play an important role in skeletal muscle IR in diabetic patients, the area under receiver operating characteristic curve (AUC) of the module gene was calculated, and genes with the top 15 AUC values were then screened (Figure 4A). Importantly, the AUC values of 15 genes were verified by GSE12643, GSE18732 and GSE29221, of which 10 genes were verified (Figure 4B), which were upregulated or downregulated in GSE25462 (Figure 4C). Therefore, these 10 genes were believed to be potential key genes for insulin resistance in the skeletal muscle of diabetic patients. It was found that the functional similarity of SRF, JUND and NR4A1 was high (Figure 4D). Among them, the expression of the ALDH6A1 gene and AUC was verified by three sets of data (Figure 4E). Moreover, the enrichment analysis showed that ALDH6A1 was significantly related to metabolism-related functions and signaling pathways (Figure 4F). In addition, the correlation between ALDH6A1 and immune cells was calculated (Figure 4G). ALDH6A1 was found to have a negative correlation with most immune cells in the diabetic samples. In particular, the negative correlation with follicular helper T (TFH) cells was strongest (Figure 4H). Therefore, ALDH6A1 can serve as a key candidate gene for insulin resistance in diabetic skeletal muscle.
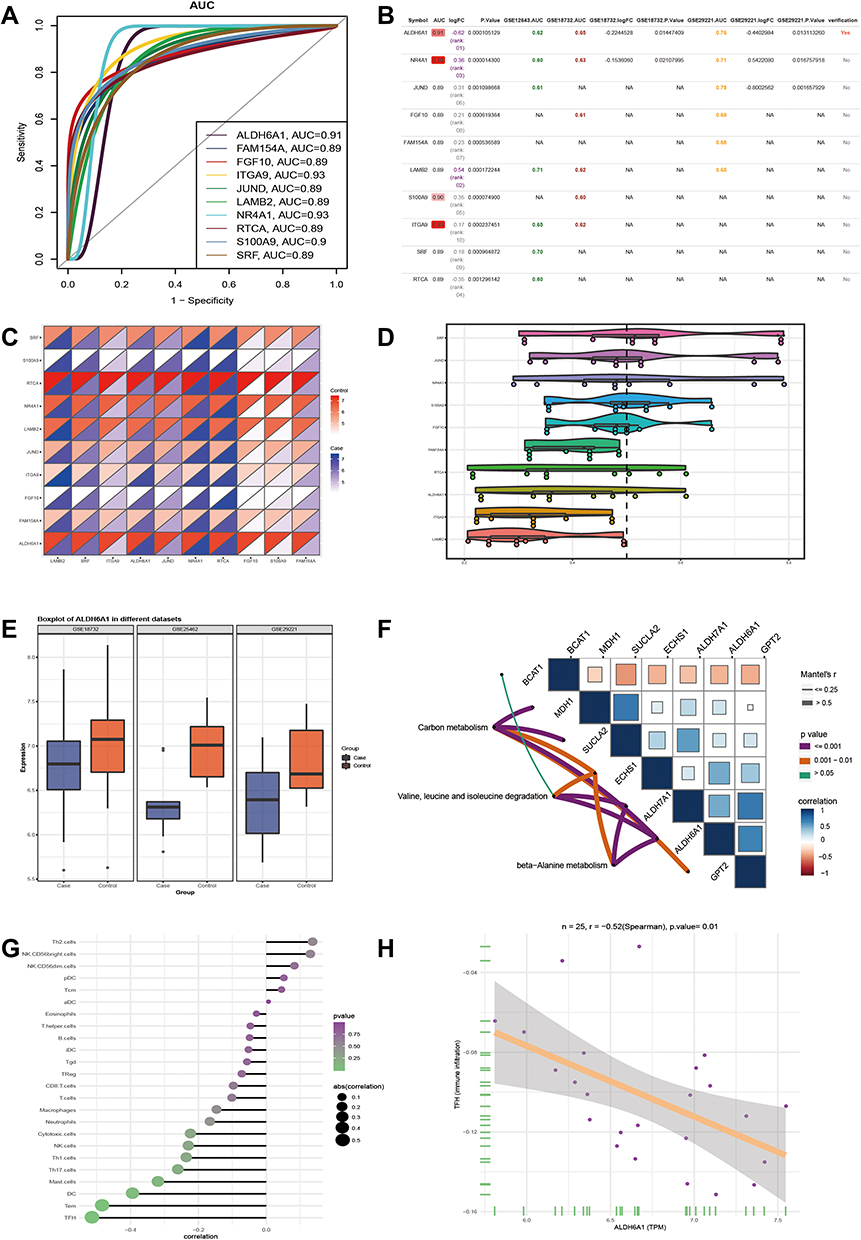 |
Figure 4 Key dysfunctional genes in skeletal muscle of type 2 diabetes mellitus. (A) The module genes with top 15 AUC value. (B) GSE12643, GSE18732 and GSE29221 dataset verify the AUC values of 10 genes. (C) Expression of 10 genes in GSE25462. (D) The functional similarity of GO function among the 10 genes. (E) Three sets of data were used to verify the expression and AUC of ALDH6A1. (F) ALDH6A1 is involved in the signaling pathway, as well as other genes contained in the signaling pathway. (G) Correlation between ALDH6A1 and 24 immune cells. (H) ALDH6A1 has the strongest negative correlation with TFH. |
It is both clinically and scientifically important to study the main molecular defects present in the pathophysiology of human T2DM. This study showed that 1772 DEGs were present in the skeletal muscle of T2DM patients compared with those of healthy controls. Gene expression analysis can be used to identify markers or early defects related to disease phenotypes. Previous studies have shown that the expression of mitochondrial oxidative phosphorylation related nuclear coding genes in T2DM patients was reduced.23 In addition, in T2DM patients, insulin signaling and glucose uptake related genes and signaling pathways were also shown to be changed significantly.24 These DEGs can be identified by a PPI network with significant interaction. Accordingly, 9 subnetworks of gene interaction were obtained in this study, each of which may represent a mechanism of action.25
The conducted enrichment analysis demonstrated that the module genes were mainly involved in the regulation of immune and metabolic processes. First, genes related to immune inflammation were shown to play an important role in the progression of T2DM.10 Due to the low degree of inflammation in T2DM, these genes can affect insulin sensitivity and insulin secretion.26 Various studies have shown that low-level inflammatory markers may be helpful in distinguishing classic adult type 1 diabetes and T2DM.27 The present data showed that most modular genes were involved in the MAPK and IL-17 signaling pathways. P38 mitogen activated protein kinase (MAPK) signaling pathway was also found to be involved in the apoptosis of a variety of inflammatory cells, which may serve as a potential therapeutic target of T2DM characterized by low-grade inflammation.28 In addition, p38 γ MAPK activation has been shown to inhibit insulin signal transduction at the level of the insulin receptor substrate.29 However, IL-17 has been shown to play an important role in inflammation, insulin resistance and type 2 diabetes.30 Compared with the healthy controls, the expression of IL-17 in Foxp3-CD4 T cells and Foxp3 + Treg cells in T2DM patients was demonstrated to be significantly higher.31 Moreover, the current analysis also found that metabolic function was found to be significantly enriched in the T2DM skeletal muscle samples. Past studies have analyzed the metabolites of 1940 patients with T2DM, in which a rise in isoleucine, leucine and proline led to an increase in the relative risk of T2DM.32 In addition, glycine was observed to be positively correlated with insulin sensitivity, and β - hydroxypyruvate, an intermediate metabolite of glycine, was also considered to be a predictor of diabetes.33,34 The metabolism of bile acids, short chain fatty acids and metabolites cooperate in the metabolic regulation system, leading to IR.35 Therefore, it is believed that the imbalance of skeletal muscle gene expression in T2DM patients may serve as a potential factor leading to IR.
Importantly, ALDH6A1 was shown to play a vital role in the diagnosis and treatment of IR in the skeletal muscle of T2DM patients. ALDH6A1 has been identified as a new adipose tissue marker related to T2DM obese people.36 In the IR atherosclerotic mouse model, ALDH6A1 is the highest ranked genes for the oxidative phosphorylation pathway.37 ALDH6A1 encoding methylmalonate-semialdehyde dehydrogenase, consistent with impaired branched-chain amino acids (BCAAs) metabolism.38 BCAAs functional attenuation has previously been shown to be involved in T2DM or IR associated mitochondrial dysfunction and impairment of oxidative metabolism.39 In this study, the mRNA level of ALDH6A1 in T2DM skeletal muscle was found to be relatively downregulated. However, whether the decrease in ALDH6A1 transcription activity in skeletal muscle is the cause or result of IR remains unanswered.
Histone deacetylase (HDAC) was found to be the most interactive gene among transcription factors by predicting the transcription regulators of the modular genes. Histone modifying functions of HDACs can regulate gene expression and affect pancreatic development.40 HDAC is the therapeutic target of T2DM, and its inhibitor has been demonstrated to be a new therapeutic drug of T2DM.41,42 HDAC inhibitors, which constitute a new class of drugs to treat diabetes and its complications, play an important role in preventing β - cell resistance to insulin, destroying β - cells and preventing cytokine mediated attacks on pancreatic cells.43
Conclusions
This study’s findings demonstrate that abnormal immunoinflammation and metabolic response may play a role in the pathogenesis of skeletal muscle insulin resistance in patients with T2DM. In addition, ALDH6A1 may serve as a potential marker, and HDAC is a transcriptional regulator of T2DM maladjusted genes rather than only a class of enzyme.
Data Sharing Statement
The research data used to support the findings of this study are included within the article and supplementary information files.
Funding
This research was financially supported by Research project supported by China Health Promotion Foundation, CDPF-2017-LXSCD and the President's Fund of the Fourth Affiliated Hospital of Harbin Medical University.
Disclosure
The authors declare that there are no conflicts of interest among the authors regarding the publication of this paper.
References
1. Oguntibeju OO. Type 2 diabetes mellitus oxidative stress and inflammation: examining the links. Int J Physiol Pathophysiol Pharmacol. 2019;11(3):45–63.
2. Kalra S, Das AK, Sahay RK, et al. Consensus recommendations on GLP-1 RA use in the management of type 2 diabetes mellitus: south asian task force.. Diabetes Ther. 2019;10(5):1645–1717. doi:10.1007/s13300-019-0669-4
3. Xu Y, Wang L, He J, et al. Prevalence and control of diabetes in Chinese adults. JAMA. 2013;310(9):948–959. doi:10.1001/jama.2013.168118
4. Donath MY, Shoelson SE. Type 2 diabetes as an inflammatory disease. Nat Rev Immunol. 2011;11(2):98–107. doi:10.1038/nri2925
5. Gallagher IJ, Scheele C, Keller P, et al. Integration of microRNA changes in vivo identifies novel molecular features of muscle insulin resistance in type 2 diabetes. Genome Med. 2010;2(2):9. doi:10.1186/gm130
6. Ma Q, Li Y, Wang M, et al. Progress in metabonomics of Type 2 diabetes mellitus. Molecules. 2018;23(7):1834.
7. Edqvist J, Rawshani A, Adiels M, et al. Contrasting associations of body mass index and hemoglobin a1c on the excess risk of acute myocardial infarction and heart failure in Type 2 diabetes mellitus. J Am Heart Assoc. 2019;8(24):e013871. doi:10.1161/JAHA.119.013871
8. Tancredi M, Rosengren A, Svensson A-M, et al. Excess mortality among persons with Type 2 diabetes. N Engl J Med. 2015;373(18):1720–1732. doi:10.1056/NEJMoa1504347
9. Rosengren A, Edqvist J, Rawshani A, et al. Excess risk of hospitalisation for heart failure among people with type 2 diabetes. Diabetologia. 2018;61(11):2300–2309. doi:10.1007/s00125-018-4700-5
10. Tong HV, Luu NK, Son HA, et al. Adiponectin and pro-inflammatory cytokines are modulated in Vietnamese patients with type 2 diabetes mellitus. J Diabetes Invest. 2017;8(3):295–305. doi:10.1111/jdi.12579
11. Hu Y, Zong G, Liu G, et al. Smoking cessation, weight change, Type 2 diabetes and mortality. N Engl J Med. 2018;379(7):623–632. doi:10.1056/NEJMoa1803626
12. Ferguson AA, Roy S, Kormanik KN, et al. TATN-1 mutations reveal a novel role for tyrosine as a metabolic signal that influences developmental decisions and longevity in Caenorhabditis elegans. PLoS Genet. 2013;9(12):e1004020. doi:10.1371/journal.pgen.1004020
13. Crook M. Type 2 diabetes mellitus: a disease of the innate immune system? An update. Diabet Med. 2004;21(3):203–207. doi:10.1046/j.1464-5491.2003.01030.x
14. Hall V, Thomsen RW, Henriksen O, et al. Diabetes in Sub Saharan Africa 1999-2011: epidemiology and public health implications. A systematic review. BMC Public Health. 2011;11(1):564. doi:10.1186/1471-2458-11-564
15. Westermann D, Linthout S, Dhayat S, et al. Tumor necrosis factor-alpha antagonism protects from myocardial inflammation and fibrosis in experimental diabetic cardiomyopathy. Basic Res Cardiol. 2007;102(6):500–507. doi:10.1007/s00395-007-0673-0
16. Derosa G, D’Angelo A, Bonaventura A, et al. Effects of berberine on lipid profile in subjects with low cardiovascular risk. Expert Opin Biol Ther. 2013;13(4):475–482. doi:10.1517/14712598.2013.776037
17. Xu C, Zhong J, Zhu H, et al. Independent and interactive associations of heart rate and body mass index or blood pressure with type 2 diabetes mellitus incidence: a prospective cohort study. J Diabetes Invest. 2019;10(4):1068–1074. doi:10.1111/jdi.12999
18. Clough E, Barrett T. The gene expression omnibus database. Methods Mol Biol. 2016;1418:93–110.
19. Vella D, Marini S, Vitali F, et al. MTGO: PPI network analysis via topological and functional module identification. Sci Rep. 2018;8(1):5499. doi:10.1038/s41598-018-23672-0
20. Bandettini WP, Kellman P, Mancini C, et al. MultiContrast Delayed Enhancement (MCODE) improves detection of subendocardial myocardial infarction by late gadolinium enhancement cardiovascular magnetic resonance: a clinical validation study. J Cardiovasc Magn Reson. 2012;14(1):83. doi:10.1186/1532-429X-14-83
21. Yu G, Wang L-G, Han Y, et al. clusterProfiler: an R package for comparing biological themes among gene clusters. OMICS. 2012;16(5):284–287. doi:10.1089/omi.2011.0118
22. Subramanian A, Tamayo P, Mootha VK, et al. Gene set enrichment analysis: a knowledge-based approach for interpreting genome-wide expression profiles. Proc Natl Acad Sci USA. 2005;102(43):15545–15550. doi:10.1073/pnas.0506580102
23. Sreekumar R, Halvatsiotis P, Schimke JC, et al. Gene expression profile in skeletal muscle of type 2 diabetes and the effect of insulin treatment. Diabetes. 2002;51(6):1913–1920. doi:10.2337/diabetes.51.6.1913
24. Jin W, Goldfine AB, Boes T, et al. Increased SRF transcriptional activity in human and mouse skeletal muscle is a signature of insulin resistance. J Clin Invest. 2011;121(3):918–929. doi:10.1172/JCI41940
25. Sun Z, Wang W, Yu D, et al. Differentially expressed genes between systemic sclerosis and rheumatoid arthritis. Hereditas. 2019;156(1):17. doi:10.1186/s41065-019-0091-y
26. Szpigel A, Hainault I, Carlier A, et al. Lipid environment induces ER stress, TXNIP expression and inflammation in immune cells of individuals with type 2 diabetes. Diabetologia. 2018;61(2):399–412. doi:10.1007/s00125-017-4462-5
27. Castelblanco E, Hernández M, Castelblanco A, et al. Low-grade inflammatory marker profile may help to differentiate patients with LADA, classic adult-onset Type 1 diabetes, and Type 2 diabetes. Diabetes Care. 2018;41(4):862–868. doi:10.2337/dc17-1662
28. Tang Y, Liu J, Yan Y, et al. 1,25-dihydroxyvitamin-D3 promotes neutrophil apoptosis in periodontitis with type 2 diabetes mellitus patients via the p38/MAPK pathway. Medicine (Baltimore). 2018;97(52):e13903. doi:10.1097/MD.0000000000013903
29. Koh A, Molinaro A, Ståhlman M, et al. Microbially produced imidazole propionate impairs insulin signaling through mTORC1. Cell. 2018;175(4):947–961e17. doi:10.1016/j.cell.2018.09.055
30. Abdel-Moneim A, Bakery HH, Allam G. The potential pathogenic role of IL-17/Th17 cells in both type 1 and type 2 diabetes mellitus. Biomed Pharmacother. 2018;101:287–292. doi:10.1016/j.biopha.2018.02.103
31. Zhu L, Song H, Zhang L, et al. Characterization of IL-17-producing Treg cells in type 2 diabetes patients. Immunol Res. 2019;67(4–5):443–449. doi:10.1007/s12026-019-09095-7
32. Guasch-Ferre M, Hruby A, Toledo E, et al. Metabolomics in prediabetes and diabetes: a systematic review and meta-analysis. Diabetes Care. 2016;39(5):833–846. doi:10.2337/dc15-2251
33. Floegel A, Stefan N, Yu Z, et al. Identification of serum metabolites associated with risk of type 2 diabetes using a targeted metabolomic approach. Diabetes. 2013;62(2):639–648. doi:10.2337/db12-0495
34. Zhang S, Wang S, Puhl MD, et al. Global biochemical profiling identifies β-Hydroxypyruvate as a potential mediator of Type 2 diabetes in mice and humans. Diabetes. 2015;64(4):1383–1394. doi:10.2337/db14-1188
35. Sircana A, Framarin L, Leone N, et al. Altered gut microbiota in Type 2 diabetes: just a coincidence? Curr Diab Rep. 2018;18(10):98. doi:10.1007/s11892-018-1057-6
36. Dharuri H, ’t Hoen PAC, van Klinken JB, et al. Downregulation of the acetyl-CoA metabolic network in adipose tissue of obese diabetic individuals and recovery after weight loss. Diabetologia. 2014;57(11):2384–2392. doi:10.1007/s00125-014-3347-0
37. Moreno-Viedma V, Amor M, Sarabi A, et al. Common dysregulated pathways in obese adipose tissue and atherosclerosis. Cardiovasc Diabetol. 2016;15(1):120. doi:10.1186/s12933-016-0441-2
38. Lynch CJ, Adams SH. Branched-chain amino acids in metabolic signalling and insulin resistance. Nat Rev Endocrinol. 2014;10(12):723–736. doi:10.1038/nrendo.2014.171
39. Lefort N, Glancy B, Bowen B, et al. Increased reactive oxygen species production and lower abundance of complex I subunits and carnitine palmitoyltransferase 1B protein despite normal mitochondrial respiration in insulin-resistant human skeletal muscle. Diabetes. 2010;59(10):2444–2452. doi:10.2337/db10-0174
40. Ghosh S, Mahalanobish S, Sil PC. Diabetes: discovery of insulin, genetic, epigenetic and viral infection mediated regulation. Nucleus (Calcutta). 2021;1–15. doi:10.1007/s13237-021-00376-x
41. Patel MM, Patel BM. Repurposing of sodium valproate in colon cancer associated with diabetes mellitus: role of HDAC inhibition. Eur J Pharm Sci. 2018;121:188–199. doi:10.1016/j.ejps.2018.05.026
42. McIntyre RL, Daniels EG, Molenaars M, et al. From molecular promise to preclinical results: HDAC inhibitors in the race for healthy aging drugs. EMBO Mol Med. 2019;11(9):e9854. doi:10.15252/emmm.201809854
43. Makkar R, Behl T, Arora S. Role of HDAC inhibitors in diabetes mellitus. Curr Res Transl Med. 2019;68(2):45–50. doi:10.1016/j.retram.2019.08.001
 © 2022 The Author(s). This work is published and licensed by Dove Medical Press Limited. The full terms of this license are available at https://www.dovepress.com/terms.php and incorporate the Creative Commons Attribution - Non Commercial (unported, v3.0) License.
By accessing the work you hereby accept the Terms. Non-commercial uses of the work are permitted without any further permission from Dove Medical Press Limited, provided the work is properly attributed. For permission for commercial use of this work, please see paragraphs 4.2 and 5 of our Terms.
© 2022 The Author(s). This work is published and licensed by Dove Medical Press Limited. The full terms of this license are available at https://www.dovepress.com/terms.php and incorporate the Creative Commons Attribution - Non Commercial (unported, v3.0) License.
By accessing the work you hereby accept the Terms. Non-commercial uses of the work are permitted without any further permission from Dove Medical Press Limited, provided the work is properly attributed. For permission for commercial use of this work, please see paragraphs 4.2 and 5 of our Terms.