")
Back to Journals » OncoTargets and Therapy » Volume 9
Double gene siRNA knockdown of mutant p53 and TNF induces apoptosis in triple-negative breast cancer cells
Authors Pileczki V, Pop L, Braicu C , Budisan L, Bolba Morar G, del C Monroig-Bosque P, Sandulescu RV, Berindan-Neagoe I
Received 18 April 2016
Accepted for publication 17 July 2016
Published 11 November 2016 Volume 2016:9 Pages 6921—6933
DOI https://doi.org/10.2147/OTT.S110719
Checked for plagiarism Yes
Review by Single anonymous peer review
Peer reviewer comments 2
Editor who approved publication: Dr Faris Farassati
Valentina Pileczki,1,2 Laura Pop,1 Cornelia Braicu,1 Livia Budisan,1 Gabriela Bolba Morar,3 Paloma del C Monroig-Bosque,4 Robert V Sandulescu,2 Ioana Berindan-Neagoe1,5,6
1The Research Center for Functional Genomics, Biomedicine and Translational Medicine, “Iuliu Hatieganu” University of Medicine and Pharmacy, Cluj-Napoca, Romania; 2Department of Analytical Chemistry, Faculty of Pharmacy, “Iuliu Hatieganu” University of Medicine and Pharmacy, 3Department of Senology, the Oncology Institute “Prof Dr Ion Chiricuta”, Cluj-Napoca, Romania; 4University of Puerto Rico School of Medicine, San Juan, Puerto Rico; 5MedFuture Research Center for Advanced Medicine, “Iuliu Hatieganu” University of Medicine and Pharmacy, Cluj-Napoca, Romania; 6Department of Functional Genomics and Experimental Pathology, the Oncology Institute “Prof Dr Ion Chiricuta”, Cluj-Napoca, Romania
Abstract: Apoptosis is the major downregulated pathway in cancer. Simultaneous inhibition using specific small interfering RNA (siRNA) of two key player genes, p53 and TNF, is an interesting and feasible strategy when it comes to investigating various molecular pathways and biological processes in triple-negative breast cancer (TNBC), which is one of the most aggressive and therapeutically unresponsive forms of breast cancers. Our present research focuses on evaluating the impact of double p53-siRNA and TNF-siRNA knockdown at a cellular level, and also evaluating cell proliferation, apoptosis, induction of autophagy, and gene expression by using reverse transcription polymerase chain reaction array approaches. Simultaneous inhibition of p53 and TNF in Hs578T TNBC human cell line revealed a panel of up- and downregulated genes involved in apoptosis. Furthermore, the effects of double gene knockdown were validated in a second TNBC cell line, MDA-MB-231, by using reverse transcription polymerase chain reaction TaqMan assay. All our findings help in understanding the functional mechanisms of extrinsic apoptosis, cell signaling pathways, and the mechanisms involved in tumor cell survival, growth, and death in TNBC.
Keywords: apoptosis, double gene silencing, mut-p53, TNF, TNBC
Introduction
Triple-negative breast cancer (TNBC) bares one of the worst prognoses in breast cancer. TNBC is characterized by a high biological aggressive nature, high rate of proliferation and invasion, as well as rapidity of metastatic site formation.1 For TNBC patients with metastasis at the time of diagnosis, death usually occurs within the first 3–5 years.2 In stage I, patients respond to systemic chemotherapy. But early relapse is common, and adjuvant hormone therapy cannot be administered because of the patients’ phenotype marked by the absence of estrogen and progesterone receptors, as well as lack of human epidermal growth factor receptor-2 (HER2) protein overexpression. A need to understand the molecular particularities of TNBC is of utmost importance and advanced novel therapeutic strategies for these high-risk patients are a necessity. With the development and evolution of personalized cancer medicine and with the guidance of sophisticated approaches like gene expression and molecular analysis, the development of highly specific and targeted agents against TNBC is currently in study with the main goal of improving outcomes in patients within aggressive phenotypes.3
With the discovery of RNA interference (RNAi) more than a decade ago, a natural silencing process that occurs in all living cells through which potentially all genes can be specifically silenced, the new era of molecular targeted therapy arrived.4 The RNAi pathway mediated through artificially synthesized small interfering RNAs (siRNAs) determines potentially different RNAi gene silencing mechanisms and presents higher specificity and efficiency compared to other antisense oligonucleotide strategies.5 siRNA is a putative knockdown tool for investigating various molecular pathways in numerous diseases and biological processes at the posttranscriptional level.6 Since cancer involves multiple alterations within various cell signaling pathways, it becomes quite essential that targeting multiple oncogenes could bring new information and help understand the complex mechanisms of oncogenic pathways;7 it could also be used for developing therapeutic tools.
P53 mutations are among the most frequent genetic alterations acquired in cancer. Approximately 50% of TNBCs present p53 mutations or express p63, a multi-isoform p53 family member required for epidermal development.8 Despite the fact that mut-p53 is unable to bind to the chromatin, it still holds the capacity to interact with many protein “partners”. The interaction between p53 pathway and diverse inflammatory conditions was proven a while ago to hold the capacity to trigger a variety of molecular responses.9
Tumor necrosis factor (TNF) is one of the leading cytokines involved in tumor genesis and development. TNF exerts its effects through its cell surface receptors that activate certain cell signaling pathways that can either determine tumor cell proliferation, angiogenesis, and metastasis or have apoptotic effect on malignant cells.10,11
The purpose of this study was to determine if inhibiting mut-p53 and TNF at the same time may lead to the induction of apoptosis in TNBC cell lines. To better understand the interplay of these two genes in the mechanisms of cancer survival, siRNA silencing was used to downregulate gene expression. In an effort to elucidate their relationship and to determine their capacity of reducing tumor cell viability through apoptosis, reverse transcription polymerase chain reaction (RT-PCR) array and cell biology analyses were performed.
Materials and methods
Cell culture and siRNA transfection
The experiments were performed using two TNBC cell lines Hs578T and MDA-MB-231, cultured in Dulbecco’s Modified Eagle’s Medium (DMEM) 4,500 mg/L glucose (Sigma-Aldrich, St Louis, MO, USA) and RPMI-1640 (Sigma-Aldrich) medium, respectively. They were supplemented with 10% fetal bovine serum (Sigma-Aldrich), 1% l-glutamine solution, and 1% penicillin–streptomycin (both from Sigma-Aldrich). For gene silencing, we used siRNA-p53 and siRNA-TNF from Ambion (Austin, TX, USA). siPORT™ NeoFX™ Transfection Agent (Life Technologies, Carlsbad, CA, USA) was used to perform the transfection, according to the manufacturer’s protocol. The transfection was done simultaneously with cell plating. For further RT-PCR studies, we used a density of 5×10⁵ cells/well in a total volume of 2 mL Opti-MEM I (Thermo Fisher Scientific, Waltham, MA, USA). For each well, we used 5 μL transfection agent and a final concentration of 40 nM siRNA. The cells were treated simultaneously with both siRNAs for p53 and TNF gene silencing. As a control, we used a scramble siRNA. Each experiment was performed in triplicate. Cells were incubated for 24 hours in a 5% CO2 incubator at 37°C and then lysed to isolate total RNA.
Cell viability assay
Hs578T cells were cultured in a 96-well plate with a flat bottom. Exactly 5×10³ cells were seeded simultaneously with the transfection, using the same concentrations as mentioned earlier. Twenty-four and 48 hours after transfection, the proliferation activity of the cells was evaluated by MTT assay (thiazolyl blue tetrazolium bromide; Sigma-Aldrich). After 2 hours of incubation at 37°C and 5% CO2, the remaining salt was washed with phosphate-buffered saline (PBS; Sigma-Aldrich) and the formazan crystals formed were dissolved in dimethyl sulfoxide. The absorbance was measured at 570 nm by using a 96-well plate spectrophotometer.
Annexin V-fluorescein isothiocyanate and tetramethylrhodamine, ethyl ester staining
To evaluate the apoptosis induction, we performed Annexin V-fluorescein isothiocyanate (FITC) and tetramethylrhodamine, ethyl ester (TMRE) staining and analyzed the transfection results through fluorescence microscopy. Exactly 5×10³ cells per well were cultured in a 96-well plate and reverse transfected with siRNA-p53 and siRNA-TNF. As a control, we used a scramble siRNA. After 24 hours of transfection, 20 μL of TMRE/Hoechst dye staining solution was added to each well and incubated for 15 minutes in a CO2 incubator at 37°C. Then, the cells were centrifuged for 5 minutes at 400× g and the supernatant discarded. Two hundred microliters of Binding Buffer with Annexin-V was added to each well and incubated for 10 minutes at room temperature. Cells were centrifuged for 5 minutes at 400× g and the supernatant discarded. One hundred microliters of Binding Buffer was added to each well and the cells were examined under a fluorescence microscope. In this assay, we used reagents from the Multi-Parameter Apoptosis Assay Kit (Cayman Chemical Company, Ann Arbor, MI, USA).
Autophagy/cytotoxicity evaluation
We used the same transfection strategy as mentioned in the previous section and evaluated if autophagy or necrosis occurred after knockdown of p53 and TNF genes in Hs578T cell line. We used the Autophagy/Cytotoxicity Dual Staining Kit (Cayman Europe) according to the manufacturer’s recommendation. After the transfection period, the cells were washed with PBS and 100 μL of cell-based propidium iodide (PI) solution was added to each well. Cells were incubated for 2 minutes at room temperature. The 96-well plate was then centrifuged for 5 minutes at 400× g. Supernatant was discarded and replaced with 100 μL of cell-based monodansylcadaverine (monodansylcadaverine) solution. Cells were incubated for 10 minutes at 37°C and then centrifuged for 5 minutes at 400× g. Supernatant was discarded and replaced with cell buffer. Images were taken with Leica inverted fluorescence microscope (Leica Microsystems, Wetzlar, Germany) and Leica Application Suite (LAS; Heerbrugg, Switzerland) software, version 3.7.0 for Microsoft. The same protocol was used to prepare cells for plate reader fluorescence detection. In both situations, we evaluated autophagy induction after 24 hours from the initiation of transfection.
RT-PCR array gene expression analysis
Total RNA was extracted using TriReagent (Sigma-Aldrich Co., St Louis, MO, USA) and purified with RNeasy Mini Kit (Qiagen, Hilden, Germany). The quality and quantity of total RNA were monitored using Agilent 2100 Bioanalyzer (Agilent Technologies, Santa Clara, CA, USA) and the spectrophotometer NanoDrop 1000 (NanoDrop Technologies, Wilmington, DE, USA). One hundred nanograms of total RNA was used for the reverse transcription reaction according to the RT2 First Strand Kit protocol. Exactly 102 μL of complementary DNA (cDNA) was used for each Human Apoptosis RT2Profiler™ PCR Array plate (SABioscience, Frederick, MD, USA). A reaction volume of 25 μL/well of RT2 SYBR Green Master mix with the appropriate RT2 Profiler Pathway “Signature” PCR Array protocol was used according to the manufacturer’s instructions. To run the RT-PCR reaction, we used Roche LightCycler 480 instrument (Hoffman-La Roche Ltd., Basel, Switzerland) and followed the cycling condition as recommended by the manufacturer.
Raw data from the PCR array were exported and analyzed using RT2 Profiler PCR Array Data Analysis v3.5 (Quiagen, Hilden, Germany) web-based automated software (http://pcrdataanalysis.sabiosciences.com/pcr/arrayanalysis.php?target=upload). QIAGEN’s Ingenuity® Pathway Analysis (IPA®, QIAGEN Redwood City, www.qiagen.com/ingenuity) software was used to decipher the data and generate networks involved in cell signaling pathways.
TaqMan RT-PCR gene expression evaluation
Half of the genes (four upregulated and three downregulated) found to be statistically significant in the PCR array were chosen to be validated through RT-PCR. Cell transfection and RNA extraction were performed exactly as described in the “Cell culture and siRNA transfection” and “RT-PCR array gene expression analysis” sections. One hundred nanograms of total RNA was used for cDNA synthesis. cDNA was prepared with Transcriptor First Strand cDNA Synthesis Kit (Hoffman-La Roche Ltd.), according to the kit protocol and the recommended cycling conditions. RT-PCR was performed using a LightCycler 480 instrument, with the LightCycler® TaqMan® Master kit (Hoffman-La Roche Ltd.). The data were normalized to glyceraldehyde 3-phosphate dehydrogenase (GAPDH) and 18S housekeeping genes. The supplementary materials contain the primer sequences for the genes of interest.
Results
Double gene inhibition promotes apoptosis in TNBC cell line
In order to assess the impact of double gene knockdown of mut-p53 and TNF in the progression of TNBC, we chose to perform functional analysis on Hs578T human cancer cell line. Evidence of apoptosis was shown by fluorescent microscopy after performing staining with TMRE and Annexin V-FITC. As shown in Figure 1A, and highlighted in Figure 1C, TMRE staining of the control group (transfected with the scramble siRNA) shows that Hs578T cells have undisrupted mitochondrial membrane potential. Also, the absence of Annexin V-FITC staining of the cellular membrane in the control group proves that the cells are not undergoing apoptosis. For the individual gene knockdown of mut-p53 and TNF, no significant differences were noticed compared to the control, 24 hours after the transfection. This is evident by the slight increase in membrane permeability and barely perceptible Annexin V-FITC marking. TMRE staining is strong for both siRNA-p53 and -TNF gene silencing; therefore, most of the cells are viable and do not undergo apoptosis or are still in the early stages of apoptosis (Figure 1A). In comparison, simultaneous silencing of mut-p53 and TNF after 24 hours, from the transfection, determined cells to undergo early apoptosis based on TMRE and Annexin V-FITC cell staining (Figure 1A). In order to determine if induction of apoptosis is correlated with the decrease in cell number, we measured cell viability by MTT assay. Switching off mut-p53 and TNF simultaneously led to loss of cell viability (Figure 1B), starting at 24 hours after transfection followed by a substantial increase in loss of cell viability after 48 hours. A difference between individual and simultaneous knockdown can also be observed at both time points. Mut-p53 gene inhibition has a slightly stronger effect on Hs578T cell viability than the inhibition caused by TNF siRNA (Figure 1B). Individual inhibition of both genes showed weaker effects than those caused by simultaneous mut-p53 and TNF silencing.
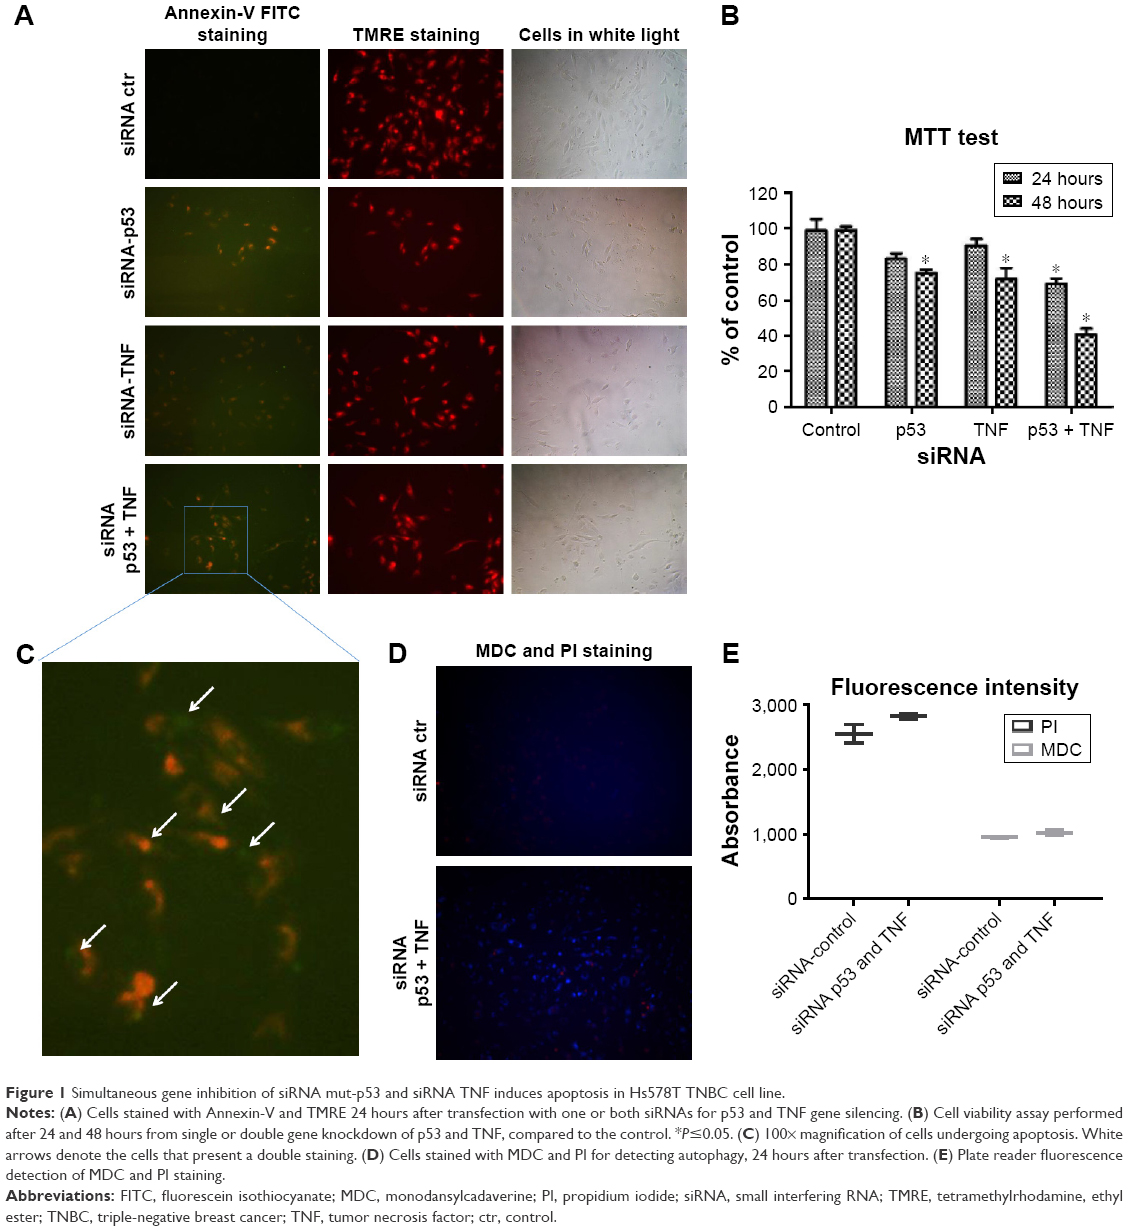 | Figure 1 Simultaneous gene inhibition of siRNA mut-p53 and siRNA TNF induces apoptosis in Hs578T TNBC cell line. |
To confirm that apoptosis is triggered and the decrease in number of viable cells is directly related to apoptosis, we performed both MDC and PI staining. We used the same transfection strategy as previously described, and evaluated if autophagy is present after simultaneous knockdown of mut-p53 and TNF genes in Hs578T cell line. In order to examine if autophagy activity is present or not, cells were visualized under a microscope with fluorescence. The results obtained showed autophagy mechanisms are barely activated in the double siRNA transfected cells compared to the control group. These observations were performed 24 hours after transfection. MDC accumulated in autophagy vacuoles to a lower degree (Figure 1D), as it can be observed by the few dot-like structures marked and distributed through the entire cytoplasm, which gives the cells blue faded color. PI staining after siRNA-p53 and -TNF transfection was not significantly different compared to the control cells, which indicates the mild capacity of the double transfection to induce necrosis. The fluorescent microscopy observations were further confirmed by spectrophotometric analysis (Figure 1E).
All functional obtained results show that simultaneous siRNA inhibition of mut-p53 and TNF do not induce autophagy or necrosis. Due to the evidence of Annexin V-FITC staining we established that the differences in cell viability index between the control and transfected cells is determined by the cell undergoing apoptosis.
Gene expression profile in apoptosis array
Due to the fact that at a biological level, we observed relevant data supporting induction of apoptosis after double gene knockdown of two important “players” involved in cancer development and evolution, we chose apoptosis PCR array technique to further investigate the modifications induced by the transfection at gene expression level. PCR array plate is designed to detect the expression levels of 84 major genes involved in regulation of apoptosis, induction of apoptosis, antiapoptosis, TNF/TNFR, BCL, BIR, CARD and Death Domain proteins, caspases, and their regulators. After analyzing the transcript quantification data by calculating the fold change with the formula 2−ΔΔCt and the P-values, we obtained statistically relevant values (P≤0.05) for 15 genes that had a different expression profile in double siRNA-transfected cells compared to the control group (cells transfected with scramble siRNA). For better visualization of the results, the data are presented as fold regulation. We established the fold regulation for upregulated and downregulated genes at ≥1.5 and ≤–.5, respectively. In this context, four genes were found to be downregulated and eleven were upregulated (Table 1; Figure 2). Significant differences in the gene expression, but with no significant fold regulation rate were revealed for BCL10, BCL2L11, BIRC2, BRAF, and MCL1 with a P<0.05 and for CASP10 and CASP4 with a P<0.01. Borderline significance (P<0.07) was observed for BNIP1, BNIP3, and CASP7 genes (Table S1).
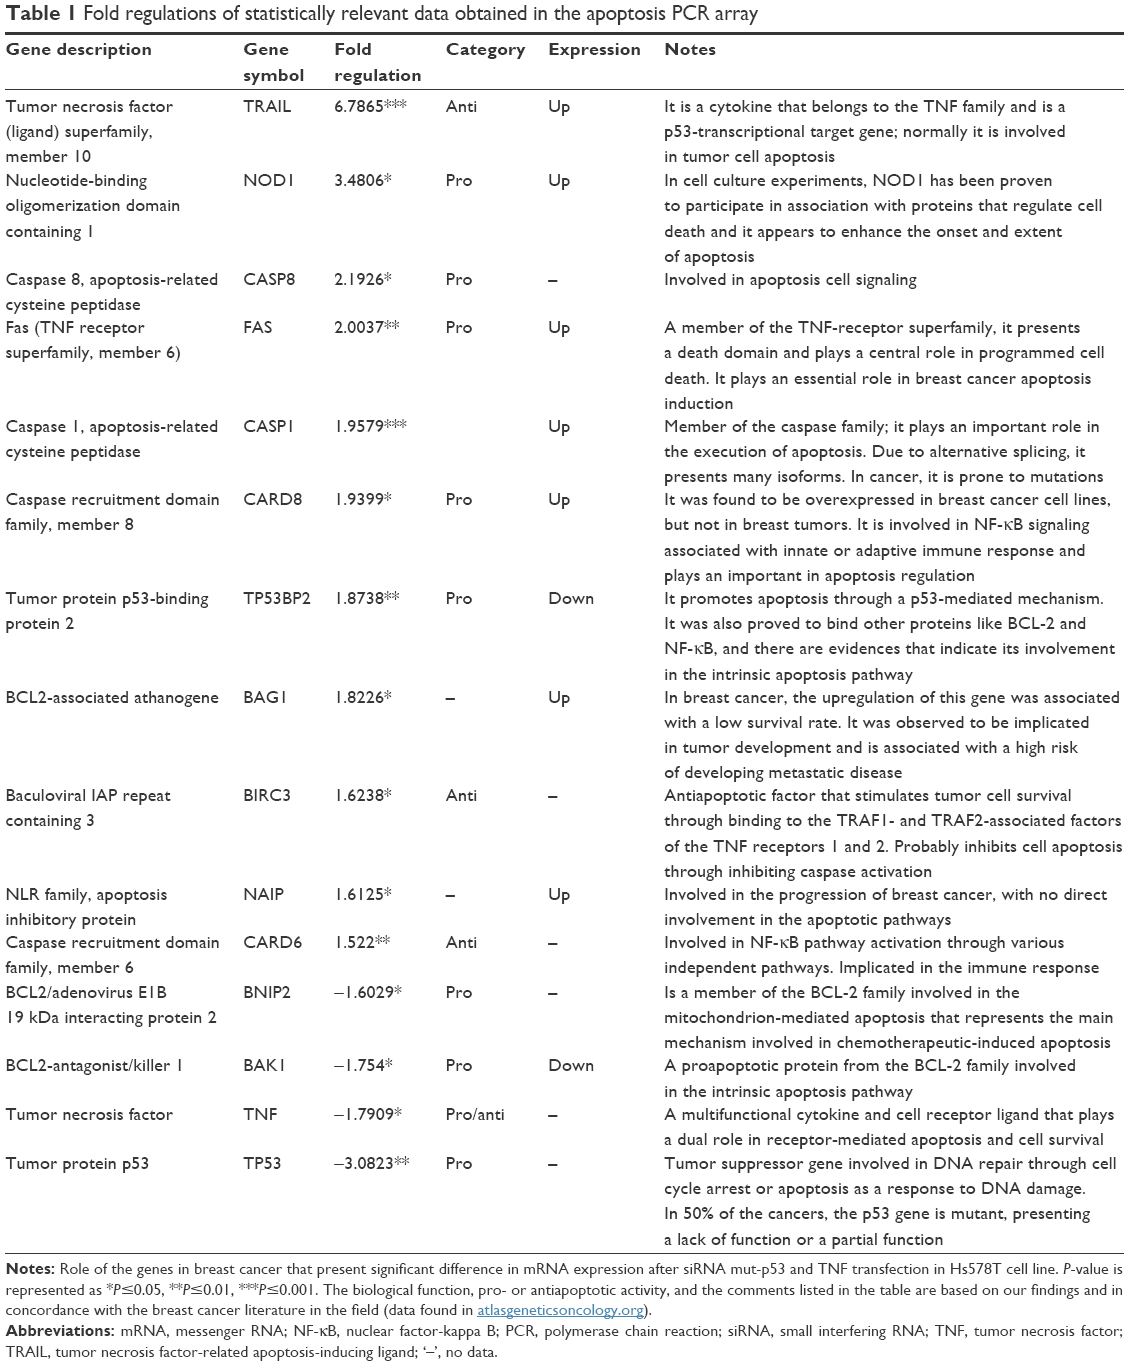 | Table 1 Fold regulations of statistically relevant data obtained in the apoptosis PCR array |
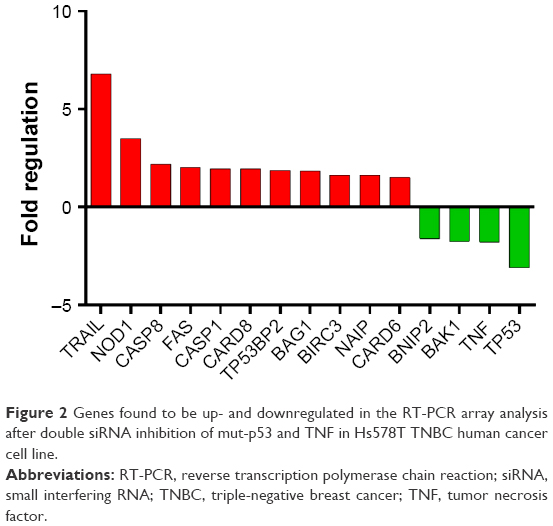 | Figure 2 Genes found to be up- and downregulated in the RT-PCR array analysis after double siRNA inhibition of mut-p53 and TNF in Hs578T TNBC human cancer cell line. |
Validation by RT-PCR TaqMan assay
The genes in the Human Apoptosis RT2Profiler™ PCR Array are predefined with known function in the processes of apoptosis. The plate was not costume-designed for our experimental conditions. As a consequence, we were not surprised that the number of differentially expressed genes was few in our experiment. In order to confirm that the changes observed on the PCR array are true and were not acquired due to a random event, we repeated the experiment in the same conditions. Seven genes identified to have altered expression levels in the array were reevaluated by TaqMan gene expression assay. These served as a technical validation of our RT-PCR array experiment (Figure 3A). Furthermore, to determine that the events observed by simultaneous siRNA posttranslational inhibition of mut-p53 and TNF are specific for TNBC, we further validated our findings on a second TNBC cell line. TaqMan gene expression was used to evaluate mRNA levels of the previously selected genes. MDA-MB-231 was selected as the second model because it presents p53 mutations and high expression levels for the TNF, like the Hs578T cell line.12 Among the seven genes, four showed a significant increase in gene expression in both cell lines; one was downregulated and the other two were p53 and TNF (Figure 3B). In both cell lines, all analyzed genes showed concordance with the PCR array. Gene expression levels were established by comparing 2−ΔΔCt values of the target genes normalized to the housekeeping genes and reported to the control. The differential expression of TRAIL, CASP8, NOD1, FAS, and BAK1 proved to be statistically significant during validation with a P<0.05. The graphs in Figure 3 show the range of fold change regulation in the simultaneous double gene inhibition, compared to the control. We also compared these data with the gene expression levels of individual knockdown of p53 and TNF and observed that TRAIL, CASP8, and FAS showed increase in gene expression if both p53 and TNF were inhibited at the same time (Figure 4B). The high level of reproducibility between the PCR array and the TaqMan validation supports the consistency of our data.
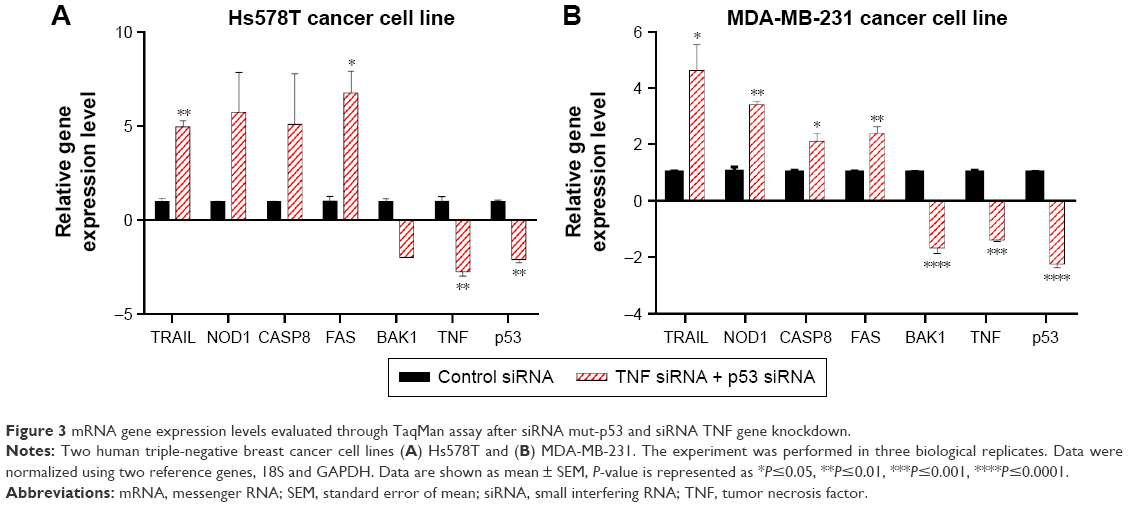 | Figure 3 mRNA gene expression levels evaluated through TaqMan assay after siRNA mut-p53 and siRNA TNF gene knockdown. |
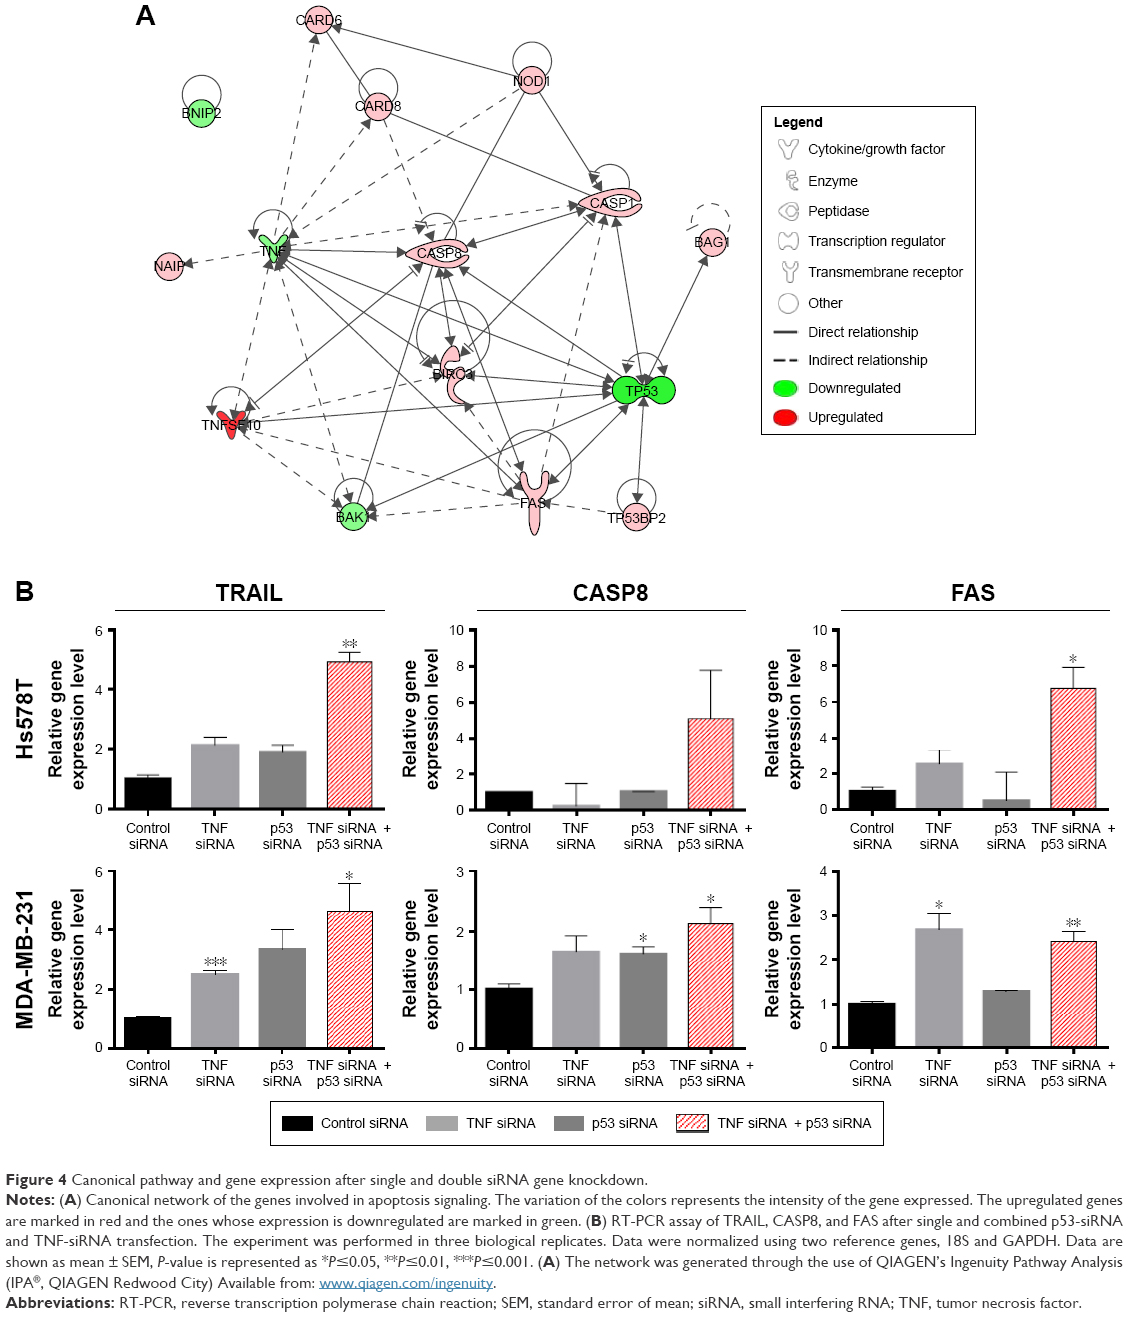 | Figure 4 Canonical pathway and gene expression after single and double siRNA gene knockdown. |
Discussion
TNBC is frequently seen in younger patients. Survival rates are usually low (within 3 years of diagnosis) because of high recurrence rates and early metastasis. Due to the lack of estrogen receptors, progesterone receptors, and HER-2/Neu expression, adjuvant hormonal and antibody therapies are inefficient. Some small-molecule inhibitors and monoclonal antibodies targeting key cellular pathways were evaluated in preclinical studies and tested in clinical trials. But none have been integrated in clinical practice due to restricted effectiveness and unknown adverse effects,13 leaving us with no combat strategies against TNBC.
In our previous study, p53 inhibition using siRNA led to reduction of cell proliferation and migration; but at the same time, we observed activation of the antiapoptotic gene, Mcl-1, which may link TNBC cancer cells to treatment resistance.14 In another study, we demonstrated that TNF gene silencing in TNBC cell line triggered apoptosis.15 Therefore, in this study, we focused our attention on identifying the effects of knockdown of both genes and determining if they potentiate each other’s effect. More and more accumulating evidences in the last few years indicate the interplay of mut-p53 and TNF in TNBC tumorigenesis and progression. Recent studies associate higher constitutive TNF expression of TNBC with distant tumor metastasis.16 According to Pastor et al, TNF overexpression increases the nuclear expression of p53.17 This was demonstrated in a colon cancer cell line that expresses p53 mutations. When tested in a p53 wild-type cancer cell line, no changes in p53 expression were observed. The evidence showing p53 mutations in the no dysplastic ulcerative colitis18 and cytokine overexpression in the chronically inflammatory mucosa,19 a premalignant stage of the colon cancer, might suggest that TNF plays an important role in upregulating mutant p53 in the nucleus of colonic epithelial cells. In support of the data reported by Pastor et al17 when double gene knockdown was performed by us, 48 hours after transfection, the protein levels of tumor protein p53 (TP53) were found to be lower then those of single gene knockdown by p53 siRNA. Data are shown in Figure S1. Therefore, mut-p53 may be a key regulator of the shift between inflammation and tumorigenesis. Previous studies report that mut-p53 regulates numerous downstream signaling pathways upon TNF receptor stimulation. It was observed that mut-p53 supports TNF-induced activation of the nuclear factor-kappa B (NF-κB).20–22 In a TNBC cell line (MDA-MB-231), besides demonstrating that mut-p53 in response to TNF activates the NF-κB pathway, Di Minin et al demonstrated that mut-p53 reduces the capacity of TNF to induce activation of ASK1/JUN kinases (apoptosis signal-regulating kinase 1/c-Jun N-terminal kinases).23 They suggest the following scenario: mut-p53 interacts in the cytoplasm with DAB2IP that no longer represses TNF signaling and activates NF-κB, determining an invasion-promoting signaling profile. NF-κB pathway blocks apoptosis by stimulating the synthesis of antiapoptotic genes, such as the members of the BCL-2 family. Therefore, they suggest that the ability of mut-p53 to functionally connect and be relevant for several networks within a complex signaling pathway is determined by TNF. In return, TNF synthesis is regulated by mut-p53, which results in a continuous loop that upholds survival-signaling pathways of cancer. By proposing a double gene knockdown of mut-p53 and TNF at the same time, we expect to break out of this loop and tip the balance toward apoptosis.
Therefore, by applying this strategy, we identified new potential regulators that lean the balance between survival and death in TNBC cell lines. One such molecule is tumor necrosis factor-related apoptosis-inducing ligand (TRAIL) which has been shown to mediate regression of cancer xenografts in animal models and is currently included in human Phase I clinical studies.24 Surveys on breast cancer cell lines have shown that TNBC cells are the most sensitive to TRAIL-induced apoptosis.25 In a study performed by Rahman et al, almost all of the TNBC cancer cell lines tested showed sensitivity to TRAIL-induced apoptosis, in comparison with HER-2–positive breast cancer cell lines, where only two out of ten showed a response in relation to TRAIL.26 Also, none of the cell lines that present estrogen receptors showed modifications when TRAIL was added to the culture medium.3,27,28 These data come in support of our findings whereby concomitant siRNA-mediated mut-p53 and TNF gene silencing in TNBC cell lines led to the upregulation of TRAIL, which is probably the reason why apoptosis is observed in the experiment. TRAIL triggers extrinsically mediated apoptosis by binding to its cell membrane receptors leading to the formation of the death-inducing signaling complex. This is mainly done by the activation of the procaspase-8, which further activates the apoptosis executors, caspase-3 and caspase-7.29
TRAIL is inhibited by TNF expression; therefore, by knocking down TNF, we observed an upregulation of the TRAIL mRNA levels. As expected, when associated with mut-p53 inhibition, the expression levels of TRAIL mRNA increased even more in both TNBC cell lines (Figure 4B). An upregulation of CASP8 can also be observed in double gene knockdown. Inhibition of mut-p53 and TNF can trigger the activation of compensatory mechanisms represented by TRAIL. TRAIL is also known to have double functions, either to sustain apoptosis or to inhibit it. Overexpression of TRAIL in TNBC was associated with induction of apoptosis.30 Our experiment indicates that mut-p53 and TNF inhibition may be related to TRAIL apoptosis induction, as observed from the PCR array data and validated by RT-PCR. A direct link between inhibition of NF-κB and TRAIL sensitivity in breast cancer cells was shown by Garimella et al.31
The underlying mechanisms of TNBC are not clearly understood. Therefore, investigations into the pathways that regulate sensitivity of cancer cell lines to TRAIL show potential in discovering new therapeutic strategies in TNBC management. TRAIL may have future utility in cancer treatment because of its ability to target the tumor cells specifically and not to affect the normal cells.32
Multiple genes that show significant differential expression between control and double gene siRNA knockdown are associated with pro- and antiapoptotic regulatory mechanisms. A network showing the relationship between these genes was generated with the help of Ingenuity Pathway Analysis33 and is presented in Figure 4A. FAS is a cell surface receptor that belongs to the TNF superfamily, and was found to be upregulated in our experiment (Figure 4B). Through binding of its ligand, it determines large-scale clustering of the death-inducing signaling complex and caspase activation.34 CASP1, the apoptotic effector with the function of overseeing proper fulfillment of apoptotic signals, was also observed to be upregulated. NAIP was identified by Choi et al35 to play a role in breast cancer progression in patients with unfavorable clinical features. Tatsumi et al reported that BNIP2 negatively regulates AKT prosurvival pathway through BMCC1 and induces apoptosis in human cancer cells.36 Polymorphisms of this gene were associated with various cancers, including breast cancer.37 BAG1 is a multifunctional protein with numerous targets that is implicated in the regulation of cell growth and apoptosis of cancer cells. It was found to block the function of FAS and TRAIL receptors.38 Although CASP10 was expressed with borderline significance in our array data, literature shows that the caspase regulates the shift between autophagy and apoptosis.39 BNIP2 gene does not have a direct connection with apoptosis in cancer, but it may be involved in the regulatory mechanisms of normal apoptosis as well as other cellular mechanisms present in our PCR array. These may be linked to TNBC heterogeneity. We also observed an upregulated expression profile of the BIRC3 protein, which is known as an antiapoptotic factor, and an upregulated expression of the TP53BP2 gene, both of which are possibly involved in the intrinsic apoptosis pathway. BAK1 is a key regulator of the intrinsic pathway and was found to be downregulated in our experiment. This can be explained by the fact that apoptosis is exclusively induced by the extrinsic pathway.40
Complete comprehension of mut-p53 and TNF biology using preclinical models will likely help to further understand the molecular mechanisms of TNBC. Integrating the results obtained at the transcriptional level after double gene siRNA inhibition in both TNBC cell lines led to the identification of new key regulators of apoptosis. This approach can establish the bases of a new therapeutic strategy of inducing apoptosis and reducing cell proliferation in TNBC.
Conclusion
In conclusion, our study showed that the upregulation of two strong positive regulators of apoptosis, TRAIL and FAS, after siRNA-mediated mut-p53 and TNF silencing increased the expression of caspase-8, an activator of effector caspase. Gene expression data and functional analysis suggest that simultaneous knockdown of mut-p53 and TNF may be involved in triggering apoptosis in TNBC cells. Therefore, they may present a regulatory effect in apoptosis of TNBC and serve as target genes for a potential molecular treatment.
Acknowledgments
Valentina Pileczki’s work was partially financed by “Iuliu Hatieganu” University of Medicine and Pharmacy, The Research Center for Functional Genomics, Biomedicine and Translational Medicine, Cluj-Napoca, Romania, internal grant no: 1492/4/28.01.2014.
This work was financed by the POSCCE 709/2010 grant with the title, “Clinical and economical impact of proteom and transcriptom molecular profiling in neoadjuvant therapy of triple negative breast cancer (BREASTIMPACT)”.
Disclosure
The authors report no conflicts of interest in this work.
References
Arnedos M, Bihan C, Delaloge S, Andre F. Triple-negative breast cancer: arewe making headway at least? Ther Adv Med Oncol. 2012;4(4):195–210. | ||
Pal SK, Childs BH, Pegram M. Triple negative breast cancer: unmet medical needs. Breast Cancer Res Treat. 2012;125(3):627–636. | ||
Anders C, Carey LA. Understanding and treating triple-negative breast cancer. Oncology (Williston Park). 2008;22(11):1233–1239. | ||
Yu Z, Pestell RG. Small non-coding RNAs govern mammary gland tumorigenesis. J Mammary Gland Biol Neoplasia. 2012;17(1):59–64. | ||
Ramachandran PV, Ignacimuthu S. RNA interference as a plausible anticancer therapeutic tool. Asian Pac J Cancer Prev. 2012;13(6):2445–2452. | ||
Fakhr E, Zare F, Teimoori-Toolabi L. Precise and efficient siRNA design: a key point in competent gene silencing. Cancer Gene Ther. 2016;23(4):73–82. | ||
Al-Lazikani B, Banerji U, Workman P. Combinatorial drug therapy for cancer in the post-genomic era. Nat Biotechnol. 2012;30(7):679–692. | ||
Lacroix M, Toillon RA Leclercq G. p53 and breast cancer, an update. Endocr Relat Cancer. 2006;13(2):293–325. | ||
Cooks T, Harris CC. p53 mutations and inflammation-associated cancer are linked through TNF signaling. Mol Cell. 2014;56(5):611–612. | ||
Varfolomeev E, Vucic D. Intracellular regulation of TNF activity in health and disease. Cytokine. 2016; Epub 2016. | ||
Cai W, Kerner ZJ, Hong H, Sun J. Targeted cancer therapy with tumor necrosis factor-alpha. Biochem Insights. 2008;2008:15–21. | ||
Yu M, Zhou X, Niu L, et al. Targeting transmembrane TNF-α suppresses breast cancer growth. Cancer Res. 2013;73(13):4061–4074. | ||
Peddi PF, Ellis MJ, Ma C. Molecular basis of triple negative breast cancer and implications for therapy. Int J Breast Cancer. 2012;2012:217185. | ||
Braicu C, Pileczki V, Irimie A, Berindan-Neagoe I. p53siRNA therapy reduces cell proliferation, migration and induces apoptosis in triple negative breast cancer cells. Mol Cell Biochem. 2013;381(1–2):61–68. | ||
Pileczki V, Braicu C, Gherman C, Berindan-Neagoe I. TNF-α gene knockout in triple negative breast cancer cell line induces apoptosis. Int J Mol Sci. 2012;14(1):411–420. | ||
Li HH, Zhu H, Liu LS, et al. Tumour necrosis factor-α gene polymorphism is associated with metastasis in patients with triple negative Breast cancer. Sci Rep. 2015;5:10244. | ||
Pastor DM, Irby RB, Poritz LS. Tumor necrosis factor alpha induces p53 up-regulated modulator of apoptosis expression in colorectal cancer cell lines. Dis Colon Rectum. 2010;53(3):257–263. | ||
Mitsuhashi J, Mikami T, Saigenji K, Okayasu I. Significant correlatioof morphological remodeling in ulcerative colitis with disease duration and between elevated p53 and p21 expression in rectal mucosa and neoplastic development. Pathol Int. 2005;55(3):113–121. | ||
Alkim C, Savas B, Ensari A, et al. Expression of p53, VEGF, microvessel density, and cyclin-D1 in noncancerous tissue of inflammatory bowel disease. Dig Dis Sci. 2009;54(9):1979–1984. | ||
Cooks T, Pateras IS, Tarcic O, et al. Mutant p53 prolongs NF-κB activation and promotes chronic inflammation and inflammation-associated colorectal cancer. Cancer Cell. 2013;23(5):634–646. | ||
Schneider G, Henrich A, Greiner G, et al. Cross talk between stimulated NF-kappaB and the tumor suppressor p53. Oncogene. 2010;29(19):2795–2806. | ||
Weisz L, Damalas A, Liontos M, et al. Mutant p53 enhances nuclear factor kappaB activation by tumor necrosis factor alpha in cancer cells. Cancer Res. 2007;67(6):2396–2401. | ||
Di Minin G, Bellazzo A, Dal Ferro M, et al. Mutant p53 reprograms TNF signaling in cancer cells through interaction with the tumor suppressor DAB2IP. Mol Cell. 2014;56(5):617–629. | ||
Yerbes R, Palacios C, Lopez-Rivas A. The therapeutic potential of TRAIL receptor signalling in cancer cells. Clin Transl Oncol. 2011;13(12):839–847. | ||
Rahman M, Davis SR, Pumphrey JG, et al. TRAIL induces apoptosis in triple-negative breast cancer cells with a mesenchymal phenotype. Breast Cancer Res Treat. 2009;113(2):217–230. | ||
Rahman M, Pumphrey JG, Lipkowitz S. The TRAIL to targeted therapy of breast cancer. Adv Cancer Res. 2009;103:43–73. | ||
Buchsbaum DJ, Zhou T, Grizzle WE, et al. Antitumor efficacy of TRA-8 anti-DR5 monoclonal antibody alone or in combination with chemotherapy and/or radiation therapy in a human breast cancer model. Clin Cancer Res. 2003;9(10 Pt 1):3731–3741. | ||
Garimella SV, Gehlhaus K, Dine JL, et al. Identification of novel molecular regulators of tumor necrosis factor-related apoptosis-inducing ligand (TRAIL)-induced apoptosis in breast cancer cells by RNAi screening. Breast Cancer Res. 2014;16(2):R41. | ||
Green DR, Llambi F. Cell death signaling. Cold Spring Harb Perspect Biol. 2015;7(12):pii a006080. | ||
Hellwig CT, Rehm M. TRAIL signaling and synergy mechanisms used in TRAIL-based combination therapies. Mol Cancer Ther. 2012;11(1):3–13. | ||
Keane MM, Rubinstein Y, Cuello M, et al. Inhibition of NF-κB activity enhances TRAIL mediated apoptosis in breast cancer cell lines. Breast Cancer Res Treat. 2000;64:211–219. | ||
Walczak H, Miller RE, Ariail K, et al. Tumoricidal activity of tumor necrosis factor-related apoptosis-inducing ligand in vivo. Nat Med. 1999;5(2):157–163. | ||
The [networks, functional analyses, etc.] were generated through the use of QIAGEN’s Ingenuity Pathway Analysis (IPA®, QIAGEN Redwood City) Available from: www.qiagen.com/ingenuity. Accessed March 1, 2016. | ||
Fu Q, Fu TM, Cruz AC, et al. Structural basis and functional role of intramembrane trimerization of the Fas/CD95 death receptor. Mol Cell. 2016;61(4):602–613. | ||
Choi J, Hwang YK, Choi YJ, et al. Neuronal apoptosis inhibitory protein is overexpressed in patients with unfavorable prognostic factors in breast cancer. J Korean Med Sci. 2007;22 Suppl:S17–S23. | ||
Tatsumi Y, Takano R, Islam MS, et al. BMCC1, which is an interacting partner of BCL2, attenuates AKT activity, accompanied by apoptosis. Cell Death Dis. 2015;6:e1607. | ||
Ozbayer C, Kurt H, Bayramoglu A, et al. The role of NOD1/CARD4 and NOD2/CARD15 genetic variations in lung cancer risk. Inflamm Res. 2015;64(10):775–779. | ||
Wang Y, Ha M, Liu J, Li P, Zhang W, Zhang X. Role of BCL2-associated athanogene in resistance to platinum-based chemotherapy in non-small-cell lungcancer. Oncol Lett. 2016;11(2):984–990. | ||
Lamy L, Ngo VN, Emre NC, et al. Control of autophagic cell death by caspase-10 in multiple myeloma. Cancer Cell. 2013;23(4):435–449. | ||
Fox JL, Storey A. BMX negatively regulates BAK function, thereby increasing apoptotic resistance to chemotherapeutic drugs. Cancer Res. 2015;75(7):1345–1355. |
Supplementary materials
Primers’ sequence
GAPDH: | Right: CAC CTT CCC CAT GGT GTC T |
18S: | Right: CGC TCC ACC AAC TAA GAA CG |
TNF: | Right: TGG GGA ACT CTT CCC TCT G |
NOD1: | Right: GGC GAG ATA CTT CCC TCC TT |
CASP8: | Right: TTT CTG CTG AAG TCC ATC TTT TT |
TNFSF10: | Right: CAG AGC CTT TTC ATT CTT GGA |
BAK1: | Right: CCG CGA GAC TCC AGT GAT |
FAS: | Right: GAG ACG AGC TCA CGA AAA GC |
P53: | Right: CCC TTT TTG GAC TTC AGG TG |
Western blot
Cells for each treatment strategy as mentioned earlier were seeded at a confluence of half a million/well in a six-well plate. After 48 hours of treatment, the medium was removed and the cells were removed by scrapping in 200 μL of cell lysis solution (containing 2.5 mM Tris–HCl [pH 6.8 at 25°C], 2% sodium dodecyl sulfate, 10% glycerol, 50 mM dithiothreitol, and bromophenol blue) and sonicated for 30 seconds. The protein content of each sample was determined with the BCA™ Protein Assay Kit – Reducing Agent Compatible (Thermo Fisher Scientific, Waltham, MA, USA). An equal amount of protein from each sample was electrophoresed through an 8% polyacrylamide gel using tris–glycine–sodium dodecyl sulfate buffer and transferred to polyvinylidene difluoride membranes. The membranes were blocked with a 5% skim milk solution for 1 hour and then incubated overnight with the primary antibody at 4°C. The blot was probed with BAK-1 (1:500) from Cell Signaling Technology (Danvers, MA, USA), p53 (1:1,000), and β-actin (1:1,000) (the last two antibodies were from R&D Systems, Minneapolis, MN, USA). Membranes were washed and then incubated for 2 hours with antirabbit secondary antibody (1:1,000, Dako Cytomation, Glostrup, Denmark). Chemical staining of the membranes was performed with Metal Enhanced DAB Substrate Kit (Thermo Fisher Scientific).
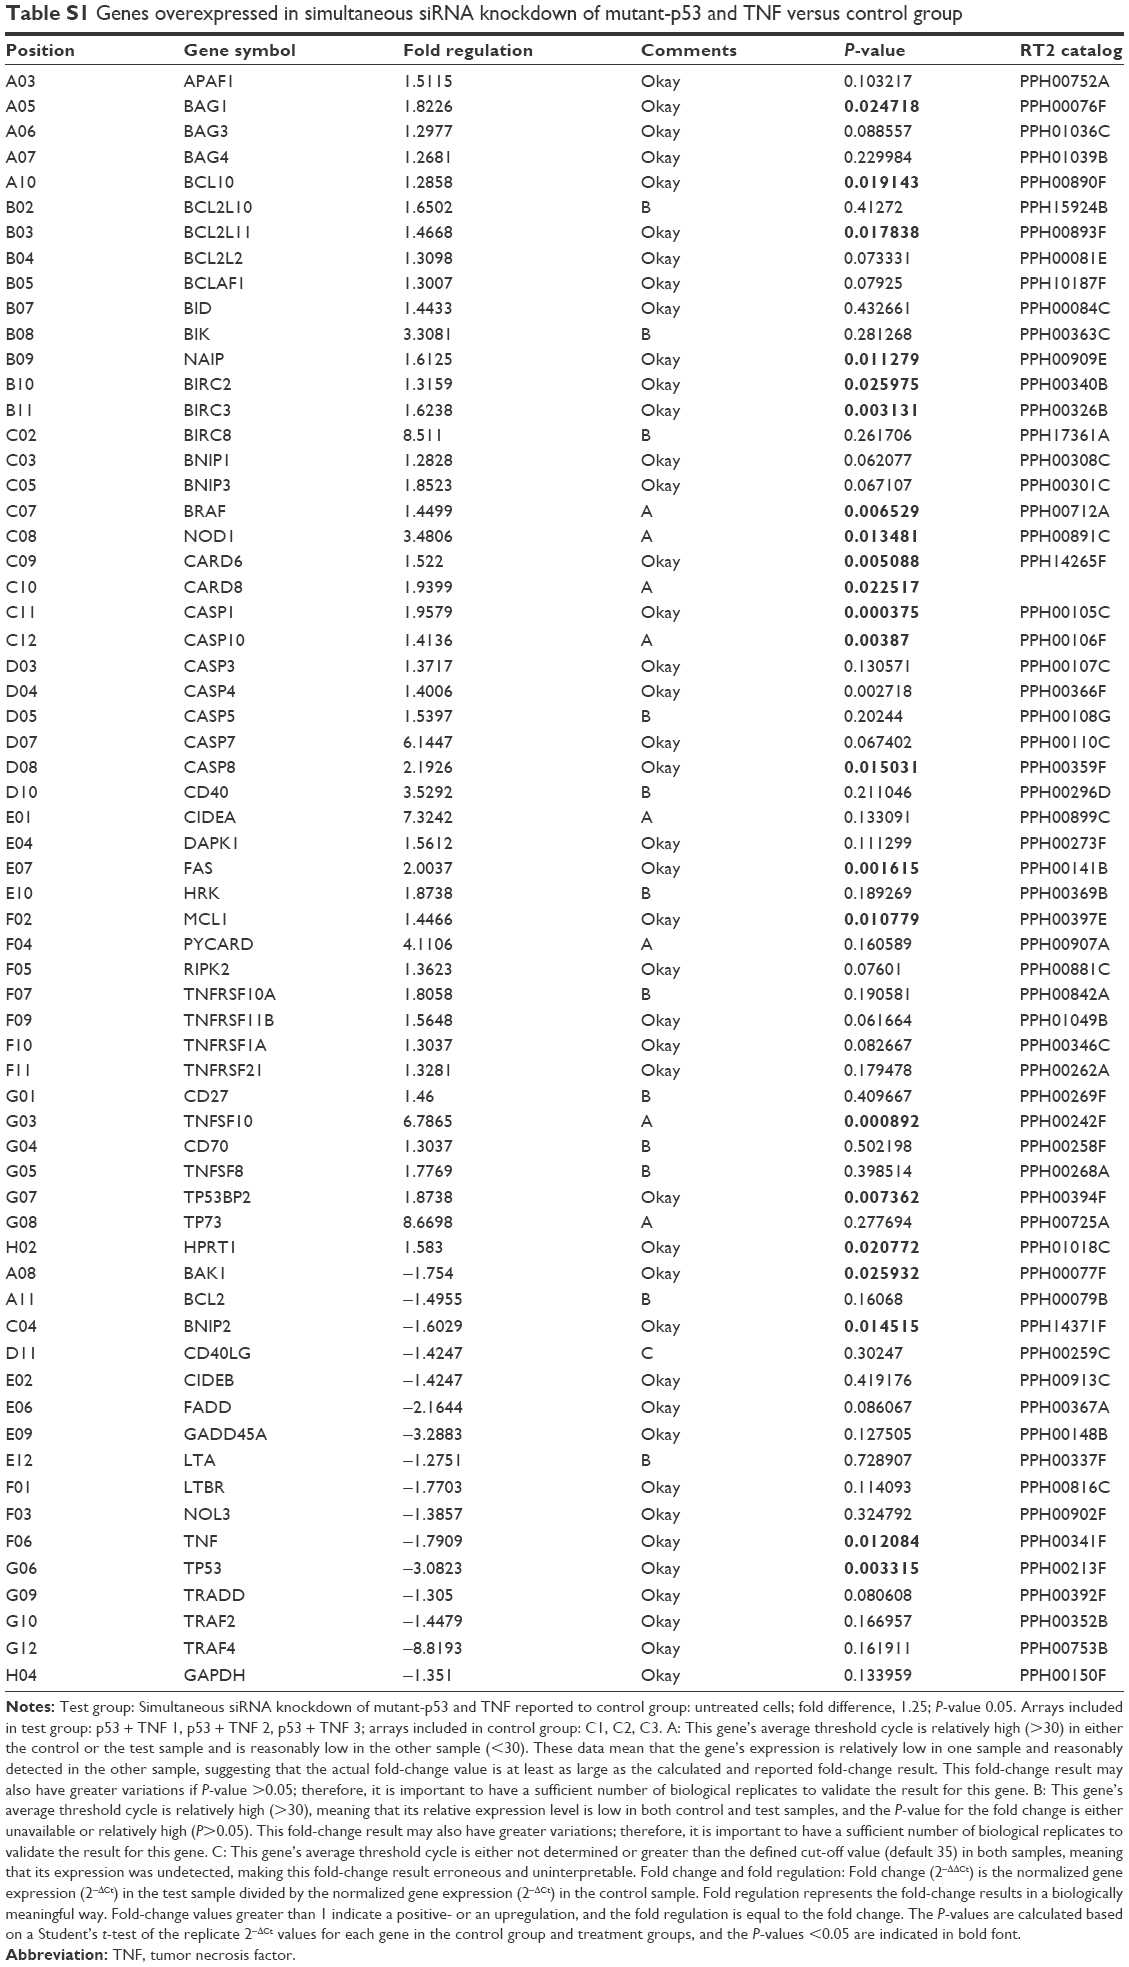 | Table S1 Genes overexpressed in simultaneous siRNA knockdown of mutant-p53 and TNF versus control group |
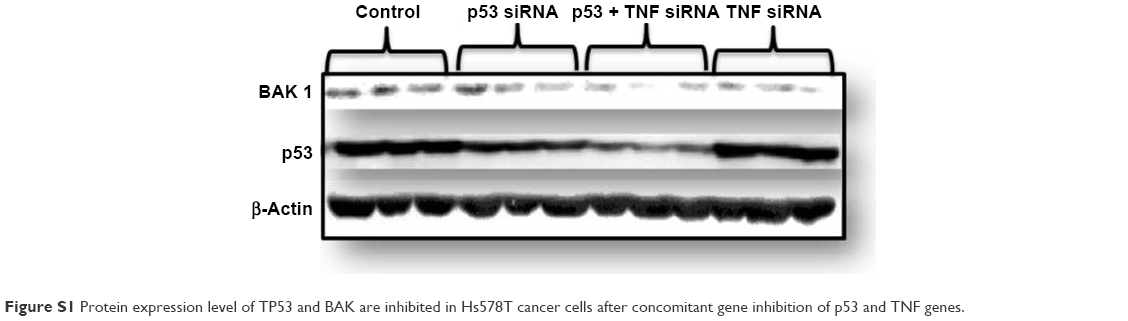 | Figure S1 Protein expression level of TP53 and BAK are inhibited in Hs578T cancer cells after concomitant gene inhibition of p53 and TNF genes. |
 © 2016 The Author(s). This work is published and licensed by Dove Medical Press Limited. The full terms of this license are available at https://www.dovepress.com/terms.php and incorporate the Creative Commons Attribution - Non Commercial (unported, v3.0) License.
By accessing the work you hereby accept the Terms. Non-commercial uses of the work are permitted without any further permission from Dove Medical Press Limited, provided the work is properly attributed. For permission for commercial use of this work, please see paragraphs 4.2 and 5 of our Terms.
© 2016 The Author(s). This work is published and licensed by Dove Medical Press Limited. The full terms of this license are available at https://www.dovepress.com/terms.php and incorporate the Creative Commons Attribution - Non Commercial (unported, v3.0) License.
By accessing the work you hereby accept the Terms. Non-commercial uses of the work are permitted without any further permission from Dove Medical Press Limited, provided the work is properly attributed. For permission for commercial use of this work, please see paragraphs 4.2 and 5 of our Terms.