")
Back to Journals » Cancer Management and Research » Volume 13
Dose–Effect Relationship Between Gastric Cancer and Common Digestive Tract Symptoms and Diagnoses in Anhui, China
Authors Tang M, Shen X, Chai J, Cheng J, Wang D
Received 1 April 2021
Accepted for publication 29 May 2021
Published 22 June 2021 Volume 2021:13 Pages 4955—4966
DOI https://doi.org/10.2147/CMAR.S313771
Checked for plagiarism Yes
Review by Single anonymous peer review
Peer reviewer comments 2
Editor who approved publication: Dr Eileen O'Reilly
Mengsha Tang,1 Xingrong Shen,2 Jing Chai,2 Jing Cheng,2 Debin Wang1,2
1School of Public Health, Anhui Medical University, Hefei, Anhui, People’s Republic of China; 2School of Health Service Management, Anhui Medical University, Hefei, Anhui, People’s Republic of China
Correspondence: Debin Wang Tel/Fax +86-0551-65116395
Email [email protected]
Background: Early prevention and diagnosis are key to reducing the huge burden of gastric cancer (GC). Nearly half of the population worldwide are suffering from some form of digestive tract conditions (symptoms/diagnoses, DTCs) but their relations with GC are not well understood. We aim to explore the relationships (especially dose–effect relationships) between GC and DTCs.
Methods: This study used data from a community-based case–control study in Anhui, China during 2016– 2019 and performed multivariate conditional logistic regression modeling of the associations between GC and DTCs.
Results: A total of 2255 participants (451 cases and 1804 controls) completed the study. Statistically significant relations (P< 0.05) were found between GC and the presence of gastroesophageal reflux [odds ratio (OR)=1.41], odynophagia (OR=1.87), stomach discomfort (OR=1.86), poor appetite (OR=2.01) and Helicobacter pylori (H. pylori) infection (OR=4.39). When the DTCs were divided into duration grades, all these ORs presented an increasing trend (P< 0.05), being 1.89 to 2.45 for gastroesophageal reflux, 1.63 to 3.78 for stomach discomfort, 2.36 to 5.29 for poor appetite, and 3.95 to 10.03 for H. pylori infection. When the DTCs were divided into severity grades, the ORs also witnessed an increasing trend (P< 0.05), being 1.69 to 2.52 for gastroesophageal reflux, 2.44 to 3.56 for stomach discomfort, and 2.22 to 2.75 for poor appetite. When the DTCs were divided into duration-severity grades, the ORs displayed a much steeper increasing trend, being 0.49 to 4.96 for gastroesophageal reflux, 1.50 to 6.33 for odynophagia, 0.47 to 3.32 for stomach discomfort, and 0.40 to 10.47 for poor appetite. In contrast, the ORs for the lower DTCs were generally tested without statistical significance.
Conclusion: The study revealed consistent dose–effect associations between GC and duration of gastroesophageal reflux, stomach discomfort, poor appetite, and H. pylori infection; severity of gastroesophageal reflux, stomach discomfort and poor appetite; and duration-severity of gastroesophageal reflux, odynophagia, stomach discomfort and poor appetite. These should inform future prevention, diagnosis and further research in patients with GC.
Keywords: gastric cancer, digestive tract, symptoms, case–control study, dose–effect relations
Introduction
Gastric cancer (GC) is the fifth largest cancer with nearly 769,000 people dying from the disease in 2020.1 Men are more likely to suffer from GC than women.1,2 GC incidence and mortality vary greatly from area to area. There will be about 16,160 new cases of GC diagnosed in men and 10,400 new cases in women in the United States in 2021.2 Being a nation with the largest population in the world, China has the largest numbers of new cases and deaths due to GC each year.1 GC incidence ranks the second among all malignant tumors in China and Anhui, an inland province located in the southeast of the nation.3,4
Numerous clinical studies indicate that the average 5-years survival rate of GC was 20%.5–7 If diagnosed and treated before the cancer invades the gastric muscle layer, the survival rate can be increased to 90%.8 However, early diagnosis depends heavily upon thorough understanding of the relationships between GC and digestive tract conditions (DTCs), which comprise a complex range of symptoms or diagnoses including gastroesophageal reflux, stomach discomfort, poor appetite, chronic gastritis, Helicobacter pylori (H. pylori) infection, appendicitis and others. Most of these conditions are very common and persistent and thus may have important effects on GC.9–14 Nearly half of the world’s population are suffering from some form of DTCs.15–17 Gastroesophageal reflux, for instance, affected 8–33% of people and was associated with a significantly increased risk of gastric cardia adenocarcinoma (by 2–4 times in many studies).18–21 A case–control study in Henan province, China, indicated that stomach discomfort was associated with 1.57-fold risk of GC.22 A large case–control study nested in the European Prospective Investigation on Cancer and Nutrition found a 3.3-fold risk of GC and a 11.0-fold risk of cardia GC among individuals with severe chronic atrophic gastritis (SCAG).23 According to a systematic review and meta-analysis, H. pylori infection was associated with a 2.56-fold risk of GC.24 A study by Cope et al on a large Swedish cohort of children who had appendectomy during 1965–1993 found a significantly elevated risk of GC [standardized incidence ratio (SIR) = 2.45].25
Previous studies have focused primarily on the associations between GC and simply the presence or experience of the DTCs with little attention being paid on their duration and severity. This study takes into consideration of not only the presence but also duration and severity of common digestive conditions and tries to assess and compare their relationships with GC from varied, especially dose–effect, perspectives.
Materials and Methods
Study Design and Participants
This study used data from an umbrella case–control study of six most common cancers in Anhui, China, including lung cancer, female breast cancer, esophagus cancer, GC, liver cancer and colorectal cancer. This umbrella study used a community-based case-control design and participants were determined via site selection, case identification and control matching. The site selection adopted a stratified randomization approach which proceeded through 1) divide whole Anhui province into north, middle and south regions; 2) randomly select three counties from each of the regions; and 3) randomly draw two townships from each of the counties selected as the study sites.
The case identification was based on two data sources: Medical Insurance Reimbursement System of the site townships, and the electronic records kept by all the primary care givers within the site townships. After informed consent, a researcher searched the two data sources for all eligible cancer cases using pre-designed algorithms. The eligibility criteria included male and female patient who 1) had been diagnosed, by a county or higher-level hospital, with primary cancer of the six types mentioned above (including GC) within the past year; and 2) was able and willing to complete the pre-designed survey either by the patient himself/herself or a close relative.
The control matching was based on sex, age and location. More specifically, for each cancer patient identified above, one resident was recruited who 1) had not been diagnosed with any cancer; 2) were of the same sex and within a 5-year age difference of the case under concern; and 3) were living in the same community of the case.
Study Content and Data Collection
In relation to GC, the study used a structured questionnaire consisting of two categories of variables: a) social demographics (eg, age, sex and residence); and b) common DTCs, eg, gastroesophageal reflux, odynophagia, stomach discomfort, poor appetite, chronic gastritis and H. pylori infection (for details of the questionnaire, please see online Supplementary Appendix 1). The questionnaire was pilot tested before this study26 and administered face-to-face by trained medical graduate students at the households of the case and control participants during January 2016 to August 2019.
Value Assignment
Methods used in assigning values to the responses to different survey questions varied. For presence of digestive conditions, “Yes” and “No” was assigned 1 and 0 respectively. For the grade of accumulative years of a given digestive condition, the value was assigned according to the interquartile range (IQR) as estimated from all the participants who had reported presence of the condition. In other words, the grade of accumulative years of a given condition (say stomach discomfort) for a specific participant (say Px) was assigned 2, 3, 4 and 5 respectively, if Px’s accumulative years of stomach discomfort falls within the first, second, third and fourth IQR. The value assignment for the grade of severity of digestive conditions adopted similar approach in terms of days of presence of a condition under concern per month instead of accumulative years of the condition. The study also used “duration-severity” grade to measure the combined feature of digestive conditions. Value assignment for this generated variable utilized a two-step approach. Step 1, taking the above example again, calculated a duration-severity score for Px’s stomach discomfort by adding the duration grade and severity grade assigned above for the same symptom. Step 2 assigned a value of duration-severity grade as 2, 3, 4 or 5 according to the IQR as generated from the duration-severity score of all the participants who had reported stomach discomfort.
Statistical Analysis
Given the broad criteria for matching the cases and controls, part of the residents recruited as controls for the other five type of cancers also met the criteria to be treated as the controls for GC. As a result, this study was able to find four controls for each GC case. In other words, the statistical analysis used all the GC cases and 4-times the number of controls.
The analysis consisted mainly of descriptive of estimations and conditional logistic regression modeling. The descriptive analysis included calculation of numbers, percentages or means of sex, age, residence by case and control groups and Chi-square test of differences between different subgroups. The conditional logistic regression analysis included both univariate and multivariate modeling using GC as the dependent variable and the presence, duration grade, severity grade and duration-severity grade of common DTCs as the independent variables. Two-sided P value <0.05 was considered statistically significant in both the descriptive and regression analysis. EpiData 3.1 electronic survey questionnaire was used for data collection and SPSS 16.0, SAS 9.2 and Excel 2013, for data sorting and statistical analysis.
Results
Characteristics of Study Population
A total of 459 GC cases and 2661 controls were approached, of whom 451 cases and 1804 controls completed the survey. As shown in Table 1, the sex, residence and age were well balanced between case and control participants. There was no statistically significant difference in sex, residence and age (p>0.05). The mean age was 62.28±10.25 years for cases and 62.01±10.14 years for controls. The number of men (1416) was 3.65 times that of women (388). The number of rural participants (1096) was 1.55 times that of the urban participants (708).
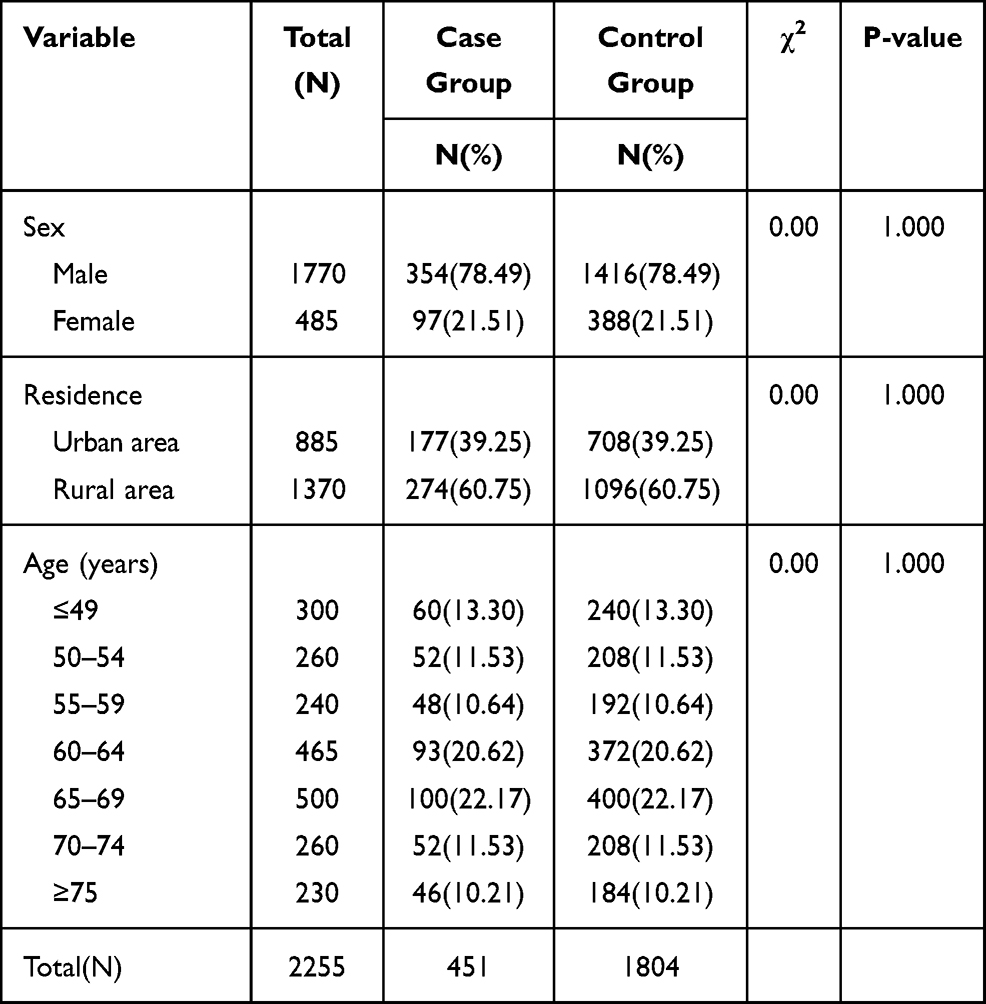 |
Table 1 Characteristics of Cancer Cases and Non-Cancer Residents |
GC and Presence of Digestive Conditions
In the univariate conditional logistic regression analysis of GC and presence of DTCs (Table 2, Model I), gastroesophageal reflux, odynophagia, stomach discomfort, poor appetite, chronic gastritis, H. pylori infection, frequent constipation and hemorrhoids witnessed statistically significant relations (P<0.05). All these DTCs (excluding chronic gastritis) were also found with statistically significant relations to GC in the multivariate conditional logistic regression modeling (Table 2, Model II). Participants with poor appetite had a 2.01-fold [95% confidence interval (95% CI) 1.34–3.02] risk of GC than those without the symptom. Participants diagnosed with H. pylori infection had a 4.39-fold (95% CI 3.27–5.88) risk of GC than those without the history. Whereas, participants with frequent constipation and hemorrhoids had a reduced risk of GC [the odds ratio (OR) was 0.62 and 0.61, respectively].
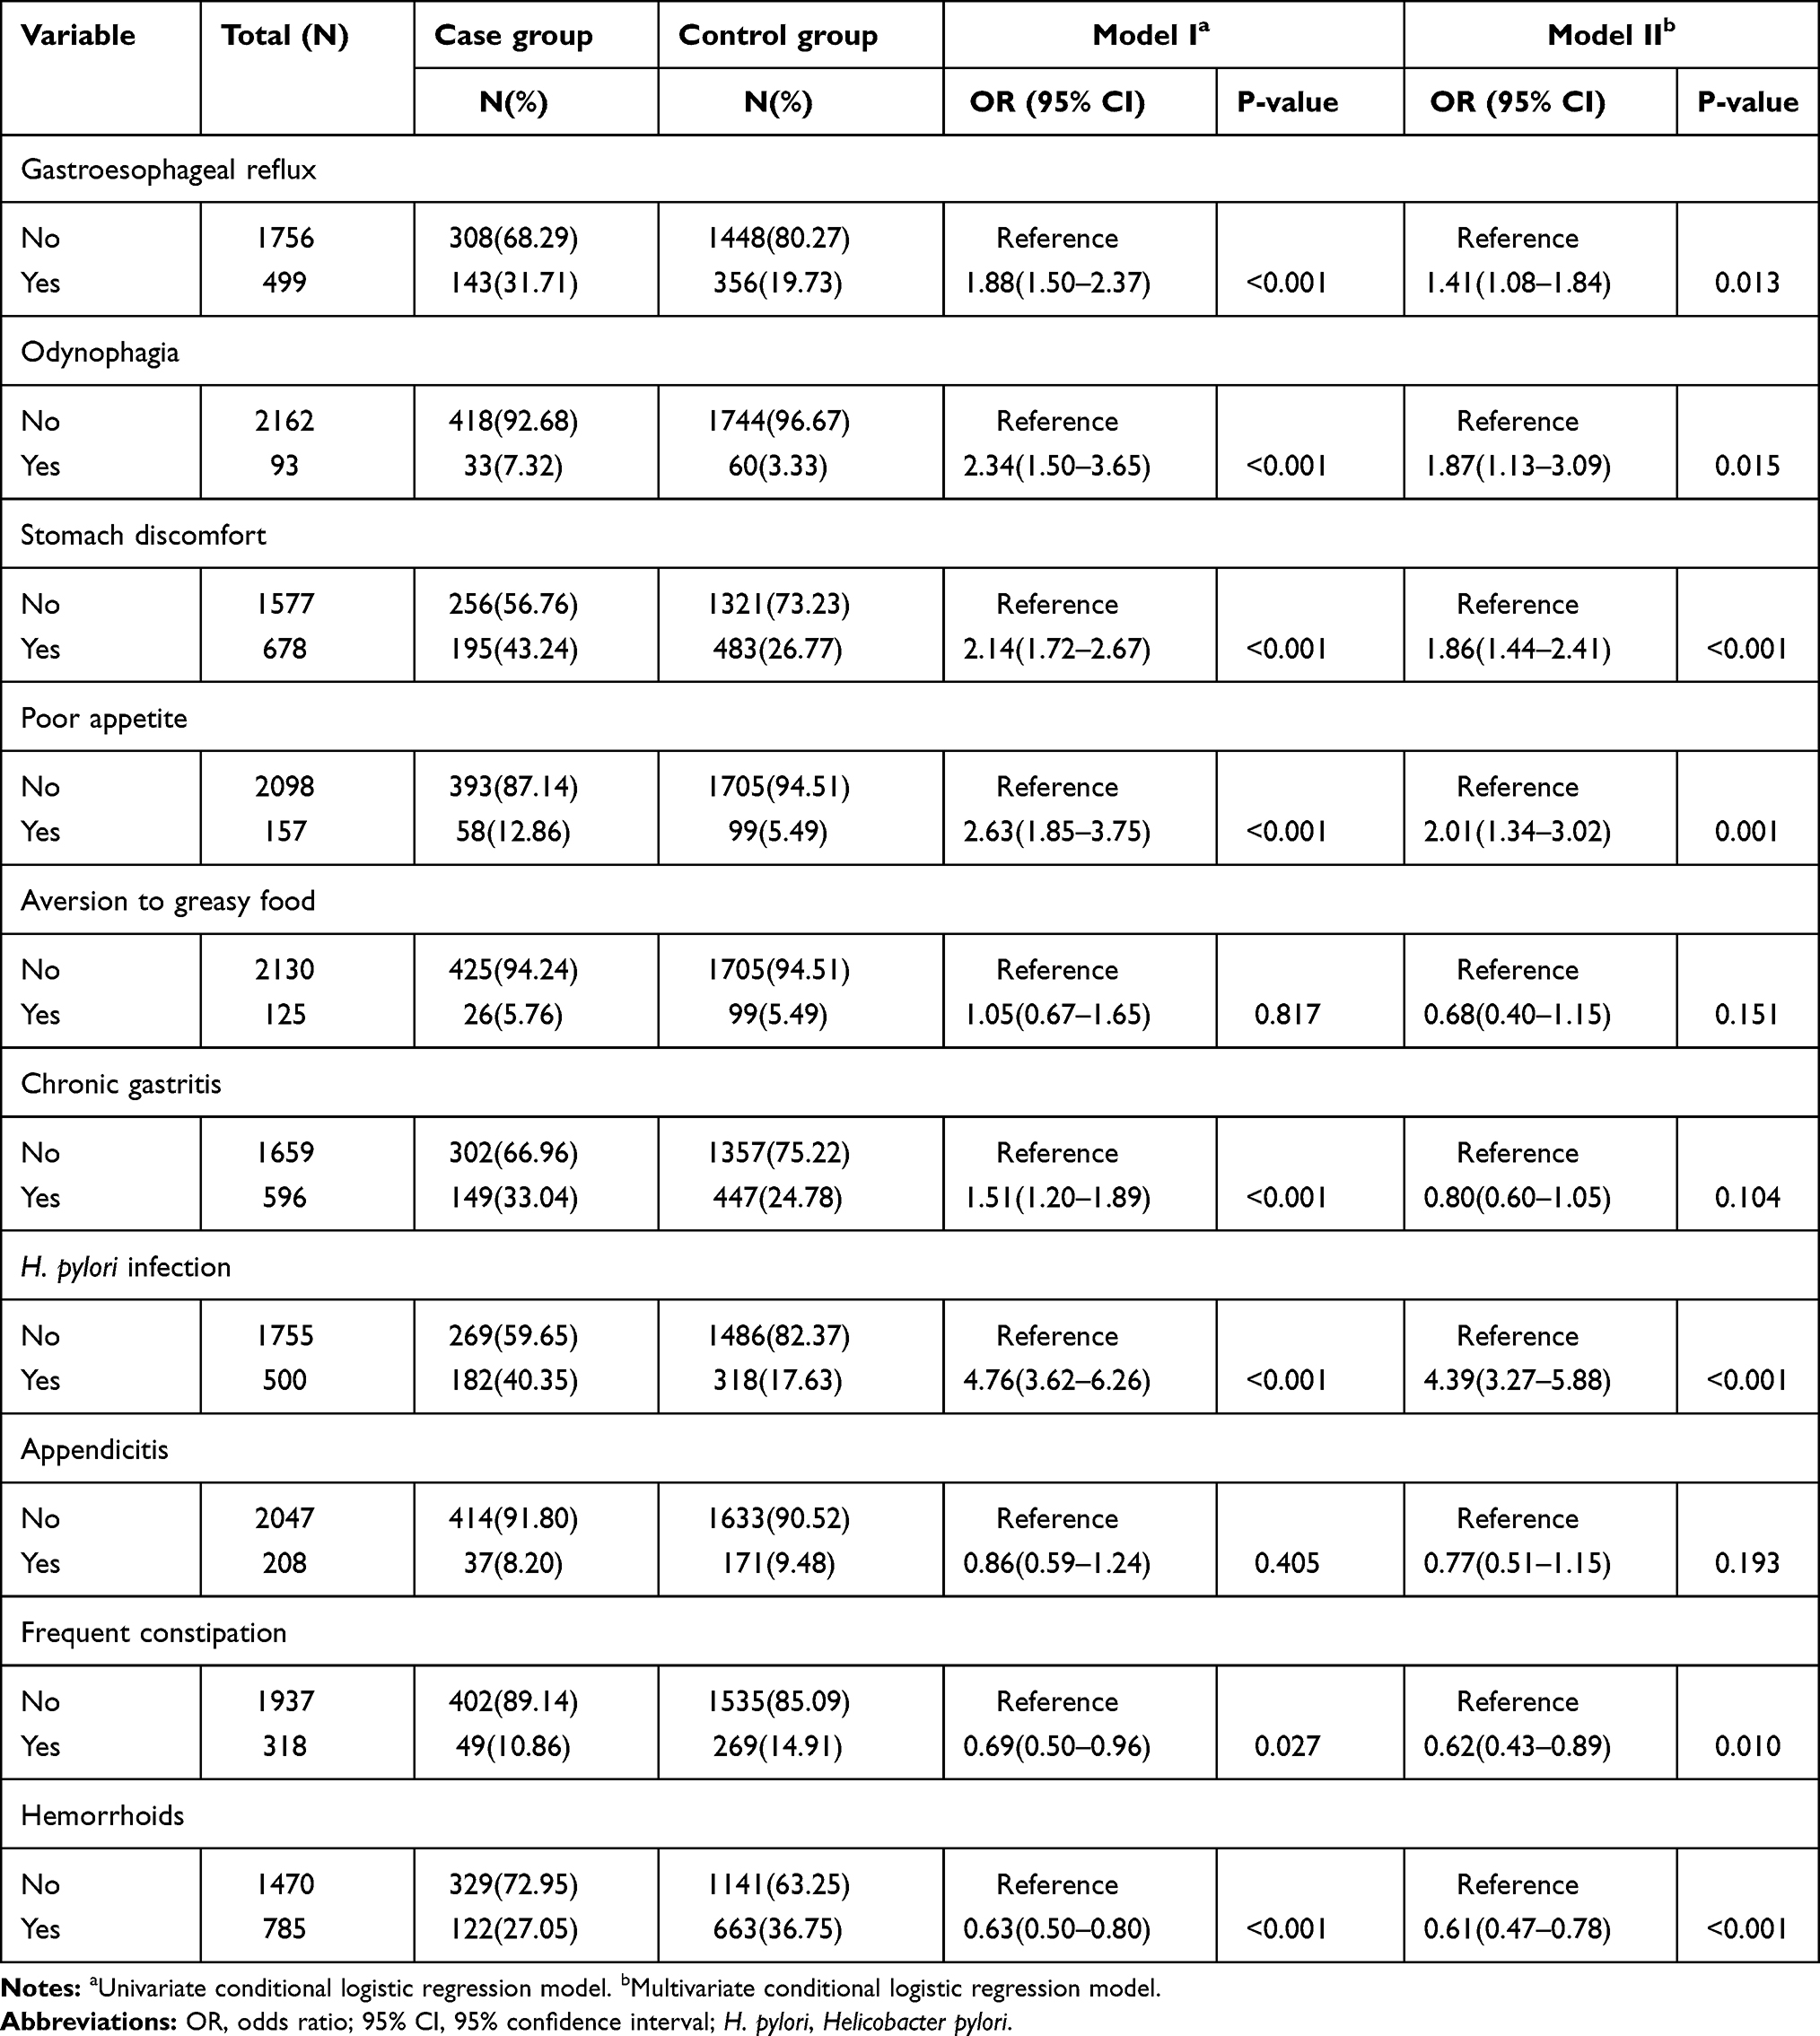 |
Table 2 Association Between Gastric Cancer and Presence of Digestive Tract Conditions |
GC and Duration of Digestive Conditions
Table 3 presents results from our univariate (Model I) and multivariate (Model II) modeling of relations between GC and duration of DTCs. Both models revealed an increasing trend for almost all the upper DTCs as the duration grade increased and the OR for the duration grade of a same condition was generally greater in Model I than Model II. H. pylori infection witnessed the highest condition-specific OR (1.69 to 11.91 in Model I and 1.53 to 10.03 in Model II), followed by poor appetite (0.89 to 6.40 in Model I and 0.89 to 5.29 in Model II), gastroesophageal reflux (0.63 to 4.14 in Model I and 0.58 to 2.45 in Model II), stomach discomfort (1.11 to 3.93 in Model I and 1.09 to 3.78 in Model II), and odynophagia (1.51 to 3.00 in Model I and 1.52 to 2.70 in Model II). In contrast, the ORs for all the lower DTCs studied were tested without statistical significance except for hemorrhoids.
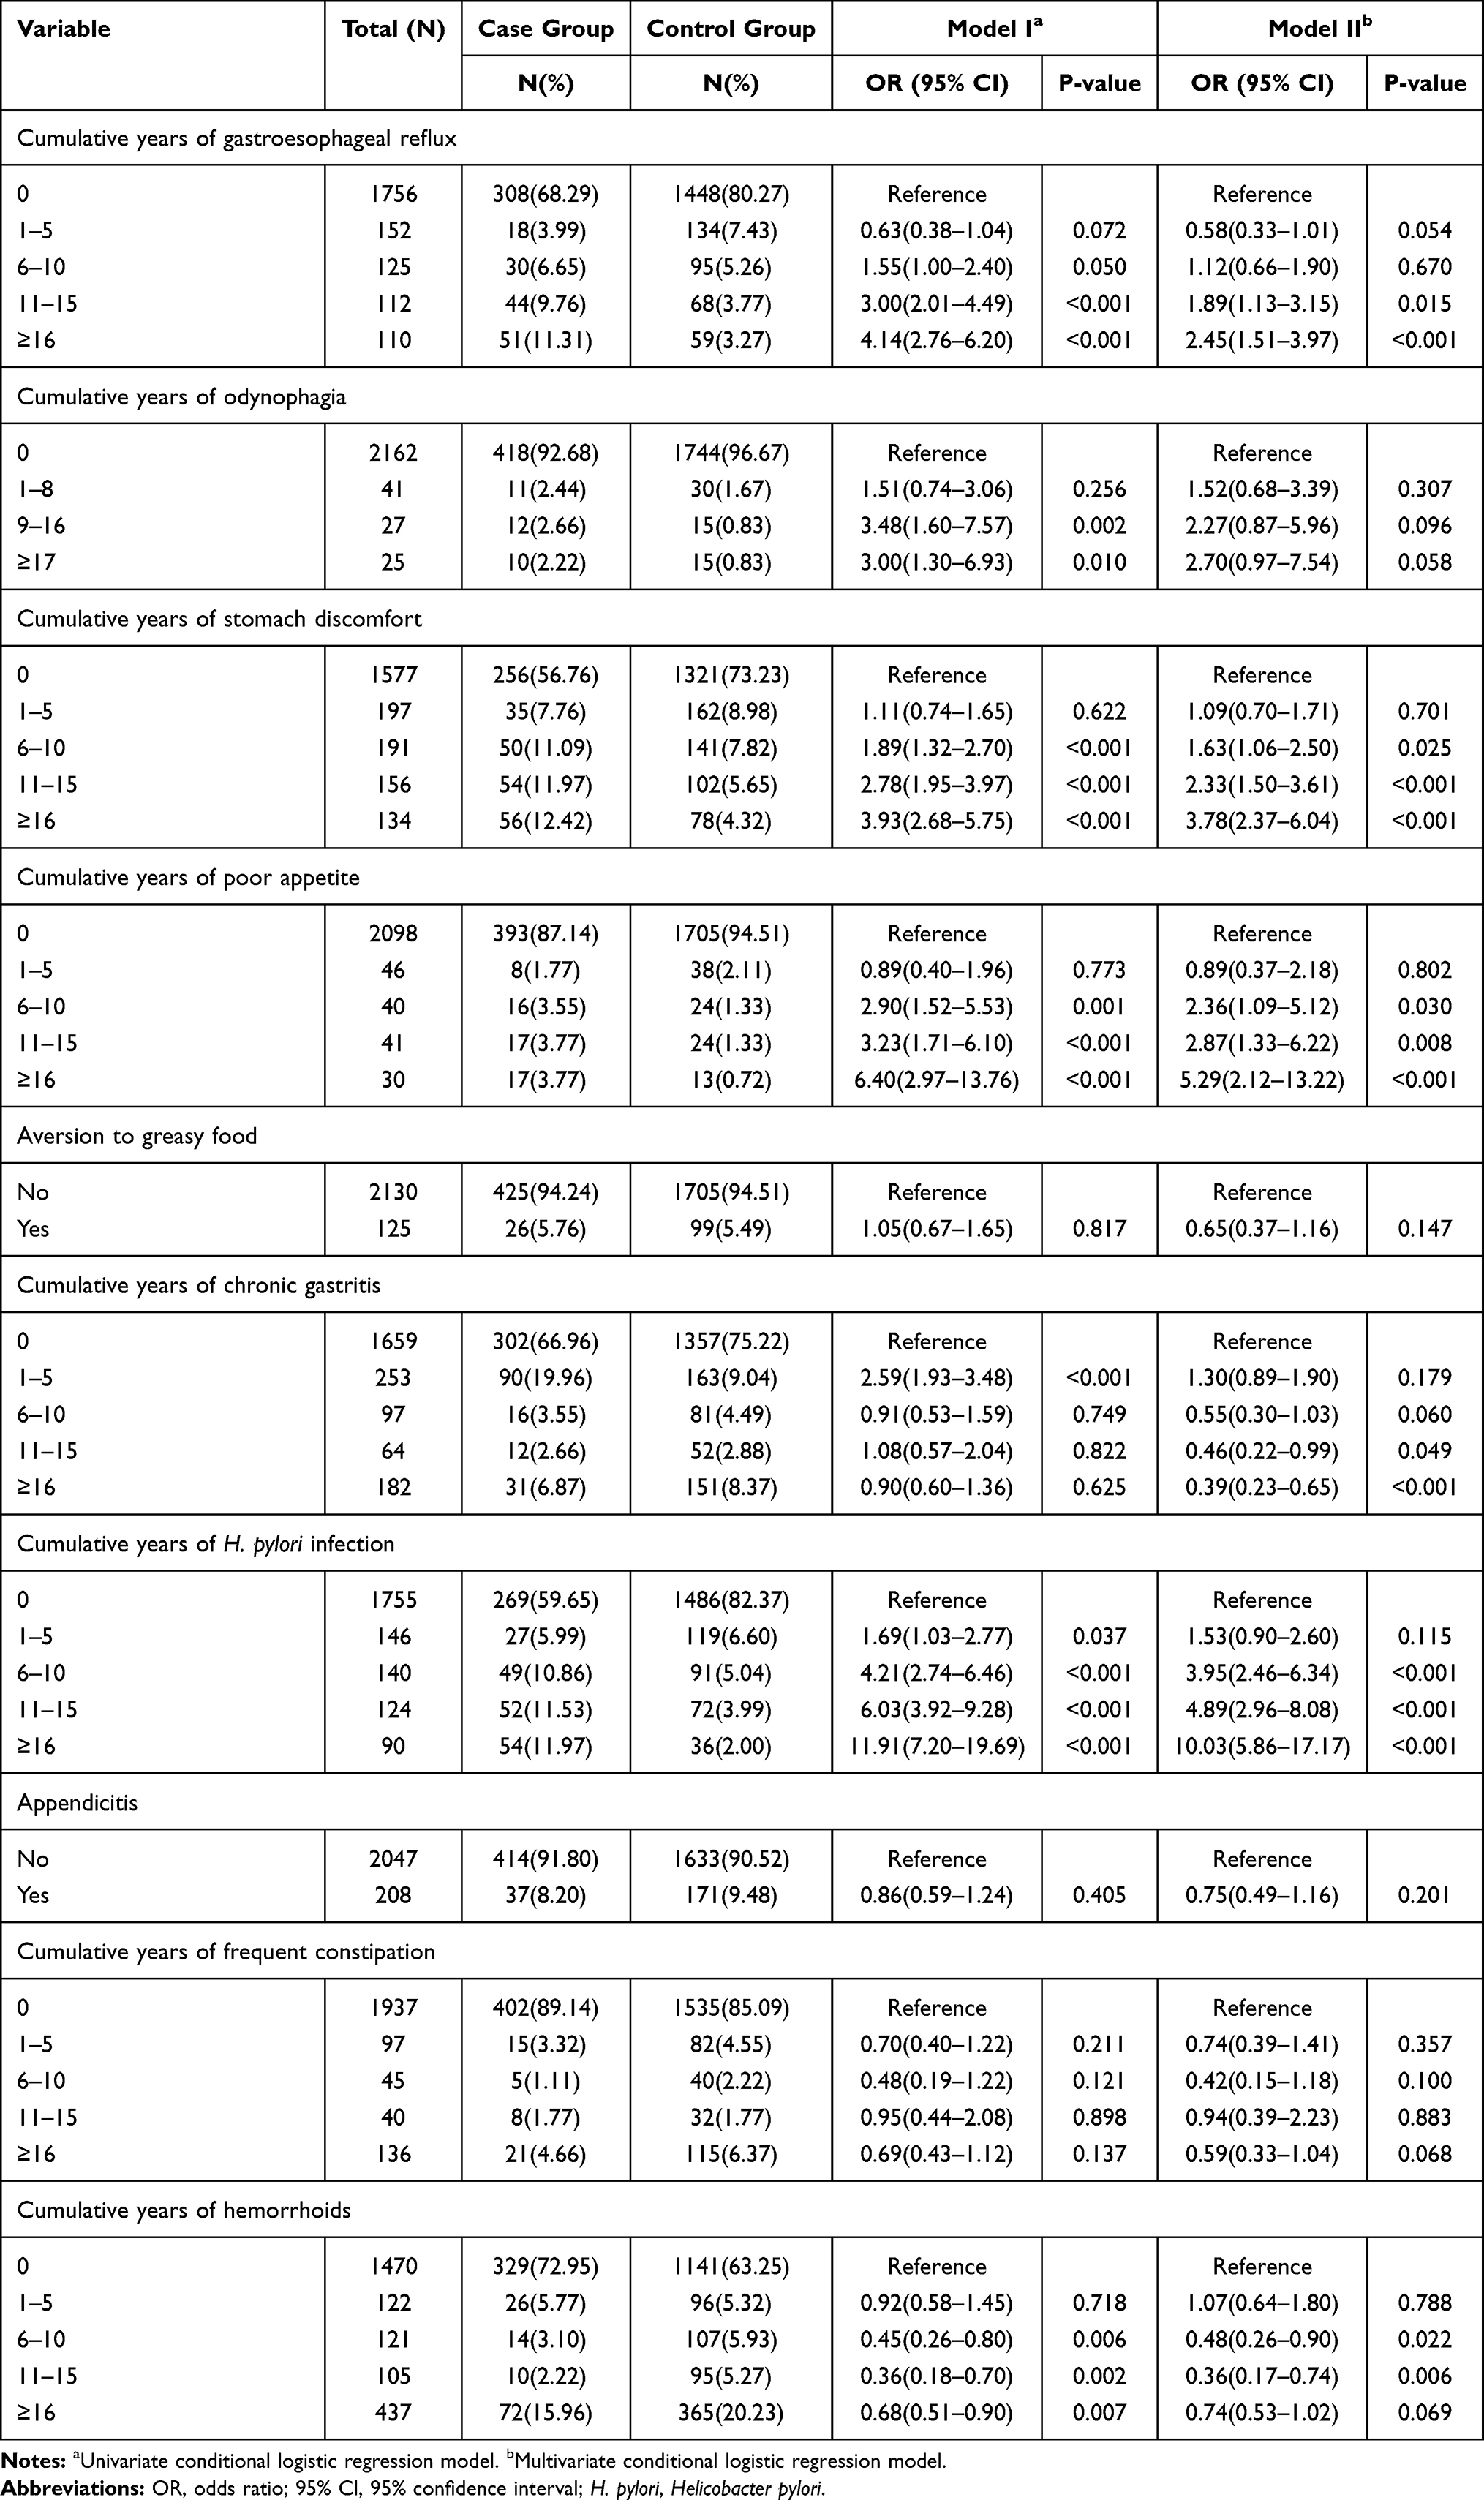 |
Table 3 Association Between Gastric Cancer and Duration Grade of Digestive Tract Conditions |
GC and Severity of Digestive Conditions
Table 4 displays results from our univariate (Model I) and multivariate (Model II) modeling of relations between GC and severity of DTCs. Again, both the modeling uncovered an increasing trend for most of the upper but lower DTCs as the severity grade increased. For all the conditions with data about severity grade (severity grade was not applicable for H. pylori infection), poor appetite witnessed the highest conditions-specific OR (0.99 to 4.27 in Model I and 1.04 to 2.75 in Model II), followed by stomach discomfort (0.93 to 4.16 in Model I and 0.89 to 3.56 in Model II), gastroesophageal reflux (0.55 to 3.80 in Model I and 0.63 to 2.52 in Model II), and odynophagia (1.65 to 3.23 in Model I and 1.53 to 2.61 in Model II). For the severity grade of the two lower DTCs studied, they showed a decreasing trend with GC (the ORs ranged from 0.75 to 0.30 for constipation and from 0.74 to 0.41 for hemorrhoids).
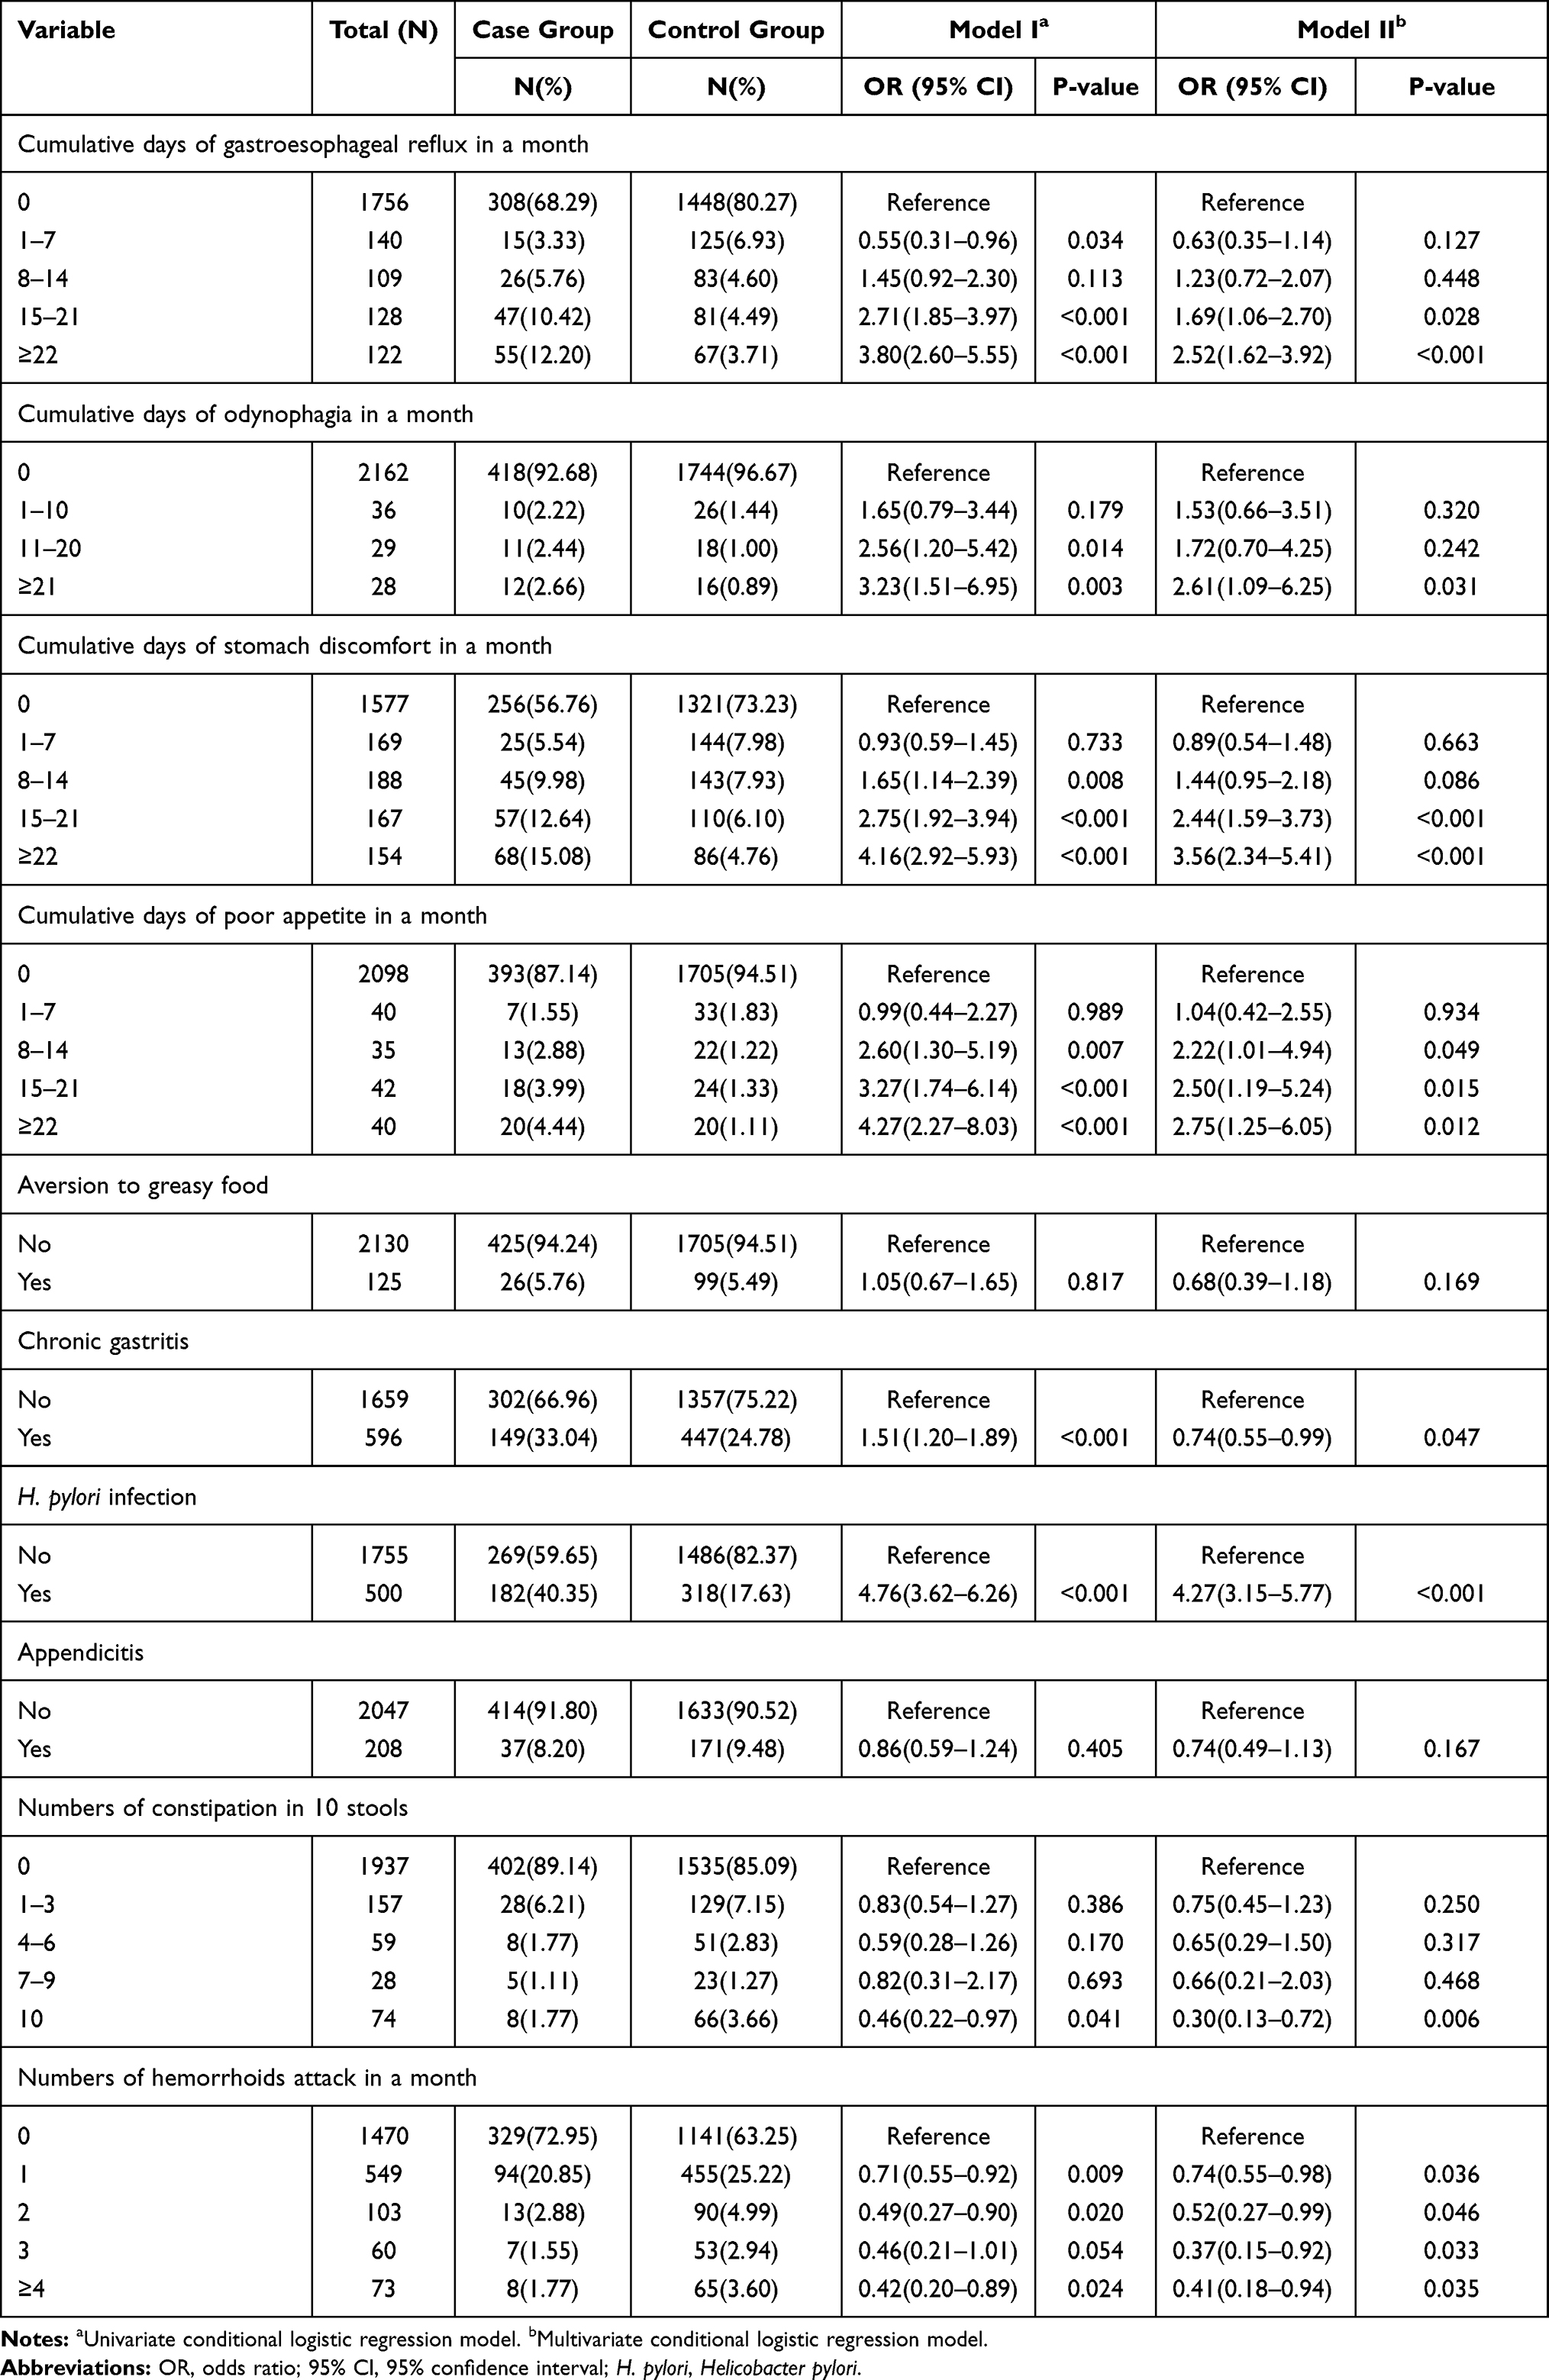 |
Table 4 Association Between Gastric Cancer and Severity Grade of Digestive Tract Conditions |
GC and Duration-Severity of Digestive Conditions
Figure 1 portraits the results from our univariate (Model I) and multivariate (Model II) modeling of associations between GC and duration-severity of digestive conditions. The figure displays a clear increasing trend between GC and duration-severity grade for most of the upper but lower DTCs in both the models. For all the conditions with data about duration-severity grade, poor appetite witnessed the highest condition-specific OR (0.33 to 10.02 in Model I and 0.40 to 10.47 in Model II), followed by gastroesophageal reflux (0.43 to 9.26 in Model I and 0.49 to 4.96 in Model II), odynophagia (2.14 to 7.03 in Model I and 1.50 to 6.33 in Model II), and stomach discomfort (0.51 to 4.50 in Model I and 0.47 to 3.32 in Model II). As for the duration-severity grade of the two lower DTCs studied, they showed a decreasing trend with GC (the ORs ranged from 0.83 to 0.54 for constipation and from 1.13 to 0.47 for hemorrhoids).
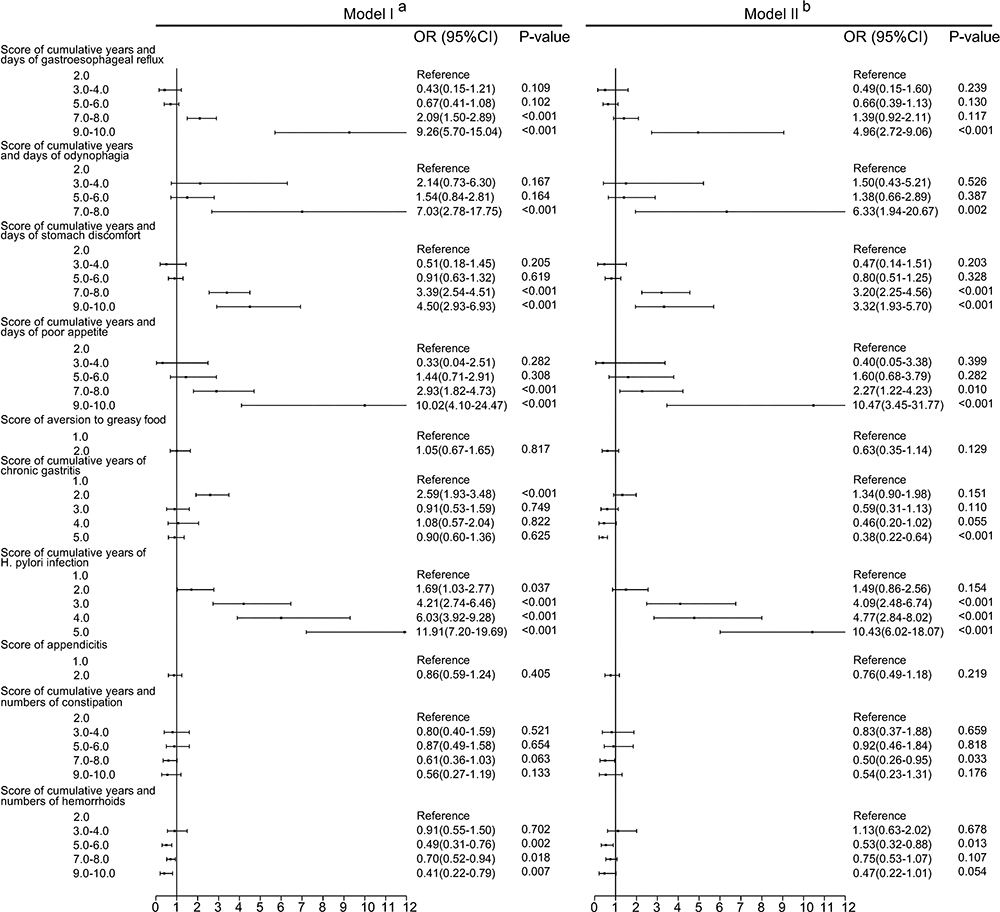 |
Figure 1 Association between gastric cancer and duration-severity grade of digestive tract conditions. aUnivariate conditional logistic regression model. bMultivariate conditional logistic regression model. Abbreviations: OR, odds ratio; 95% CI, 95% confidence interval; H. pylori, Helicobacter pylori. |
Discussions
Our study revealed interesting dose–effect relations between GC and common DTCs. Although numerous studies have documented associations between GC and presence of gastrointestinal tract conditions, there is a general paucity of attempts linking GC to cumulative years and severity of common DTCs.
Looking at the relations between GC and simply the presence of common DTCs (Table 2), the OR was estimated as 1.41 (95% CI 1.08–1.84) for gastroesophageal reflux, 1.87 (95% CI 1.13–3.09) for odynophagia, 1.86 (95% CI 1.44–2.41) for stomach discomfort, 2.01 (95% CI 1.34–3.02) for poor appetite, 4.39 (95% CI 3.27–5.88) for H. pylori infection and 0.77 (95% CI 0.51–1.15) for appendicitis. These relations are consistent with those from published studies in terms of both direction and magnitude. According to a case–control study (181 case patients and 192 control subjects), H. pylori infection was associated with a 2.04-fold higher risk (95% CI 1.31–3.18).27 A more recent systematic review and meta-analysis indicated that H. pylori infection was associated with a 2.56-fold higher risk of GC (95% CI 2.18–3.00).24 Wu AH and colleagues’ research showed that gastroesophageal reflux was associated with a twofold higher risk of gastric cardia adenocarcinoma (OR = 1.90; 95% CI 1.34–2.69).21 A study in Henan province of China documented that stomach discomfort was associated with a 1.57-fold higher risk of GC (95% CI 1.19–2.09).22 A population-based cohort study of Swedish national registries during the period of 1970–2009 reported no statistically significant correlation between appendicitis and GC (SIR = 1.01; 95% CI 0.92–1.10).28
By dividing the study participants into groups with growing duration of the DTCs, we observed a consistent and increasing trend in the OR of GC. More importantly, the independent OR for the group with the longest duration of a given condition (as listed in Table 3) is generally a few times that for all the participants with the same condition (Table 2). For example, when controlled for other conditions, the OR of GC for the group with the longest (16+) years of poor appetite (Table 3) was 2.63 times that (Table 2) for all the participants with the same symptom, being 5.29 (95% CI 2.12–13.22) as compared with 2.01 (95% CI 1.34–3.02). Similarly, the difference in OR of GC was 1.74 times (2.45 versa 1.41) for gastroesophageal reflux, 2.03 times (3.78 versa 1.86) for stomach discomfort and 2.28 times (10.03 versa 4.39) for H. pylori infection. Published attempts linking GC with duration of digestive conditions are scarce with very limited exceptions. One of such exceptions concerns the study by the Helicobacter and Cancer Collaborative Group. They reported that the OR of GC was higher among people with H. pylori infection for 10 years or above than those under 10 years, being 3.12 (95% CI 2.23–4.35) as compared with 2.10 (95% CI 1.70–2.58).29 Another exception refers to the work by Wu AH et al. They documented higher OR of gastric cardia adenocarcinoma among the study participants with reflux for 16 years or above than those of 3–15 years, being 2.55 (95% CI 1.64–3.96) versa 1.34 (95% CI 0.81–2.22).21
We also uncovered a consistent and increasing trend in the OR of GC among subgroups with growing severity of DTCs. For example, the OR of GC in the multivariate regression model (Table 4) for the group with the severest stomach discomfort (22+ days a month) was 1.91 times that for all the participants with the same symptom (Table 2), being 3.56 (95% CI 2.34–5.41) as compared with 1.86 (95% CI 1.44–2.41). Similarly, the difference in OR of GC was 1.79 times (2.52 versa 1.41) for gastroesophageal reflux and 1.37 times (2.75 versa 2.01) for poor appetite. Again, there is a paucity of published evidences on GC risk and severity of DTCs. Lagergren J et al reported that the OR of GC was higher among people with three or more times of reflux per week than those with only one time of the symptom per week, being 2.30 (95% CI 1.20–4.30) as compared with 2.00 (95% CI 1.10–3.60).20
When both the duration and severity were considered, we found an even steeper increase trend in ORs of GC for common DTCs. Taking the example of poor appetite, the OR of GC for the highest “duration-severity” group was 10.47 times that for those without the symptom and 2.63 times that for the longest duration group (5.29 versa 2.01) and 1.37 times that for the highest severity group (2.75 versa 2.01). Similarly, the OR of GC for the highest “duration-severity” group of odynophagia was 6.33 times that for those without the symptom and 1.44 times that for the group with the longest odynophagia history (2.70 versa 1.87) and 1.40 times that for the group with the severest odynophagia (2.61 versa 1.87). Such relationship between GC and duration-severity groupings was also observable for gastroesophageal reflux and stomach discomfort. Whether these joint dose–effect relations or additive effects between duration and severity of DTCs are replicable in other populations remain to be studied. Our scoping literature review did not reveal any similar reports. Nevertheless, these findings call for adequate attention to both the duration and severity of common DTCs in future GC prevention, diagnosis and research. The underlying mechanisms for these additive associations may be complex. One possible explanation may be “FDTC- ODTC-GC” pathway or continuum. Here, FDTC and ODTC stands for functional and organic DTCs respectively. Functional DTCs are generally viewed as complex bidirectional dysregulations of gut–brain interaction, via the gut–brain axis, while organic DTCs are caused by various forms and grades of structural lesions. Numerous studies have documented relations between cancer and dysregulations of gut–brain interaction.15,30 Similarly, evidences are mounting on links from structural lesions to cancers via, for instance, signal transducer and activator of transcription 3 (STAT3), phosphatase and tensin homolog (PTEN), Wnt and so on.31–35 Given these, it is perhaps arguable that greater duration-severity grade means longer and severer dysregulations of gut–brain interaction and structural lesions and thus higher chances of developing GC. Our findings signify the importance of duration and severity of DTCs, especially functional DTCs, in the development GC.
In contrast to the above mentioned relations, our study found an independent decreasing trend in the risk of GC among participants with increasing time difference from the first reported diagnosis of chronic gastritis. This may be attributed mainly to the following: a) respondents without reported diagnosis of chronic gastritis may not necessarily be free from the disease since a large part of them had never underwent gastro-endoscopic examinations;36,37 b) people with functional gastrointestinal disorders are more likely to seek help from clinicians and thus have greater chances to have earlier diagnosis or even misdiagnosis of chronic gastritis.38–41 Compared with chronic gastritis, diagnosis of H. pylori infection is much more convenient, cheaper and popular in China.42–44 In addition, our study revealed much weaker associations between GC and common lower DTCs. The ORs of GC for appendicitis and frequent constipation were all tested without statistical significance. The moderately decreased risk of GC among the respondents with hemorrhoids may be explained partly by problem-induced protection. In other words, individuals with longer and severer hemorrhoids may be more likely to practice healthier diet and other behaviors in a hope to prevent and release the suffering of the problem.45–49
In addition, our study found more substantially greater number male GC cases than females. This is consistent with that reported in Global Cancer Statistics 2020.1 The ratio of GC incidence between men versus women was 2.46 in Eastern Asia (the largest) and 1.16 in Eastern Africa (the smallest).1 Other studies also reported similar sex differences.2,50 This phenomenon may be attributable to differences between males and females in terms of behaviors, hormonal secretion and genetic factors.33,51,52
Strengths and Limitations
The study is advantageous in a number ways: 1) it was a large-scale, community-based case–control study involving both urban and rural populations; 2) it focused on dose–effect relations between GC and common digestive tract symptoms and diagnosis; 3) it introduced a novel measure (duration-severity grade) and documented substantially stronger associations between GC and the duration-severity grade of common upper DTCs. The study also has limitations. Being a case–control study, it reports only non-causal associations and readers should be well cautioned about a whole range of potential report biases. For example, respondents diagnosed with GC maybe more likely, than normal ones, to recall (even invent) digestive tract symptoms.
Conclusions
This community-based case–control study in China revealed strong and consistent associations between GC and common DTCs. GC was found dose–effect relationships with 1) duration of gastroesophageal reflux, stomach discomfort, poor appetite, and H. pylori infection; 2) severity of gastroesophageal reflux, stomach discomfort and poor appetite; and 3) duration-severity of gastroesophageal reflux, odynophagia, stomach discomfort and poor appetite. These should inform the prevention, diagnosis and further research in patients with GC.
Abbreviations
CI, confidence interval; DTCs, digestive tract conditions; GC, gastric cancer; H. pylori, Helicobacter pylori; IQR, interquartile range; OR, odds ratio; PTEN, phosphatase and tensin homolog; SCAG, severe chronic atrophic gastritis; SIR, standardized incidence ratio; STAT3, signal transducer and activator of transcription 3.
Data Sharing Statement
Due to the sensitive nature of the questions asked in this study, survey respondents were assured raw data would remain confidential and would not be shared. Data are available from the corresponding author on reasonable request.
Ethics Approval and Informed Consent Statement
This study was conducted in accordance with the Declaration of Helsinki and approved by the Biomedical Ethics Committee of Anhui Medical University (reference number: 20150080). Respondents voluntarily participated in this study. The respondents began to accept the investigation after signing the informed consent.
Acknowledgments
We would like to thank all the local doctors, investigators and participants involved.
Author Contributions
All authors made substantial contributions to conception and design, acquisition of data, or analysis and interpretation of data; took part in drafting the article or revising it critically for important intellectual content; agreed to submit to the current journal; gave final approval for the version to be published; and agreed to be accountable for all aspects of the work.
Funding
This work was supported by the National Natural Science Foundation of China (Grant number: 71774002). The funding source has not plaid any role in the study design, analysis or in the decision to submit the manuscript for publication.
Disclosure
The authors declare that they have no conflicts of interest for this work.
References
1. Sung H, Ferlay J, Siegel RL, et al. Global Cancer Statistics 2020: GLOBOCAN Estimates of Incidence and Mortality Worldwide for 36 Cancers in 185 Countries. CA Cancer J Clin. 2021;71:209–249. doi:10.3322/caac.21660
2. Siegel RL, Miller KD, Fuchs HE, Jemal A. Cancer Statistics, 2021. CA Cancer J Clin. 2021;71:7–33. doi:10.3322/caac.21654
3. Zheng R, Sun K, Zhang S, et al. Report of cancer epidemiology in China, 2015. Zhonghua Zhong Liu Za Zhi. 2019;41(1):19–28. doi:10.3760/cma.j.issn.0253-3766.2019.01.005
4. Zeng X, Jinlei Q. Report on the Burden of diseases in China and provincial Administrative regions, 1990–2016. Chine Circulation J. 2018;33(12):1147–1158.
5. Karimi P, Islami F, Anandasabapathy S, Freedman ND, Kamangar F. Gastric cancer: descriptive epidemiology, risk factors, screening, and prevention. Cancer Epidemiol Biomarkers Prev. 2014;23(5):700–713. doi:10.1158/1055-9965.EPI-13-1057
6. Isobe Y, Nashimoto A, Akazawa K, et al. Gastric cancer treatment in Japan: 2008 annual report of the JGCA nationwide registry. Gastric Cancer. 2011;14(4):301–316. doi:10.1007/s10120-011-0085-6
7. La Torre M, Rossi Del S. Peritoneal washing cytology in gastric cancer. How, when and who will get a benefit? A review. Minerva Gastroenterol Dietol. 2011;57(1):43–51.
8. Miyahara R, Niwa Y, Matsuura T, et al. Prevalence and prognosis of gastric cancer detected by screening in a large Japanese population: data from a single institute over 30 years. J Gastroenterol Hepatol. 2007;22(9):1435–1442. doi:10.1111/j.1440-1746.2007.04991.x
9. Derakhshan MH, Malekzadeh R, Watabe H, et al. Combination of gastric atrophy, reflux symptoms and histological subtype indicates two distinct aetiologies of gastric cardia cancer. Gut. 2008;57:298–305. doi:10.1136/gut.2007.137364
10. Kim Y-J, Chung WC, Cho IH, Kim J, Kim S. Prognostic effect of different etiologies in patients with gastric cardia cancer. Medicine. 2019;98:50–54. doi:10.1097/MD.0000000000018397
11. Choi JH, Kim ES, Lee YJ, et al. Comparison of quality of life and worry of cancer recurrence between endoscopic and surgical treatment for early gastric cancer. Gastrointest Endosc. 2015;82(2):299–307. doi:10.1016/j.gie.2015.01.019
12. Yoshida T, Kato J, Inoue I, et al. Cancer development based on chronic active gastritis and resulting gastric atrophy as assessed by serum levels of pepsinogen and Helicobacter pylori antibody titer. Int J Cancer. 2014;134(6):1445–1457. doi:10.1002/ijc.28470
13. den Hoed CM, Kuipers EJ. Gastric cancer: how can we reduce the incidence of this disease? Curr Gastroenterol Rep. 2016;18(7):34. doi:10.1007/s11894-016-0506-0
14. Sundbøll J, Thygesen SK, Veres K, et al. Risk of cancer in patients with constipation. Clin Epidemiol. 2019;11:299–310. doi:10.2147/CLEP.S205957
15. Black CJ, Drossman DA, Talley NJ, Ruddy J, Ford AC. Functional gastrointestinal disorders: advances in understanding and management. Lancet. 2020;396(10263):1664–1674. doi:10.1016/S0140-6736(20)32115-2
16. Ford AC, Mahadeva S, Florencia Carbone M, Lacy BE, Talley NJ. Functional dyspepsia. Lancet. 2020;396(10263):1689–1702. doi:10.1016/S0140-6736(20)30469-4
17. Ford AC, Sperber AD, Corsetti M, Camilleri M. Irritable bowel syndrome. Lancet. 2020;396(10263):1675–1688. doi:10.1016/S0140-6736(20)31548-8
18. Chatila AT. Natural history, pathophysiology and evaluation of gastroesophageal reflux disease. Dis Mon. 2020;66(1):100848. doi:10.1016/j.disamonth.2019.02.001
19. Ye W, Chow WH, Lagergren J, Yin L, Nyrén O. Risk of adenocarcinomas of the esophagus and gastric cardia in patients with gastroesophageal reflux diseases and after antireflux surgery. Gastroenterology. 2001;121(6):1286–1293. doi:10.1053/gast.2001.29569
20. Lagergren J, Bergstrom R, Lindgren A, Nyren O. Symptomatic gastroesophageal reflux as a risk factor for esophageal adenocarcinoma. N Engl J Med. 1999;340(11):825–831. doi:10.1056/NEJM199903183401101
21. Wu AH, Tseng CC, Bernstein L. Hiatal hernia, reflux symptoms, body size, and risk of esophageal and gastric adenocarcinoma. Cancer. 2003;98:940–948. doi:10.1002/cncr.11568
22. Jin X, Dai L, Zhang J, et al. A case-control family study of gastric cancer in Henan province. Zhong Nan Da Xue Xue Bao Yi Xue Ban. 2007;32(5):782–785.
23. Palli D, Masala G. CagA+ Helicobacter pylori infection and gastric cancer risk in the EPIC-EURGAST study. Int J Cancer. 2007;120(4):859–867. doi:10.1002/ijc.22435
24. Poorolajal J, Moradi L, Mohammadi Y, Cheraghi Z, Gohari-Ensaf F. Risk factors for stomach cancer: a systematic review and meta-analysis. Epidemiol Health. 2020;42:e2020004. doi:10.4178/epih.e2020004
25. Cope JU, Askling J, Gridley G, et al. Appendectomy during childhood and adolescence and the subsequent risk of cancer in Sweden. Pediatrics. 2003;111(6 Pt 1):1343–1350. doi:10.1542/peds.111.6.1343
26. Chai J. Disease Burden of Common Cancers and Influencing Factors of Cancer Incidence in Anhui, China [Dissertation]. Hefei: Anhui Medical University; 2019.
27. Correa P. Gastric cancer: overview. Gastroenterol Clin North Am. 2013;42(2):211–217. doi:10.1016/j.gtc.2013.01.002
28. Song H, Abnet CC, Andrén-Sandberg Å, Chaturvedi AK, Weimin Y. Risk of Gastrointestinal Cancers among Patients with Appendectomy: a Large-Scale Swedish Register-Based Cohort Study during 1970–2009. PLoS One. 2016;11(3):e0151262. doi:10.1371/journal.pone.0151262
29. Helicobacter and Cancer Collaborative Group. Gastric cancer and Helicobacter pylori: a combined analysis of. 12 case control studies nested within prospective cohorts. Gut. 2001;49(3):347–353. doi:10.1136/gut.49.3.347
30. Sammarco G, Varricchi G, Ferraro V, et al. Mast Cells, Angiogenesis and Lymphangiogenesis in Human Gastric Cancer. Int J Mol Sci. 2019;20(9):2106. doi:10.3390/ijms20092106
31. Ashrafizadeh M, Najafi M, Ang HL, et al. PTEN, a Barrier for Proliferation and Metastasis of Gastric Cancer Cells: from Molecular Pathways to Targeting and Regulation. Biomedicines. 2020;8(8):264. doi:10.3390/biomedicines8080264
32. Ashrafizadeh M, Zarrabi A, Orouei S, et al. STAT3 Pathway in Gastric Cancer: signaling, Therapeutic Targeting and Future Prospects. Biology. 2020;9(6):126. doi:10.3390/biology9060126
33. Abadi AJ, Zarrabi A, Hashemi F, et al. The role of SOX family transcription factors in gastric cancer. Int J Biol Macromol. 2021;180:608–624.
34. Ashrafizadeh M, Zarrabi A, Hashemipour M, et al. Sensing the scent of death: modulation of microRNAs by Curcumin in gastrointestinal cancers. Pharmacol Res. 2020;160:105199.
35. Ashrafizadeh M, Rafiei H, Mohammadinejad R, Farkhondeh T, Samarghandian S. Wnt-regulating microRNAs role in gastric cancer malignancy. Life Sci. 2020;250:117547. doi:10.1016/j.lfs.2020.117547
36. Lahner E, Zagari RM, Zullo A, et al. Chronic atrophic gastritis: natural history, diagnosis and therapeutic management. A position paper by the Italian Society of Hospital Gastroenterologists and Digestive Endoscopists [AIGO], the Italian Society of Digestive Endoscopy [SIED], the Italian Society of Gastroenterology [SIGE], and the Italian Society of Internal Medicine [SIMI]. Dig Liver Dis. 2019;51(12):1621–1632. doi:10.1016/j.dld.2019.09.016
37. Huang H, Rong Y, Wang M, et al. Analysis of gastroscopy results among healthy people undergoing a medical checkup: a retrospective study. BMC Gastroenterol. 2020;20:412. doi:10.1186/s12876-020-01557-9
38. Du Y, Bai Y, Xie P, et al. Chronic gastritis in China: a national multi-center survey. BMC Gastroenterol. 2014;14:21. doi:10.1186/1471-230X-14-21
39. Kinoshita Y, Chiba T, FUTURE Study Group. Characteristics of Japanese patients with chronic gastritis and comparison with functional dyspepsia defined by ROME III criteria: based on the large-scale survey, FUTURE study. Intern Med. 2011;50(20):2269–2276. doi:10.2169/internalmedicine.50.5678
40. Yeh AM, Golianu B. Integrative Treatment of Reflux and Functional Dyspepsia in Children. Children. 2014;1(2):119–133. doi:10.3390/children1020119
41. Wei Z, Ying L, Wen G, Mengnan Z, Yali Z. Rome III criteria cannot distinguish patients with chronic gastritis from those functional dyspepsia patients. Helicobacter. 2014;19(2):124–128. doi:10.1111/hel.12108
42. Du Y, Zhu H, Liu J, et al. Consensus on eradication of Helicobacter pylori and prevention and control of gastric cancer in China (2019, Shanghai). J Gastroenterol Hepatol. 2020;35(4):624–629. doi:10.1111/jgh.14947
43. Liu J, Wang Y, Zhao Q, et al. Prevalence and risk factors for Helicobacter pylori infection in southwest China: a study of health examination participants based on 13C-urea breath test. Turk J Med Sci. 2017;47(5):1456–1462. doi:10.3906/sag-1605-149
44. Wang W, Jiang W, Zhu S, et al. Assessment of prevalence and risk factors of helicobacter pylori infection in an oilfield Community in Hebei, China. BMC Gastroenterol. 2019;19(1):186. doi:10.1186/s12876-019-1108-8
45. Machlowska J, Baj J, Sitarz M, Maciejewski R, Sitarz R. Gastric Cancer: epidemiology, Risk Factors, Classification, Genomic Characteristics and Treatment Strategies. Int J Mol Sci. 2020;21(11):4012. doi:10.3390/ijms21114012
46. Chen P, Lin Y, Zheng K, et al. Risk Factors of Gastric Cancer in High-Risk Region of China: a Population-Based Case-control Study. Asian Pac J Cancer Prev. 2019;20(3):775–781. doi:10.31557/APJCP.2019.20.3.775
47. Wiseman M. The second World Cancer Research Fund/American Institute for Cancer Research expert report. Food Nutrition Phys Activity Prevention Cancer. 2008;67:253–256.
48. Kim J, Park S, Nam BH. Gastric cancer and salt preference: a population-based cohort study in Korea. Am J Clin Nutr. 2010;91:1289–1293. doi:10.3945/ajcn.2009.28732
49. Zhang Z, Xu G, Ma M, Yang J, Liu X. Dietary fiber intake reduces risk for gastric cancer: a meta-analysis. Gastroenterology. 2013;145:113–120. doi:10.1053/j.gastro.2013.04.001
50. Juan M. Current Perspectives on Gastric Cancer. Gastroenterol Clin North Am. 2016;45(3):413–428. doi:10.1016/j.gtc.2016.04.002
51. De Martel C, Forman D, Plummer M. Gastric cancer: epidemiology and risk factors. Gastroenterol Clin. 2013;42:219–240. doi:10.1016/j.gtc.2013.01.003
52. Yoo JY, Cho HJ, Moon S, et al. Pickled Vegetable and Salted Fish Intake and the Risk of Gastric Cancer: two Prospective Cohort Studies and a Meta-Analysis. Cancers. 2020;12(4):996. doi:10.3390/cancers12040996
 © 2021 The Author(s). This work is published and licensed by Dove Medical Press Limited. The full terms of this license are available at https://www.dovepress.com/terms.php and incorporate the Creative Commons Attribution - Non Commercial (unported, v3.0) License.
By accessing the work you hereby accept the Terms. Non-commercial uses of the work are permitted without any further permission from Dove Medical Press Limited, provided the work is properly attributed. For permission for commercial use of this work, please see paragraphs 4.2 and 5 of our Terms.
© 2021 The Author(s). This work is published and licensed by Dove Medical Press Limited. The full terms of this license are available at https://www.dovepress.com/terms.php and incorporate the Creative Commons Attribution - Non Commercial (unported, v3.0) License.
By accessing the work you hereby accept the Terms. Non-commercial uses of the work are permitted without any further permission from Dove Medical Press Limited, provided the work is properly attributed. For permission for commercial use of this work, please see paragraphs 4.2 and 5 of our Terms.