")
Back to Journals » International Journal of General Medicine » Volume 14
Dose-Response Association of Waist-to-Height Ratio Plus BMI and Risk of Depression: Evidence from the NHANES 05–16
Authors Ma W, Yan Z, Wu W , Li D, Zheng S, Lyu J
Received 6 February 2021
Accepted for publication 23 March 2021
Published 14 April 2021 Volume 2021:14 Pages 1283—1291
DOI https://doi.org/10.2147/IJGM.S304706
Checked for plagiarism Yes
Review by Single anonymous peer review
Peer reviewer comments 2
Editor who approved publication: Dr Scott Fraser
Wen Ma,1,2,* Zhengwei Yan,2,* Wentao Wu,2 Daning Li,2 Shuai Zheng,3 Jun Lyu1– 3
1Clinical Research Center, The First Affiliated Hospital of Xi’an Jiaotong University, Xi’an, Shaanxi, People’s Republic of China; 2School of Public Health, Xi’an Jiaotong University Health Science Center, Xi’an, Shaanxi, People’s Republic of China; 3Department of Clinical Research, The First Affiliated Hospital of Jinan University, Guangzhou, Guangdong Province, People’s Republic of China
*These authors contributed equally to this work
Correspondence: Jun Lyu
Clinical Research Center, The First Affiliated Hospital of Xi’an Jiaotong University, Xi’an, Shaanxi, People’s Republic of China
Tel +86-13379060167
Email [email protected]
Background: Obesity or underweight has been found to be associated with depression, but the relationship remains to be determined so that more precise prevention strategies can be implemented. Body mass index (BMI) and waist–height ratio (WHR) were used as indicators to study the dose–response relationship between depression and obesity or underweight.
Methods: We obtained basic information and disease-related data for 13,975 adults from the National Health and Nutrition Examination Survey (NHANES) 2005– 2016 dataset. The depressive status was determined based on the PHQ-9 scale (> 4). Logistic regression was used to analyze the association and risk of BMI, WHTR and depressive status. Based on the results of logistic regression, the dose–response relationship between BMI, WHTR and depressive state was analyzed using restricted cubic splines (RCS).
Results: The adjusted model showed that compared with the fourth quartile (Q4) of BMI, the odds ratios (ORs) of depression for Q1, Q2 and Q3 were 0.63 (0.56– 0.71), 0.61 (0.54– 0.68) and 0.74 (0.66– 0.82), and compared with the fourth quartile (Q4) of WHtR, the odds ratios (ORs) of depression for Q1, Q2 and Q3 were 0.55 (0.49– 0.62), 0.57 (0.51– 0.64) and 0.64 (0.57– 0.71), respectively. The restricted cubic spline regression depicted a U-shaped dose–response relationship between continuous changes of obesity indicators and the risk of depression (P1, P2 < 0.001). When the participants’ BMI reached approximately 25kg/m2 with the reference value of BMI was 18.5kg/m2, the risk of depression was minimized (OR=0.68, 95% Cl=0.56– 0.83). When the WHtR reached approximately 0.52 with the reference value of WHtR was 0.40, the risk of depression was minimized (OR=0.69, 95% Cl=0.54– 0.88).
Conclusion: We found a significant U-shape correlation between BMI, WHtR and depression. People with slight overweight have the lowest risk of depression. However, according to the International Obesity standards, the population at these levels of weight may have an obesity-chronic disease risk, and this is not recommended.
Keywords: BMI, waist-to-height ratio, depression, dose–response relationship
Introduction
Depression is a mood or emotional disorder mainly characterized by depression, low interest and slow thinking. Due to the high incidence rate, high recurrence rate and high mortality rate,1,2 depression has imposed a serious social and economic burden on patients and their communities. According to statistical data, depression has become the most widespread mental disorder in the world, with a prevalence rate of 15%–30%.3 Obesity is a risk factor for many chronic diseases, such as type 2 diabetes (DM), hypertension (HTN), and cardiovascular disease.4,5 In addition, series of epidemiological studies have shown that underweight and obesity are associated with depression,6–10 which indicates that there may be a U-shaped relationship between the clinical obesity indicator and depression.11–13 However, inconsistent results have been conducted by related studies investigating the relationship between obesity and depression, and almost all of these studies used the single obesity index to assess obesity. In practice, body mass index (BMI) combined with waist–height ratio (WHtR) is better than the single index in identifying overweight and obese people with a high risk of cardiovascular disease and diabetes.14,15
In this study, we aimed to explore the dose–response relationship between weight-related indicators and depression in the United States (US) adults with restricted cubic splines (RCS) method. BMI and WHtR were used to make more comprehensive and objective statistics on this relationship.
Methods
Data Collection
The National Health and Nutrition Examination Survey (NHANES) is one of the series of health-related programs conducted by the National Center for Health Statistics (NCHS) which provides information on the health and nutritional status of the noninstitutionalized civilian resident population of the United States.16 NHANES data are released on two-year cycles starting in 1999, and the survey covers a wide range of people, including the population of all 50 states and the District of Columbia.17 Data from the NHANES program were collected mainly through questionnaires and health examinations, and quality control was conducted by trained interviewers and mobile examination centers.
In the study, we analyzed NHANES data from 2005 to 2016. Missing data on the Mental Health-Depression Screener and body measures were eliminated. After excluding these samples, 13,975 adults from the NHANES database were included in the subsequent analysis.
Body Measures
Body measurements were performed at a mobile physical examination center, and were measured and recorded by a health technologist. The height, weight and waist circumference of subjects were measured according to current anthropometric standards.18 Body measurements were performed at a mobile physical examination center and were measured and recorded by health technologists.
Weight measurement: Participants will be weighed in kilograms using a digital weight scale. Participants should wear the standard MEC examination gown, which consists of a disposable shirt, pants, and slippers. Survey participants (SPs) should wear only underpants beneath the gown.19
Height measurement: The SPs’ height will be measured by professional guidance and assistance. Specifically, the mobile physical examination center is equipped with special height measuring instruments. Before use, patients will be required to remove head ornaments and braids and other things that may affect the measurement results. Patients will be instructed to put their feet flat so that their weight is evenly distributed, their back against to the backboard and their head is kept level, so as to complete the measurement.19
Waist measurement: The SPs were instructed to cross his arms with his hands, and the circumference of the midpoint line between the lowest point of the rib and the two horizontal lines of the iliac crest was measured with a soft ruler. Take the measurement to the nearest 0.1 cm at the end of the SP’s normal expiration. The result was recorded.19
More detailed information about body measurements can be found on the official NHANES project website (https://wwwn.cdc.gov/nchs/nhanes/ContinuousNhanes/Default.aspx?BeginYear=2015).
After obtaining the height and weight data, the formula was used to complete the calculation of BMI value. According to WHO guidelines (WHO, 2008), BMI is used to determine the prevalence of underweight, overweight and obesity. The subjects with BMI less than 18.50 kg/m2 were underweight, those with normal weight were 18.50 to 24.99 kg/m2, those with BMI between 25 and 29.99 kg/m2 were overweight, subjects with BMI ≥ 30 kg/m2 were obese patients.20
The waist-to-height ratio has been proposed many years ago. At the 26th European Conference on obesity (ECO) in 2019, index values below 0.40 are considered too low, the normal range is 0.40–0.49, the rising range is 0.50–0.59, and values equal to or higher than 0.60 are considered to be very high. Abdominal obesity was defined as WHtR ≥ 0.50.21
Assessment of Depressive Symptoms
Each participant completed a questionnaire to assess depression which was based on the Patient Health Questionnaire (PHQ). The PHQ is an instrument for making criteria-based diagnosed of depressive as a self-administered version of the PRIME-MD, which scores each of the 9 DSM-IV criteria as “0” (not at all) to “3” (nearly every day). Calculate the response option scores and add them to get the total score between 0 (Asymptomatic) and 27 (Symptom appears almost every day).22
The PHQ-9 scores of 5,10,15, and 20 represented mild, moderate, moderately severe, and severe depression, respectively. Depression was defined as PHQ score ≥5.23
Covariates
In order to make the results convincing, each variable has been classified: age (categorized into 20–44, 45-64, ≥65), sex (female, male), race (Non-Hispanic White, Non-Hispanic Black, Mexican American, Asian and other), family poverty-to-income ratio (≤100%, >100%), education levels (<11th grade, high school graduate, some college or AA degree or college graduate or above), marital status (married, windowed, or never married), smoking (yes, no), drinking alcohol (yes, no).
Ethics Statement
Information from NHANES is made available through an extensive series of publications and articles in scientific and technical journals. For data users and researchers throughout the world, survey data are freely available on the internet and on easy-to-use CD-ROMs. Informed consent was not required as personal identifying information was not included. The present study was approved by the institutional research committee of The First Affiliated Hospital of Xi'an Jiaotong University.
Statistical Analysis
Statistical analysis was performed using Stata15.1. Data were presented as a means-standard deviation for continuous variables and as proportions (or percentage) for categorical variables. The descriptive statistical analysis was used to describe the qualified sample participants, the mean and standard deviation were used to describe the measurement data, and the ratio, composition ratio and ratio (or) of the counting data were used. The comparison between groups was performed by t-test and χ2 test, respectively. Multivariate logistic regression model was used to explore the independent relationship between obesity and depression, and to adjust for potential confounding factors. BMI and WHtR were used as independent variables for logistic regression analysis of depression. In order to analyze the trend of ORs for BMI and WHtR, BMI and WHtR were analyzed as quartiles in logistic regression analysis. Quartiles analysis help to discover the trend of joint variation for ORs and weight-related indicators in different quartiles.
RCS was used to detect the dose–response relationship between BMI, WHtR and depression. The 25th, 50th and 75th percentile of BMI and WHtR distribution were used as fixed knots. The RCS models were adjusted for age, sex, race, education level, marital status, family PIR, smoking status, drinking-alcohol status. We used the RCS model to study the non-linear relationship between variables. The likelihood ratio test was used to test the two models: one model only included linear effects, the second model also included the cubic spline function. The double tail probability value p≤ 0.05 was considered to be statistically significant.
Results
Baseline Characteristics
Table 1 shows the demographic and clinical baseline characteristics of all participants and summarizes the distribution of all the key variables considered in this study among the individuals studied.
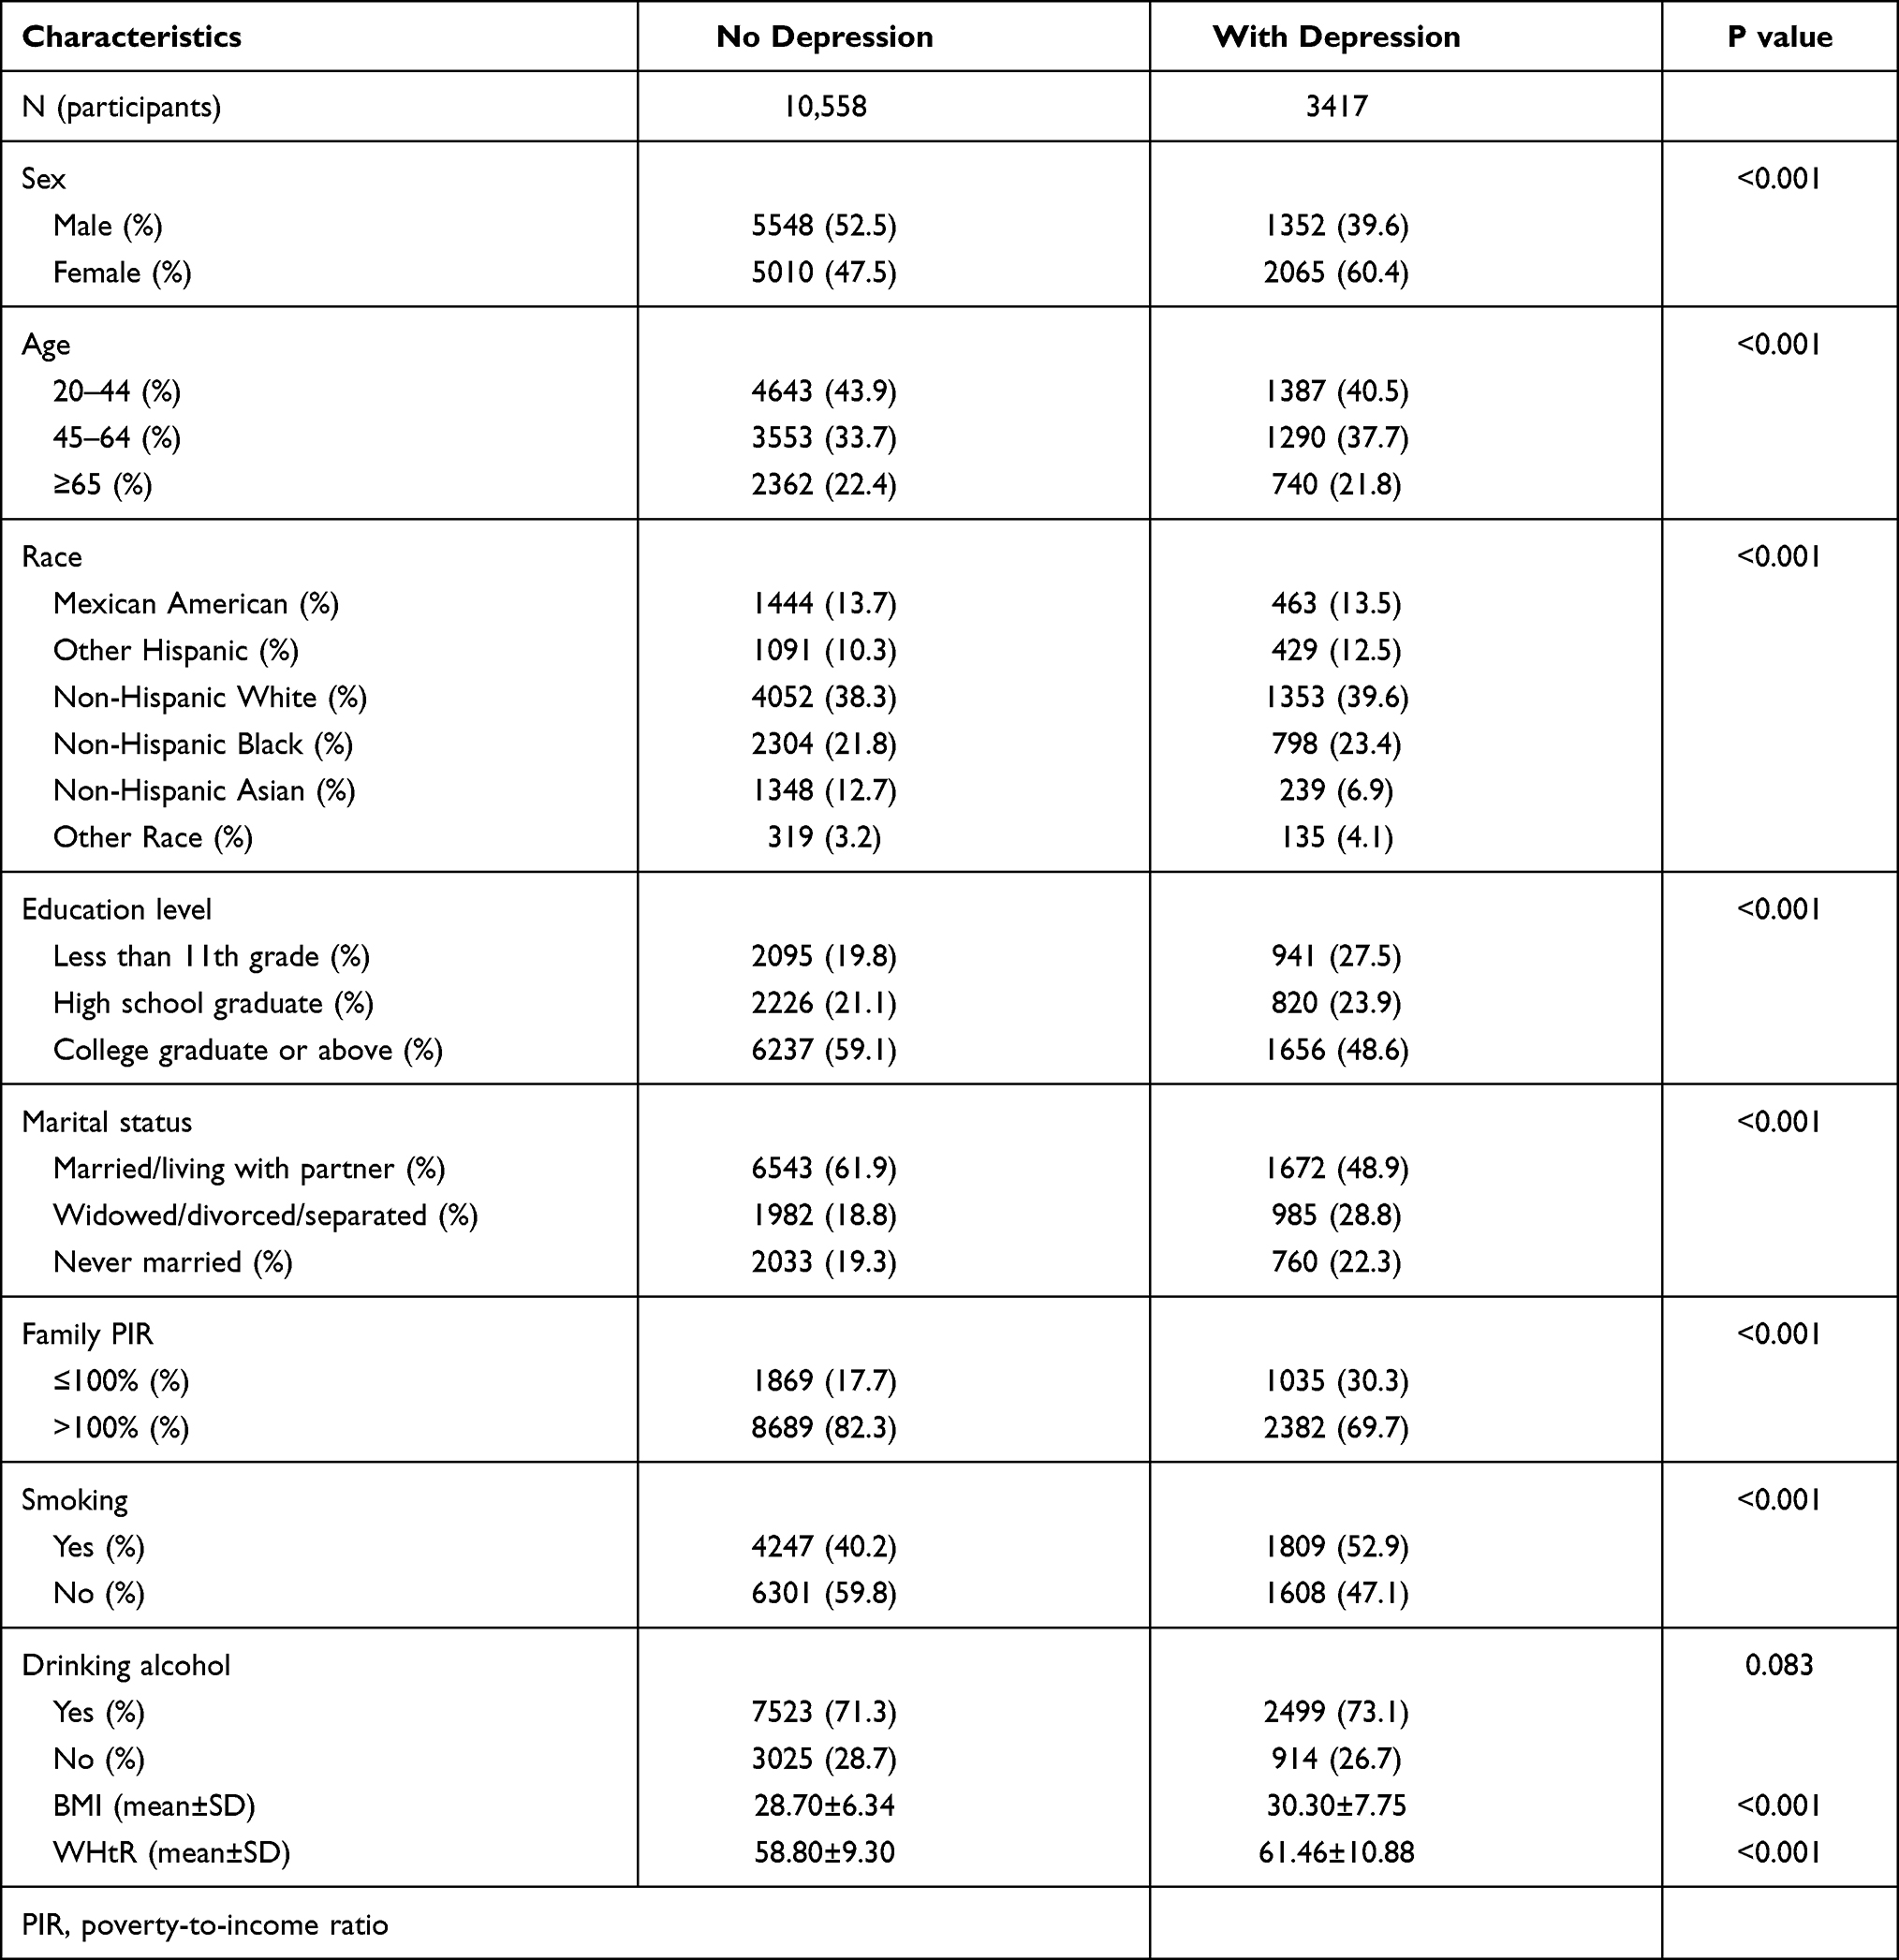 |
Table 1 Baseline Characteristics |
The incidence of depression was significantly correlated with the following covariates: gender (male, female), age (categorized into 20–44, 45–64, ≥65), race (P < 0.001), educational level (P < 0.001), marital status (P < 0.001), smoking status (P < 0.001), drinking alcohol (P<0.001).
Logistic Regression Analyses
Table 2 shows the univariate and multivariate logistic regression analyses of the relationship between BMI, WHtR and depression. The fourth quartile (Q4) of independent variable was used as the reference group.
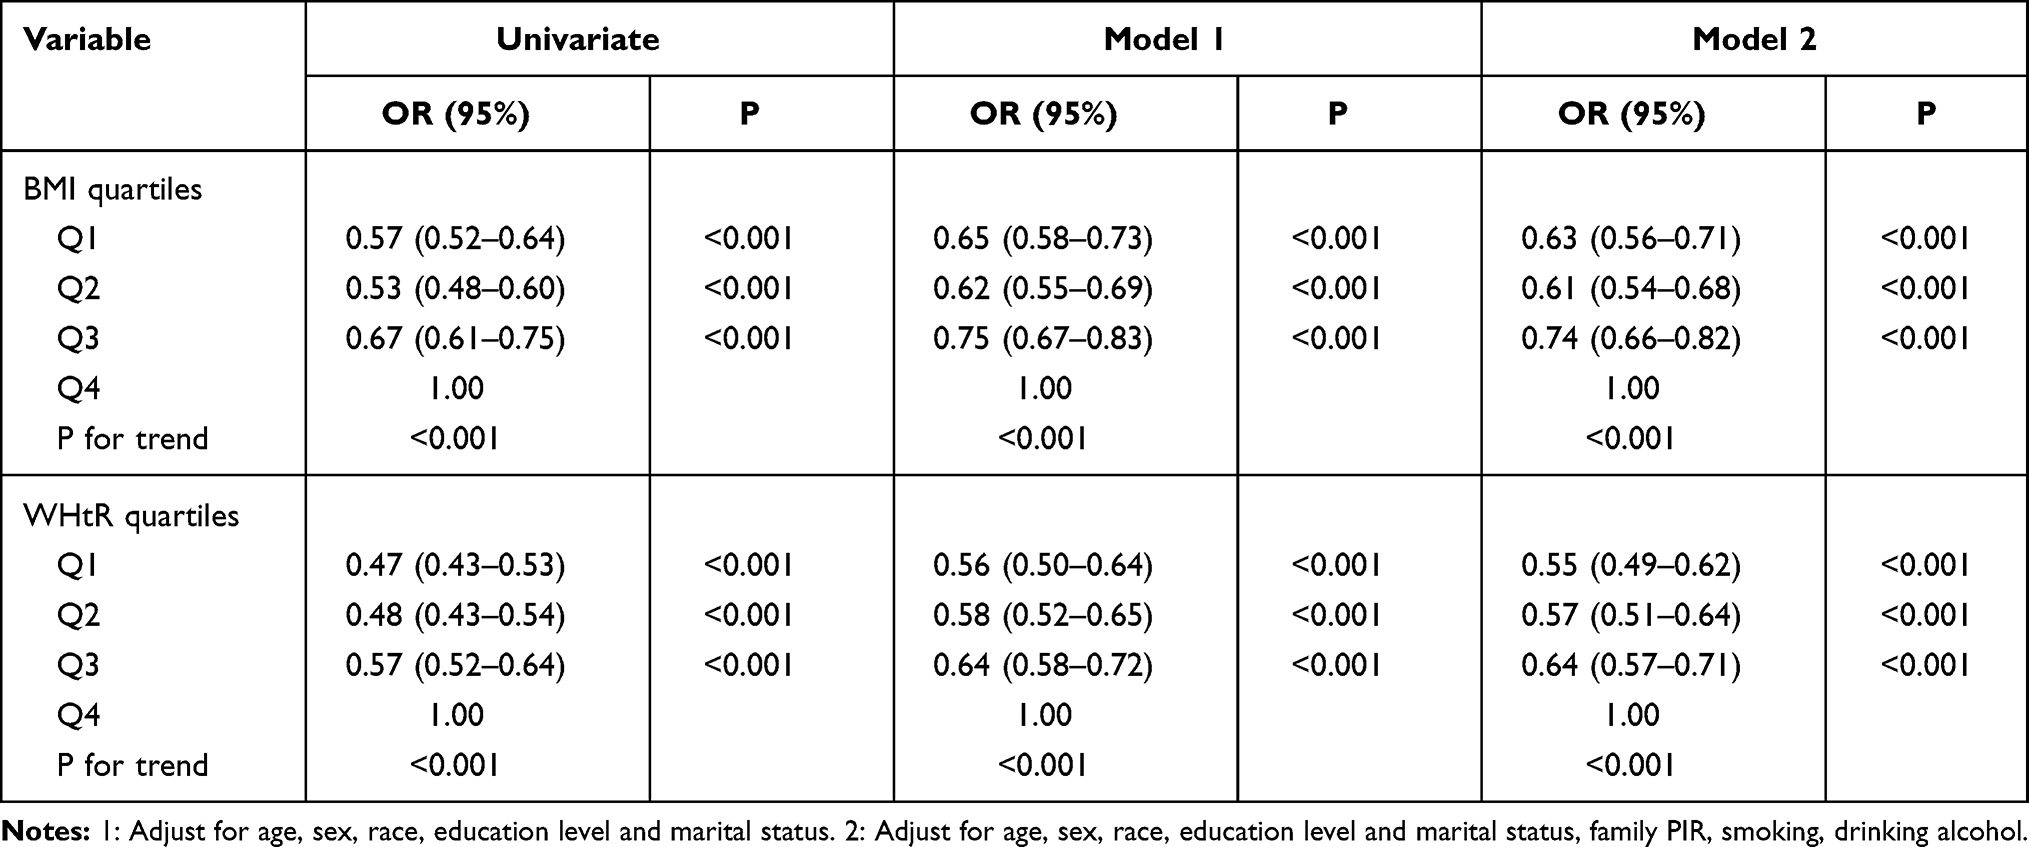 |
Table 2 Logistic Regression Analyses of the Relationship Between BMI, WHtR and Depression (Classified by Quartiles) |
The univariate group showed that compared with the Q4 of BMI and WHtR, the ORs of depression for Q1 Q2 and Q3 of BMI were 0.57 (0.52–0.64), 0.53 (0.48–0.60) 0.67 (0.61–0.75), for Q1, Q2 and Q3 of WHtR were 0.47 (0.43–0.53), 0.48 (0.43–0.54) 0.57 (0.52–0.64).
Model 1 group was adjusted for confounding factors such as age, gender, race, education, education, marriage, and poverty ratio, the results were similar to those in the univariate group, compared with the Q4 of BMI and WHtR, the ORs of depression for Q1 Q2 and Q3 of BMI were 0.65 (0.58–0.73), 0.62 (0.55–0.69), 0.75 (0.67–0.83), for Q1, Q2 and Q3 of WHtR were 0.56 (0.50–0.64), 0.58 (0.52–0.65), 0.64 (0.58–0.72).
Model 2 group was based on the model 1 group, covariates of drinking and smoking were added. After adjusting for confounding factors such as age, gender, race, education, education, marriage, poverty ratio, smoking and drinking alcohol, the trend for OR value in quartile still existed. The ORs of depression for Q1 Q2 and Q3 of BMI were 0.63 (0.56–0.71), 0.61 (0.54–0.68) 0.74 (0.66–0.82), for Q1, Q2 and Q3 of WHtR were 0.55 (0.49–0.62), 0.57 (0.51–0.64) 0.64 (0.57–0.71).
Table 3 also shows the univariate and multivariate logistic regression analyses. BMI and WHtR were classified according to standard guidelines. Based on BMI classification, underweight and obesity groups showed a higher depression risk in all the three models. The ORs of depression for underweight and obesity of BMI were 1.96 (1.45–2.63) and 1.67 (1.51–1.84) in the univariate model, 1.85 (1.36–2.49) and 1.52 (1.37–1.68) in model 1, 1.79 (1.30–2.46) and 1.55 (1.39–1.73) in model 2.
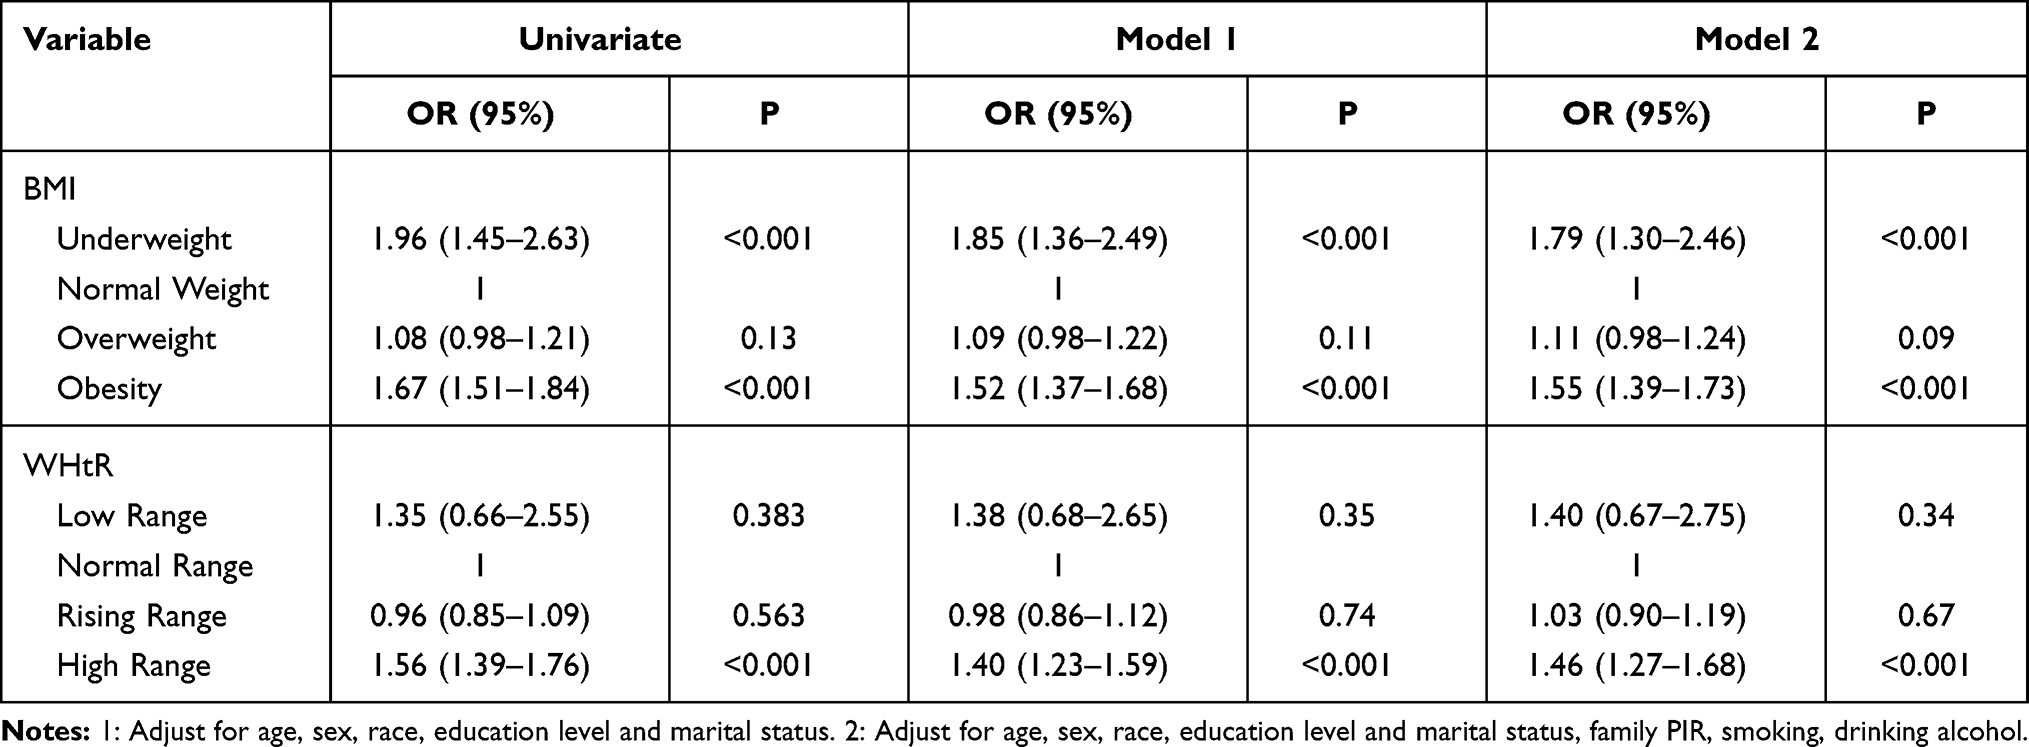 |
Table 3 Logistic Regression Analyses of the Relationship Between BMI, WHtR and Depression (Classified by Standard Guideline) |
WHtR classification showed that high range groups were exposed to a higher depression risk in all the three models. The ORs of depression for the high range of WHtR were 1.56 (1.39–1.76) in the univariate model, 1.40 (1.23–1.59) in model 1, and 1.46 (1.27–1.68) in model 2.
Table 4 shows all the co-variables in this study. People who are female, middle-aged (45–64), Hispanic and Non-Hispanic White, education of less than 11th grade, unmarried status (Widowed/divorced/separated/Never married), Family PIR less than 100%, smoking and drinking alcohol showed a higher depression level.
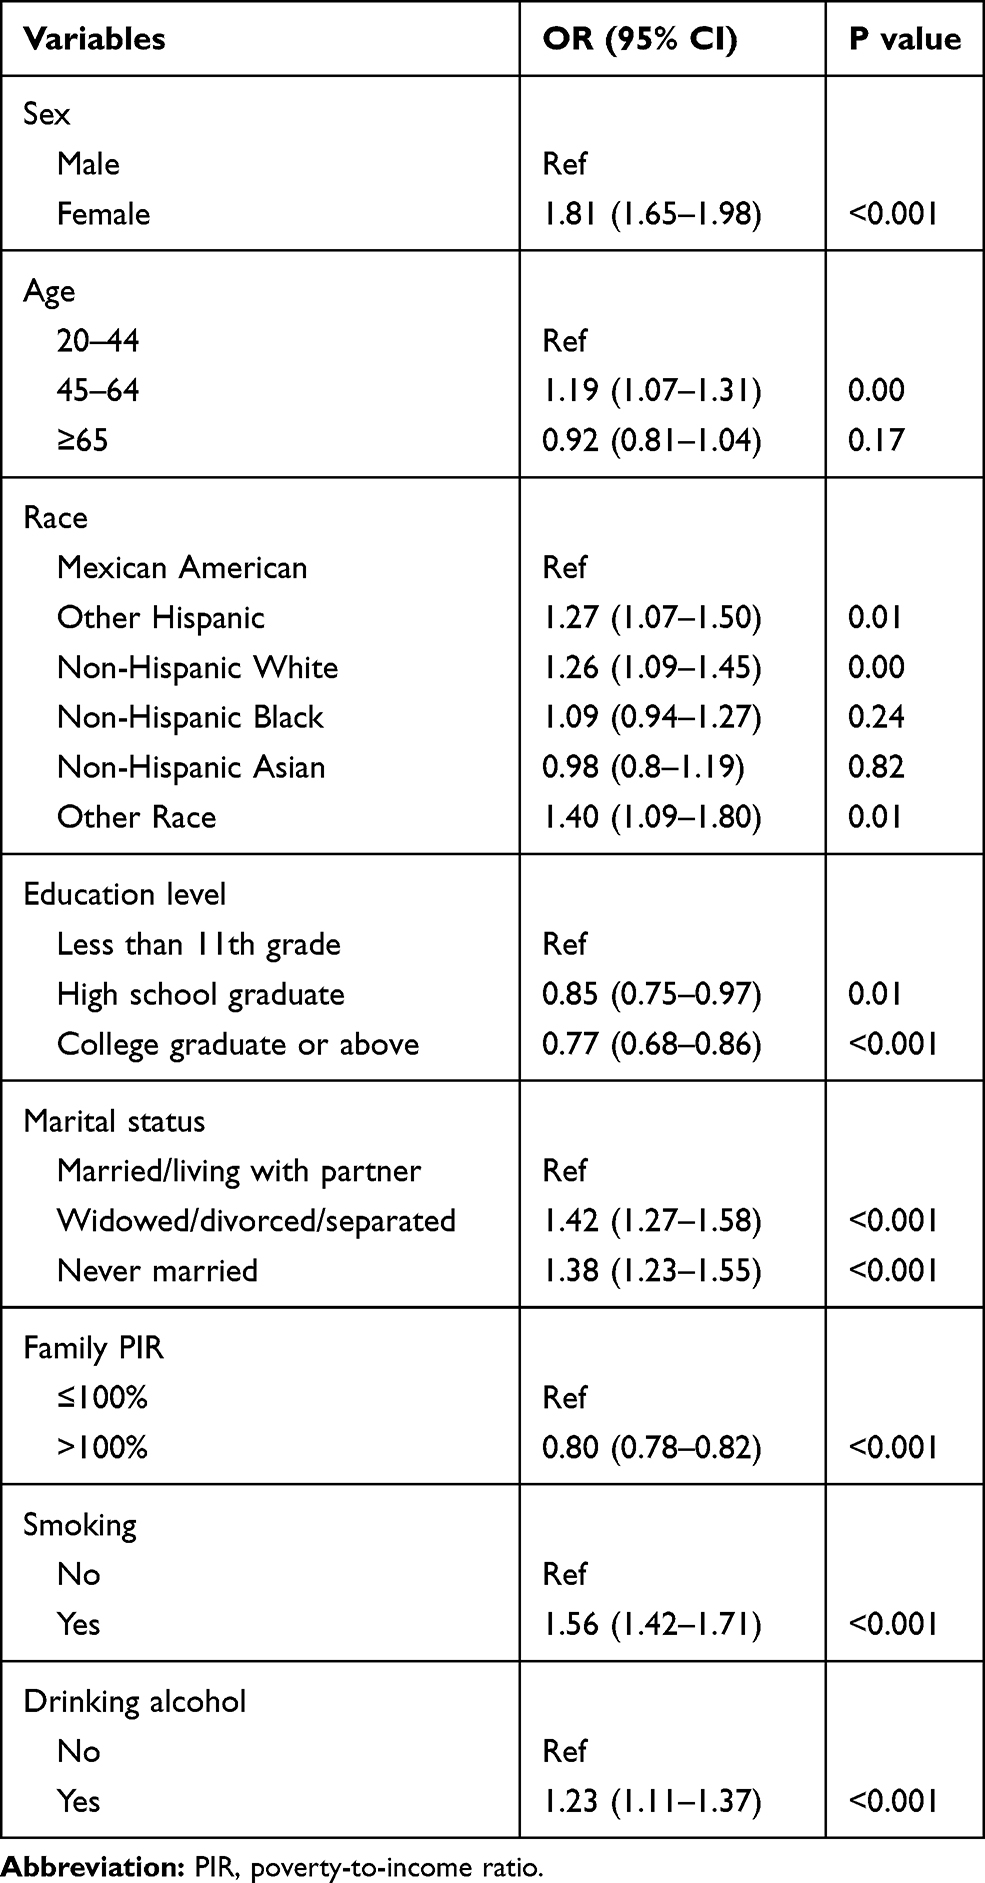 |
Table 4 Logistic Regression Analyses of the Relationship Between Co-Variables and Depression |
Dose-Response Analysis
The relationship between weight-related indicators and depression was analyzed by using the restricted cubic spline method combined with spline function and logistic regression. The number of nodes was more important than the location. The number of nodes was generally 3–7.24 Some studies showed that 4 nodes could make a lot of data fully fit.25 According to the spline regression coefficient and AIC value, it is found that the AIC of four-node model were 1.091 for WHtR and 1.097 for BMI, that is, the model with four nodes is the best.
Figures 1 and 2 were the RCS model, which showed the nonlinear inverse dose–response relationship between BMI, WHtR and the risk of depression after adjusting for confounding factors of age, gender, race, education, marriage, drinking alcohol, smoking, and poverty ratio. Both trends are statistically significant (P<0.001.) These two figures illustrated an obvious U-shaped relationship: When BMI was approximately 25 kg/m2 (OR=0.68, 95% Cl=0.56–0.83), the OR for depression was the lowest. Both increasing and decreasing the BMI increased the risk of depression. Figure 2 also depicts an obvious U-shaped relationship: the value of 0.52 for WHtR indicated the lowest risk for depression (OR=0.69, 95% Cl=0.54–0.88). Distant from 0.52 of WHtR increased the risk of depression.
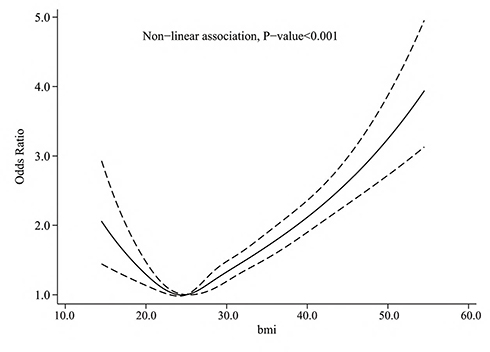 |
Figure 1 Dose–response relationship between BMI and depression. |
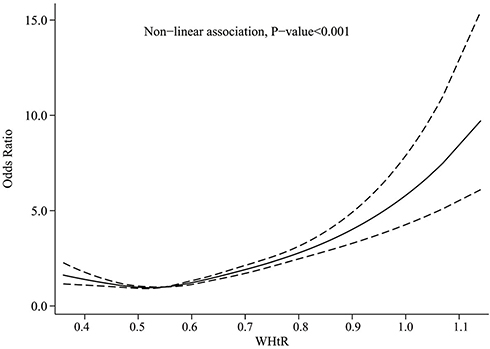 |
Figure 2 Dose–response relationship between WHtR and depression. |
However, according to the international BMI, WHtR standard, these participants were obese.26 This means that participants who are slightly higher than the obesity standard will have the lowest depression risk.
Subgroup Analysis
In Figures 3 and 4, the RCS regression analysis was performed by grouping the genders. The U-shaped relationship was still significant. In male subgroups, when the BMI reached 25 kg/m2 or WHtR reached 0.51, the OR value was reduced to the lowest. While in female subgroups, the OR value was lowest at the BMI reached 24 kg/m2 or WHtR reached 0.52. Both trends are statistically meaningful (P<0.01). There was no significant difference between different gender subgroups.
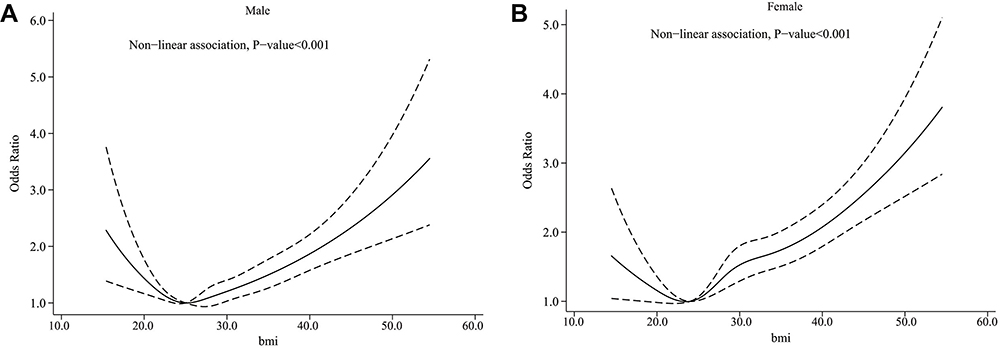 |
Figure 3 Dose–response relationship between BMI (A) and depression group by gender (male (A), female (B)). |
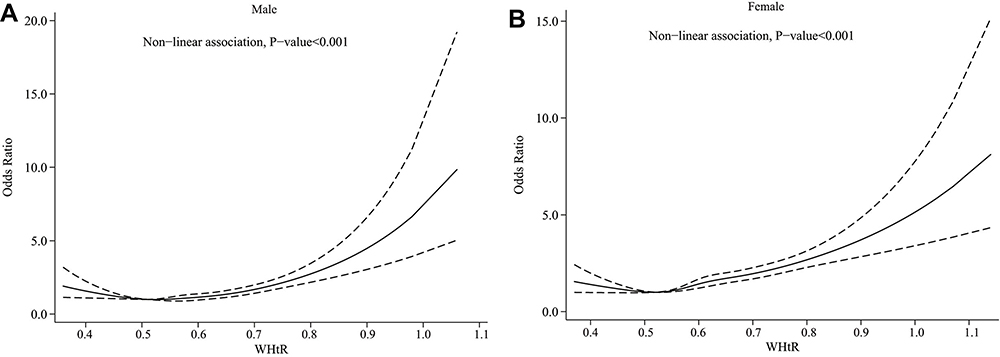 |
Figure 4 Dose–response relationship between WHtR and depression group by gender (male (A), female (B)). |
Discussion
The purpose of this study was to investigate the relationship between weight-related indicators and depression by BMI and WHtR. Our study observed that weight loss and obesity were significantly related to depression, and there was a U-shaped relationship between them.
Depression is a mental disease caused by many factors. Endocrine disorder, inflammatory response, oxidative stress, and neurotransmitter disorder all participate in the occurrence of depression.27,28 Some studies also suggested that depression and obesity have an interaction relationship with each other.29 This is possibly related to the plasma monocyte chemoattractant protein-1 (MCP-1). The MCP-1 level in patients with depression was significantly decreased,30 while some studies observed that the MCP-1 level in people with low body weight is significantly lower than the normal body weight group.31
So far, many articles have reached similar conclusions of the relationship between BMI and depression.32,33 In addition, other studies also described the U-shaped association between obesity and depression (both underweight and obesity are associated with high levels of depression).34–36 Brewis conducted a cross-sectional study to analyze the relationship between BMI categories and depression. 9 Item Patient Health Questionnaire (PHQ-9) was also used and the result showed that both higher and lower weight had a significantly higher risk of depression for women.13 In a cross-sectional study conducted for a cohort of 159,390 Korean based on Kangbuk Samsung Health Study (KSHS), participants were divided into groups by BMI, and the value of risk was calculated, respectively. By comparing the OR values of each group, the conclusion of U-shaped relationship was obtained.34
Unlike other studies present above, our study combined BMI with WHtR to analyze the relationship between body shape and depression. Body mass index (BMI) together with waist–height ratio (WHtR) is better than the single index in identifying overweight and obese people. BMI reflects the total body fat content, which is not easy to distinguish between muscle and fat. It is easy to be affected by longitude, latitude, annual average temperature, age, blood pressure, age and gender when used alone.37 In addition, BMI and WHtR were used as continuous variables to explore the relationship between obesity and depression using logistic regression and RCS models. Our study not only found an obvious nonlinear relationship between obesity and depression but also more accurately determined the BMI and WHtR values of the population with the lowest depression risk. It has guiding significance for preventing depression.
It is also notable that the risk rate of depression increased faster for the female subgroup with their weight growth. This gender difference is partly because social norms of slimness are so tied to femininity which imposed a greater risk of feeling weight-related stigma and depression for women.38 Nevertheless, mildly obese body figure showed a lowest risk for depression both in men and women in our study. This result is inconsistent with the study of Korean female participants,34 which is possibly due to different social niches and socioeconomic status for women in different cultures.
Our data were extracted from the NHANES database in the United States, given a sufficient sample size, we adjusted the influence of race on the obesity index and depression. Therefore, our study may be valid epidemiological evidence to represent a specific pattern of relationship between BMI, WHtR and depression.
However, some studies do not support our results, the conflicts mainly lie in the association between underweight and depression.10,11 Some studies also suggested the gender differences in the relationship between weight and depression.11,13 However, our subgroup analysis could not reach a similar conclusion. This may be due to the small sample size of other studies.
There are some limitations in our research. First, the association between depression and weight-related indicators was cross-sectional, so we are unable to ascertain temporal associations.
Second, PHQ-9 is more suitable for the medical clinical research population than for general epidemic patients,39 which may misestimate the severity of depression. Third, although WHtR is a sensitive index and the combination of BMI is more convincing, it is still controversial whether the single BMI standard is suitable for different age groups.40
Conclusions
We found a significant U-shape correlation between BMI, WHtR and depression. People with slight overweight have the lowest risk of depression. However, according to the International Obesity standards, the population at these levels of weight may have an obesity-chronic disease risk, which is not recommended.
Disclosure
The authors report no conflicts of interest in this work.
References
1. Belzung C, Willner P, Philippot P. Depression: from psychopathology to pathophysiology. Curr Opin Neurobiol. 2015;30:24–30. doi:10.1016/j.conb.2014.08.013
2. Wang J, Wei Q, Yuan X, et al. Local functional connectivity density is closely associated with the response of electroconvulsive therapy in major depressive disorder. J Affect Disord. 2018;225:658–664. doi:10.1016/j.jad.2017.09.001
3. Kessler RC, Berglund P, Demler O, et al. The epidemiology of major depressive disorder: results from the national comorbidity survey replication (NCS-R). JAMA. 2003;289(23):3095–3105. doi:10.1001/jama.289.23.3095
4. Haslam DW, James WP. Obesity. Lancet. 2005;366(9492):1197–1209. doi:10.1016/S0140-6736(05)67483-1
5. Lu Y, Hajifathalian K, Ezzati M, et al. Metabolic mediators of the effects of body-mass index, overweight, and obesity on coronary heart disease and stroke: a pooled analysis of 97 prospective cohorts with 1.8 million participants. Lancet. 2014;383(9921):970–983.
6. Lasserre AM, Glaus J, Vandeleur CL, et al. Depression with atypical features and increase in obesity, body mass index, waist circumference, and fat mass: a prospective, population-based study. JAMA Psychiatry. 2014;71(8):880–888. doi:10.1001/jamapsychiatry.2014.411
7. Xiang X, An R. Obesity and onset of depression among US middle-aged and older adults. J Psychosom Res. 2015;78(3):242–248. doi:10.1016/j.jpsychores.2014.12.008
8. Abou Abbas L, Salameh P, Nasser W, et al. Obesity and symptoms of depression among adults in selected countries of the Middle East: a systematic review and meta-analysis. Clin Obes. 2015;5(1):2–11. doi:10.1111/cob.12082
9. Yusufov M, Dalrymple K, Bernstein MH, et al. Body mass index, depression, and suicidality: the role of self-esteem in bariatric surgery candidates. J Affect Disord. 2017;208:238–247. doi:10.1016/j.jad.2016.10.005
10. Bjerkeset O, Romundstad P, Evans J, Gunnell D. Association of adult body mass index and height with anxiety, depression, and suicide in the general population: the HUNT study. Am J Epidemiol. 2008;167(2):193–202. doi:10.1093/aje/kwm280
11. Yu NW, Chen CY, Liu CY, Chau YL, Chang CM. Association of body mass index and depressive symptoms in a Chinese community population: results from the health promotion knowledge, attitudes, and performance survey in Taiwan. Chang Gung Med J. 2011;34(6):620–627.
12. De Wit LM, Van Straten A, Van Herten M, et al. Depression and body mass index, a U-shaped association. BMC Public Health. 2009;9:14. doi:10.1186/1471-2458-9-14
13. Brewis AA, Han SY, SturtzSreetharan CL. Weight, gender, and depressive Q3 symptoms in South Korea. Am J Hum Biol. 2017;29(4):e22972. doi:10.1002/ajhb.22972
14. Ashwell M, Mayhew L, Richardson J, Rickayzen B. Waist-to-height ratio is more predictive of years of life lost than body mass index. PLoS One. 2014;9(9):e103483. doi:10.1371/journal.pone.0103483
15. Saniye B, Nevin S, Hande Y, et al. Abstracts of the 21th European Congress on Obesity (ECO2014), May 28–31, 2014, Sofia, Bulgaria. Obes Facts. 2014;7 Suppl 1(Suppl 1):1–188. doi:10.1159/000363668
16. Leng XM, Xia J, Zeng XF, Song YQ. Prevalence and associated factors of lupus in the United States: third National Health and Nutritional Examination Survey (NHANES III). Front Med. 2020;7:213. doi:10.3389/fmed.2020.00213
17. Borrud L, Chiappa MM, Burt VL, et al. National Health and Nutrition Examination Survey: national youth fitness survey plan, operations, and analysis, 2012. Vital Health Stat. 2014;Apr(163):1–24.
18. Ogden CL, Carroll MD, Lawman HG, et al. Trends in obesity prevalence among children and adolescents in the United States, 1988–1994 through 2013–2014. JAMA. 2016;315(21):2292–2299. doi:10.1001/jama.2016.6361
19. Centers for Disease Control and Prevention. The NHANES 2017–2018 Anthropometry Procedures Manual. Available from: https://wwwn.cdc.gov/nchs/nhanes/continuousnhanes/manuals.aspx?BeginYear=2017. Accessed April 9, 2021.
20. Nishida C, Ko GT, Kumanyika S. Body fat distribution and noncommunicable diseases in populations: overview of the 2008 WHO Expert Consultation on Waist Circumference and Waist-Hip Ratio. Eur J Clin Nutr. 2010;64(1):2–5. doi:10.1038/ejcn.2009.139.
21. European and International Congress on Obesity, ECO-ICO. Available from: http://ecoico2020.com/. Accessed April 9, 2021.
22. Kroenke K, Spitzer RL, Williams JB. The PHQ-9 validity of a brief depression severity measure. J Gen Intern Med. 2001;16(9):606–613. doi:10.1046/j.1525-1497.2001.016009606.x
23. Gianfredi V, Koster A, Eussen SJPM, et al. The association between cardio-respiratory fitness and incident depression: the Maastricht Study. J Affect Disord. 2021;15(279):484–490. doi:10.1016/j.jad.2020.09.090
24. Jianfeng L, Huan J, Baoyue L, et al. Application of restricted cubic spline in nonlinear regression. Chin J Health Stat. 2010;27(3):229–232.
25. Harrell F. Regression Modelling Strategies: with Applications to Linear Models, Logistic Regression, and Survival Analysis. New York: Springer-Verlag New York Inc. 2010: 20–24.
26. Obesity: preventing and managing the global epidemic. Report of a WHO consultation. World Health Organ Tech Rep Ser. 2000; 894:
27. Enache D, Pariante CM, Mondelli V. Markers of central inflammation in major depressive disorder: a systematic review and meta-analysis of studies examining cerebrospinal fluid, positron emission tomography and post-mortem brain tissue. Brain Behav Immun. 2019;81:24–40. doi:10.1016/j.bbi.2019.06.015
28. Jeffers AJ, Cotter EW, Snipes DJ, et al. BMI and depressive symptoms: the role of media pressures. Eat Behav. 2013;14(4):468–471. doi:10.1016/j.eatbeh.2013.08.007
29. Haynes A, Kersbergen I, Sutin A, et al. Does perceived overweight increase risk of depressive symptoms and suicidality beyond objective weight status? A systematic review and meta-analysis. Clin Psychol Rev. 2019;73:101753. doi:10.1016/j.cpr.2019.101753
30. Lehto SM, Niskanen L, Herzig KH, et al. Serum chemokine levels in major depressive disorder. Psychoneuroendocrinology. 2010;35(2):226–232. doi:10.1016/j.psyneuen.2009.06.007
31. Zuoli S, Jia Z, Jingjing Z, He Y, Yang J. Relationship between plasma monocyte chemoattractant protein-1 level and gender and body mass index in patients with first-episode depression. J Neurosci Mental Health. 2020;20(5).
32. Noh JW, Kwon YD, Park J, Kim J. Body mass index and depressive symptoms in 519 middle aged and older adults. BMC Public Health. 2015;15:310. doi:10.1186/s12889-015-1663-z
33. Tyrrell J, Mulugeta A, Wood AR, et al. Using genetics to understand the causal influence of higher BMI on depression. Int J Epidemiol. 2019;48(3):834–848. doi:10.1093/ije/dyy223
34. Lee JH, Park SK, Ryoo JH, et al. U-shaped relationship between depression and body mass index in the Korean adults. Eur Psychiatry. 2017;45:72–80. doi:10.1016/j.eurpsy.2017.05.025
35. Martin-Rodriguez E, Guillen-Grima F, Aubá E, et al. Relationship between body mass index and depression in women: a 7-year prospective cohort study. APNA Study Eur Psychiatry. 2016;32:55–60. doi:10.1016/j.eurpsy.2015.11.003
36. Carey M, Small H, Yoong SL, et al. Prevalence of comorbid depression and obesity in general practice: a cross-sectional survey. Br J Gen Pract. 2014;64(620):e122–7. doi:10.3399/bjgp14X677482
37. Lianbin Z, Keli Y, Yonglan L, et al. Comparison of BMI between Chinese Han nationality and Japanese and Korean people. J Jishou Univ. 2017;38(4):63–67, 77.
38. Brewis A. Stigma and the perpetuation of obesity. Soc Sci Med. 2014;118:152–158. doi:10.1016/j.socscimed.2014.08.003
39. Smarr KL, Keefer AL. Measures of depression and depressive symptoms: beck Depression Inventory-II (BDI-II), Center for Epidemiologic Studies Depression Scale (CES-D), Geriatric Depression Scale (GDS), Hospital Anxiety and Depression Scale (HADS), and Patient Health Questionnaire-9 (PHQ-9). Arthritis Care Res. 2011;63(Suppl 11):S454–66. doi:10.1002/acr.20556
40. Zhenghua L, Yuting Z, Jiangtao K, Rong C, Xiujuan Z, Yonghong J. The necessity of age stratification in the study of the relationship between lumbar BMD and obesity in women. J Pract Radiol. 2020;036(002):259–262.
 © 2021 The Author(s). This work is published and licensed by Dove Medical Press Limited. The full terms of this license are available at https://www.dovepress.com/terms.php and incorporate the Creative Commons Attribution - Non Commercial (unported, v3.0) License.
By accessing the work you hereby accept the Terms. Non-commercial uses of the work are permitted without any further permission from Dove Medical Press Limited, provided the work is properly attributed. For permission for commercial use of this work, please see paragraphs 4.2 and 5 of our Terms.
© 2021 The Author(s). This work is published and licensed by Dove Medical Press Limited. The full terms of this license are available at https://www.dovepress.com/terms.php and incorporate the Creative Commons Attribution - Non Commercial (unported, v3.0) License.
By accessing the work you hereby accept the Terms. Non-commercial uses of the work are permitted without any further permission from Dove Medical Press Limited, provided the work is properly attributed. For permission for commercial use of this work, please see paragraphs 4.2 and 5 of our Terms.