")
Back to Journals » Drug Design, Development and Therapy » Volume 12
Dose-proportional pharmacokinetic properties of GLA5PR GLARS-NF1 controlled-release pregabalin in healthy Korean volunteers: a randomized, open, single-dose, parallel study
Authors Shin KH, Jeon JY, Jang K, Kim TE, Kim MG
Received 8 March 2018
Accepted for publication 2 August 2018
Published 11 October 2018 Volume 2018:12 Pages 3449—3457
DOI https://doi.org/10.2147/DDDT.S167668
Checked for plagiarism Yes
Review by Single anonymous peer review
Peer reviewer comments 3
Editor who approved publication: Dr Sukesh Voruganti
Kwang-Hee Shin,1 Ji-Young Jeon,2 Kyungho Jang,2 Tae-Eun Kim,3 Min-Gul Kim2,4
1College of Pharmacy, Research Institute of Pharmaceutical Sciences, Kyungpook National University, Daegu, Republic of Korea; 2Center for Clinical Pharmacology and Biomedical Research Institute, Chonbuk National University Hospital, Jeonju, Republic of Korea; 3Department of Clinical Pharmacology, Konkuk University Medical Center, Seoul, Republic of Korea; 4Department of Pharmacology, School of Medicine, Chonbuk National University, Jeonju, Republic of Korea
Purpose: The aim of this study was to evaluate the dose-proportional pharmacokinetic characteristics of pregabalin following the administration of GLA5PR GLARS-NF1 tablets (150, 300, 450, and 600 mg) in the fed state.
Subjects and methods: An open-label, randomized, single-dose, parallel study was conducted in 40 eligible subjects who were randomly assigned to receive a single 150, 300, 450, or 600 mg dose of GLA5PR GLARS-NF1. Serial blood samples were collected before and after dosing for 36 hours, and plasma concentrations were determined using liquid chromatography-tandem mass spectrometry. Safety profiles were evaluated throughout the study (trial registration number: NCT02327000).
Results: Thirty-seven subjects completed the studies. The area under the plasma concentration-time curve up to the last measurable concentration of pregabalin exhibited dose proportionality following administration of GLA5PR GLARS-NF1 tablets from 150 to 600 mg while its maximum plasma concentration showed dose proportionality at a dose range of 150–450 mg. The safety evaluations showed no clinically significant finding after administration of GLA5PR GLARS-NF1 tablets (150, 300, 450, and 600 mg) in the fed state.
Conclusions: The dose-proportional properties of GLA5PR GLARS-NF1 150–450 mg tablets were determined.
Keywords: gamma-aminobutyric acid analog, GABA analog, maximum concentration, safety evaluation, Korean
Introduction
Pregabalin, a gamma-aminobutyric acid (GABA) analog, acts similarly to [3H]-gabapentin by binding to the α2δ protein of voltage-gated calcium channels in the central nervous system.1 It is used as a treatment for neuropathic pain (particularly diabetic neuropathic pain and herpetic neuralgia) and fibromyalgia and as a supplementary treatment for epilepsy (partial seizure).2,3 Lyrica® capsules (Pfizer Pharmaceutical Ltd., Ann Arbor, MI, USA), the first pregabalin preparation, are manufactured as various dosage formulations, from 25 to 300 mg. The recommended doses of pregabalin are different from the indications. For example, 75–150 mg (150–300 mg/day) two times a day or 50–100 mg three times a day (150–300 mg/day) is recommended for postherpetic neuralgia and 300–450 mg/day is recommended for fibromyalgia.4 Pregabalin is recommended as a twice daily dosing regimen, with 75–300 mg recommended for once-daily dosing.1 It is absorbed into the systemic circulation in a dose-dependent manner. The blood concentration of pregabalin has been reported to peak 1 hour after dosing and decrease with an elimination half-life (t1/2) of 4.8–6.3 hours.5 Therefore, pregabalin was developed to be administered three times daily.6 Subsequently, a twice daily formulation was also developed and marketed after testing in clinical trials.7,8
The Geometrically Long Absorption Regulated System (GLARS®) developed by GL Pharm Tech Corporation (Seongnam, Gyeonggi-do, Republic of Korea) is a technology used to produce a unique three-layered, sustained-release tablet. The upper and lower layers contain polymers that rapidly swell and absorb an aqueous medium following contact. The middle layer contains highly hydrophilic excipients that help the medium penetrate the tablet’s interior rapidly. GLARS produces a tablet that the middle layer rapidly absorbs medium to dissolve the ingredients and the upper and lower layers swell to extend drug release.9 The swollen polymer simultaneously collapses the sides of the middle layer to control the release rate of the drug. Conversely, the relatively robust swelling layer reduces the external physical effects, such as those of the intestinal movement, on the drug release rate. The tablet absorbs approximately three to five times its weight in excess medium, which causes the tablet to continue releasing the drug even in the colon, where lack of aqueous medium exists to induce drug release. This technology has paved the way for developing once daily, sustained-release drug formulations with specific characteristics that were previously unachievable.
The GLA5PR GLARS-NF1 150 mg tablet is a GLARS-adapted formulation of pregabalin developed by the GL Pharm Tech Corporation as a once daily regimen. It is a three-layered tablet with an uneven distribution of pregabalin in each layer. The upper and lower layers contain the high viscosity polymer, PEO, which regulates the release rate of pregabalin. In a previous study to compare the pharmacokinetic (PK) properties of GLA5PR GLARS-NF1 tablet and an immediate release (IR) formulation (Lyrica capsule, Pfizer) after multiple dosing under fed conditions in healthy male subjects (ClinicalTrials.gov registry no: NCT01638273), the maximum plasma concentration (Cmax) at the steady state of pregabalin was 27.74% higher following the administration of GLA5PR GLARS-NF1 tablet 150 mg than when the IR formulation (75 mg, twice daily =150 mg/day) was administered, whereas the area under the plasma concentration-time curve (AUC) at the steady state of pregabalin after repeated administration to fed healthy male subjects was bioequivalent between the GLA5PR GLARS-NF1 150 mg tablet and the immediate formulation. Repeated treatment with GLA5PR GLARS-NF1 was determined to be tolerable in healthy subjects compared with the immediate formulation.
This study was performed to evaluate the PK characteristics and the dose proportionality of pregabalin following the administration of GLA5PR GLARS-NF1 tablets (150, 300, 450, and 600 mg) in the fed state for clinical development.
Subjects and methods
Subjects, ethics approval, and consent to participate
Healthy Korean male volunteers aged over 19–45 years were eligible for inclusion in this study if they weighed ≥45 kg and had a body mass index (BMI) of 17.5–30.5 kg/m2. Subjects were excluded from the study if they had any evidence or history of clinically significant diseases or an abnormal laboratory test result of clinical biochemistry, hematology, or urinalysis.
Study subjects were prohibited from consuming caffeinated or alcoholic beverages, smoking, and exercising strenuously from 3 days before study drug administration to the end of the last study period. Subjects were hospitalized from 9 hours before receiving the study drug to 36 hours after dosing. All subjects were fed a standard meal at 7:30 pm within 20 minutes on the day of administration of the investigational drug for each period followed by oral administration of either one tablet each of the test or reference drug according to the randomly assigned sequence at approximately 8:00 pm.
All subjects provided their written informed consent before being screened for the study. The study protocols were reviewed and approved by the Institutional Review Board of Chonbuk National University Hospital (ClinicalTrials.gov registry no: NCT02327000). These studies were conducted at Chonbuk National University Hospital, Center of Clinical Pharmacology, Republic of Korea. The studies were conducted in accordance with the principles stipulated in the Declaration of Helsinki, as amended in 2013 (Fortaleza, Brazil) and the Good Clinical Practice guidelines of the International Council for Harmonization.
Study design and treatment
The study was conducted as a randomized, open-label, single-dose parallel study in 40 healthy male volunteers who were assigned to four treatment groups of 10 subjects each. The investigational products were GLA5PR GLARS-NF1 tablets (150 mg) and GLA5PR GLARS-NF1 tablets (300 mg). Four treatment groups were assigned as follows: treatment 1, single administration of GLA5PR GLARS-NF1 150 mg; treatment 2, single administration of GLA5PR GLARS-NF1 300 mg; treatment 3, single administration of GLA5PR GLARS-NF1 450 mg (150 mg tablet+300 mg tablet); and treatment 4, single administration of GLA5PR GLARS-NF1 600 mg (two 300 mg tablets).
The investigational product was administered orally in the fed state at approximately 8:00 pm according to treatment groups. The consumption of a standard meal began 30 minutes prior to drug administration (approximately 7:30 pm) and finished within 20 minutes. The standard meal contained 2,000 kcal/day, with a caloric content of carbohydrates 255 g/day, protein 95 g/day, and lipids 60 g/day, which served as a general meal to patients in the Chonbuk National University Hospital. Subjects swallowed the investigational product as a whole tablet with 240 mL of water and did not chew the medication prior to swallowing. The oral cavity of each subject was examined by the investigator following dosing to ensure that the investigational product had been administered.
Determination of plasma pregabalin concentration
We used a standard procedure for the sample preparation. Following a single dose of GLA5PR GLARS-NF1, blood samples were collected before dosing (0 hour) and 1, 1.5, 2, 3, 4, 5, 6, 8, 10, 12, 14, 24, and 36 hours after dosing of the drug for the PK analysis.
A validated liquid chromatography-tandem mass spectrometry (LC-MS/MS) method was used to analyze the samples,10 and pregabalin-13C3 was used as the internal standard. Human plasma was pretreated with pregabalin using a protein precipitation method, and the suitability of the linearity and quality control samples of each batch was evaluated. The calibration curve was constructed using a concentration range of 50–20,000 ng/mL in plasma, and the correlation coefficient (r) value was >0.9950. In addition, the accuracy of the low-, medium-, and high-concentration control samples was evaluated to confirm the suitability of the analysis of batch and measurement values. The accuracies ranged between 85% and 115% (85% and 120% for the lower limit of quantification), and the precisions were <15%. The change (%) of the stabilities of the stock and standard solutions between the reference and the test samples were confirmed to be within 10%. The concentration of pregabalin in the sample was obtained by calculating the peak area ratio of the analyte to the peak area of each internal standard material obtained after the LC-MS/MS analysis.
PK analysis
The plasma concentrations of pregabalin at scheduled time points following drug administration were analyzed. The PK parameters for each treatment group were analyzed: Cmax, the time required to reach the Cmax (Tmax), AUC from 0 hour to time t (AUC0–t, where t is the last time point with a measurable concentration), AUC from 0 hour to infinity (AUC0–inf), and t1/2. The AUC0–t was calculated using the linear trapezoidal method. The observed concentrations and times were used to estimate the Cmax and Tmax of pregabalin. The AUC0–inf was calculated as AUC0–t+Ct/λz, where Ct is the last measured concentration, and λz is the elimination rate constant calculated using linear regression of the log-linear portion of the plasma concentration-time curve. The t1/2 was calculated as ln2/λz. All the PK parameters were estimated using the Phoenix® WinNonlin® software (version 6.3, Certara USA Inc., Princeton, NJ, USA).
Tolerability assessment
The tolerability was assessed by the investigator who monitored adverse events (AEs) and vital signs and performed physical examinations, 12-lead electrocardiogram (ECG), and clinical laboratory tests. Full physical examinations were conducted at the screening, and poststudy visit and brief physical examinations were performed on day 1 and day 3 of the study period. ECGs were performed at the screening and poststudy visit. Vital signs were evaluated at screening, day 1 and day 3 of the study period, and the poststudy visit. Systolic and diastolic blood pressures and heart rate were measured in subjects in a sitting position after a 3-minute rest using an automated device. The body temperature was measured using a tympanic thermometer. Blood samples were collected for clinical laboratory assessments of hematology and blood chemistry, and urinalysis was conducted at screening and on day 1 and day 3 of the study period and the poststudy visit.
Statistical analysis
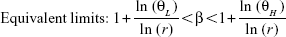
The PK parameters were descriptively analyzed and summarized as the arithmetic mean and standard deviation (SD) or the median and range for the Tmax. The PK parameters and dose-normalized Cmax and AUClast were compared among the groups using a one-way ANOVA. The dose-normalized Cmax and AUClast of the 300, 450, and 600 mg treatment groups were compared with those of the 150 mg treatment group. Geometric least square mean ratios and 90% CIs of the 300, 450, and 600 mg treatment groups compared with those of the 150 mg treatment group were evaluated. The Cmax and AUClast were tested using linear regression analysis, setting the administered dose as the independent variable and primary PK variables (Cmax and AUClast) as dependent variables. Power model [Y=Exp(α) (Dose)^β Exp(ε)] was used in this analysis. ln(Y)=α+β · ln(Dose)+ε, where α represents fixed period effects and random subject effects, β equal to 1 indicates perfect dose proportionality, and ε represents errors.11
Dose proportionality was determined when the (1–α)×100% CI of slope β fell within the equivalent limit.12 The Θ was a prespecified limit; ΘL was 0.8 as the low limit and ΘH was 1.25 as the high limit. The r was 4 as the ratio of the highest to the lowest dose.12
|
The statistical analysis was performed using the SAS® software version 9.4 (SAS Institute Inc., Cary, NC, USA).
Results
Subjects
A total of 40 subjects were enrolled and randomized (10 per treatment group). Two subjects withdrew their consent before administration of the investigational product, and 38 subjects were administered the investigational product. One subject dropped out of the study after completing the scheduled blood sampling. Although the poststudy visit was missed, the subject was included in the PK data set. Finally, 37 subjects completed the study according to the study protocol and, therefore, the PK analysis was performed in 38 subjects. All the subjects were healthy male volunteers with a mean age, height, weight, and BMI of 24.7 years, 173.59 cm, 71.24 kg, and 23.62 kg/m2, respectively (Table 1).
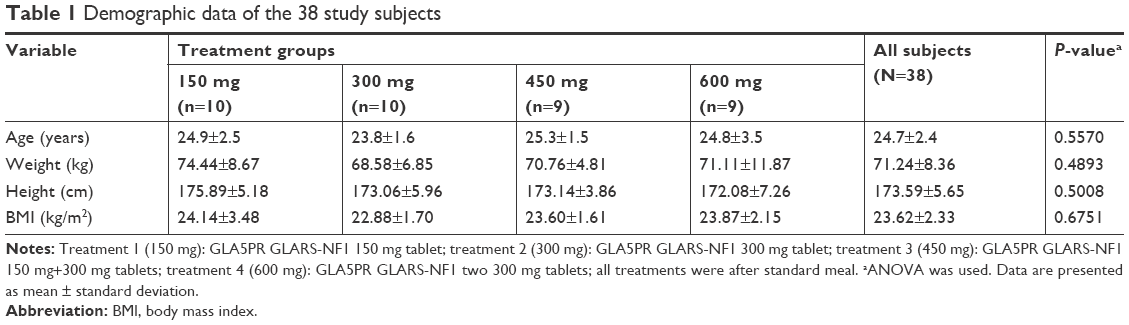 | Table 1 Demographic data of the 38 study subjects |
These demographics were not significantly different among the treatment groups. Histories of smoking cigarettes and consumption of alcohol and caffeine were recorded during the screening interview, and all subjects met the inclusion criteria. There were no statistically significant differences among treatment groups in the cigarette smoking and alcohol consumption history. There was a statistically significant difference among treatment groups in caffeine intake (P=0.0434). However, caffeine intake was assessed at screening and it was prohibited during hospitalization. Moreover, the half-life of caffeine was reported to be approximately 15–45 minutes,13 and no significant interaction between pregabalin and caffeine was reported. Thus, this outcome was not considered to have affected the results of the study.
PK analysis
The plasma pregabalin concentration-time profiles after GLA5PR GLARS-NF1 150, 300, 450, and 600 mg administration are presented in Figure 1. The PK parameters of each treatment are described in Table 2. There were no statistically significant differences between treatment groups in the dose-normalized Cmax (P=0.5962) and AUClast (P=0.9874). The geometric mean ratios and 90% CIs for the dose-corrected Cmax and AUClast are presented in Table 3.
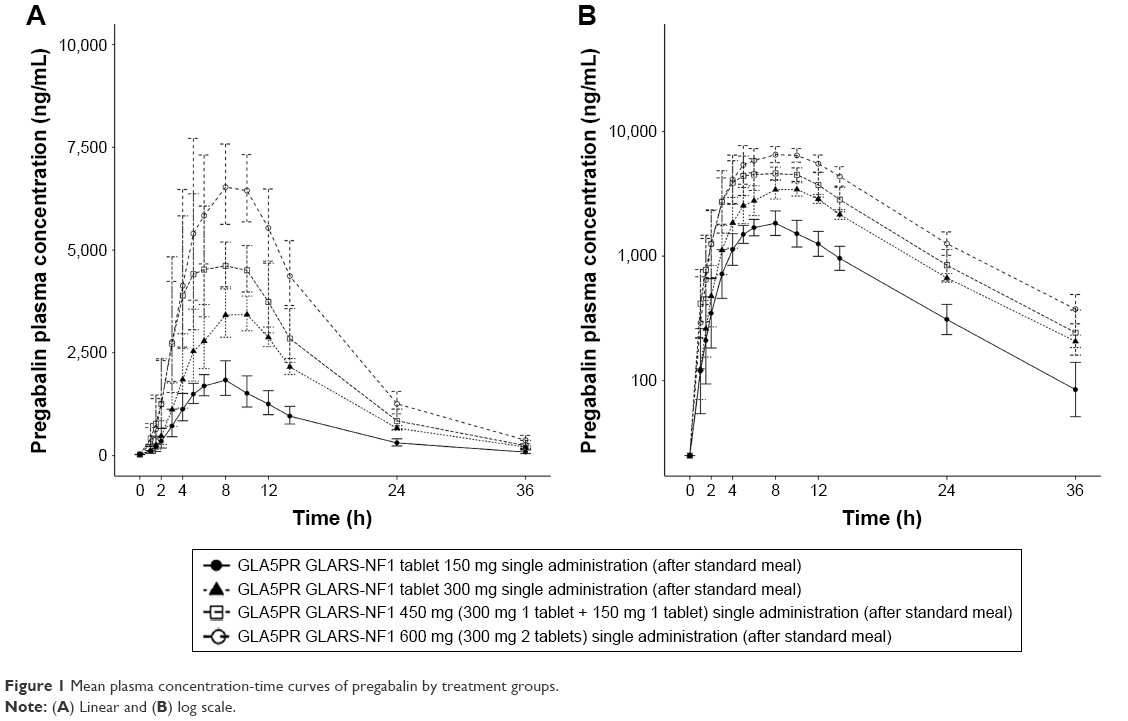 | Figure 1 Mean plasma concentration-time curves of pregabalin by treatment groups. |
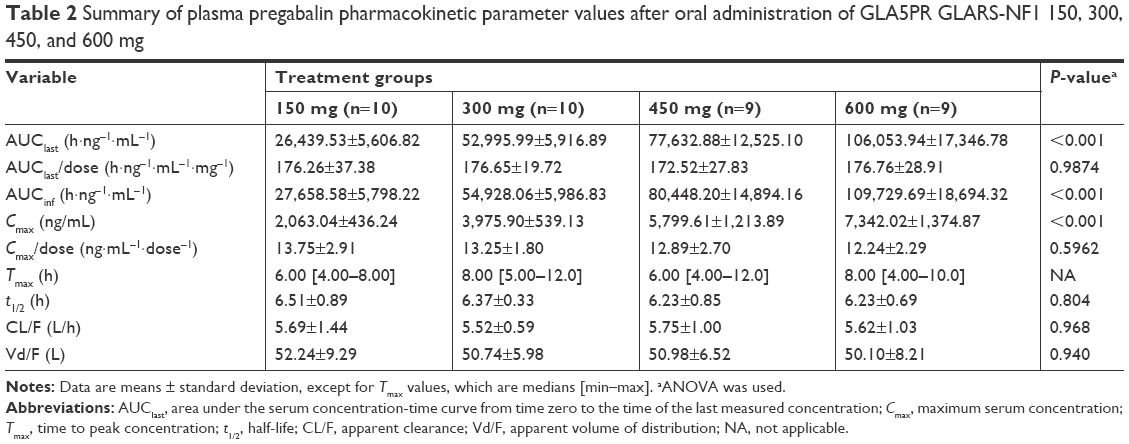 | Table 2 Summary of plasma pregabalin pharmacokinetic parameter values after oral administration of GLA5PR GLARS-NF1 150, 300, 450, and 600 mg |
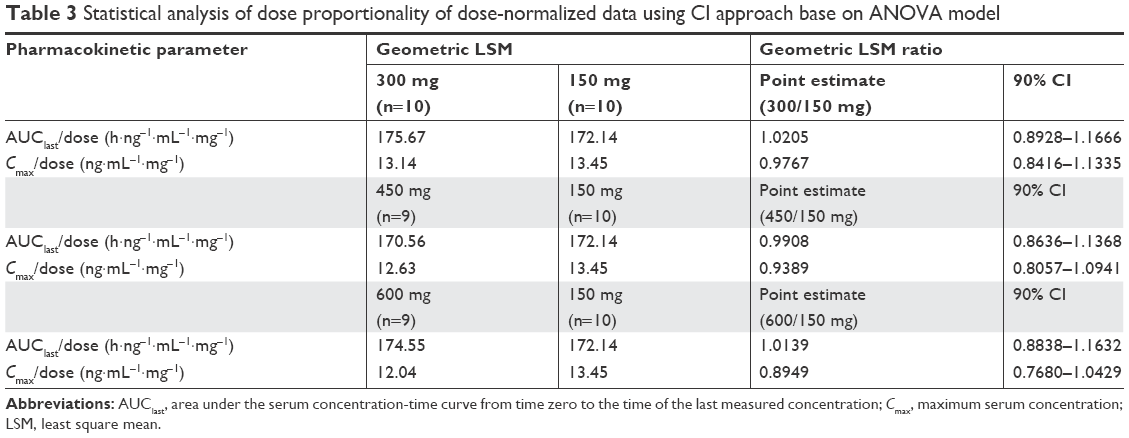 | Table 3 Statistical analysis of dose proportionality of dose-normalized data using CI approach base on ANOVA model |
The comparison between treatments 1 and 2 (GLA5PR GLARS-NF1 150 mg and 300 mg, respectively) revealed that the geometric mean ratios (90% CIs) of Cmax and AUClast were 0.9767 (0.8416–1.1335) and 1.0205 (0.8928–1.1666), respectively. The comparison between treatments 1 and 3 (GLA5PR GLARS-NF1 100 and 450 mg, respectively) showed that the geometric mean ratios (90% CIs) of Cmax and AUClast were 0.9389 (0.8057–1.0941) and 0.9908 (0.8636–1.1368), respectively. The comparison between treatments 1 and 4 (GLA5PR GLARS-NF1 100 and 600 mg, respectively) revealed that the geometric mean ratios (90% CIs) of Cmax and AUClast were 0.8949 (0.7680–1.0429) and 1.0139 (0.8838–1.1632), respectively (Table 3). The median and distribution of Cmax and AUClast data in each treatment were analyzed. Both the Cmax and AUClast of treatment 1 (GLA5PR GLARS-NF1 150 mg) showed relatively wide ranges of individual variability compared with those of the other treatments (Figure 2A and B).
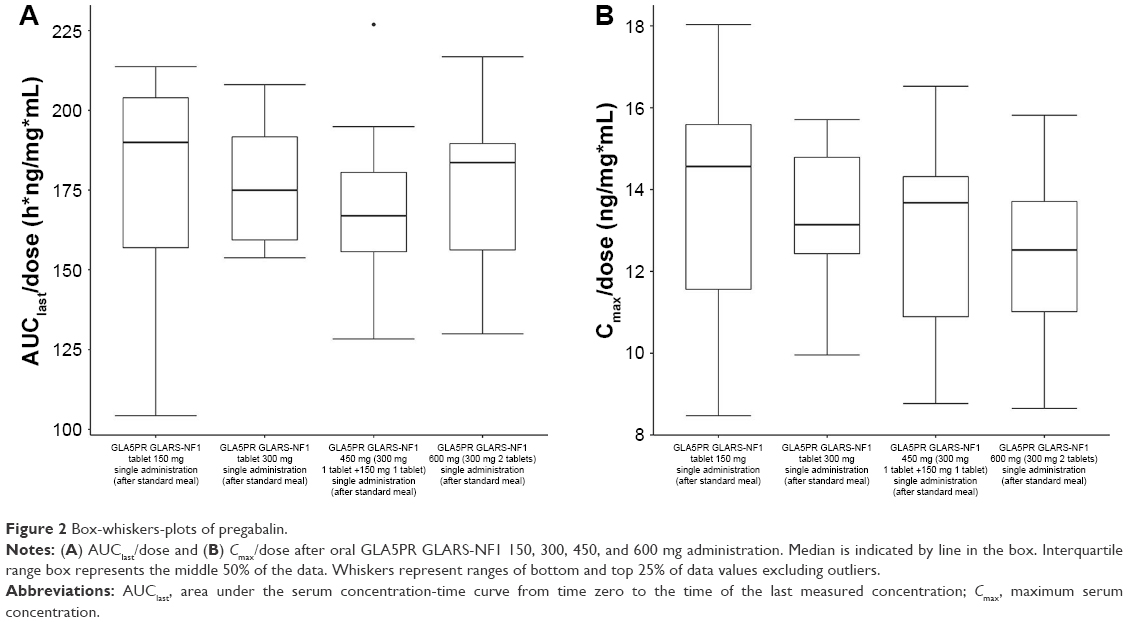 | Figure 2 Box-whiskers-plots of pregabalin. |
In the analysis of dose proportionality using the power model, the 90% CI of Cmax and AUClast was 0.8241–1.0252 and 0.9130–1.0935, respectively. Furthermore, the values of AUClast fell within the equivalent limit of 0.8390–1.1610, which demonstrated dose proportionality, but those of Cmax did not (Table 4). Regressions for log(dose) vs log(Cmax) and logAUC(last) of each individuals by treatment group are presented in Figure 3A and B, respectively.
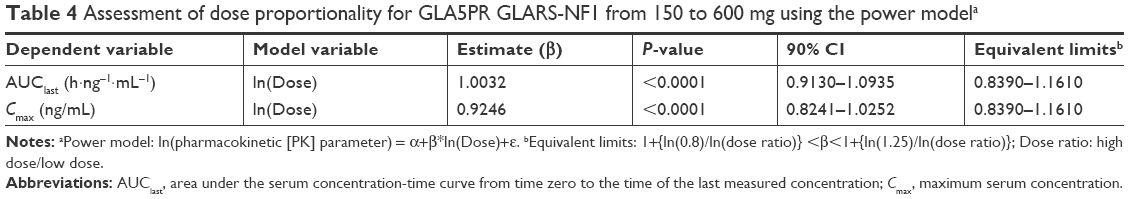 | Table 4 Assessment of dose proportionality for GLA5PR GLARS-NF1 from 150 to 600 mg using the power modela |
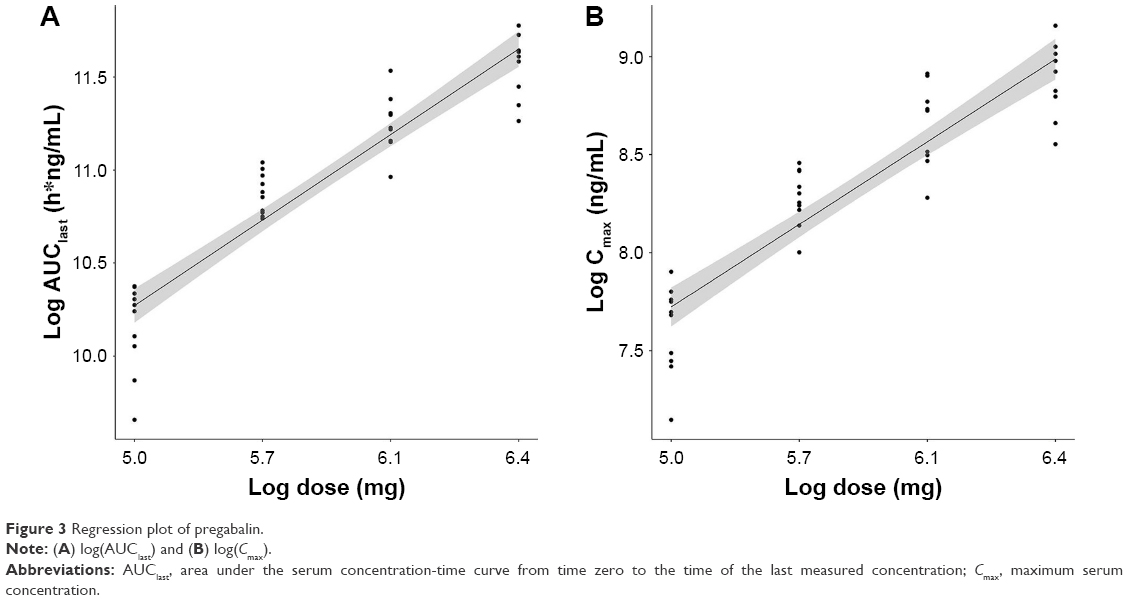 | Figure 3 Regression plot of pregabalin. |
Tolerability
Among the 38 subjects who received the investigational products, 10 experienced 17 AEs (treatment 1, one AE in one subject; treatment 2, three AEs in three subjects; treatment 3: four AEs in two subjects; and treatment 4, nine AEs in four subjects) (Table 5). Six cases of dizziness; two cases of blurred vision, white blood cells in the urine, dysarthria, and headache; and one case of blood bilirubin increase, nausea, and hypertension were reported. Four cases of dizziness, two cases of blurred vision and dysarthria, and one case of nausea were moderate in intensity, and the other eight AEs were mild in intensity.
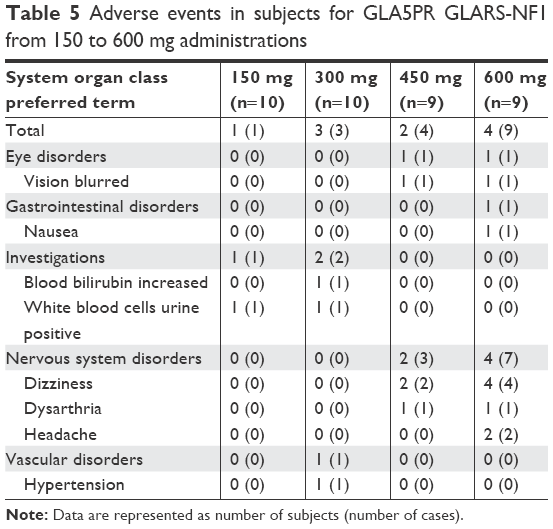 | Table 5 Adverse events in subjects for GLA5PR GLARS-NF1 from 150 to 600 mg administrations |
Six cases of dizziness, two cases of blurred vision, dysarthria and headache, and one case of nausea were considered to be related to the investigational product. Other AEs were not considered to have causal relationships with the investigational products. For all AEs, no action was taken, and subjects recovered without any sequelae. No clinically significant findings were observed in the safety evaluations of the laboratory tests, vital signs, physical examinations, and ECGs.
Discussion
This study aimed to evaluate the PK characteristics of pregabalin following the administration of GLA5PR GLARS-NF1 tablets (150, 300, 450, and 600 mg) in the fed state. GLA5PR GLARS-NF1 exhibited dose linearity in the range of 150–600 mg. In the assessment of dose proportionalities using the power model, the AUClast and Cmax of GLA5PR GLARS-NF1 exhibited dose proportionality in ranges of 150–600 and 150–450 mg, respectively. No clinically significant finding was observed in the safety evaluation after the administration of GLA5PR GLARS-NF1 tablets (150, 300, 450, and 600 mg) in the fed state.
A linear PK indicates that any concentration-time profiles normalized for dose or time are superimposable14 and the linear PK properties facilitate dose regimen adjustments in patients. One of the necessary conditions for a linear PK is dose proportionality, and its assessment is a major PK analysis conducted during clinical development.11 In a previous study, pregabalin showed linear PK properties at a dose range of 150–600 mg and a dose–response relationship was observed at this dose range.15 In the current study, GLA5PR GLARS-NF1, a newly developed controlled release (CR) formulation of pregabalin, showed dose proportionality and linearity at dose ranges of 150–450 mg and 150–600 mg, respectively. Furthermore, the AUClast of the GLA5PR GLARS-NF1 600 mg dose showed satisfactory dose proportionality, and the Cmax slightly deviated from the lower limit value.
The study drug was administered after evening meal according to the label information of the marketed pregabalin, Lyrica. For pregabalin IR formulation (Lyrica), there was no clinically significant effect of food on the PKs of pregabalin, even though the absorption rate of pregabalin was decreased when administered with food, resulting in an approximately 25%–35% decrease in Cmax and an approximately 3-hour increase in Tmax. In the drug label for IR formulation, the time of day of administration is not indicated for the regimen.16 On the contrary, for the pregabalin CR formulation, the AUCinf ratios of the fed states with medium caloric contents (600–750 calories) and low caloric contents (400–500 calories) over the fast states were 142.02% and 129.58%, respectively.17 In the drug label for CR formulation, drug administration is recommended after evening meal.
Because the safety of subjects in the study was a concern, the study drug was administrated in the evening. The most commonly reported AEs for pregabalin were dizziness and sleepiness in healthy subjects.1 Subjects in this study took pregabalin after dinner to reduce these AEs and, thereby, its safety improved. Among the 38 subjects who received the investigational products, 10 (26.3%) experienced a total of 17 AEs (six cases of dizziness; two cases each of blurred vision, white blood cells in the urine, dysarthria, and headache; and one case each of increased blood bilirubin levels, nausea, and hypertension). There were no significant differences in AE incidence between the treatment groups, and no clinically significant findings were observed in the safety evaluations.
The current study had some limitations that are worth mentioning. For instance, the study was conducted with healthy male volunteers using a parallel study design, and patients might show different PK properties from those of healthy subjects because of factors such as disease progression or the administration of concomitant drugs. A crossover study design was adopted in numerous dose-proportional PK studies to reduce the effect of interindividual variability. However, the parallel study designs were also chosen for numerous dose-proportional studies. In a previous report, a total of 34% of approximately 150 clinical studies were performed with a parallel study design.11 On the contrary, gender was one of the major factors affecting the PK and pharmacodynamics of drugs.18,19 However, no clinically significant gender difference was observed in the population PKs of pregabalin.16 Meanwhile, the average age of the study subjects was 25 years. The oral clearance of pregabalin has shown trends to decrease with increasing age, and it was considered to be related to decreased creatinine clearance.16 Further evaluation of dose proportionality in a wide ranges of ages including elderly patients would be helpful for determining the comprehensive PK characteristics of pregabalin.
Conclusion
GLA5PR GLARS-NF1 exhibited dose proportionality in the range of 150–450 mg. Doses ranging from 150 to 600 mg GLA5PR GLARS-NF1 were well-tolerated in the healthy subjects.
Acknowledgments
The plasma pregabalin concentration was analyzed at the Biocore Corporation (Seoul, Republic of Korea). This work was supported by GL Pharm Tech Corporation (Seongnam, Republic of Korea; 201713280000).
Author contributions
All authors contributed toward data analysis, drafting and critically revising the paper, gave final approval of the version to be published, and agree to be accountable for all aspects of the work.
Disclosure
The authors report no conflicts of interest in this work.
References
Finnerup NB, Jensen TS. Clinical use of pregabalin in the management of central neuropathic pain. Neuropsychiatr Dis Treat. 2007;3(6):885–891. | ||
Verma V, Singh N, Singh Jaggi A. Pregabalin in neuropathic pain: evidences and possible mechanisms. Curr Neuropharmacol. 2014;12(1):44–56. | ||
Tassone DM, Boyce E, Guyer J, Nuzum D. Pregabalin: a novel gamma-aminobutyric acid analogue in the treatment of neuropathic pain, partial-onset seizures, and anxiety disorders. Clin Ther. 2007;29(1):26–48. | ||
Product Information. LYRICA Oral Capsules os, Pregabalin Oral Capsules, Oral Solution. Pfizer, Inc. (Per). New York, NY: FDA; 2012. | ||
Bockbrader HN, Wesche D, Miller R, Chapel S, Janiczek N, Burger P. A comparison of the pharmacokinetics and pharmacodynamics of pregabalin and gabapentin. Clin Pharmacokinet. 2010;49(10):661–669. | ||
Cappuzzo KA. Treatment of postherpetic neuralgia: focus on pregabalin. Clin Interv Aging. 2009;4:17–23. | ||
Stacey BR, Swift JN. Pregabalin for neuropathic pain based on recent clinical trials. Curr Pain Headache Rep. 2006;10(3):179–184. | ||
Cramer JA, Glassman M, Rienzi V. The relationship between poor medication compliance and seizures. Epilepsy Behav. 2002;3(4):338–342. | ||
Park JS, Shim JY, Park JS, Choi YW, Jeong SH. A novel three-layered tablet for extended release with various layer formulations and in vitro release profiles. Drug Dev Ind Pharm. 2011;37(6):664–672. | ||
Shah GR, Ghosh C, Thaker BT. Determination of pregabalin in human plasma by electrospray ionisation tandem mass spectroscopy. J Adv Pharm Technol Res. 2010;1(3):354–357. | ||
Sheng Y, He Y, Huang X, Yang J, Wang K, Zheng Q. Systematic evaluation of dose proportionality studies in clinical pharmacokinetics. Curr Drug Metab. 2010;11(6):526–537. | ||
Hummel J, Mckendrick S, Brindley C, French R. Exploratory assessment of dose proportionality: review of current approaches and proposal for a practical criterion. Pharm Stat. 2009;8(1):38–49. | ||
Gilman AG, Rall TW, Nies AS. Goodman and Gilman’s The Pharmacological Basis of Therapeutics. 8th ed. New York, NY: Pergamon Press; 1990. | ||
Ludden TM. Nonlinear pharmacokinetics: clinical Implications. Clin Pharmacokinet. 1991;20(6):429–446. | ||
Ben-Menachem E. Pregabalin pharmacology and its relevance to clinical practice. Epilepsia. 2004;45 (Suppl 6):13–18. | ||
Lyrica® Drug Label updated 05/Mar/2018. FDA Approved Drug Products. Available from: https://www.accessdata.fda.gov/drugsatfda_docs/label/2016/021446s032,022488s011lbl.pdf. Accessed March 10, 2018. | ||
Chew ML, Plotka A, Alvey CW, et al. Pharmacokinetics of pregabalin controlled-release in healthy volunteers: effect of food in five single-dose, randomized, clinical pharmacology studies. Clin Drug Investig. 2014;34(9):617–626. | ||
Soldin OP, Mattison DR. Sex differences in pharmacokinetics and pharmacodynamics. Clin Pharmacokinet. 2009;48(3):143–157. | ||
Bigos KL, Pollock BG, Stankevich BA, Bies RR. Sex differences in the pharmacokinetics and pharmacodynamics of antidepressants: an updated review. Gend Med. 2009;6(4):522–543. |
 © 2018 The Author(s). This work is published and licensed by Dove Medical Press Limited. The full terms of this license are available at https://www.dovepress.com/terms.php and incorporate the Creative Commons Attribution - Non Commercial (unported, v3.0) License.
By accessing the work you hereby accept the Terms. Non-commercial uses of the work are permitted without any further permission from Dove Medical Press Limited, provided the work is properly attributed. For permission for commercial use of this work, please see paragraphs 4.2 and 5 of our Terms.
© 2018 The Author(s). This work is published and licensed by Dove Medical Press Limited. The full terms of this license are available at https://www.dovepress.com/terms.php and incorporate the Creative Commons Attribution - Non Commercial (unported, v3.0) License.
By accessing the work you hereby accept the Terms. Non-commercial uses of the work are permitted without any further permission from Dove Medical Press Limited, provided the work is properly attributed. For permission for commercial use of this work, please see paragraphs 4.2 and 5 of our Terms.