")
Back to Journals » Substance Abuse and Rehabilitation » Volume 8
Does the Assessment of Recovery Capital scale reflect a single or multiple domains?
Authors Arndt S, Sahker E , Hedden S
Received 28 March 2017
Accepted for publication 15 June 2017
Published 19 July 2017 Volume 2017:8 Pages 39—43
DOI https://doi.org/10.2147/SAR.S138148
Checked for plagiarism Yes
Review by Single anonymous peer review
Peer reviewer comments 2
Editor who approved publication: Professor Li-Tzy Wu
Stephan Arndt,1–3 Ethan Sahker,1,4 Suzy Hedden1
1Iowa Consortium for Substance Abuse Research and Evaluation, 2Department of Psychiatry, Carver College of Medicine, 3Department of Biostatistics, College of Public Health, 4Department of Psychological and Quantitative Foundations, Counseling Psychology Program College of Education, University of Iowa, Iowa City, IA, USA
Objective: The goal of this study was to determine whether the 50-item Assessment of Recovery Capital scale represents a single general measure or whether multiple domains might be psychometrically useful for research or clinical applications.
Methods: Data are from a cross-sectional de-identified existing program evaluation information data set with 1,138 clients entering substance use disorder treatment. Principal components and iterated factor analysis were used on the domain scores. Multiple group factor analysis provided a quasi-confirmatory factor analysis.
Results: The solution accounted for 75.24% of the total variance, suggesting that 10 factors provide a reasonably good fit. However, Tucker’s congruence coefficients between the factor structure and defining weights (0.41–0.52) suggested a poor fit to the hypothesized 10-domain structure. Principal components of the 10-domain scores yielded one factor whose eigenvalue was greater than one (5.93), accounting for 75.8% of the common variance. A few domains had perceptible but small unique variance components suggesting that a few of the domains may warrant enrichment.
Conclusion: Our findings suggest that there is one general factor, with a caveat. Using the 10 measures inflates the chance for Type I errors. Using one general measure avoids this issue, is simple to interpret, and could reduce the number of items. However, those seeking to maximally predict later recovery success may need to use the full instrument and all 10 domains.
Keywords: social support, psychometrics, quality of life
Introduction
There is a growing focus on social, environmental, and personal resources aiding in treatment and recovery from substance use disorders (SUDs). Earlier investigations suggest that people with the most recovery resources and the most to lose from relapse are more apt to recover without the aid of treatment.1,2 These authors coined the term “recovery capital” in reference to the individual’s resources supporting initiation and maintenance of recovery. The resources involved in recovery capital include physical and mental health, housing, safety, employment, social or personal relationships, spiritual conversion, and life satisfaction.
A number of studies have separately related many of these individual resource components to recovery. For example, people with 5 years of recovery from cocaine dependence following treatment cite their initial motivation, positive family influences, religion, and spirituality as aiding recovery.3 Laudet et al4 identified quality of life, which includes several domains in recovery capital, as a predictor of remission status after a 2-year period. Aspects of recovery capital were also strongly predictive of quality of life in this population.5 Environmental issues such as neighborhood, disadvantage, drug activity, and violent crime are associated with increased problem use among adolescents.6 Long-term recovery also seems to be predicted by social and personal capital.7,8 For example, perceived neighborhood safety is significantly related to successful outcomes of mothers 10 years after treatment.9 In addition, reports suggest that recovery capital is not static and can increase during recovery.7,10,11
The Assessment of Recovery Capital (ARC) scale is one of the more commonly used summary measures in the substance use recovery literature.12 The ARC consists of 50 statements in 10 domains. Scores are based on the number of checked items. Each domain consists of five items assessing recovery strengths. The domains are Substance Use and Sobriety; Global Psychological Health; Global Physical Health; Citizenship and Community Involvement; Social Support; Meaningful Activities; Housing and Safety; Risk-Taking; Coping and Life Functioning; and Recovery Experience. However, a recent paper combined the 10 domains into two: Social and Personal, although no psychometric justification was provided for two factors.13 Groshkova et al12 demonstrated moderate ARC test–retest reliability and good concurrent validity with the World Health Organization (WHO) quality-of-life measure in a Scottish sample. A principal components analysis indicated only one factor.12 However, the sample size in this assessment was modest to moderate for a factor analysis, with treatment (n = 142) and recovery (n = 176) samples. Only one paper offered internal consistency measures for the 10 domains; however, they were excellent (alpha 0.89–0.96) in a modest sample.13 Presently, research with ARC is inconclusive for the utility of one versus 10 recovery capital domains.
This study attempts to determine whether the ARC represents a single general measure of recovery capital or whether multiple domains might be psychometrically useful for research or clinical applications. Additionally, we sought to replicate the internal consistency measures for the domains and the total score. We used a large sample of clients entering an SUD treatment center to base the estimations.
Methods
Subjects
Clients entering an SUD treatment center between August 2015 and June 2016 in a Midwestern state were part of an agency-based evaluation. Clients completed the ARC12 as part of their clinical assessment at admission. The ARC contains 50 statements, and the clients check applicable items. The ARC data combined with admission information (eg, demographics, substance use history) were de-identified, removing all personal health information variables for this study. The de-identified data set contained 1,138 de-identified client records. Since the records contained no individually identifiable health information, neither HIPPA nor 42 CFR Part 2 apply. Because these data represent de-identified existing program evaluation information and all personal health identifiers were removed, there was no informed consent for this analysis and The University of Iowa Human Subjects Office, Institutional Review Board exempted this study from review.
Statistical analysis
Analyses of items used a matrix of tetrachoric correlations, while domain scores used Pearson correlations. Principal components and iterated factor analyses were used on domain scores as an exploratory approach to answer our primary question of whether the ARC represents a single general measure of recovery capital or whether multiple domains. In addition to usual factor analytic techniques, we used multiple group factor analysis,14–17 a quasi-confirmatory factor analytic method. The multiple group solution requires a prespecified weight or structure matrix used to extract hypothesized factors from the observed correlation matrix. We used an oblique extraction, taking factors as they stand in the observed data. Using Cronbach’s internal consistency measures for each of the 10 domains, we estimated the domain’s true variance, using classical measurement theory.18,19 Finally, a multiple group analysis was done with estimates of true variance on the diagonal. This allowed us to decompose the domain variances into a proportion of the common general factor variance, the true unique variance, and error variance components.
Results
Client demographics
The mean age of the 1,138 clients was 34.1 years (standard deviation [SD] = 12.3) with a median of 32 years. Approximately two-thirds were male (68.3%) and one-third were female (31.7%). Education levels were 46.9% high-school graduates, 26.3% less than high school, and 26.8% some college. The vast majority of clients were White (95.9%) and non-Hispanic/Latino (96.4%). Most clients were either employed (full-time: 35.1%; part-time: 9.5%) or unemployed and looking for work (30.1%), while 25.4% were not in the labor force (eg, retired, student, disabled). Similarly, most clients received income from either wages/salary (41.0%) or family (27.0%). Only 5.9% were receiving SSI/SSDI, and <1% received income from pension, other public assistance, or other sources. The remaining 24.7% indicated no income. Few clients were homeless (2.8%). Many of the clients were from rural counties (39.1%).
Treatment settings represented were 82.8% outpatient and 17.2% residential care. Alcohol was the most often cited primary problem substance (44.4%), followed by methamphetamine (25.3%) and marijuana (23.6%). Opioids (3.5%), heroin (1.5%), cocaine/crack (0.5%), and other substances (1.1%) were relatively infrequent. Over one-third of the clients (38.8%) reported only one problem substance. Marijuana was the most frequently cited secondary substance. Clients reported that they began using their primary problem substance an average of 17.0 years (SD = 12.32) before entering the treatment episode.
ARC item factor analysis
We fit the proposed 10-domain structure on the 50 items using multiple group factor analysis. The 10-column weight matrix contained 1’s for the proposed items within a domain and 0’s elsewhere. The solution accounted for 75.24% of the total variance and resulted in a root mean squared residual (RMR) of 0.038. This suggests that the 10 factors provide a reasonably good fit reconstructing the raw data correlation matrix. However, Tucker’s congruence coefficients between the factor structure and the defining weights ranged from 0.41 to 0.52 with a median of 0.45, suggesting a poor fit to the hypothesized 10-domain structure. The factor structure and pattern matrices, as well as the factor correlations, are given in the supplementary material.
The problem seems to be that while most domains showed very high loadings with their designated items, they also had strong correlations with the vast majority of the other items. For example, the first domain, Substance Use and Sobriety, had loadings between 0.71 and 0.92 with its constituent items; however, they also had an average loading of 0.51 (range: 0.26–0.75) with other domain items. Similarly, the extracted domains were highly intercorrelated. The minimum interfactor correlation was 0.52 with an average of 0.72.
ARC domain principal components
An exploratory principal components of the 10-domain scores yielded only one factor whose eigenvalue was greater than one (eigenvalue = 5.93). The scree plot from this analysis is shown in Figure 1. This first factor accounted for 59.3% of the variance. The next largest eigenvalue was 0.66, well below one. All domain scores loaded heavily on this single factor, all loadings were >0.66. An iterated exploratory analysis provided nearly identical results. The first factor accounted for 75.8% of the common variance.
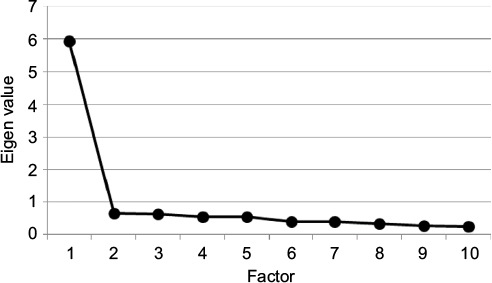 | Figure 1 Scree plot from the principal components analysis of the ARC 10-domain scores (n = 1,138). Abbreviation: ARC, Assessment of Recovery Capital. |
A final exploratory analysis used the domain Cronbach’s alpha coefficients as diagonal entries for the multiple group solution. Confidence intervals (95%) around the individual domain alpha coefficients were all <±0.0265. This solution provided a single factor accounting for 74.9% of the reliable variance (α = 0.92). Percent variance for the true or reliable variance (ie, internal consistency), the variance common to the single factor, domain-specific (unique) variance, and error are shown in Table 1. A few domains had perceptible but small unique variance components. The Recovery Experience domain was the only domain with a notable unique variance (36%). However, Substance Use and Sobriety, Global Physical Health, Citizenship and Community Involvement, and Housing and Safety had small but visible unique components.
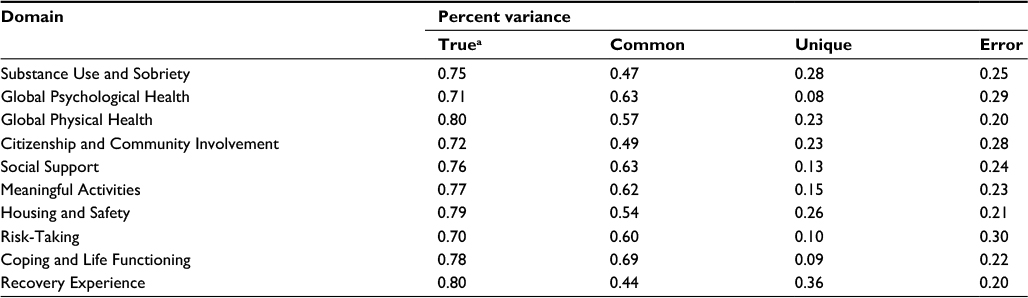 | Table 1 Percent variance for true, common, unique, and error for the ARC domains using a single factor solution (n = 1,138) Note: aTrue variance was estimated using Cronbach’s alpha coefficient. Abbreviation: ARC, Assessment of Recovery Capital. |
Discussion
Our analyses suggest that the ARC instrument is heavily laden with a single general factor. Many of our findings are similar to the previous psychometric study of this measure12 and other reports.13 Our original question was whether the ARC represents a single general measure of recovery capital or whether multiple domains might be psychometrically useful for research or clinical application. Our findings suggest a qualified answer that there is one general factor, which accounted for nearly 75% of the variance. However, there was also evidence supporting enrichment of additional ARC domains, eg, increasing the number of questions or improving the specificity of questions in domains that provide little unique information. A secondary aim was to provide replication for the internal consistency measures within the 10 domains and for the total score. The domains showed good internal consistency (α ranged from 0.71 to 0.80), while the total score showed excellent internal consistency (α = 0.92).
The answer was based on results suggesting that some of the domains may include other information about recovery. For example, the Recovery Experience domain exhibited a sizable unique contribution. This domain includes four statements about networks of people, a sense of purpose, and activities that support recovery. The statements explicitly ask if these statements support the respondent’s “recovery.” Only one other item in the ARC specifically uses the term recovery in the statement. Other notable domains that may measure important unique information include current Substance Use and Sobriety, Physical Health, Community Involvement, and Housing and Safety. We have already noted that environmental factors such as safety affect recovery paths.6,9 Consequently, this unique information may be pertinent, but not in common with the general factor.
In some instances, using all 10-domain scores for research may be problematic. Using the 10 measures inflates the chance for Type I errors. Using one general measure avoids this issue and is simple to interpret. For those seeking a general measure of recovery capital, our results suggest that the full instrument may be unnecessary. Collecting a few domains based on the common variance in Table 1 may be sufficient to provide a shortened version of the ARC that still reliably assesses the general factor with substantially fewer items.
There are limitations to this study. The majority of respondents were White, and the sample was reasonably educated. The mean ARC total score for this sample was slightly higher, 35.27 (SD = 12.05), than the mean score of 31.25 (SD = 11.54) as reported previously.12 Thus, the socio-demographic advantages of this sample may be higher than usual for clients going to SUD treatment and may not reflect minority clients. These ARC scores were taken from clients in a primarily White Midwestern region of the US, so the population might be expected to have higher socioeconomic status (SES) advantages and higher ARC scores than a national sample. While the overall mean ARC score may be slightly higher in this sample, there is no compelling reason that the correlations among the domains might differ from other samples or that these domains might have dramatically differential psychometric properties across races, cultural backgrounds, or sex/gender. For example, many of the factors captured by the ARC also appear to play a role in recovery for an African-American sample.20 While our sample from a specific region may affect the generalizability of results, large differences in the factor structure across regions, races, etc., would be unexpected.
Future directions for research should include investigating race, cultural, age, and sex/gender effects on the ARC. Additionally, these factors may serve as mediators or moderators on ARC domains’ psychometric properties. For example, a general factor may be more potent for some groups than other groups, and specific domains might be more predictive and important for some groups than others. Furthermore, the predictive validity of the ARC, both the general factor and the individual domains, should be investigated across multiple groups of SUD clients. This will further inform whether one factor or more are important for long-term recovery. Another research area would be to look at the changes in ARC domains over time in recovery. Finally, development of a short form of the ARC would be extremely valuable.
Conclusion
Those seeking to find which unique recovery capital information (eg, housing versus physical health) maximally predicts later recovery success will need to use the full instrument and all 10 domains. One word of caution is that the general factor will weaken the individual domain’s ability to predict. For example, at best, one-third to one-quarter of the domain scores’ variance provides unique variance. The remaining variability in these domain scores contains the general factor and error. Thus, sample sizes will need to be suitably large to estimate the unique contributions. Furthermore, it is possible that recovery capital does not function according to an effect indicator model,21 and the domains may not be amenable to standard psychometric assessment methods. Further research on how well the domains function in predicting recovery and treatment success will shed more light on the utility of the 10 domains, particularly in clinical settings. As it stands, this study provides tentative support for one factor for research purposes.
Acknowledgment
The work for this manuscript was funded, in part, by Prairie Ridge Integrated Behavioral Healthcare, Mason City, IA, USA.
Disclosure
The authors report no conflicts of interest in this work.
References
Granfield R, Cloud W. The elephant that no one sees: natural recovery among middle-class addicts. J Drug Issues. 1996;26(1):45–61. | ||
Granfield R, Cloud W. Coming Clean: Overcoming Addiction Without Treatment. New York, NY: NYU Press; 1999. | ||
Flynn PM, Joe GW, Broome KM, Simpson DD, Brown BS. Looking back on cocaine dependence: reasons for recovery. Am J Addict. 2003;12(5):398–411. | ||
Laudet AB, Becker JB, White WL. Don’t wanna go through that madness no more: quality of life satisfaction as predictor of sustained remission from illicit drug misuse. Subst Use Misuse. 2009;44(2):227–252. | ||
Laudet AB, Morgen K, White WL. The role of social supports, spirituality, religiousness, life meaning and affiliation with 12-step fellowships in quality of life satisfaction among individuals in recovery from alcohol and drug problems. Alcohol Treat Q. 2006;24(1–2):33–73. | ||
Reboussin BA, Green KM, Milam AJ, Furr-Holden DM, Johnson RM, Ialongo NS. The role of neighborhood in urban black adolescent marijuana use. Drug Alcohol Depend. 2015;154:69–75. | ||
Moos RH, Moos BS. Sixteen-year changes and stable remission among treated and untreated individuals with alcohol use disorders. Drug Alcohol Depend. 2005;80(3):337–347. | ||
Moos RH, Moos BS. Protective resources and long-term recovery from alcohol use disorders. Drug Alcohol Depend. 2007;86(1):46–54. | ||
Evans E, Li L, Buoncristiani S, Hser Y-I. Perceived neighborhood safety, recovery capital, and successful outcomes among mothers 10 years after substance abuse treatment. Subst Use Misuse. 2014;49(11):1491–1503. | ||
Best D, Gow J, Knox T, Taylor A, Groshkova T, White W. Mapping the recovery stories of drinkers and drug users in Glasgow: quality of life and its associations with measures of recovery capital. Drug Alcohol Rev. 2012;31(3):334–341. | ||
Hibbert LJ, Best DW. Assessing recovery and functioning in former problem drinkers at different stages of their recovery journeys. Drug Alcohol Rev. 2011;30(1):12–20. | ||
Groshkova T, Best D, White W. The assessment of recovery capital: properties and psychometrics of a measure of addiction recovery strengths. Drug Alcohol Rev. 2013;32(2):187–194. | ||
Mawson E, Best D, Beckwith M, Dingle G, Lubman D. Social identity, social networks and recovery capital in emerging adulthood: a pilot study. Subst Abuse Treat Prev Policy. 2015;10(1):1. | ||
Arndt S. Multiple group factor analysis. Am Stat. 1983;37:326. | ||
Gorsuch RL. Factor Analysis. Philadelphia, PA: W. B. Saunders Company; 1974. | ||
Gorsuch RL. Factor Analysis. 2nd ed. New York, NY: Lawrence Erlbaum Associates; 1983. | ||
Soto CM, Arndt S. Análisis factorial confirmatorio de la Escala de Estilos de Crianza de Steinberg: validez preliminar de constructo. [Confirmatory factor analysis of the Steinberg Foster Styles Scale: preliminary construct validity]. Revista de Psicología. 2013;22(2):189–214. Spanish. | ||
Guilford JP. Psychometric Methods. New York, NY: McGraw-Hill; 1954. | ||
Nunnally JC. Psychometric Theory. New York, NY: McGraw-Hill; 1967. | ||
Cheney AM, Booth BM, Borders TF, Curran GM. The role of social capital in African Americans’ attempts to reduce and quit cocaine use. Subst Use Misuse. 2016;51(6):777–787. | ||
Bollen KA, Bauldry S. Three Cs in measurement models: causal indicators, composite indicators, and covariates. Psychol Methods. 2011;16(3):265. |
 © 2017 The Author(s). This work is published and licensed by Dove Medical Press Limited. The full terms of this license are available at https://www.dovepress.com/terms.php and incorporate the Creative Commons Attribution - Non Commercial (unported, v3.0) License.
By accessing the work you hereby accept the Terms. Non-commercial uses of the work are permitted without any further permission from Dove Medical Press Limited, provided the work is properly attributed. For permission for commercial use of this work, please see paragraphs 4.2 and 5 of our Terms.
© 2017 The Author(s). This work is published and licensed by Dove Medical Press Limited. The full terms of this license are available at https://www.dovepress.com/terms.php and incorporate the Creative Commons Attribution - Non Commercial (unported, v3.0) License.
By accessing the work you hereby accept the Terms. Non-commercial uses of the work are permitted without any further permission from Dove Medical Press Limited, provided the work is properly attributed. For permission for commercial use of this work, please see paragraphs 4.2 and 5 of our Terms.